Article

Eliciting Risk Preferences Experimentally versus Using a General Risk Question. Does Financial Literacy Bridge the Gap?

1
Department of Economics and Finance, University of the Free State, Phuthaditjhaba 9866, South Africa
2
Department of Mathematics, University of the Free State, Phuthaditjhaba 9866, South Africa
*
Author to whom correspondence should be addressed.
Risks 2021, 9(8), 140; https://doi.org/10.3390/risks9080140
Submission received: 15 May 2021 / Revised: 5 July 2021 / Accepted: 5 July 2021 / Published: 27 July 2021

Abstract

:
The study investigates the stability of financial risk preference choices elicited from subjects by way of two methods, namely: experimentally elicited incentivized revealed risk preferences (IRRP) and (self-reported) perceived willingness to take a financial risk (PWTFR). The research further examines whether financial literacy (a human capital aspect) helps in reducing the gap between IRRP and PWTFR choices made by subjects. A total of 193 university students (where 53% were female) participated in the study. The subjects completed IRRP choices from four multiple price list (MPL) risk preference tasks and a financial literacy questionnaire. There is a tendency to anchor at extremes of risk-seeking behavior when subjects self-report their PWTFR choices. A paired t-test analysis of the two methods shows that the average responses from the two methods are significantly different. A random effect (RE) panel regression shows that an increase in financial literacy narrows the gap between IRRP and PWTFR choices. The study’s findings show that responses by subjects from a PWTFR general risk question (GRQ) and IRRP experiment are unstable and inconsistent. What people say in a survey does not always translate into what they do when faced with a risk preference choice dilemma. Financial literacy helps individuals to predict their risk attitudes more precisely.

1. Introduction

Risk preferences play a vital role in a wide range of decision-making spheres, including economic, social, and political decisions, among others (Ertac 2020). Economics and psychology in particular use risk preferences to predict human behavior, which can be exhibited through financial decisions and livelihood choices. In essence, risk preferences are a mediating factor of an individual’s risk tolerance behavior. In a bid to understand the risk preferences of individuals, researchers have elicited risk preferences using surveys and experimental approaches (Charness et al. 2013; Jaspersen et al. 2020; Linciano and Soccorso 2012). There is a need to critically evaluate if subjects exhibit consistent risk attitudes in situations where different methods of gathering risk preferences are applied. Some of the methods used by researchers to elicit risk preferences from subjects include incentivized multiple price list (MPL), prospect theory tasks, balloon analogue risk task (BART), single choice of how to apportion between a safe and risk asset, single choice between gambles and non-incentivized questionnaires such as the great risk question (GRQ) (Charness et al. 2013; Jaspersen et al. 2020; Kahneman and Tversky 1979).
The use of a questionnaire (GRQ) to elicit perceived willingness to take a financial risk (PWTFR) can be easily applied to large groups of subjects in surveys since the costs of collecting the data are lower when compared to the use of an incentivized risk preference experiment (Dohmen et al. 2011; Lusardi and Mitchell 2011). When subjects respond to the GRQ, they reflect on their individual risk preference experiences, which may be current or historical risk perceptions. They evaluate themselves usually on a Likert scale, where they rank their risk preferences(Kalra Sahi 2017). Eliciting risk preferences by way of GRQ is subjective as one may reference themselves using their internal standard and may be heavily influenced by psychological biases (Jaspersen et al. 2020). However, if individuals can reveal their subjective wellbeing by providing their true life experience, then the data collected by way of surveys can provide a true representation of one’s risk preference choices.
On the other hand, eliciting risk preferences by way of experiments can involve people being asked to make choices on lotteries with different risk profiles that have a probability of winning a true monetary value. The multiple price list (MPL) method is one of the popular methods that has been used by researchers to experimentally elicit risk preferences (Charness et al. 2013; Andersen et al. 2008). In this method, subjects are asked to make choices on one of two lotteries with different risk levels (see, Holt and Laury 2002). In some MPL experiments, subjects are incentivized by being paid the true value of their choices as a way of encouraging them to exhibit their truthful risk preferences. In the same vein, experimentally elicited risk preferences can be heavily influenced by psychological (cognitive, emotional, etc.) biases. The presence of high- and low-risk lotteries in an experimental task means that subjects may be required to apply their numeracy skills, which may further give rise to cognitive biases. Biases that are inherent within subjects can affect their ability to maximize their utility, resulting in their risk preference choices deviating from rational economic theory predictions. This study does not investigate biases that may arise when subjects make risk preference choices, nor does it examine the superiority of particular risk-preference-eliciting methods. The paper investigates whether subjects made consistent and stable risk preference choices when they provide the risk preference choices experimentally and by way of the GRQ.
Some studies have confirmed a correlation between the GRQ and incentivized risk preferences (Vieider et al. 2015; Koudstaal et al. 2016; Dohmen et al. 2011). On the other hand, some research could not confirm a correlation between GRQ and risk-taking attitudes (Csermely and Rabas 2016; Lönnqvist et al. 2015). Studies have confirmed that risk preferences elicited from individuals can differ depending on the elicitation method applied (Pedroni et al. 2017; Holzmeister and Stefan 2020; He et al. 2016). The results from earlier studies show an unclear relationship between risk preferences elicited by GRQ and experimental approaches, leaving room for further investigations.
Overwhelming evidence suggests that financial literacy assists individuals to achieve better life outcomes (Lusardi and Mitchell 2014; Hastings et al. 2013; Kurowski 2021). Minimum financial capabilities required by individuals to benefit from financial literacy include numeracy, which makes them understand the concept of interest and compounding interest, implications of inflation on investments and incomes as well as comprehending risk diversification (Lusardi 2019). What is also not clear is how financial literacy interacts with risk preferences in the realization of life outcomes. There is evidence that suggests that financial literacy reduces risk attitude inconsistency (Gizem Korkmaz et al. 2009; Anderson and Mellor 2009). One may want to know if financial literacy helps individuals to better understand their risk preferences by comparing risk preferences that are elicited experimentally against those collected by way of the general risk question.
Studies have confirmed that imparting non-cognitive skills such as human capital to individuals can help to alter preferences, suggesting that preferences can be flexible and malleable (Ertac 2020). Furthermore, the theory of planned behaviour contends that knowledge interacts with attitudes, preferences, and norms to mold individual behavior (Ajzen 2011). Financial knowledge is viewed as a human capital aspect that assists individuals to beneficially handle finances. In addition, financial literacy is the knowledge and capability to handle financial issues which includes aspects of numeracy that can require cognitive skills to provide solutions. Cognitive skills have been found to be essential in determining risk preferences in some studies (Lührmann et al. 2018). In addition, low cognitive skills are associated with heuristic responses by individuals (Binswanger and Salm 2017). Some studies suggest that preferences are permanent and can be identified at early stages in children (Castillo et al. 2018). Others confirm that individual preferences can change as one grows older, suggesting that age compounded with experience and knowledge can influence preference choices (Alan et al. 2020). Preferences can significantly differ by gender, involvement in decision making, the size of the household and the level of income that one is holding, among other factors (Ertac 2020; Haushofer and Fehr 2014).
The questions that usually arise are: can GRQ be a proxy of incentivized revealed risk preferences (IRRP) when eliciting risk preferences? Are subjects’ risk preference choices elicited by IRRP and GRQ methods stable? Are risk preferences flexible or permanent? Do human capital aspects such as financial literacy play a role in risk preference choice consistency? This study’s theoretical framework is nested in the Theory Comparison approach applied in the health sector studies (Möller and Marsh 2013). The research compares an economics theory method of eliciting risk preference choices (IRRP) against a psychology theory method of gathering risk preference rankings (PWTFR) (Hertwig et al. 2019). Theory comparison can help to examine if constructs can be captured differently or similarly using different approaches or if theories view the same constructs differently (Nigg et al. 2002). Comparing PWTFR and IRRP methods can assist in designing guides to intervention which can help subjects to maintain their behaviour change over time. It is important to note that moderators, that is, minority status such as gender and many other individual characteristics, can variedly influence the effectiveness and outcomes of the methods under investigation. If observed variances between methods of eliciting risk preferences cannot be explained by the instruments under comparison, this can necessitate the development of new approaches of gathering data.
Informed by the theory comparison approach, the study seeks to test the following bi-directional hypothesis:
Hypothesis 1 (H1).
PWTFR choices are positively and significantly correlate with IRRP choices.
Hypothesis 2 (H2).
PWTFR mean choices are equal to IRRP mean choices.
Hypothesis 3 (H3).
Financial literacy and individual characteristics influence PWTFR and IRRP choices.
Hypothesis 4 (H4).
Financial literacy and individual characteristics influence the variance between PWTFR and IRRP choices.
This study examines the stability of risk preferences of subjects elicited using two different methods, namely: self-reported perceived willingness to take financial risk in investment (PWTFR) an equivalent to the general risk question (GRQ) and incentivized revealed risk preference (IRRP) choices elicited by way of multiple price list (MPL) tasks (Andersen et al. 2008; Mudzingiri 2019; Holt and Laury 2002). The research further explores whether financial literacy helps subjects to make consistent risk preference choices between the two methods used to gather data. Stability of risk preferences collected by the two different methods is important in the following ways: firstly, if PWTFR can predict IRRP, the cost of eliciting risk preference from individuals will be lowered by merely asking the GRQ (PWTFR); secondly, if individuals understand their financial risk attitudes, researchers can easily predict their financial behaviour; thirdly, the study can provide insights into the effect of incentives in eliciting risk preferences. Fourthly, investigating whether human capital skills, such as financial literacy, can bridge the gap between PWTFR and IRRP can help researchers to understand the role of financial literacy on individual risk preferences.
This study is arranged as follows: the next section of the research focuses on the methodology, followed by sections exploring the model specification and results. The final section is dedicated to the conclusion.

2. Methods

2.1. Procedure

A convenient sample of 193 (female = 53%) university students were invited to participate in the research through blackboard online learning platform a week in advance at the beginning of the second semester in July 2016. The study used university students because they are readily available to the researchers and the study was carried outside their study times. The subjects completed a questionnaire that captured their demographic information and a PWTFR question, a 30-question financial literacy test, and also completed four risk preference MPL tasks with different scales of payoffs. The MPL risk preference tasks used in this study were designed and validated by the Research Unit in Behavioural Economics and Neuro-economics (RUBEN) at the University of Cape Town in South Africa. Although the subjects completed both time preference and risk preference MPL tasks (see, Supplementary Materials S1), this study analysis is based on responses from risk preferences tasks only.

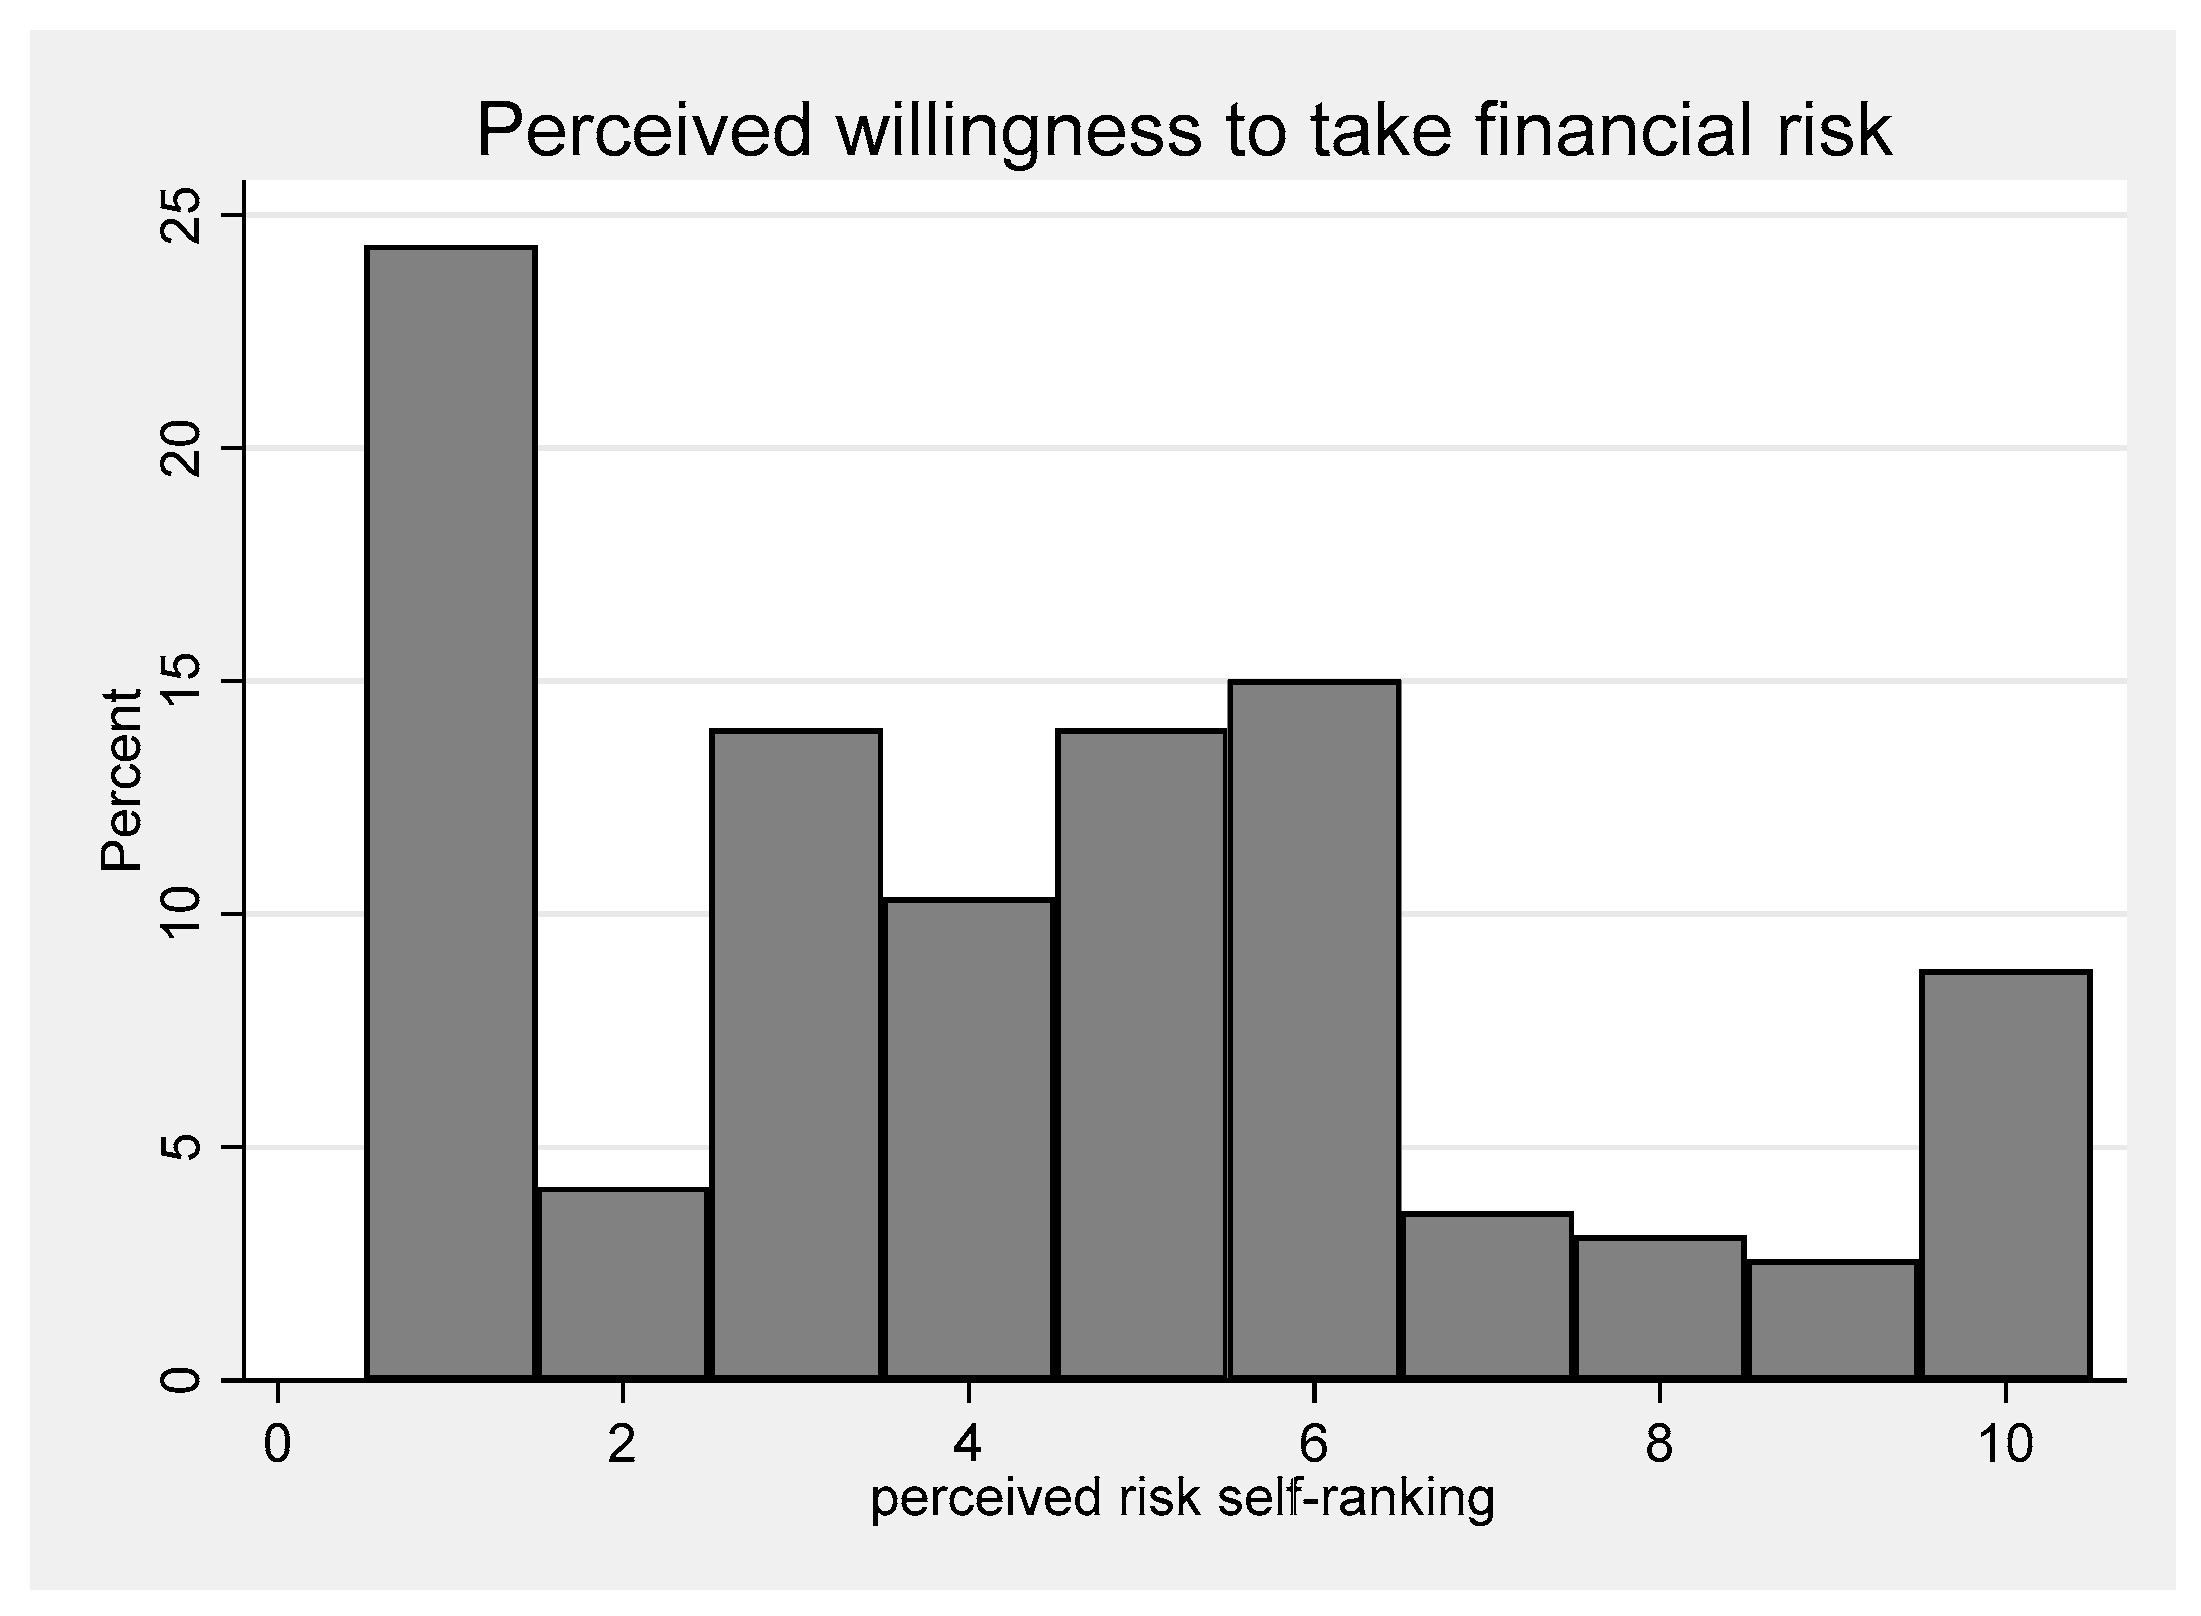
2.2. Eliciting Perceived Willingness to Take Financial Risk (PWTFR)

The PWTFR question was framed as follows (see Supplementary Materials S2):
When thinking of your financial investments, how willing are you to take risks? Please use a 10-point scale, where 1 means “Not At All Willing” and 10 means “Very willing”.
Highly risk-averse subjects will choose values closer to ‘1’ while highly risk-loving or -seeking will pick rankings close to ‘10’. In the analysis, the choices were reverse coded such that ‘1’ became ‘10’, and vice-versa. The reverse coding was meant to ensure an easy comparison of PWTFR and IRRP choices.

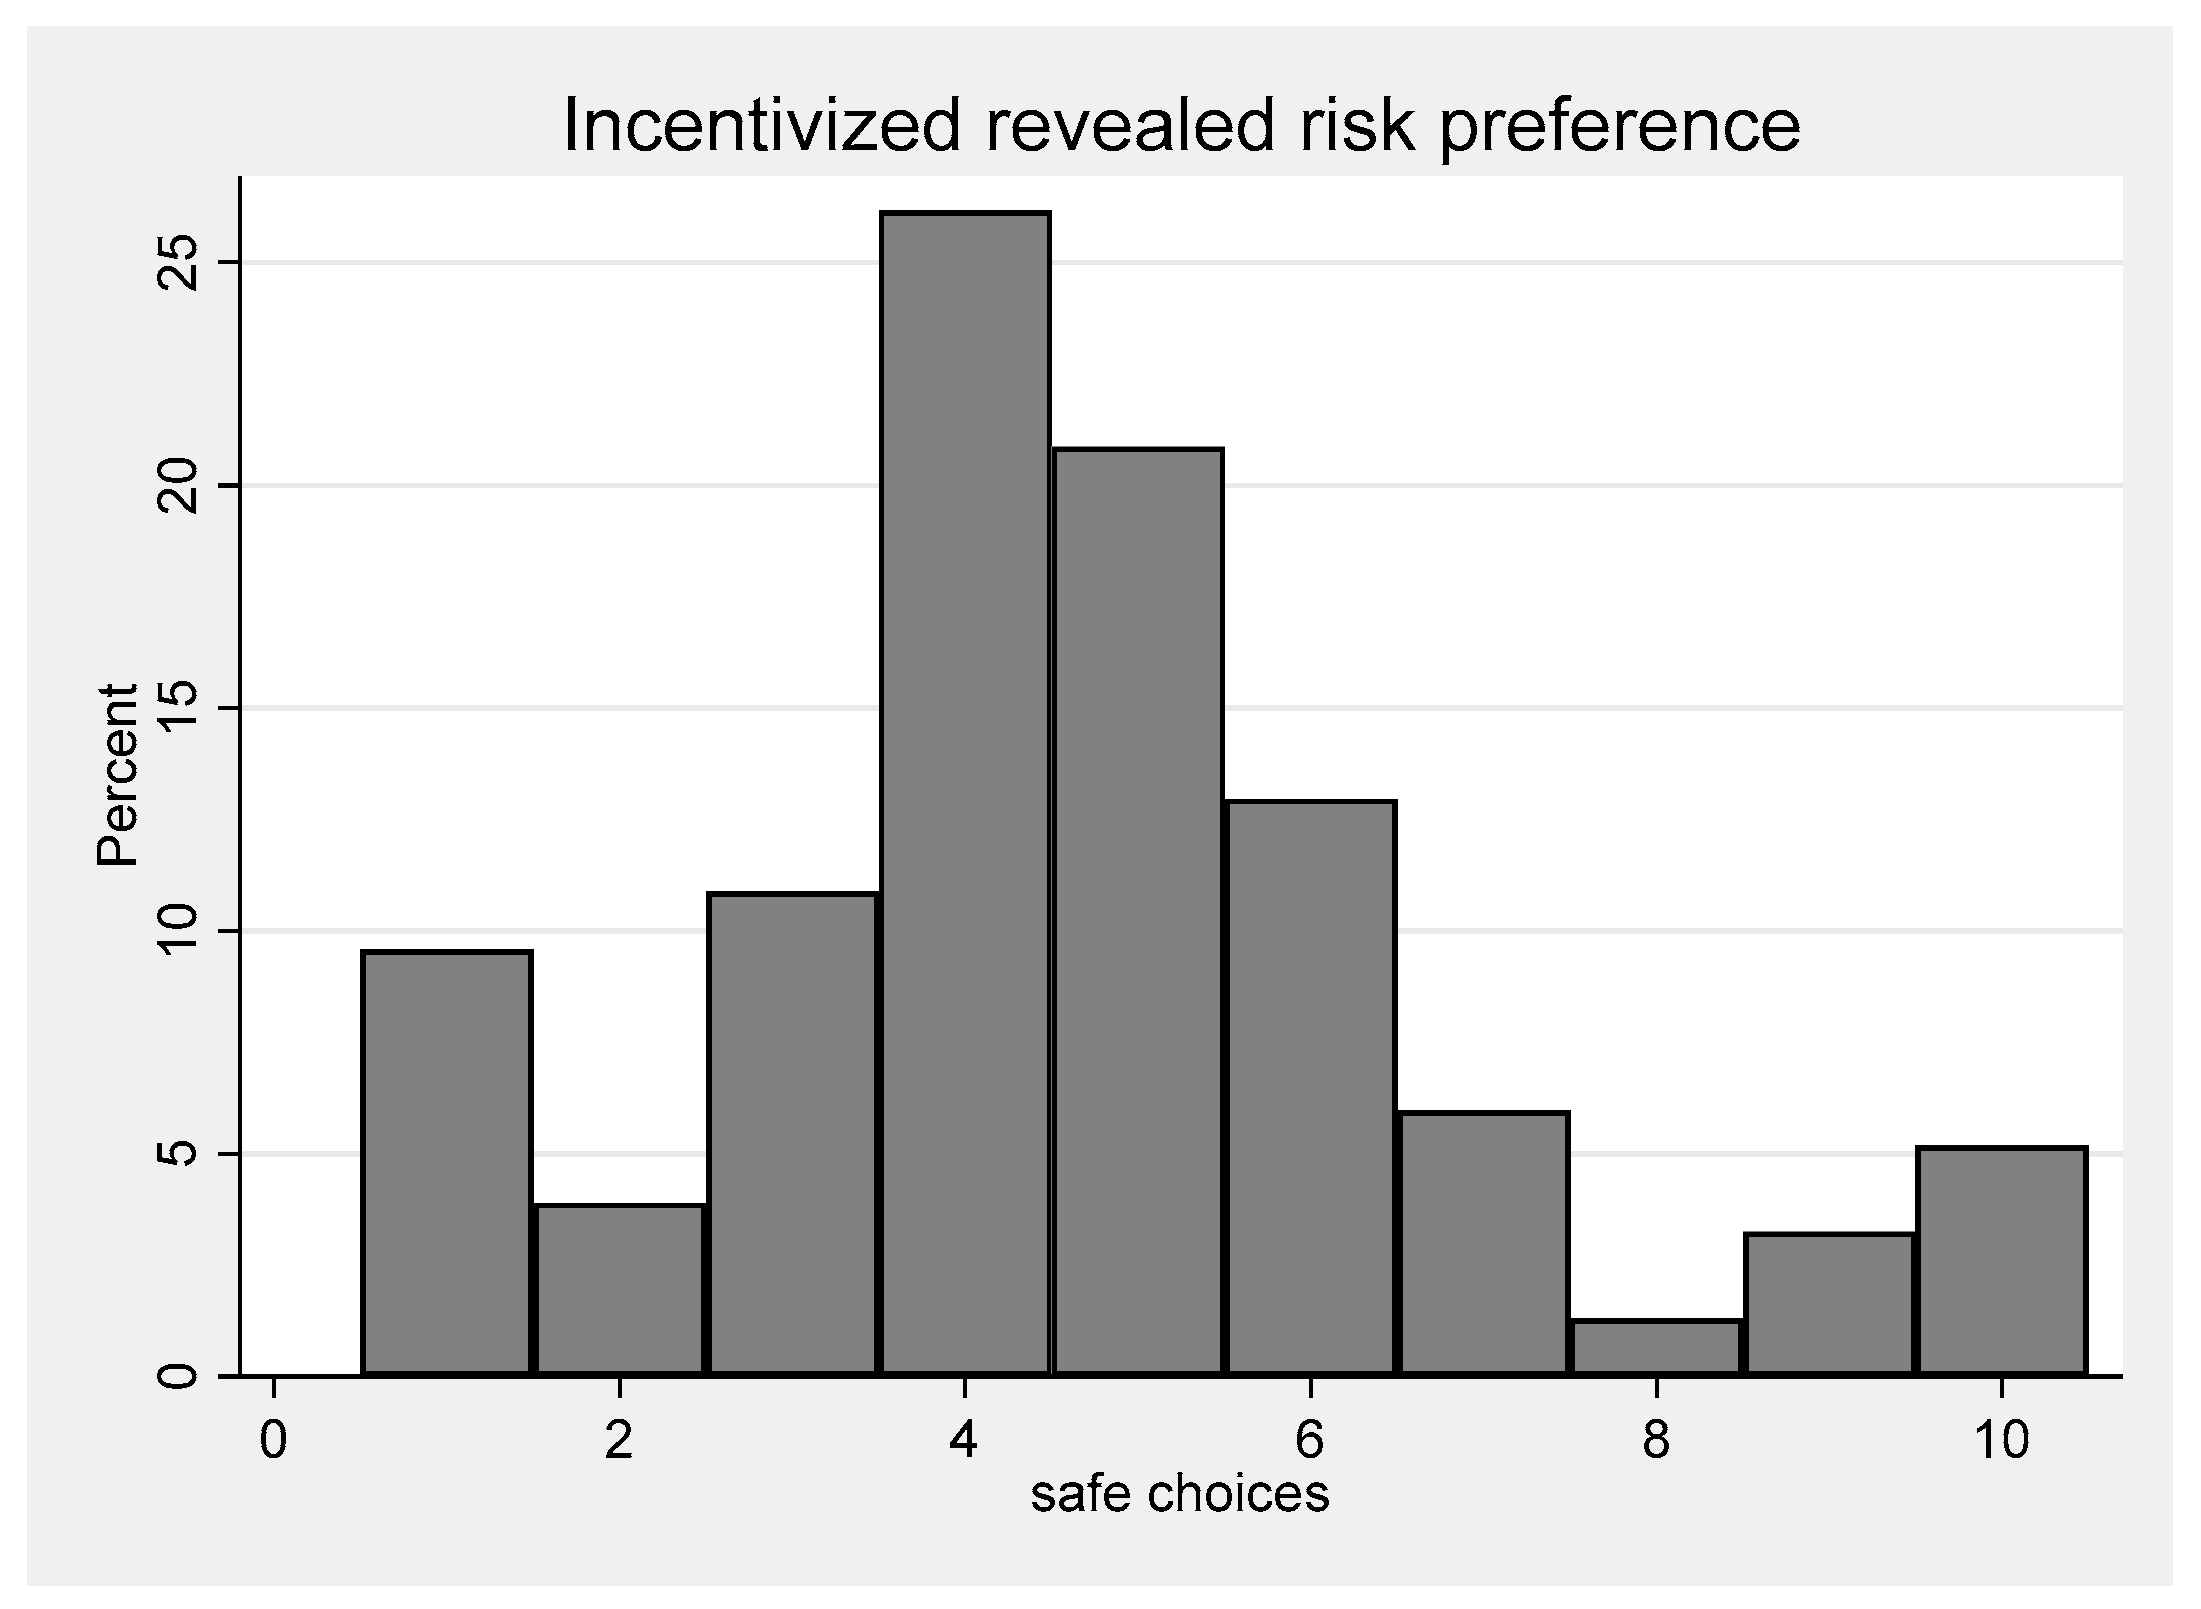
2.3. Eliciting Revealed Incentivized Risk Preferences (IRRP)

The subjects completed four typical IRRP tasks with varying payoffs for lottery A or B (see Table 1). The maximum payoffs for the tasks were as follows (see, Supplementary Materials S1): task 1, (see Table 1); task 2, lottery A (R70); lottery B (R110), task 3, lottery A (R250); lottery B (R400) and task 4, lottery A(R200); lottery B (300) (Andersen et al. 2008; Holt and Laury 2002; Calvin Mudzingiri et al. 2021). All subjects were paid a R50 appearance fee. A total of 219 subjects turned up for the experiment. A total of 220 tokens were put in a hat, where 22 of them (10%) were winning tickets. Subjects blindly and randomly picked the tokens and those who selected the winning tokens were paid the true value of their choices in one of the four tasks completed. A total of 22 subjects (10%) were selected and were paid for their choices (Andersen et al. 2008). A four-side die was used to select one risk preference task completed. A 10-sided die was used to select the row of the chosen task (see, Table 1). Subjects were paid for their true choice in the selected row on the day when the experiment was conducted and according to the probabilities in the tasks completed. The maximum amount received was R450 (400 prize money plus R50 participation fee). Responses from only 193 subjects were correctly completed and a total of 772 (193 × 4 tasks) responses were used in the study analysis.
The research recorded the total number of safe choices made by individuals on each of the four tasks completed. The definition for the safe choices in this study is the total number of lottery A choices made by an individual in each of the four tasks completed. For all the tasks completed, the payoffs of lottery A are close to each other, making them safer.
For example, in Table 1, row 1, an individual has a 10% chance of winning ZAR60 and a 90% chance of winning ZAR50, whereas in lottery B, an individual has a 10% chance of winning ZAR100 and a 90% chance of winning ZAR25. This clearly shows that lottery B is riskier compared to lottery A. Therefore, few safe choices (lottery A) suggest that a subject is risk-seeking or -loving while a high number of safe choices (lottery A choices) indicate a high level of risk aversion among subjects. All zero safe choices of lottery A were recorded as choices for row 1. This is meant to ensure the matching of observations from PWTFR and IRRP. The sum of safe choices made by subjects range from 1 to 10 inclusive. There are studies that have resorted to the recording of safe choices in analyzing risk preferences (Bellemare and Shearer 2010; Drichoutis and Lusk 2016).

2.4. Financial Literacy Test

The financial literacy test questions were drawn from Jumpstart, Dollar Sense and National Financial Capability studies (Lusardi and Mitchell 2014; Mandell 2008; Laborde et al. 2013). Students completed a questionnaire and completed a 30-question financial literacy test under examination conditions where they were not allowed to discuss their responses with their peers and the individual mark scores were recorded (see Supplementary Materials S2). The financial literacy score is the independent variable of interest in this study.

3. Empirical Model Specification

Before estimating regression analysis, the study provided descriptive statistics, performed row and column cross tabulations of risk preference choices, carried paired t-test analysis and provided partial correlation analysis.
A cross-sectional ordinary least squares (OLS) regression model investigating factors associated with PWTFR rankings was specified as follows (Ghaddar et al. 2008):
P W T F R i = α i + β 0 F i + 1 6 β i X i + ε i ,
where P W T F R stands for GRQ responses made by individual i, α is a constant representing other factors that were not included in the model, F i represents variable of interest ‘financial literacy score’ of individual i,   β 0 is the coefficient of financial literacy score, X i represents control variables gender (female), age, geographical location (urban), income, financial decision status (whether one is a non-financial decision maker, joint-financial decision maker or main-financial decision maker) and number of family members in one’s household (household size). β i , is the coefficient of particular control variable and ε i is the stochastic error term. The time-invariant variables F i and X i were also included in all the regression models specified below (see, Table 2).
The study specified a random effect (RE) panel regression model for the IRRP choices made by the subjects (Borenstein et al. 2010).
I R R P i t = α i + β 0 F i + 1 6 β i X i + 1 4 λ i t T i t + ε i t ,
I R R P i t is the time-variant sum of safe choice made by individual i at time t; T i t is the risk preference task completed by individual i at time t and λ i t is the coefficient of T. Subjects completed the four IRRP tasks one after the other. Therefore, time t = 1, …, 4, the time period in which the MPL tasks were completed. The research further calculated the absolute difference between the total number of safe choices an individual made on the IRRP and PWTFR choices. The absolute gap between PWTFR and the IRRP is referred to as the ‘risk tolerance gap’ in this study. The research specified the following risk tolerance gap model:
R T i t = α i + β 0 F i + 1 6 β i X i + 1 4 λ i t T i t + ε i t ,
R T i t is a time-variant absolute difference between PWTFR and IRRP choices. The variables PWTFR, IRRP, risk tolerance gap, financial literacy, income and household size were presented in natural logarithms in the regression analysis. The random effect panel regressions controlled for IRRP task-specific characteristics. To determine the appropriateness of the panel regression models used in the study, the Hausman and the Breusch Pagan Lagrange Multiplier tests were used (Pesaran 2016). The tests supported the use of a random effect panel regression over the fixed effect model. STATA 16 was used to analyze the data.

3.1. Descriptive Statistics

A total of about 53% of the 193 subjects that participated in the research were female, about 70% resided in urban centres, the average age was about 22 years, the average income was about ZAR1 605, and the average number of family members in a household was about five. The total average of IRRP choices were 4.70 compared to 4.38 for PWTFR rankings. The average financial literacy score was 40%, showing that the subjects had low financial literacy, although they were pursuing an undergraduate Bachelor of Commerce degree and the average risk tolerance gap for the subjects was 13.3 (see Table 3).

3.2. Perceived Willingness to Take Financial Risk for All Subjects

In the study, the subjects were asked to rank their willingness to take financial risk in their investments. Figure 1 shows that the majority of the subjects indicated that they were highly willing to take financial risk (bar graph 1, about 24% of the sample). The respondents exhibited a tendency to anchor their choices at the extremes of risk loving and at the middle. The majority of the subjects perceived themselves as risk-seeking people. The way subjects rank their PWTFR shows that the responses are concentrated around either ‘highly risk-seeking’, ‘risk-neutral’, or ‘highly risk-averse’.

3.3. Incentivized Revealed Risk Preferences (IRRP)

In the research, subjects completed four IRRP tasks. Figure 2 shows aggregated safe choices for all the four tasks completed. The aggregated graph is fairly normally distributed. Making few safe choices (lottery A choices) is an exhibition of risk-seeking behavior while selecting a high number of safe choices reflects a risk aversion attitude. The majority of subjects made four (over 26%) and five (over 23%) safe choices showing risk neutrality on IRRP tasks. There are low rates of anchoring at the extreme for IRRP when compared to PWTFR. In the IRRP tasks, more subjects exhibit a risk neutrality attitude, suggesting that the presence of real monetary incentives in eliciting risk preferences could have caused subjects to be risk-averse or -neutral while in situations where there were no monetary incentives the subjects were more likely to be risk-loving/seeking.

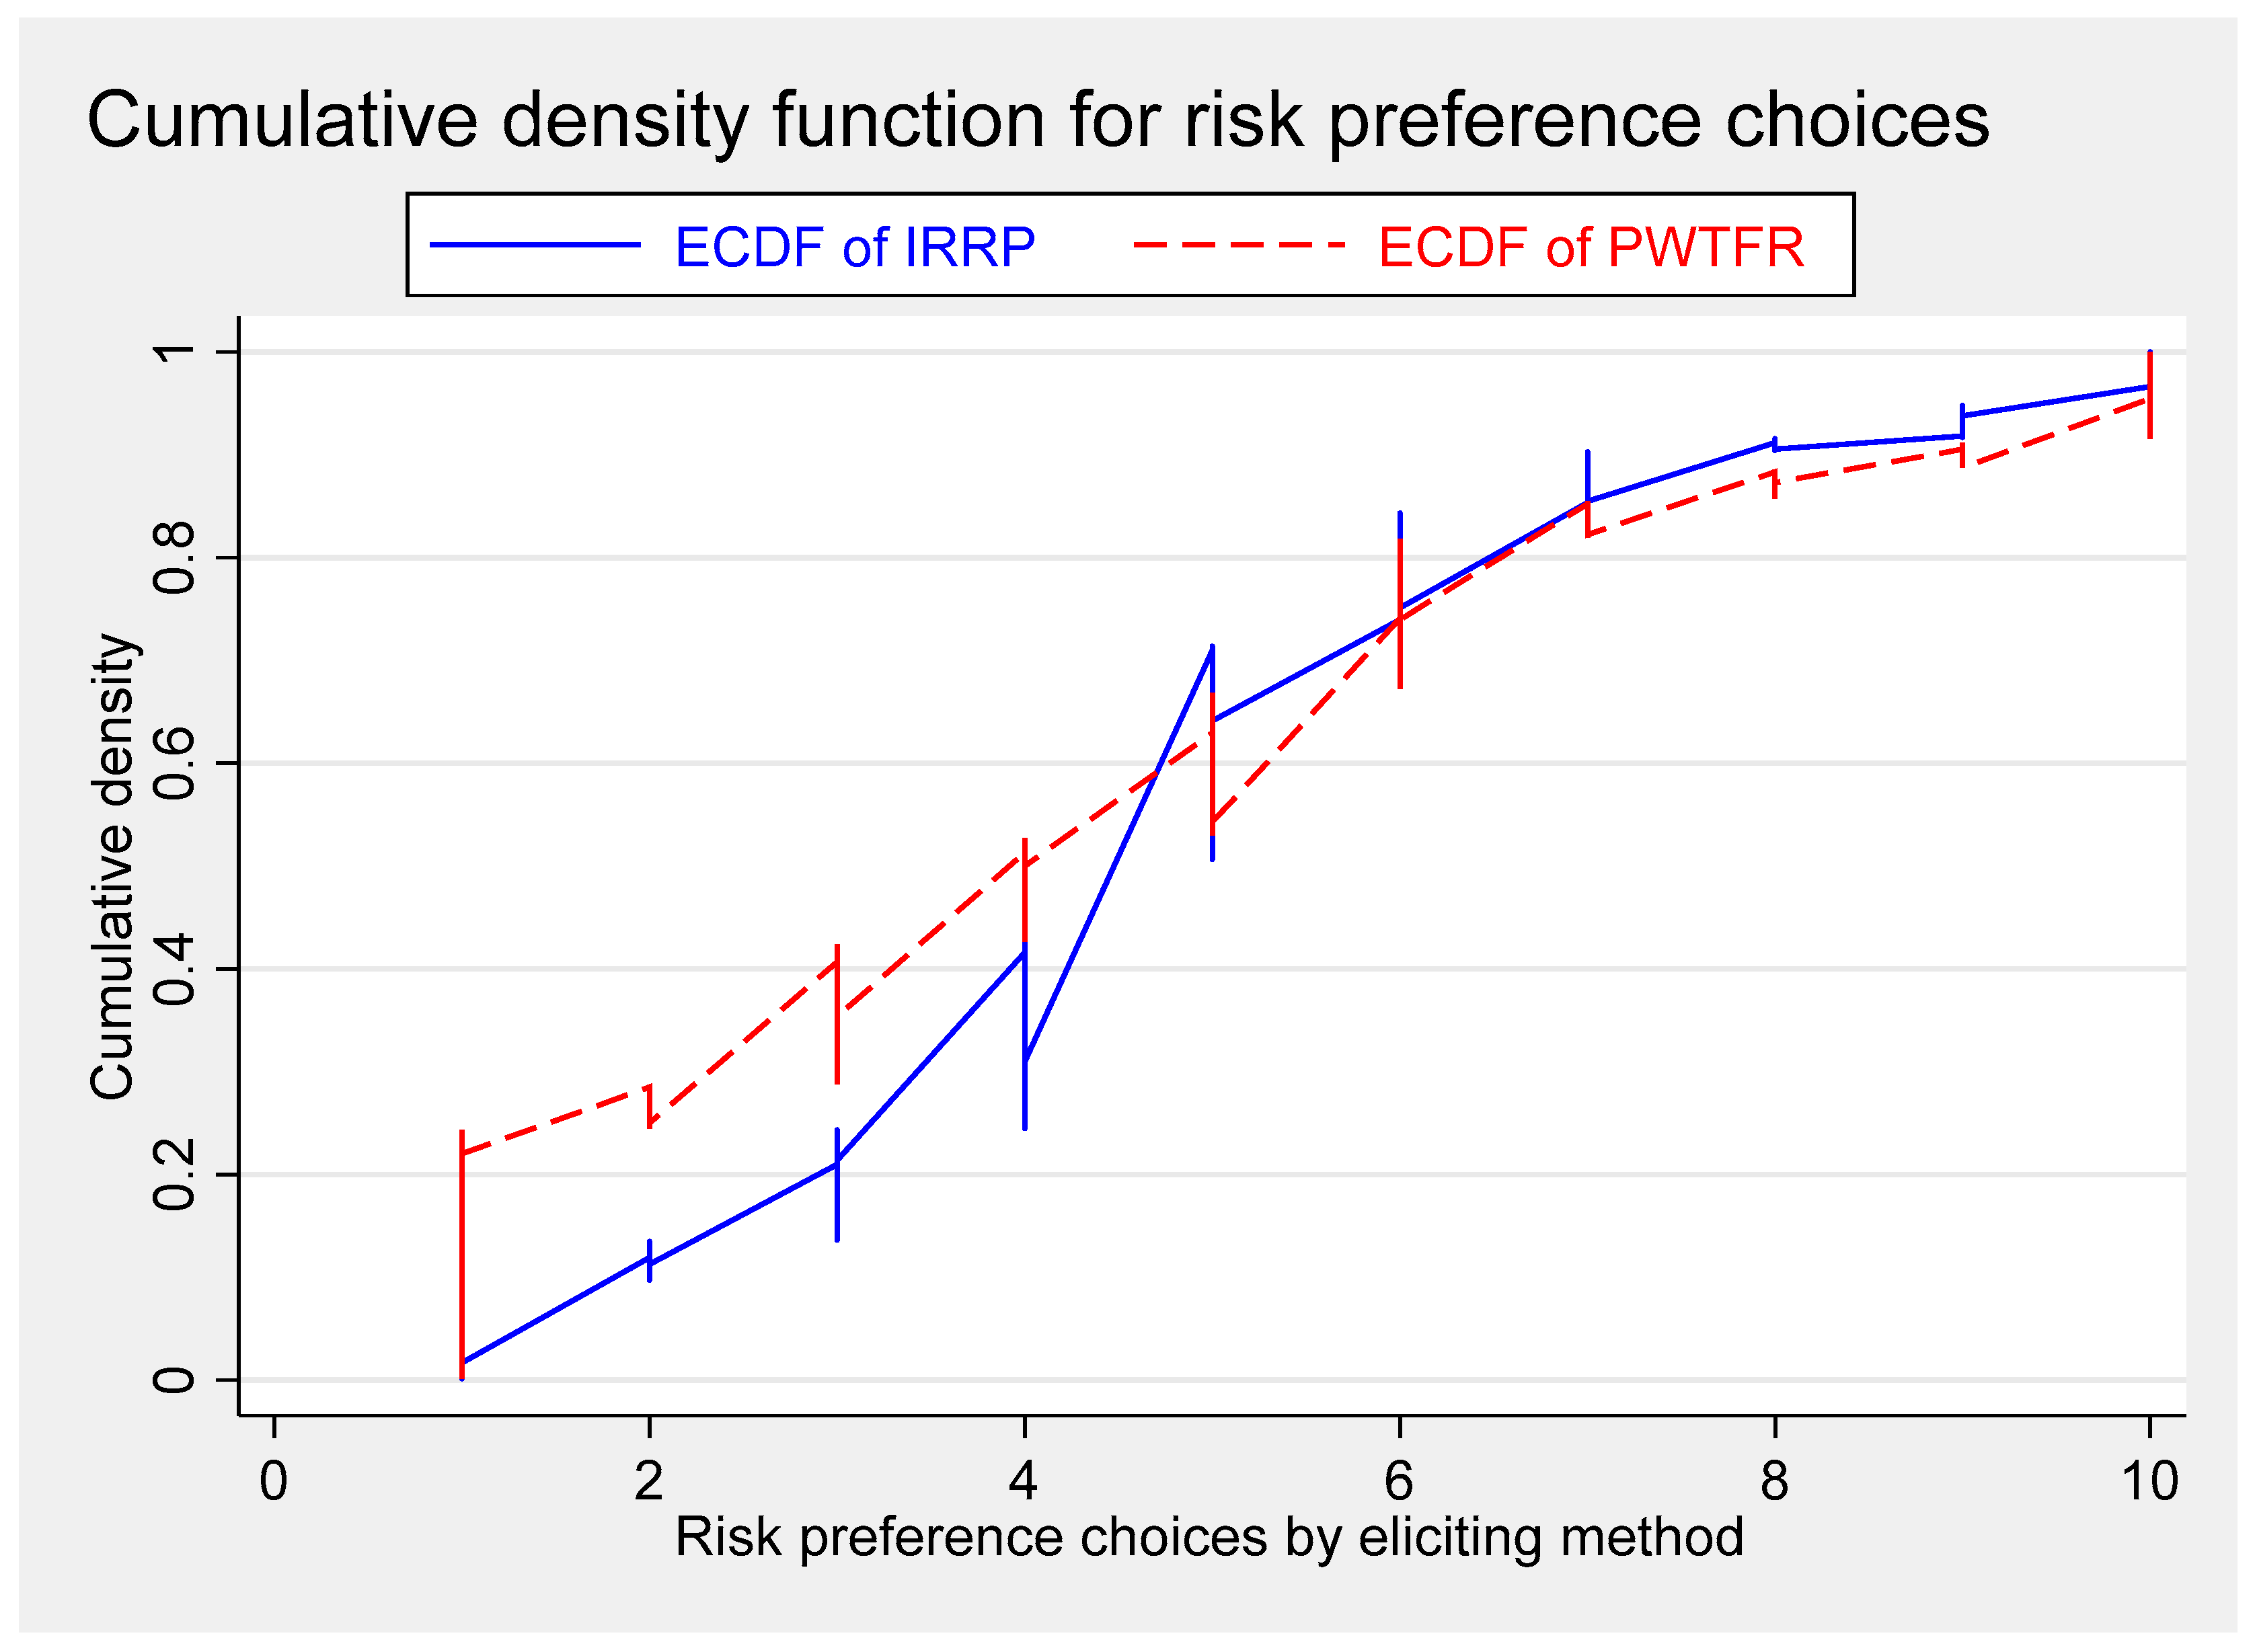
3.4. Cumulative Density Function for PWTFR and IRRP Choices

Figure 3 shows plotted risk preference choices made by the subjects across the two methods of eliciting risk preferences on a cumulative density function. Subjects were more risk loving when they responded to the PWTFR question than when they made choices in IRRP experimental tasks. This could be also due to the incentive effect provided in the IRRP approach and not provided in the PWTFR method.

4. Results and Discussion

4.1. Cross Tabulations PWTFR versus IRRP

To investigate if PWTFR choices made by subjects coincide with IRRP choices the research used cross-tabulations of the 10 choices and rankings obtained from the two methods of eliciting risk preferences used in the study. Big percentage values along the diagonal or closer to the diagonal of the cross-tabulations tables reflect risk preference stability and consistency as well as a high ability to predict IRRP by subjects by way of PWTFR rankings. Having PWTFR and IRRP coinciding suggests that individuals know and can precisely predict their risk preferences, which can allow the researchers to use any of the two ways—PWTFR or IRR—to elicit the risk preferences of subjects. The results show that a small percentage of subjects could precisely predict their IRRP choices by way of PWTFR rankings. The results cast doubt on the appropriateness of PWTFR to predict IRRP choices by subjects, showing that subjects generally provided inconsistent risk preferences choices between the two methods used to elicit risk preferences. The results show that fewer people can precisely foretell their incentivized revealed risk preferences. Since risk preferences are a mediating variable of behavior, the inability to foretell one’s risk preferences means that one will not be sure of how one will react when faced with a risk choice dilemma. Subjects could perceive themselves as risk-loving, but in reality, they will be risk-averse or vice-versa.

4.2. T-Test and Partial Correlation Analysis

A paired t-test analysis showed that the means of the data collected using the two methods of eliciting risk preferences employed significantly differed at 5% level (t = −2.44; p = 0.02). The study results fail to accept the null hypothesis (H2). The t-test results confirm that the individual risk preferences collected from subjects using the two methods are not equal, are unstable and subjects provided risk preferences choices that were not consistent across the two methods. In addition, the t-test analysis on PWTFR choices by gender show a significant mean difference at a 1% level (t = −2.91; p = 0.01). Showing that gender difference dynamics played a pivotal role when subjects made PWTFR choices. The study found insignificant differences in the mean choices made in IRRP tasks by gender. Revealing that when incentives are applied subjects made similar choices across gender. Furthermore, the partial correlation coefficient of PWTFR and IRRP choices is negative and insignificant (β = −0.038; p = 0.321). The study results fail to accept the null hypothesis (H1). PWTFR and IRRP choices are not positively correlated. The study results contradict the findings by Dohmen et al. (2011); they concluded that the GRQ is significantly correlated with experimental field-elicited risk preferences. On the other hand, this study corroborates findings by studies that could not find a significant correlation between GRQ and incentivized revealed risk preferences (Csermely and Rabas 2016; Lönnqvist et al. 2015).

4.3. Regressions Results

4.3.1. Perceived Willingness to Take Financial Risk on Investments

The study ran an OLS regression model on all the subjects, both male and female with a special focus on the relationship between financial literacy and selected individual characteristics on PWTFR. The research results show that financial literacy is not significantly associated with PWTFR choices. The research results failed to accept the null hypothesis (H3). The financial literacy level did not influence choices made by subjects under PWTFR. Subjects’ responses on risk preferences provided in the non-incentivized GRQ are not significantly influenced by their financial literacy or their capability to handle financial issues.
An investigation into all subjects’ PWTFR shows that being female and coming from a bigger household significantly increases making of safe choices revealing risk aversion attitudes among subjects while being a joint financial decision-maker is associated with making a lower number of safe choices, showing some risk-seeking attitude (Table 4; column 2). Turning to the male subjects, age and household size significantly increased safe choices made by the subjects, reflecting a risk aversion attitude among the subjects. For female respondents, only age significantly influences decrease in PWTFR choices, reflecting some risk-loving attitude.

4.3.2. Incentivized Revealed Risk Preferences (IRRP)

The study ran a random effect (RE) panel regression analysis of the total number of safe IRRP choices per individual by task completed as the dependent variable. Financial literacy is the variable of interest and the analysis also included selected individual characteristics of subjects (see Table 5). The Hausman and Breusch as well as Pagan and Lagrange multiplier test confirmed that the RE panel regression is appropriate for the study analysis. The four risk preference tasks were completed one after the other, giving a four-time period panel analysis (Table 5). A high number of safe choices selected by subjects shows some risk aversion attitude while making few safe choices is an exhibition of risk-seeking behavior. In Table 5, the study analysed the results for all of the subjects.
Financial literacy is positively related with IRRP choices for all subjects (β = 0.1; p < 0.01) and females (β = 0.23; p < 0.01). The research results failed to reject the null hypothesis (H3). The results show that as financial literacy increases for all and female subjects, the number of safe choices made by the respondents increases. An increase in safe choices shows that all and female subjects are risk averse as their financial literacy increases. Findings for all and female subjects support findings by Riepe et al. (2020) who found that entrepreneurs with low financial literacy exhibited low risk aversion. In this study, all and female subjects are highly risk averse as their financial literacy increases. The results show that attaining financial literacy can change an individual’s risk preferences, revealing that risk preferences are flexible and malleable (Ertac 2020). The results also show that financial literacy significantly assisted subjects in completing the IRRP task, which was not the case with completing PWTFR choices. Financial literacy did not significantly influence IRRP choices for male subjects.
Moving on to other control variables, being female is associated with risk aversion for all subjects. Female subjects were more likely to settle for more safe choices compared to their male counterparts, suggesting that gender dynamics influence IRRP choices. One study concluded that women were more risk averse when compared to their male spouses (Arano et al. 2010; Burgaard and Steffensen 2020). It is also concluded that as age increases, all and female subjects made more safe choices (Table 5, column 1 and 3). The results show that as one ages, one becomes more risk averse; this is true for all and female subjects. Being a subject residing in an urban centre is associated with making fewer safe choices, showing an aspect of risk loving by urban dwellers for all, male and female subjects (Table 5, column 1–3). In addition, given that a subject is a non-financial decision-maker, being a joint and a main financial decision-maker is associated with making few safe choices for all and female subjects. The study analysis controlled for IRRP task-specific characteristics and the findings shows that in the majority of cases, subjects were generally risk averse.

4.3.3. Risk Tolerance Gap

The study compared the choices made by subjects under PWTFR and IRRP, and calculated the absolute gap between PWTFR and IRRP, which is referred to as the ‘risk tolerance’ (RT) gap in this paper. A wider RT gap shows that subjects cannot precisely predict their risk preference, while a narrow gap shows that subjects understand and can predict their risk attitudes.
The study presented and discussed RE panel regression results (Table 6). Financial literacy is negatively associated with RT gap for all (β = −0.59; p < 0.01), male (β = −0.48; p < 0.01) and female (β = −0.74; p < 0.01) subjects. As financial literacy increases, the risk tolerance gap is narrowed, showing that financial literacy increases the ability to make stable and consistent choices by the subjects across the PWTFR and IRRP methods used to elicit data.
In essence, the research findings failed to reject the null hypothesis (H4). The results confirm findings from similar studies. Being knowledgeable in a particular field is associated with making few mistakes (Lührmann et al. 2018). Gizem Korkmaz et al. (2009) in their study concluded that financial knowledge reduces inconsistency between risk propensity and risk behaviour. Binswanger and Salm (2017) in their study concluded that being knowledgeable reduces heuristic responses amongst subjects. The study results show that financial literacy helps subjects to understand their risk preferences more precisely. It therefore suggests that imparting financial literacy on citizens can help them to better understand their financial risk preferences. The study findings show that risk preferences of individuals can be changed if subjects receive financial literacy revealing that preferences are not always permanent but are sometimes flexible (Ertac 2020; Castillo et al. 2018).
Moving on to the control variables, being female is positively associated with the RT gap. Female subjects generally could not more precisely predict their risk preferences, showing that gender dynamics could have affected their risk preference choices. When the study considered geographical location, being a female urban dweller is negatively associated with an RT gap. Female subjects living in urban centres exhibited more stable and consistent risk preference choices between the PWTFR and IRRP method. Increase in income is negatively associated with an RT gap for all, male and female subjects. Subjects with higher income exhibited more stable and consistent risk preference choices between the two methods. The study also concluded that being a joint financial decision-maker and main financial decision-maker for all and female subjects is negatively associated with RT gap. Again, confirming that the subjects provided more stable and consistent risk preference choice responses if they participate in financial decision-making. Conversely, male subjects who were main financial decision-makers exhibited more unstable and inconsistent risk preference choices. Furthermore, the study concluded that male subjects from larger household size exhibited more stable and consistent risk preferences. Conversely being a female subject belonging to a larger household size is positively associated with RT gap showing that the risk preferences provided by subjects were not stable. The study also controlled for IRRP task-specific characteristics and the results show that in all the IRRP tasks completed the RT gap generally increased revealing that the choices made across PWTFR and IRRP were generally unstable and inconsistent.

5. Conclusions

The study findings cast some doubt on equating PWTFR to IRRP when researchers elicit risk preferences using surveys and MPL incentivized experiments. The t-test and regression analysis show that subjects risk preferences collected by way MPL experiment and the GRQ were unstable and inconsistent. PWTFR cannot always precisely predict IRRPs showing that what individuals say, cannot always precisely reflect what they do when faced with a risk preference dilemma. In addition, the study findings show that financial literacy significantly influences IRRP choices and the risk tolerance gap; however, financial literacy did not influence PWTFR, suggesting that incentives impact the way people make risk preferences.
The significant narrowing of the risk tolerance gap as financial literacy increases shows that the provision of financial literacy helps individuals to more precisely predict their risk preference attitudes. The results show that low financial literacy increases heuristic responses and inconsistency. In addition, the fact that an increase in financial literacy leads to an increase in selecting safe IRRP choices and the narrowing of the risk tolerance gap shows that the provision of financial literacy has the potential to change one’s risk preferences, showing that risk preferences are malleable and flexible. The provision of financial literacy impact risk preferences of individuals resulting in a particular financial behaviour being exhibited.
Gender differences significantly influence risk preference choices, especially in the PWTFR GRQ method. The risk tolerance gap widened when subjects were female, suggesting that female subjects are more likely to under/overstate their PWTFR when compared to their IRRP. Such behavior where the risk tolerance widens could have been influenced by the female child’s life challenges or other related biases.
The study also concluded that participation in financial decision-making significantly influenced risk preferences. Involving oneself in making financial decisions influences the day-to-day risk preference choices an individual makes, showing that some learning happens when one is involved in decision making. Other variables that significantly influenced PWTFR, IRRP and the risk tolerance gap are age and income. Age brings experience with it, which influences risk preferences. Individuals who were holding higher levels of income were associated with a low RT gap. This finding could mean that holding a higher amount of money by subjects could have influenced understanding financial risk and could have helped subjects to make more calculated choices. The tendency by subjects to anchor their PWTFR choices to the extremes and at the middle suggests that surveys eliciting risk preferences should use at most three responses instead of a 10-point Likert scale. The three responses should just elicit information showing whether a person is risk-seeking or -loving, risk-averse or risk-neutral.
The implications of this study to academics are that risk preferences elicited by GRQ are not always similar to those gathered by the IRRP method, especially if subjects have low levels of financial literacy. The variation in the choices made by subjects when collecting data using the two methods is minimal if data is collected from subjects with high financial literacy. Collecting data from a high financial literacy population sample using any of the two methods can provide more reliable data. On the social front, individual characteristics can influence the way subjects make their risk preference choices. The implication of this study to government is that imparting financial literacy to citizens helps them to better understand their financial risk profile.
The use of PWTFR and IRRP tasks has limitations in eliciting true risk preferences of subjects as the world is made up of a wide range of risk preferences that cannot be easily captured by the two instruments. The instruments at this study’s disposal cannot explain a wide range of risk preferences that individuals encounter in their daily life. Besides the shortfalls, the study initiates debate on ways to elicit individual preferences in the market and their stability. Spreading the study from the laboratory into a field experiment can provide a clearer understanding of whether IRRP can be matched to PWTFR. There is a need to investigate the effect of biases on making risk preference choices. Further studies can also investigate whether providing financial literacy has the potential to change individual risk preferences for a South African representative population.

Supplementary Materials

The following are available online at https://www.mdpi.com/article/10.3390/risks9080140/s1, Supplementary Materials S1—Experiment instrument; Supplementary Materials S2—Financial literacy questionnaire; Supplementary Materials S3—Additional analysis.

Author Contributions

Conceptualization, C.M. and U.K.; methodology, C.M.; software, C.M.; validation, C.M.; formal analysis, C.M.; investigation, C.M.; resources, C.M.; data curation, C.M.; writing—original draft preparation, C.M. and U.K.; writing—review and editing, C.M. and U.K.; visualization, C.M. and U.K.; supervision, C.M.; project administration, C.M.; funding acquisition, C.M. All authors have read and agreed to the published version of the manuscript.

Funding

This research received no external funding. The researchers used their institution’s (University of the Free State) research funds to gather data.

Institutional Review Board Statement

The study was conducted according to the guidelines of the Declaration of Helsinki, and approved by the University of the Free State’s General Human Research Ethics Committee. Approval No.: UFS-HSD2016/0079.

Informed Consent Statement

Informed consent was obtained from all individual participants included in the study.

Data Availability Statement

Data used in the study is available on Mendeley Data: https://data.mendeley.com/drafts/hrcdhf6y82 (accessed on 1 May 2021) and is cited as Mudzingiri et al. (2021), “revealed vs. perceive risk preferences”, Mendeley Data, V2, doi: 10.17632/hrcdhf6y82.2.

Conflicts of Interest

The authors declare no potential conflicts of interest with respect to the research, authorship, and/or publication of this article.

Ethical Approval

All procedures performed in studies involving human participants were in accordance with the ethical standards of the institutional and/or national research committee and with the 1964 Declaration of Helsinki and its later amendments or comparable ethical standards. Permission to carry out the study was granted by the University of the Free State Ethics Committee (Number: UFS-HSD2016/0079).

References

  1. Ajzen, Icek. 2011. The Theory of Planned Behaviour: Reactions and Reflections. Abingdon: Taylor & Francis. [Google Scholar]
  2. Alan, Sule, Seda Ertac, and Elif Kubilay. 2020. Understanding Gender Differences in Leadership. The Economic Journal 130: 263–89. [Google Scholar] [CrossRef]
  3. Andersen, Steffen, Glenn W. Harrison, Morten I. Lau, and E. Elisabet Rutström. 2008. Eliciting Risk and Time Preferences. Econometrica 76: 583–618. [Google Scholar] [CrossRef] [Green Version]
  4. Anderson, Lisa R., and Jennifer M. Mellor. 2009. Are Risk Preferences Stable? Comparing an Experimental Measure with a Validated Survey-Based Measure. Journal of Risk and Uncertainty 39: 137–60. [Google Scholar] [CrossRef] [Green Version]
  5. Arano, Kathleen, Carl Parker, and Rory Terry. 2010. Gender-Based Risk Aversion and Retirement Asset Allocation. Economic Inquiry 48: 147–55. [Google Scholar] [CrossRef]
  6. Bellemare, Charles, and Bruce Shearer. 2010. Sorting, Incentives and Risk Preferences: Evidence from a Field Experiment. Economics Letters 108: 345–48. [Google Scholar] [CrossRef] [Green Version]
  7. Binswanger, Johannes, and Martin Salm. 2017. Does Everyone Use Probabilities? The Role of Cognitive Skills. European Economic Review 98: 73–85. [Google Scholar] [CrossRef]
  8. Borenstein, Michael, Larry V. Hedges, Julian P. T. Higgins, and Hannah R. Rothstein. 2010. A Basic Introduction to Fixed-Effect and Random-Effects Models for Meta-Analysis. Research Synthesis Methods 1: 97–111. [Google Scholar] [CrossRef]
  9. Burgaard, Johan, and Mogens Steffensen. 2020. Eliciting Risk Preferences and Elasticity of Substitution. Decision Analysis 17: 314–29. [Google Scholar] [CrossRef]
  10. Castillo, Marco, Jeffrey L. Jordan, and Ragan Petrie. 2018. Children’s Rationality, Risk Attitudes and Field Behavior. European Economic Review 102: 62–81. [Google Scholar] [CrossRef]
  11. Charness, Gary, Uri Gneezy, and Alex Imas. 2013. Experimental Methods: Eliciting Risk Preferences. Journal of Economic Behavior and Organization 87: 43–51. [Google Scholar] [CrossRef]
  12. Csermely, Tamás, and Alexander Rabas. 2016. How to Reveal People’s Preferences: Comparing Time Consistency and Predictive Power of Multiple Price List Risk Elicitation Methods. Journal of Risk and Uncertainty 53: 107–36. [Google Scholar] [CrossRef]
  13. Dohmen, Thomas, Armin Falk, David Huffman, Uwe Sunde, Jürgen Schupp, and Gert G. Wagner. 2011. Individual Risk Attitudes: Measurement, Determinants, and Behavioral Consequences. Journal of the European Economic Association 9: 522–50. [Google Scholar] [CrossRef] [Green Version]
  14. Drichoutis, Andreas C., and Jayson L. Lusk. 2016. What Can Multiple Price Lists Really Tell Us about Risk Preferences? Journal of Risk and Uncertainty 53: 89–106. [Google Scholar] [CrossRef] [Green Version]
  15. Ertac, Seda. 2020. The Formation and Malleability of Preferences and Noncognitive Skills. Istanbul: Springer. [Google Scholar]
  16. Ghaddar, Ali, Inmaculada Mateo, and Pablo Sanchez. 2008. Occupational Stress and Mental Health among Correctional Officers: A Cross-Sectional Study. Journal of Occupational Health 50: 92–98. [Google Scholar] [CrossRef] [Green Version]
  17. Gizem Korkmaz, Aslihan, Zhichao Yin, Pengpeng Yue, and Haigang Zhou. 2009. Does Financial Knowledge Alleviate Risk Attitude and Risk Behavior Inconsistency? Journal of Risk and Uncertainty 39: 137–60. [Google Scholar]
  18. Hastings, Justine S., Brigitte C. Madrian, and William L. Skimmyhorn. 2013. Financial Literacy, Financial Education, and Economic Outcomes. Annual Review of Economics. [Google Scholar] [CrossRef] [Green Version]
  19. Haushofer, Johannes, and Ernst Fehr. 2014. On the Psychology of Poverty. Science 344: 862–67. [Google Scholar] [CrossRef]
  20. He, Pan, Marcella Veronesi, and Stefanie Engel. 2016. Consistency of Risk Preference Measures and the Role of Ambiguity: An Artefactual Field Experiment from China. In Working Paper Series Department of Economics University of Verona. Available online: https://www.usf.uni-osnabrueck.de/fileadmin/DE/Forschung/FG_OEM/wp2016n3.pdf (accessed on 1 May 2021).
  21. Hertwig, Ralph, Dirk U. Wulff, and Rui Mata. 2019. Three Gaps and What They May Mean for Risk Preference. Philosophical Transactions of the Royal Society of London. Series B, Biological Sciences. [Google Scholar] [CrossRef] [Green Version]
  22. Holt, Charles A., and Susan K. Laury. 2002. Risk Aversion and Incentive Effects. American Economic Review 92: 1644–55. [Google Scholar] [CrossRef] [Green Version]
  23. Holzmeister, Felix, and Matthias Stefan. 2020. The Risk Elicitation Puzzle Revisited: Across-Methods (in)Consistency? Experimental Economics. [Google Scholar] [CrossRef] [Green Version]
  24. Jaspersen, Johannes G., Marc A. Ragin, and Justin R. Sydnor. 2020. Linking Subjective and Incentivized Risk Attitudes: The Importance of Losses. Journal of Risk and Uncertainty 60: 187–206. [Google Scholar] [CrossRef]
  25. Kahneman, Daniel, and Amos Tversky. 1979. Prospect Theory: An Analysis of Decision under Risk. Econometrica: Journal of the Econometric Society 47: 263–91. [Google Scholar] [CrossRef] [Green Version]
  26. Kalra Sahi, Shalini. 2017. Psychological Biases of Individual Investors and Financial Satisfaction. Wiley Online Library 16: 511–35. [Google Scholar]
  27. Koudstaal, Martin, Randolph Sloof, and Mirjam Van Praag. 2016. Risk, Uncertainty, and Entrepreneurship: Evidence from a Lab-in-the-Field Experiment. Management Science 62: 2897–915. [Google Scholar] [CrossRef] [Green Version]
  28. Kurowski, Łukasz. 2021. Household’s Overindebtedness during the COVID-19 Crisis: The Role of Debt and Financial Literacy. Risks 6: 62. [Google Scholar] [CrossRef]
  29. Laborde, Pamela M., Sandra Mottner, and Pamela Whalley. 2013. Personal Financial Literacy: Perceptions of Knowledge, Actual Knowledge and Behavior of College Students. Journal of Financial Education 39: 1–31. [Google Scholar] [CrossRef]
  30. Linciano, Nadia, and Paola Soccorso. 2012. Assessing Investors’ Risk Tolerance through a Questionnaire. Social Science Research Network, 1–45. [Google Scholar] [CrossRef]
  31. Lönnqvist, Jan-Erik, Markku Verkasalo, and Gari Walkowitz. 2015. Measuring Individual Risk Attitudes in the Lab: Task or Ask? An Empirical Comparison. Journal of Economic 119: 254–66. [Google Scholar] [CrossRef] [Green Version]
  32. Lührmann, Melanie, Marta Serra-Garcia, and Joachim Winter. 2018. The Impact of Financial Education on Adolescents’ Intertemporal Choices. American Economic Journal: Economic Policy 10: 309–32. [Google Scholar] [CrossRef] [Green Version]
  33. Lusardi, Annamaria, and Olivia S. Mitchell. 2011. Financial Literacy around the World: An Overview. Journal of Pension Economics and Finance 10: 497–508. [Google Scholar] [CrossRef] [Green Version]
  34. Lusardi, Annamaria, and Olivia S. Mitchell. 2014. The Economic Importance of Financial Literacy: Theory and Evidence. Journal of Economic Literature 52: 5–44. [Google Scholar] [CrossRef] [PubMed] [Green Version]
  35. Lusardi, Annamaria. 2019. Financial Literacy and the Need for Financial Education: Evidence and Implications. Swiss Journal of Economics and Statistics 155: 1. [Google Scholar] [CrossRef] [Green Version]
  36. Mandell, Lewis. 2008. Financial Education in High School. In Overcoming the Saving Slump: How to Increase the Effectiveness of Inancial Education and Saving Programs. Chicago: University of Chicago Press, pp. 257–79. [Google Scholar]
  37. Möller, Jens, and Herbert W. Marsh. 2013. Dimensional Comparison Theory. Psychological Review 120: 544–60. [Google Scholar] [CrossRef]
  38. Mudzingiri, Calvin. 2019. The Impact of Financial Literacy on Risk and Time Preferences and Financial Behavioural Intentions. Bloemfontein: University of the Free State. [Google Scholar]
  39. Mudzingiri, Calvin, Sevias Guvuriro, and Charity Gomo. 2021. Exploring Association between Self-Reported Financial Status and Economic Preferences Using Experimental Data. Journal of Risk and Financial Management 14: 243. [Google Scholar] [CrossRef]
  40. Nigg, Claudio R., John P. Allegrante, and Marcia Ory. 2002. Theory-Comparison and Multiple-Behavior Research: Common Themes Advancing Health Behavior Research. Health Education Research 17: 670–79. [Google Scholar] [CrossRef]
  41. Pedroni, Andreas, Renato Frey, Adrian Bruhin, and Gilles Dutilh. 2017. The Risk Elicitation Puzzle. Nature 1: 803–7. [Google Scholar] [CrossRef]
  42. Pesaran, M. Hashem. 2016. Time Series and Panel Data Econometrics. Oxford University Press, Oxford. Statistical Papers 57: 859–60. [Google Scholar] [CrossRef]
  43. Riepe, Jan, Michelle Rudeloff, and Theresa Veer. 2020. Financial Literacy and Entrepreneurial Risk Aversion. Journal of Small Business Management 58: 1–10. [Google Scholar] [CrossRef]
  44. Vieider, Ferdinand M, Mathieu Lefebvre, and Ranoua Bouchouicha. 2015. Common Components of Risk and Uncertainty Attitudes across Contexts and Domains: Evidence from 30 Countries. Journal of the European Economic Association 13: 421–52. [Google Scholar] [CrossRef]
Figure 1. Perceived willingness to take financial risk (PWTFR) graph, shows percentages of self-reported PWTFR rankings made by the respondents on a 10-point Likert Scale. Perceived risk self-ranking ‘bar 1’ shows subjects who self-reported that they are ‘very willing’ to take financial risk in the investments while ‘bar 10’ shows percentage of subjects ‘not willing’ to take financial risk.
Risks 09 00140 g001
Figure 2. The incentivized revealed risk preference (IRRP) graph shows percentage of respondents by the number of safe choices. Subjects who made a single safe choice are highly risk loving ‘bar graph 1’ while those that made 10 safe choices ‘bar graph 10’ are highly risk averse.
Risks 09 00140 g002
Figure 3. Cumulative density function of PWTFR and IRRP choices. ECDF of ‘IRRP’ represent cumulative density function for IRRP choices while ECDF of ‘PWTFR’ show cumulative density function of PWTFR rankings.
Risks 09 00140 g003
Table 1. Typical payoff matrix for the risk preference experiments—task 1.
Lottery ALottery B
RowPRandspRandspRandspRandsChoose A or B
10.1600.9500.11000.925AB
20.2600.8500.21000.825AB
30.3600.7500.31000.725AB
40.4600.6500.41000.625AB
50.5600.5500.51000.525AB
60.6600.4500.61000.425AB
70.7600.3500.71000.325AB
80.8600.2500.81000.225AB
90.9600.1500.91000.125AB
101600501100025AB
Table 2. Regression model specifications.
ModelDependent VariableIndependent VariablesControl Variables
OLSPWTFRFinancial literacyAmount held as cash or in bank account; gender; age; household size; financial decision status; location
REIRRPFinancial literacyAmount held as cash or in bank account; gender; age; location; household size; financial decision status; IRRP task
RERTFinancial literacyAmount held as cash or in bank account; gender; age; location; household size; financial decision status; IRRP task
Table 3. Descriptive statistics.
VariableSample (n)MeanStd. Err.95% Confidence Interval
IRRP7724.700.084.54–4.85
Financial literacy19340.050.5938.90–41.20
age19322.270.1222.04–22.50
income1931605.21259.561095.62–2114.80
family members1935.370.125.14–5.60
PWTFR1934.380.104.18–4.57
Risk tolerance77213.300.6711.97–14.61
Table 4. OLS Regression: dependent variable perceived financial risk PWTFR.
AllMaleFemale
Financial literacy−0.00014−0.110.10
(0.137)(0.164)(0.188)
Female (gender)0.25 *
(0.130)
Age−0.111.04 *−2.15 **
(0.516)(0.566)(0.881)
Urban (geo location)−0.074−0.270.061
(0.137)(0.173)(0.206)
Income−0.0059−0.0370.024
(0.029)(0.040)(0.045)
Joint financial decision-maker−0.33 **−0.31−0.30
(0.147)(0.217)(0.195)
Main financial decision-maker−0.12−0.33−0.0031
(0.144)(0.217)(0.193)
Household size0.23 *0.29 *0.23
(0.125)(0.155)(0.197)
Constant1.25−1.827.23 **
(1.700)(1.987)(2.832)
N1778394
R20.0720.1560.125
Standard errors in parentheses * p < 0.10, ** p < 0.05.
Table 5. RE panel regression: dependent variable IRRP.
AllMaleFemale
Financial literacy0.10 ***−0.0370.23 ***
(0.039)(0.039)(0.037)
Female (gender)0.080 **
(0.034)
Age0.75 **0.0691.64 ***
(0.329)(0.211)(0.417)
Urban (geo location)−0.13 ***−0.11 *−0.18 ***
(0.035)(0.057)(0.045)
Income−0.0021−0.0081−0.0046
(0.010)(0.019)(0.007)
Joint financial decision-maker−0.084 ***0.029−0.13 ***
(0.022)(0.111)(0.048)
Main financial decision-maker−0.14 ***0.075−0.24 ***
(0.008)(0.078)(0.047)
Household size−0.033−0.0570.012
(0.031)(0.046)(0.043)
IRRP task 10.015 ***0.030 ***0.00090 ***
(0.000)(0.000)(0.000)
IRRP task 2−0.0014 ***0.017 ***−0.018 ***
(0.000)(0.000)(0.000)
IRRP task 30.040 ***0.10 ***−0.014 ***
(0.000)(0.000)(0.000)
Constant−0.961.42 **−3.88 ***
(1.037)(0.594)(1.329)
N708332376
Standard errors in parentheses * p < 0.10, ** p < 0.05, *** p < 0.01.
Table 6. RE panel regression: dependent variable risk tolerance.
AllMaleFemale
Financial literacy−0.59 ***−0.48 ***−0.74 ***
(0.032)(0.109)(0.086)
Female (gender)0.18 **
(0.091)
Age0.45−0.120.40
(0.402)(0.356)(0.649)
Urban−0.0480.27−0.50 ***
(0.054)(0.173)(0.155)
Income−0.047 ***−0.054 **−0.028 *
(0.003)(0.021)(0.017)
Joint financial decision-maker−0.31 ***−0.0032−0.77 ***
(0.041)(0.173)(0.120)
Main financial decision-maker−0.12 **0.22 ***−0.56 ***
(0.055)(0.078)(0.121)
Household size0.022−0.20 ***0.46 ***
(0.073)(0.068)(0.065)
IRRP task 10.071 ***0.24 ***−0.069 ***
(0.002)(0.009)(0.005)
IRRP task 20.14 ***0.26 ***0.034 ***
(0.001)(0.002)(0.003)
IRRP task 30.18 ***0.34 ***0.022 ***
(0.001)(0.003)(0.003)
Constant2.11 *3.51 ***2.75
(1.196)(1.086)(1.861)
N620290330
Standard errors in parentheses * p < 0.10, ** p < 0.05, *** p < 0.01.
Publisher’s Note: MDPI stays neutral with regard to jurisdictional claims in published maps and institutional affiliations.

