Article

Developing a Risk Model for Assessment and Control of the Spread of COVID-19

1
Civil Engineering Department, College of Engineering, Taif University, P.O. Box 11099, Taif 21944, Saudi Arabia
2
Mechanical Engineering Department, College of Engineering, Taif University, P.O. Box 11099, Taif 21944, Saudi Arabia
3
Clinical Pathology Department, Minia University Hospitals, Minia University, Minia 61519, Egypt
4
Architectural Engineering Department, Faculty of Engineering, Minia University, Minia 61519, Egypt
*
Author to whom correspondence should be addressed.
Risks 2021, 9(2), 38; https://doi.org/10.3390/risks9020038
Submission received: 14 December 2020 / Revised: 22 January 2021 / Accepted: 1 February 2021 / Published: 9 February 2021

Abstract

:
Coronavirus disease 2019 (COVID-19) continues to spread rapidly all over the world challenging nearly all governments. The exact nature of COVID-19’s spread and risk factors for such a rapid spread are still imprecise as available data depend on confirmed cases only. This may result in an asymmetrically distributed burden among countries. There is an urgent need for developing a new technique or model to identify and analyze risk factors affecting such a spread. Fuzzy logic appears to be suitable for dealing with multi-risk groups with undefined data. The main purpose of this research was to develop a risk analysis model for COVID-19’s spread evaluation. Other objectives included identifying such risk factors aiming to find out reasons for such a fast spread. Nine risk groups were identified and 46 risk factors were categorized under these groups. The methodology in this study depended on identifying each risk factor by its probability of occurrence and its impact on viruses spreading. Many logical rules were used to support the proposed risk analysis model and represented the relation between probabilities and impacts as well as to connect other risk factors. The model was verified and applied in Saudi Arabia with further probable use in similar conditions. Based on the model results, it was found that (daily activities) and (home isolation) are considered groups with highest risk. On the other hand, many risk factors were categorized with high severity such as (poor social distance), (crowdedness) and (poor personal hygiene practices). It was demonstrated that the impact of COVID-19’s spread was found with a positive correlation with the risk factors’ impact, while there was no association between probability of occurrence and impact of the risk factors on COVID-19’s spread. Saudi Arabia’s quick actions have greatly reduced the impact of the risks affecting COVID-19’s spread. Finally, the new model can be applied easily in most countries to help decision makers in evaluating and controlling COVID-19’s spread.

1. Introduction

Since December 2019, a new epidemic of coronavirus-disease-2019 (COVID-19) has quickly spread to many countries all over the world with an impact on socioeconomic status. This epidemic has changed people’s lifestyles causing many problems such as the loss of jobs and threatening the livelihoods of millions of people, with many businesses shut down in order to control the virus spread. Most aspects of the economy were affected negatively all over the world. For example, many flights were canceled and transportation systems were closed (Saadat et al. 2020).
Efforts have been made to study the novel pandemic. A preliminary review of related computational and mathematical techniques for handling viral threats, specially COVID-19 as an example, was presented and a study for the spike protein sequence of COVID-19 virus was introduced (Robson 2020). A compartmentalized mathematical model concentrating on the transmissibility of super-spreader individuals for spreading COVID-19 was introduced (Ndaïrou et al. 2020). Assessment of basic reproduction quantity threshold was conducted and a study for the local stability of the disease-free equilibrium in terms of the basic reproduction was introduced. The epidemiological characteristics and early clinical features of patients with family aggregation of severe acute respiratory syndrome coronavirus infection were studied (Xia et al. 2020). Huang et al. (2020) presented a study focusing on speedy asymptomatic spread of COVID-19 during the incubation period for teenagers aged 16–23 years and their characteristics. A prediction for the epidemiologic trend of COVID-19 occurrence was developed using auto-regressive integrated moving average (ARIMA) models to be applied in the most affected countries of Europe (Ceylan 2020). The ARIMA models were approved as appropriate models for expecting the prevalence of COVID-19 in the future. Saudi Arabia was one of the countries that performed very early preventive actions aiming at an efficient control system to fight the virus (Alshammari et al. 2020). However, there is an urgent need to evaluate and assess risk factors affecting COVID-19’s spread to control this more effectively.
The main aim of this research is to introduce and develop a new risk analysis model that handles qualitatively risk factors affecting COVID-19’s spread. The proposed model can assess factors priorities and severities that increase COVID-19’s spread. The identified risks will be used as a case study for applying and verifying the model in Saudi Arabia. Besides the introduction, study objectives and the research plan, the outlines of this paper include a literature review covering risk analysis and fuzzy logic models and uses. Furthermore, the study includes developing steps for the proposed fuzzy risk analysis model, model applications and verification, results analysis and conclusions.

2. Study Objectives

The objectives presented in this study can be summarized in the next points:
  • Understanding the existing literature on critical risk factors and identifying the most recent studies regarding COVID-19’s spread based on risk analysis.
  • Identifying the risk factors and the main risk groups that affect COVID-19’s spread. It is essential to produce awareness of these risk factors as well as their probabilities of occurrence, and declare the degree to which of them has high impacts on COVID-19’s spread.
  • Developing and designing a new risk analysis model that can be used for risk factors weighting and prioritizing based on the available data such as probabilities of occurrences and impacts of risk factors on COVID-19’s spread with further application among variable community sectors accordingly. The proposed model can support decision makers who deal with COVID-19’s spread effects in all country sectors to analyze their problems and make sound decisions concerning such spread.
  • Collecting data from real case studies to apply the new model in medical sector and other related sectors in Saudi Arabia. The data will include critical risk factors, probabilities of occurrences of risk sources, and their impacts on COVID-19’s spread.
  • Applying and verifying the new model using the collected data on case studies in Saudi Arabia as well as discussing in detail the model results and critical risk factors. The model can be adopted to satisfy other similar situations in Saudi Arabia.

3. Research Plan

This research focuses on developing a new risk model to assess and analyze risk factors aiming at a proper control of COVID-19’s spread. The plan of this research methodology can be summarized in the following steps:
  • Conducting a comprehensive literature reviewing risk sources of COVID-19’s spread in many countries all over the world. The literature includes a deep review for the risk analysis models used in assessment similar viruses spread. The literature concentrates on identifying risks associated to COVID-19’s spread in developing countries, especially in Saudi Arabia.
  • Conducting field surveys to identify risk factors at health care facilities in Saudi Arabia. These surveys will cover some medical organizations and medical staff involved in the problem of COVID-19’s spread.
  • A full statistical analysis of the survey data is also introduced to assess risk factors based on their probabilities of occurrence as well as their impacts on COVID-19’s spread.
  • Developing and proving the proposed risk analysis model to satisfy the research objectives.
  • Applying and verifying the new model on the selected case study data and receiving outputs. A comparative analysis for the results from the model outputs with the real results from the case study is executed.

4. Evaluation of Risks Affecting Diseases

Many recent research works reviewed the evaluation of risk factors affecting diseases. Risk factors associated with influenza B virus–associated pneumonia was identified using viral surveillance data during the pandemic season. The data were collected for patients ages 18 years or older for clinical features, demographics, laboratory. findings, and outcome while multivariate logistic regression analysis was used for analyzing the collected data (Dai et al. 2020). A model was developed through combining the Gaussian plum dispersion model and quantitative microbial risk assessment with Monte-Carlo simulation as an appropriate explanatory technique to evaluate the risk of acquiring gastrointestinal illness due to exposure to air comprising rotavirus and norovirus bioaerosols (Pasalari et al. 2019). Hepatitis E virus is described in many countries as a risk factor for human exposure (Crotta et al. 2018). A stochastic model was developed for quantifying the risk of infection through airplanes and cargo travels by means of probability of exposure of at least one per at-risk period (Oliveira et al. 2018). The gradient boosted regression tree models were utilized to observe the effects of several potential explanatory factors on the diffusion of Zika virus, and handled historical data from a variety of sources to evaluate the risks of future Zika virus outbreaks (Teng et al. 2017). A mathematical framework was developed as an extension for meta-population model embedding city-to-city contacts to stratify the dynamics of waves of COVID-19’s spread due to imported, secondary, and other factors from an outbreak source area with considering control measures (Hossain et al. 2020). An explanation was introduced for different methods that have been implemented to analyze the diseases based on the symptoms, historical and clinical data of an individual (Thukral and Rana 2019). A model was introduced based on autoregressive integrated moving average in order to estimate the expected daily number of COVID-19 cases in Saudi Arabia in the four forthcoming weeks (Alzahrani et al. 2020).

5. Using Fuzzy Techniques in Disease Assessment

In the medical area, most medical concepts are fuzzy (Massad et al. 1999). These concepts usually are difficult to formalize and measure (Vieira et al. 2019). Fuzzy logic is introduced as an important technique for modelling imprecision in medical fields (Zadeh 2008). Fuzzy logic can be introduced in support of many decisions to solve inaccuracy, uncertainty and incompleteness of data (Zadeh 2008). It can deal with the parties with unclear and indefinable boundaries (Pereira et al. 2007). The medical research area was one of the primary fields in which fuzzy techniques was applied (Reyna and Adam 2003). Arji et al. (2019) presented a classification for fuzzy logic application in an infectious disease (Arji et al. 2019). On the other hand, an innovative hybrid clustering technique was presented based on combining K-means, fuzzy C-means, and hierarchical clustering to expect the direction of DNA mutation trends (Al Kindhi et al. 2019).

6. Field Survey and Data Collection

The methodology in this study is conducted based on field surveys using brainstorming sessions. The inputs and output of the proposed model and the rules linking them are proposed in the form of many logical rules. The brainstorming technique is considered one of the most important data collection systems for identifying information (Issa et al. 2013). The first brainstorming sessions group included four sessions which were conducted with medical specialists for the purpose of confirming model inputs and output. The most fitting linguistics for model inputs and output were also recognized through the sessions. The proposed logical rules which represent the relations among inputs and output were presented and confirmed. The second brainstorming sessions group included three sessions which were focused on applying the model results and its appropriateness for application in Saudi Arabia.

7. Risks Affecting the Spread of Coronavirus Disease 2019 (COVID-19)

The effects of fast testing and social distancing in controlling the spread of COVID-19 can be investigated as risk factors affecting this virus spread (Aldila et al. 2020). Many meteorological parameters and air pollutant data concern temperature, humidity and diurnal temperature range were collected to explore the effect on the daily deaths numbers due to COVID-19 (Ma et al. 2020). The connection between the regional climate parameters over a global scale and COVID-19 fast spread were studied and analyzed (Iqbal et al. 2020). The effect of temperature and relative humidity factors on COVID-19’s spread was introduced using individual-level data in many countries (Lin et al. 2020). Results confirmed that high temperature facilitates the transmission of the disease. On the other hand, high relative humidity increases COVID-19’s spread when temperature is low, while high relative humidity reduces COVID-19’s spread when temperature is high. Mobility habits factor was studied and the effect of it was quantified in the spread of COVID-19 through a multiple linear regression model. It was declared that most of the countries located in the relatively lower temperature areas exposed a fast growth in the COVID-19 cases than the countries located in the warmer climatic regions despite their better socio-economic conditions.
Shiina et al. (2020) confirmed a high correlation between perception and anxiety about COVID-19 infection (Shiina et al. 2020). COVID-19’s spread is affected effectively by the population density and wind (Coşkun et al. 2021). The number of cases may not be affected by the number of sunny days and air pollution. In other research, it was concluded that the proportion of infected individuals in areas with high temperatures is lower than countries of low temperatures, whereas temperature and humidity are gradually affecting the pandemic spread (Varotsos and Krapivin 2020). Another risk group was studied and concerned by the importance of the people’s responses to and impressions about the media reports, and the vital role of specialists and governments in endorsing the public under self-quarantine (Yan et al. 2020).
As explained before, an introductory list of risk factors affecting COVID-19’s spread was prepared based on intensive literature review. Table 1 is clarifying that the total identified risk factors are 46 and categorized in 9 risk groups. It is clear that Group 5 (Early preventive actions) included maximum risk factors numbers (12 risk factors affecting Covid-19 spread). On the other hand, Group 2 (Travel within the country) and Group 6 (Health conditions) included 3 risk factors for each as the minimum numbers of factors in a certain group.

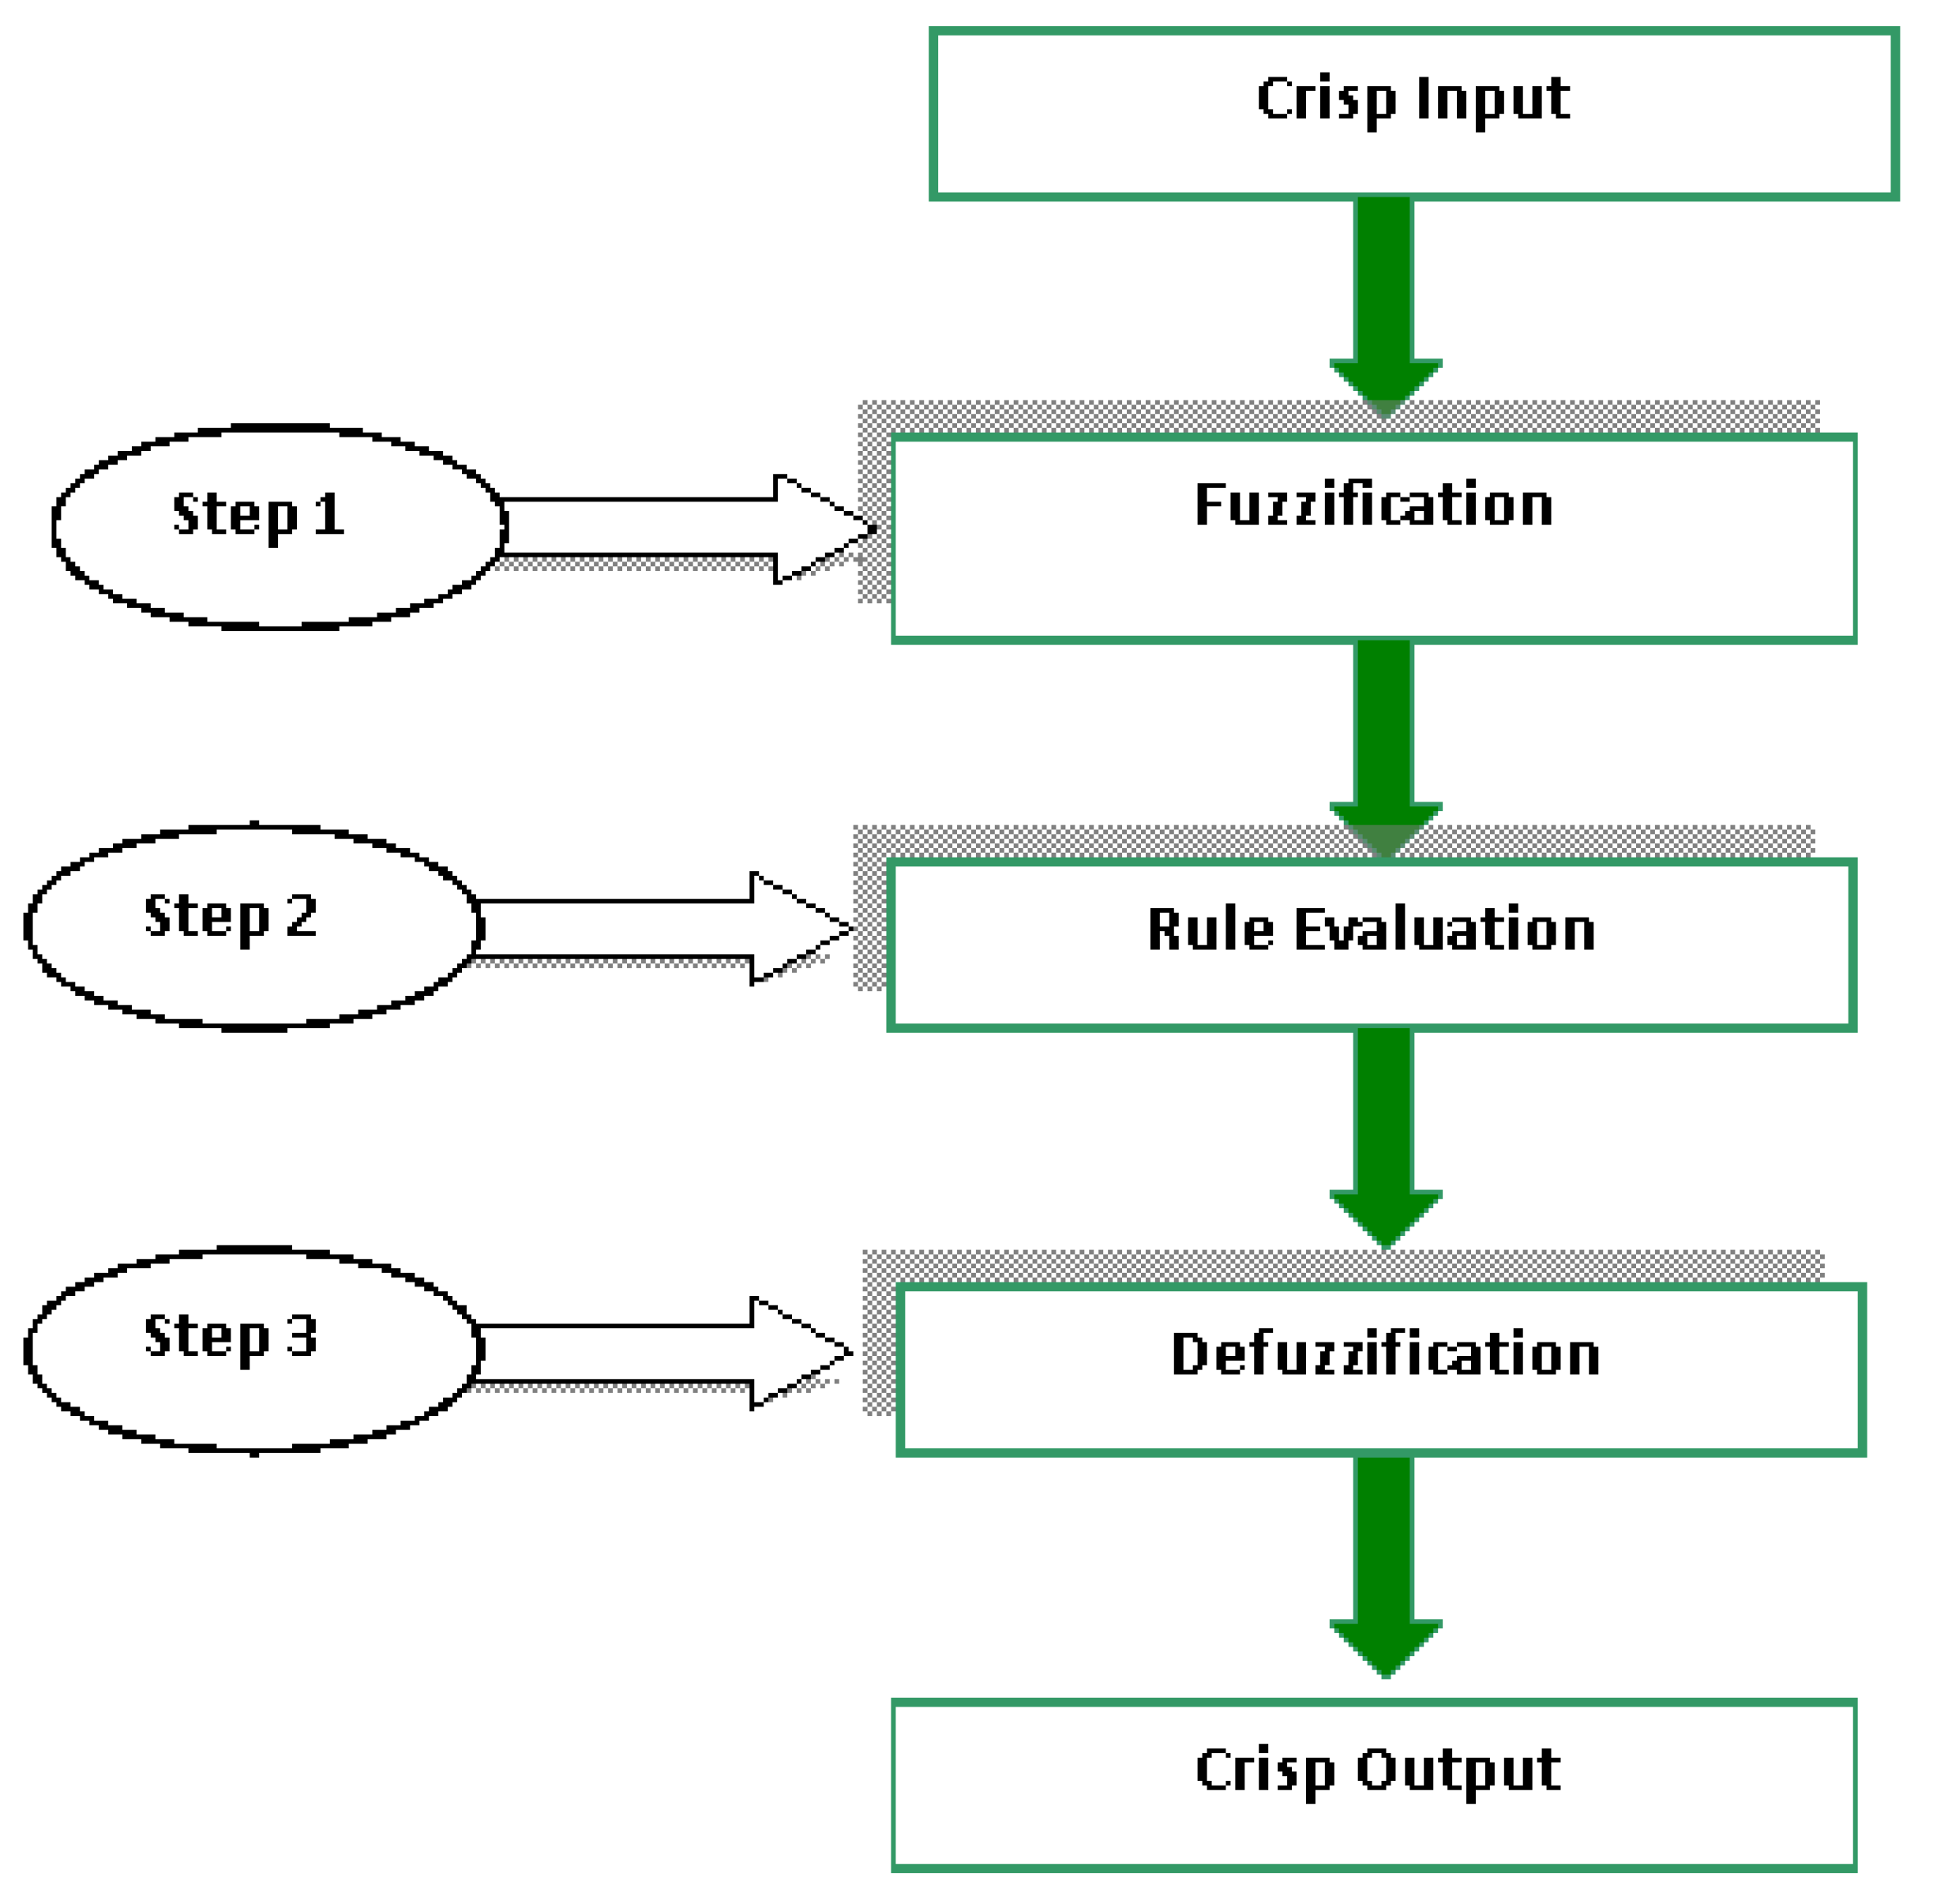
8. Risk Analysis Model for COVID-19 Spread (RAMCS)

The main aim of the Risk Analysis Model for COVID-19 Spread (RAMCS) is to qualitatively assessing the risk factors affecting COVID-19 spread in a suitable and easy way. In general risk concepts, some risk factors occur a lot and their effect on a particular objective is very little. On the other hand, there are risk factors that rarely happen, but they have a severe impact on a specific objective. To deal with this problem as in many recent research works in the assessment of risk factors, the risk factors are handled by combining their two characteristics (probability of occurrence and impact on a certain objective) (Issa 2012a). COVID-19’s spread is considered an important objective which represents a significant relation for assessing this spread. It is better to note that the RAMCS is wide-ranging and with trivial alterations can be simply modified and applied to any kinds of viruses.
The Probability Index (PI), and Impact Index for Viruses Spread (IIVS) are two proposed inputs indices selected in this model to represent the probability of occurrences and the impact of a certain risk factor on COVID-19 spread. Five main phases represent the fuzzy logic process as summarized in Figure 1.
On the other hand, A new index is proposed as a result of combining PI and IIVS based on fuzzy logic process and namely Fuzzy Index for Virus’s Spread (FIVS). It is introduced as an output of the proposed model for the purpose of evaluating the risk factors affecting viruses spread. FIVS specifies the rank or the importance of a certain risk factor to assess the expected viruses’ spread.

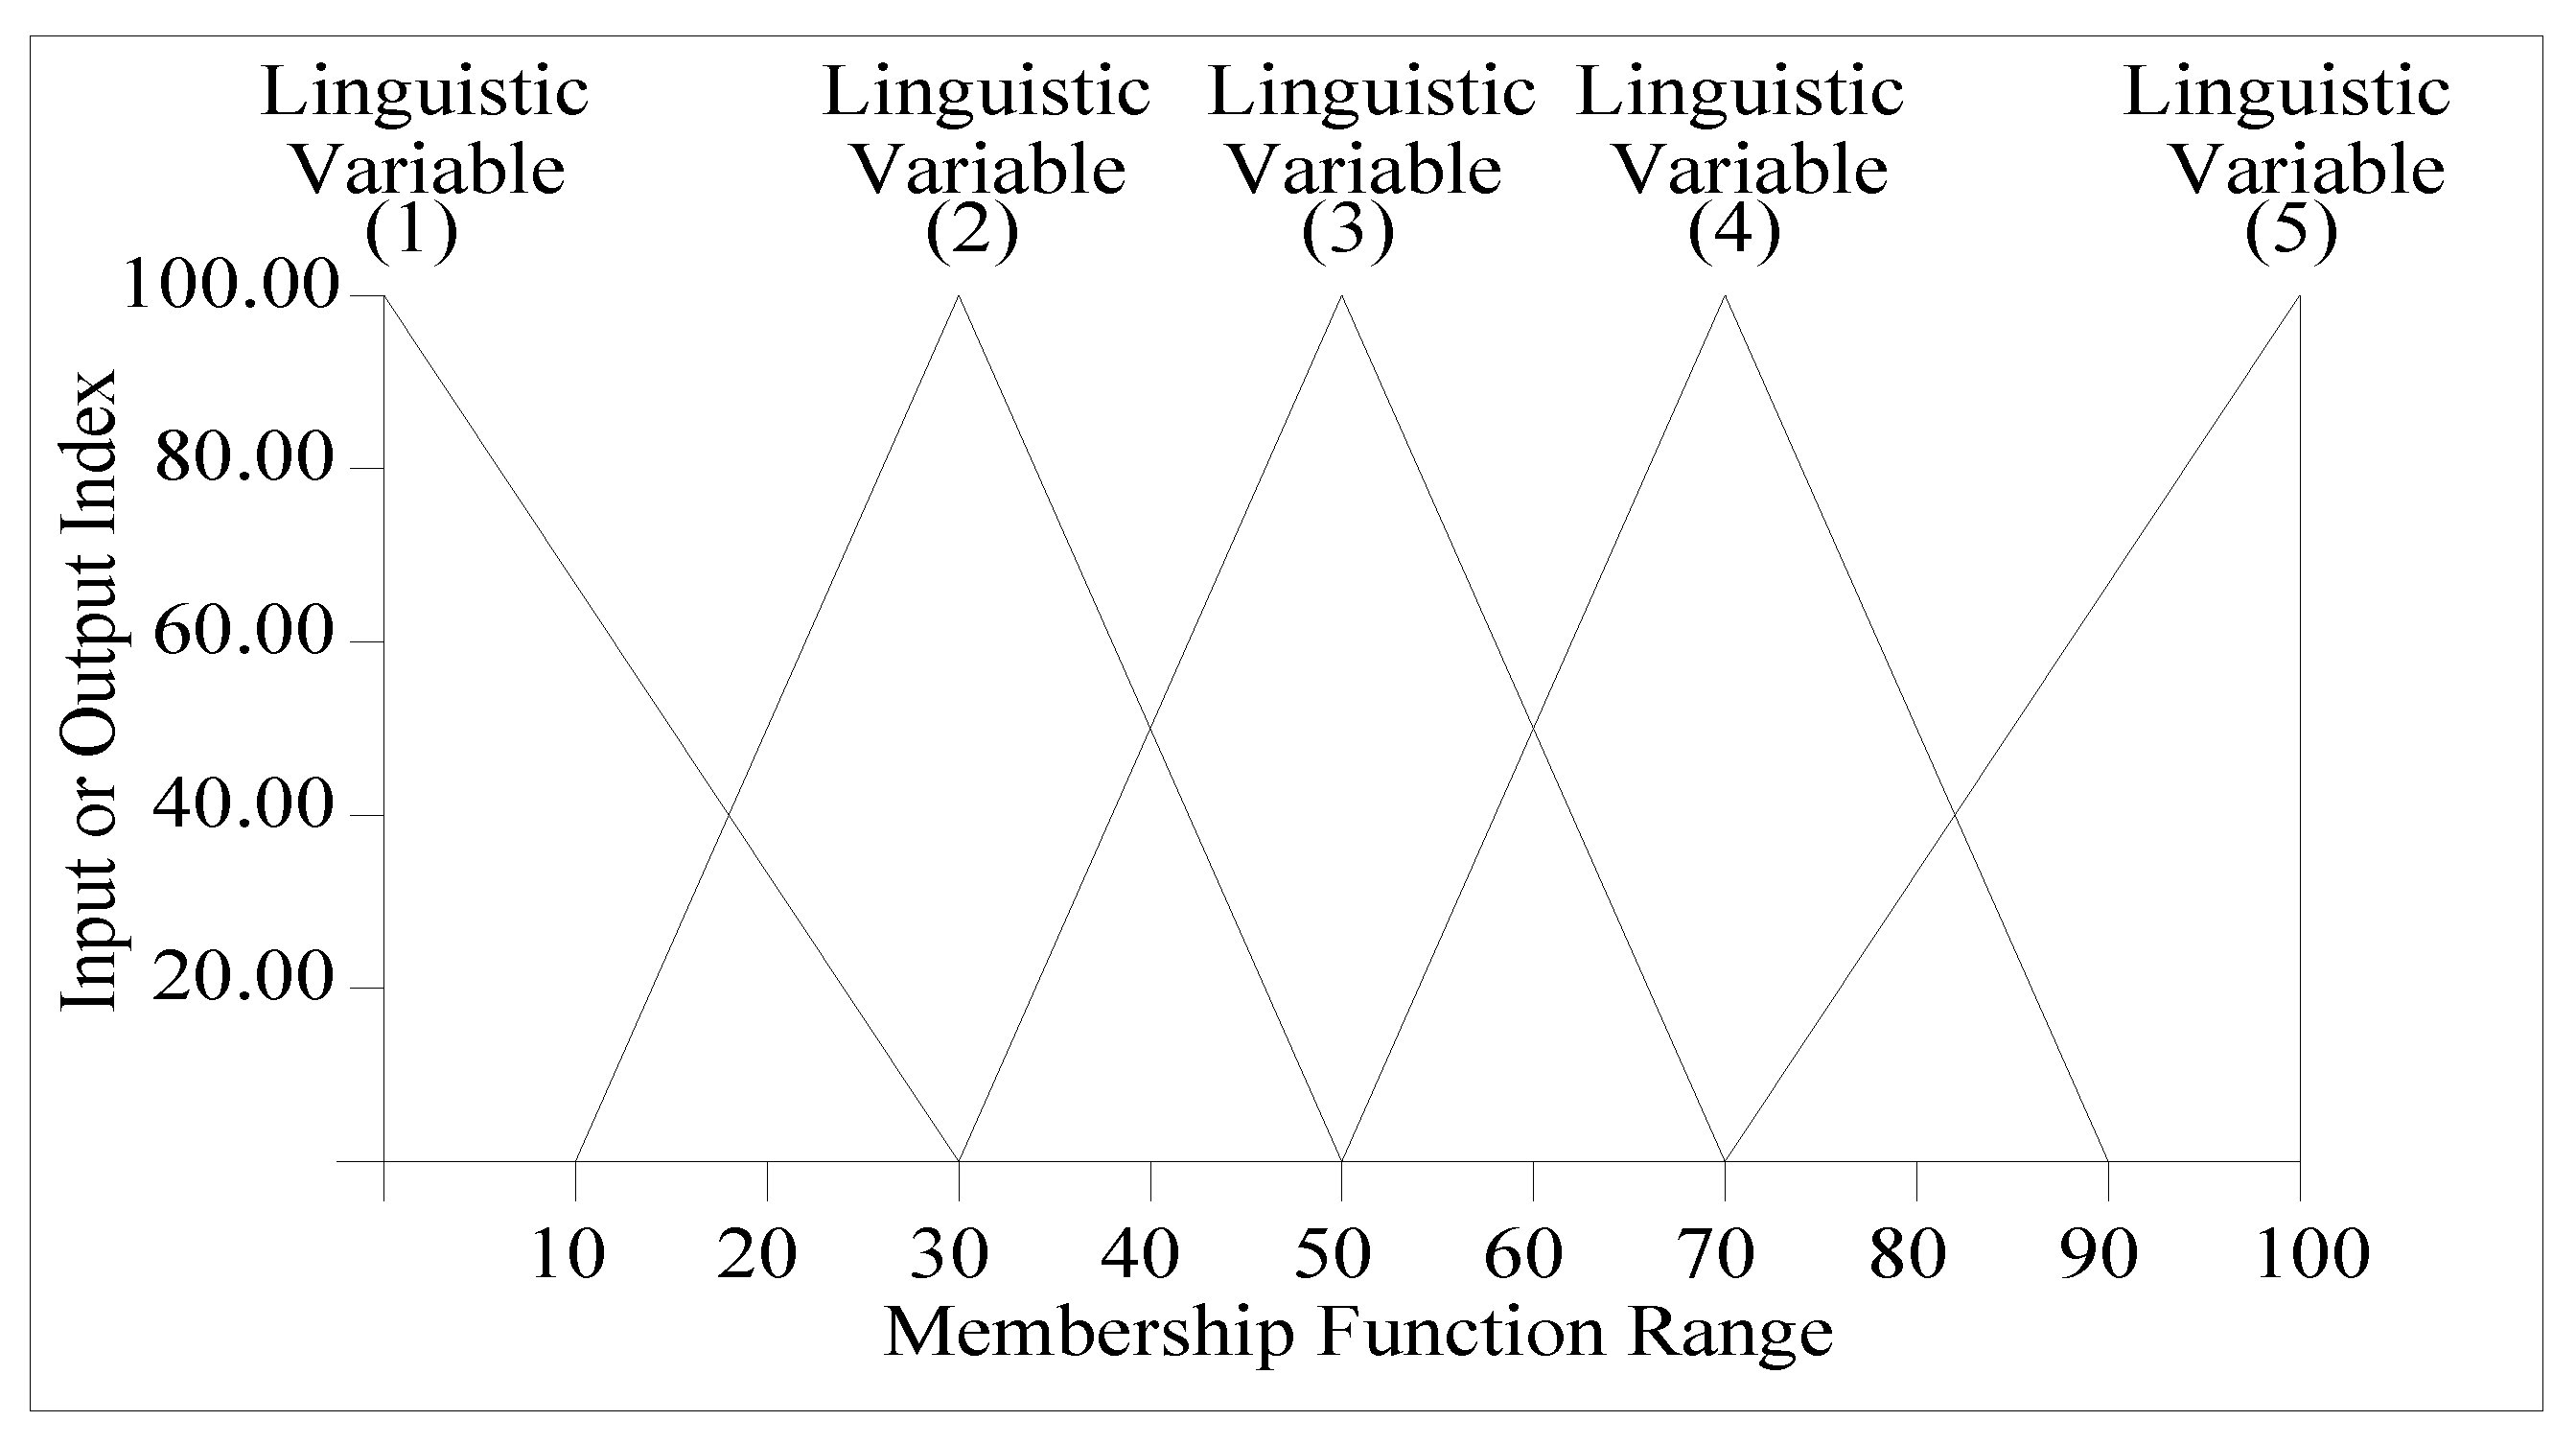
8.1. Membership Functions

Membership functions are recognized to represent a numerical meaning for each linguistic variable and signifies the fuzziness degree of the proposed labels (Issa et al. 2019; Issa and Ahmed 2014). The ranges of input and output values corresponding to each label can be classified by membership functions. Using the membership functions, inputs and output values can increasingly vary from being fully applicable to completely inapplicable.
The degree of membership in fuzzy classes can be located in-between 0 and 1 values (Pereira et al. 2007). Issa et al. (2019) conducted many agreement tests to prove that the triangle shape is the most suitable in cases similar to the current case in this investigation (Issa et al. 2019). The form of the proposed triangle membership function was used in many risk assessment fuzzy models and has been selected depending on pervious researchers’ work (Issa 2012b; Tah and Carr 2000). The triangular shape is proposed as a membership function in the proposed model for all inputs and output sources as shown in Figure 2.
The labels used in the field survey of this study were designed to satisfy the linguistic variables used in the fuzzy set in the proposed model. For example, the fuzzy label used in the probability of occurrence for a certain risk factor are Trivial, Minor, Moderate, Major and Extreme. On the other hand, the labels (Rare, Unlikely, Moderate, Likely and Very Likely) were used to represent the degree of impact of a risk factor on COVID-19 spread. Furthermore, the output index (FIVS) was represented by 5 labels (Very Low (VL), Low (L), Medium (M), High (H) and Very High (VH)). Each label is linked to a fuzzy set as described in Figure 2. The overlap ratio, and overlap robustness were calculated and checked.

8.2. Fuzzy Logical Rules

The Fuzzy IF-THEN rules are usually taken as a specific description of dependencies among objects (Novák and Lehmke 2006). These rules are considered the basis of the composition or reasoning process of the fuzzy system model. Generally, a fuzzy rule can be denoted by IF (antecedent) and THEN (consequent). The rule signifies the association between the input variables and the output variable in terms of linguistic variables instead of mathematical formulas. The logical rules follow the common-sense behavior of the model and can be signified in terms of linguistic labels relations represented by membership function.
As explained, the assessment of risk magnitude through risk factors characteristics can be done by linking two fundamental parameters; probability of occurrence and impact on a certain objective. Consequently, the relationship in this proposed model (two inputs and one output system) should be represented through logical rules for the two inputs (probability of occurrence and impact of each risk factor on COVID-19’s spread) and the output (the severity of risk factor) which are considered the accessible data. The inputs are introduced through PI and IIVS while the output is via FIVS. The proposed linguistic variables are introduced in the brainstorming sessions that explained in the methodology as a first step. The linguistic variables for inputs and outputs as outcomes from this step are summarized in Table 2.
To construct the logical rules in the proposed model, assume the association between the two input parameters (PI and IIVS) for each risk factor was hypothesized. Meanwhile, the output of the model represented the importance or severity of the risk factor as a result for the combined effect of the two inputs. This association can be represented by a double premise rule such as:
If (the probability of occurrence) and (Impact on COVID-19’s spread) then (risk factor severity).
The double premise rule can be transformed to the following mathematical relation
If (PI) and (IIVS) then (FIVS).
There are many relationships that can be obtained with varying values of PI, IIVS, and FIVS. These relationships can be signified using Fuzzy Associative Memories (FAMs) as proved in previous research (Tah and Carr 2000). The interrelations in the FAMs are calculated comparable to those proved before (Tah and Carr 2001). The final rules can be clarified in the matrix shown in Table 2.
In the selected method, Zadeh Operators used (AND) which refers to minimum inferencing. The method for defining the rule strength is completed by taking the minimum fuzzy input which is equivalent to the consequent rule strength. If there are any consequents that are on the same level, then the maximum rule strength between similar consequents is denoted as maximum. These rule strength values can be stated as a fuzzy output. Equation (1) represents the relation between inputs and output of the model through intersection relation.
FIVS = PI ∧ IIVS
where ∧ refers to the intersection between the two inputs. Examples of defined logical rules according to the FAMs matrix can be drawn as follows:
  • If PI is Minor and IIVS is Likely then FIVS is Medium.
  • If PI is Major and IIVS is Moderate then FIVS is Medium.
  • If PI is Trivial and IIVS is Likely the FIVS is Low.
All rules which are used in the proposed model with a weight equal to 1. According to the FAMs matrix, there are twenty-five rules will be used in the proposed model.
Once the probability of occurrence and the impacts of the risk factors on COVID-19’s spread are identified, the severity or importance of the risk factors will be evaluated using the FIVS, which can be computed using the proposed model.

8.3. Model Verification

In order to verify the model results, the risk factors can be ordered according to their severity indices values via multiplying the probability of occurrence by the impact of the risk factor on COVID-19’s spread. The Severity Index for Virus’s Spread (SIVS) can be calculated using Equation (2) as follows:
SIVS = PI × IIVS
On the other hand, the results of applying the model for the 46 risk factors affecting COVID-19’s spread in Saudi Arabia are conducted. Table 3 shows a comparison of the SIVS and FIVS values for all identified risk factors. A correlation coefficient test was introduced using the Spearman’s test for ranking the factors due to FIVS and SIVS. The correlation coefficient factor was calculated and its value was 0.818 representing a high positive correlation between SIVS and FIVS and verifying the model results.

8.4. Model Limitations

Developing and applying any model is associated by some limitations. There are three major limitations in this study concern the proposed risk analysis model for COVID-19’s spread as follows:
  • The number of linguistic terms applied in the model inputs or output are restricted to five only. Using more than five linguistics, particularly in model inputs, may give more accurate results because it allows the user or respondents to select a linguistic variable among a number greater than five.
  • There is no chance for a case of zero risk probability of occurrence, or impact on COVID-19’s spread choice. For example, minimum value for inputs is 0.1, not zero.
  • The model is limited to qualitatively analyzing risks and it cannot determine the quantitative effects of such risks on COVID-19’s spread.

9. Model Application and Results

The proposed model was applied for the identified forty-six risk factors affecting COVID-19’s spread in Saudi Arabia. The PI, and IIVS are the existing indices which are used as inputs for the risk model as explained before. On the other hand, the FIVS index is the model output which can be used for assessing the factors affecting COVID-19’s spread.
In this research, field surveys were conducted to collect data concerning the previous identified risk factors in Saudi Arabia for the purpose of model application and validation. The data were collected from a series of brain-storming sessions in medical organizations as explained before. The data collected from all respondents and the model was applied. The average for inputs indices and results are summarized in Table 3. According to results in this table, it can be observed that risk factor No. 10 (poor social distance) comes in first priority according to its FIVS value, and followed by factor No. 12 (crowdedness). However, risk factor No. 15 (poor personal hygiene practices) occupied the third order due to its FIVS value. On the other hand, the least importance risk factor was No. 21 (poor screening program) which comes in last ranking (rank No. 46) preceded by risk factor No. 22 (shortage of surveillance data).

9.1. Inputs and Output Variables Correlations

Statistical analysis was conducted to show the direction and strength of the relationship among inputs and output of the model. Spearman’s and Kendall’s correlation coefficient tests are two well-known procedures of non-parametric rank correlations that are used to determine the strength of a relation between any two groups of data. Both correlation coefficients range from −1 to +1 (Liebetrau 1983). A value of +1 or −1 refers to a complete degree of association between the two groups of data. When the correlation coefficient values decrease towards 0, the association between the two groups is weaker. The (+) sign refers to a positive relationship, while the (−) sign refers to an adverse relationship. The difference between the Spearman and Kendall lies in that Spearman’s coefficient can reach the value of 1 not only for linearly related variables but also some types of non-linear relationship. Nevertheless, Kendall’s coefficient is equal to 1 for a wider range of situations than Spearman’s correlation coefficient. The results of the two tests are summarized in Table 4. It is clear that a high agreement degree was achieved between IIVS and FIVS indices, while this positive relation decreases in the case of PI and FIVS indices. It can be noted that there is no relation between PI and IIVS.
Figure 3 summarizes the average means for the developed three indices. It is clear that the average mean for IIVS represents the maximum values followed by FIVS while PI represents the lowest values.

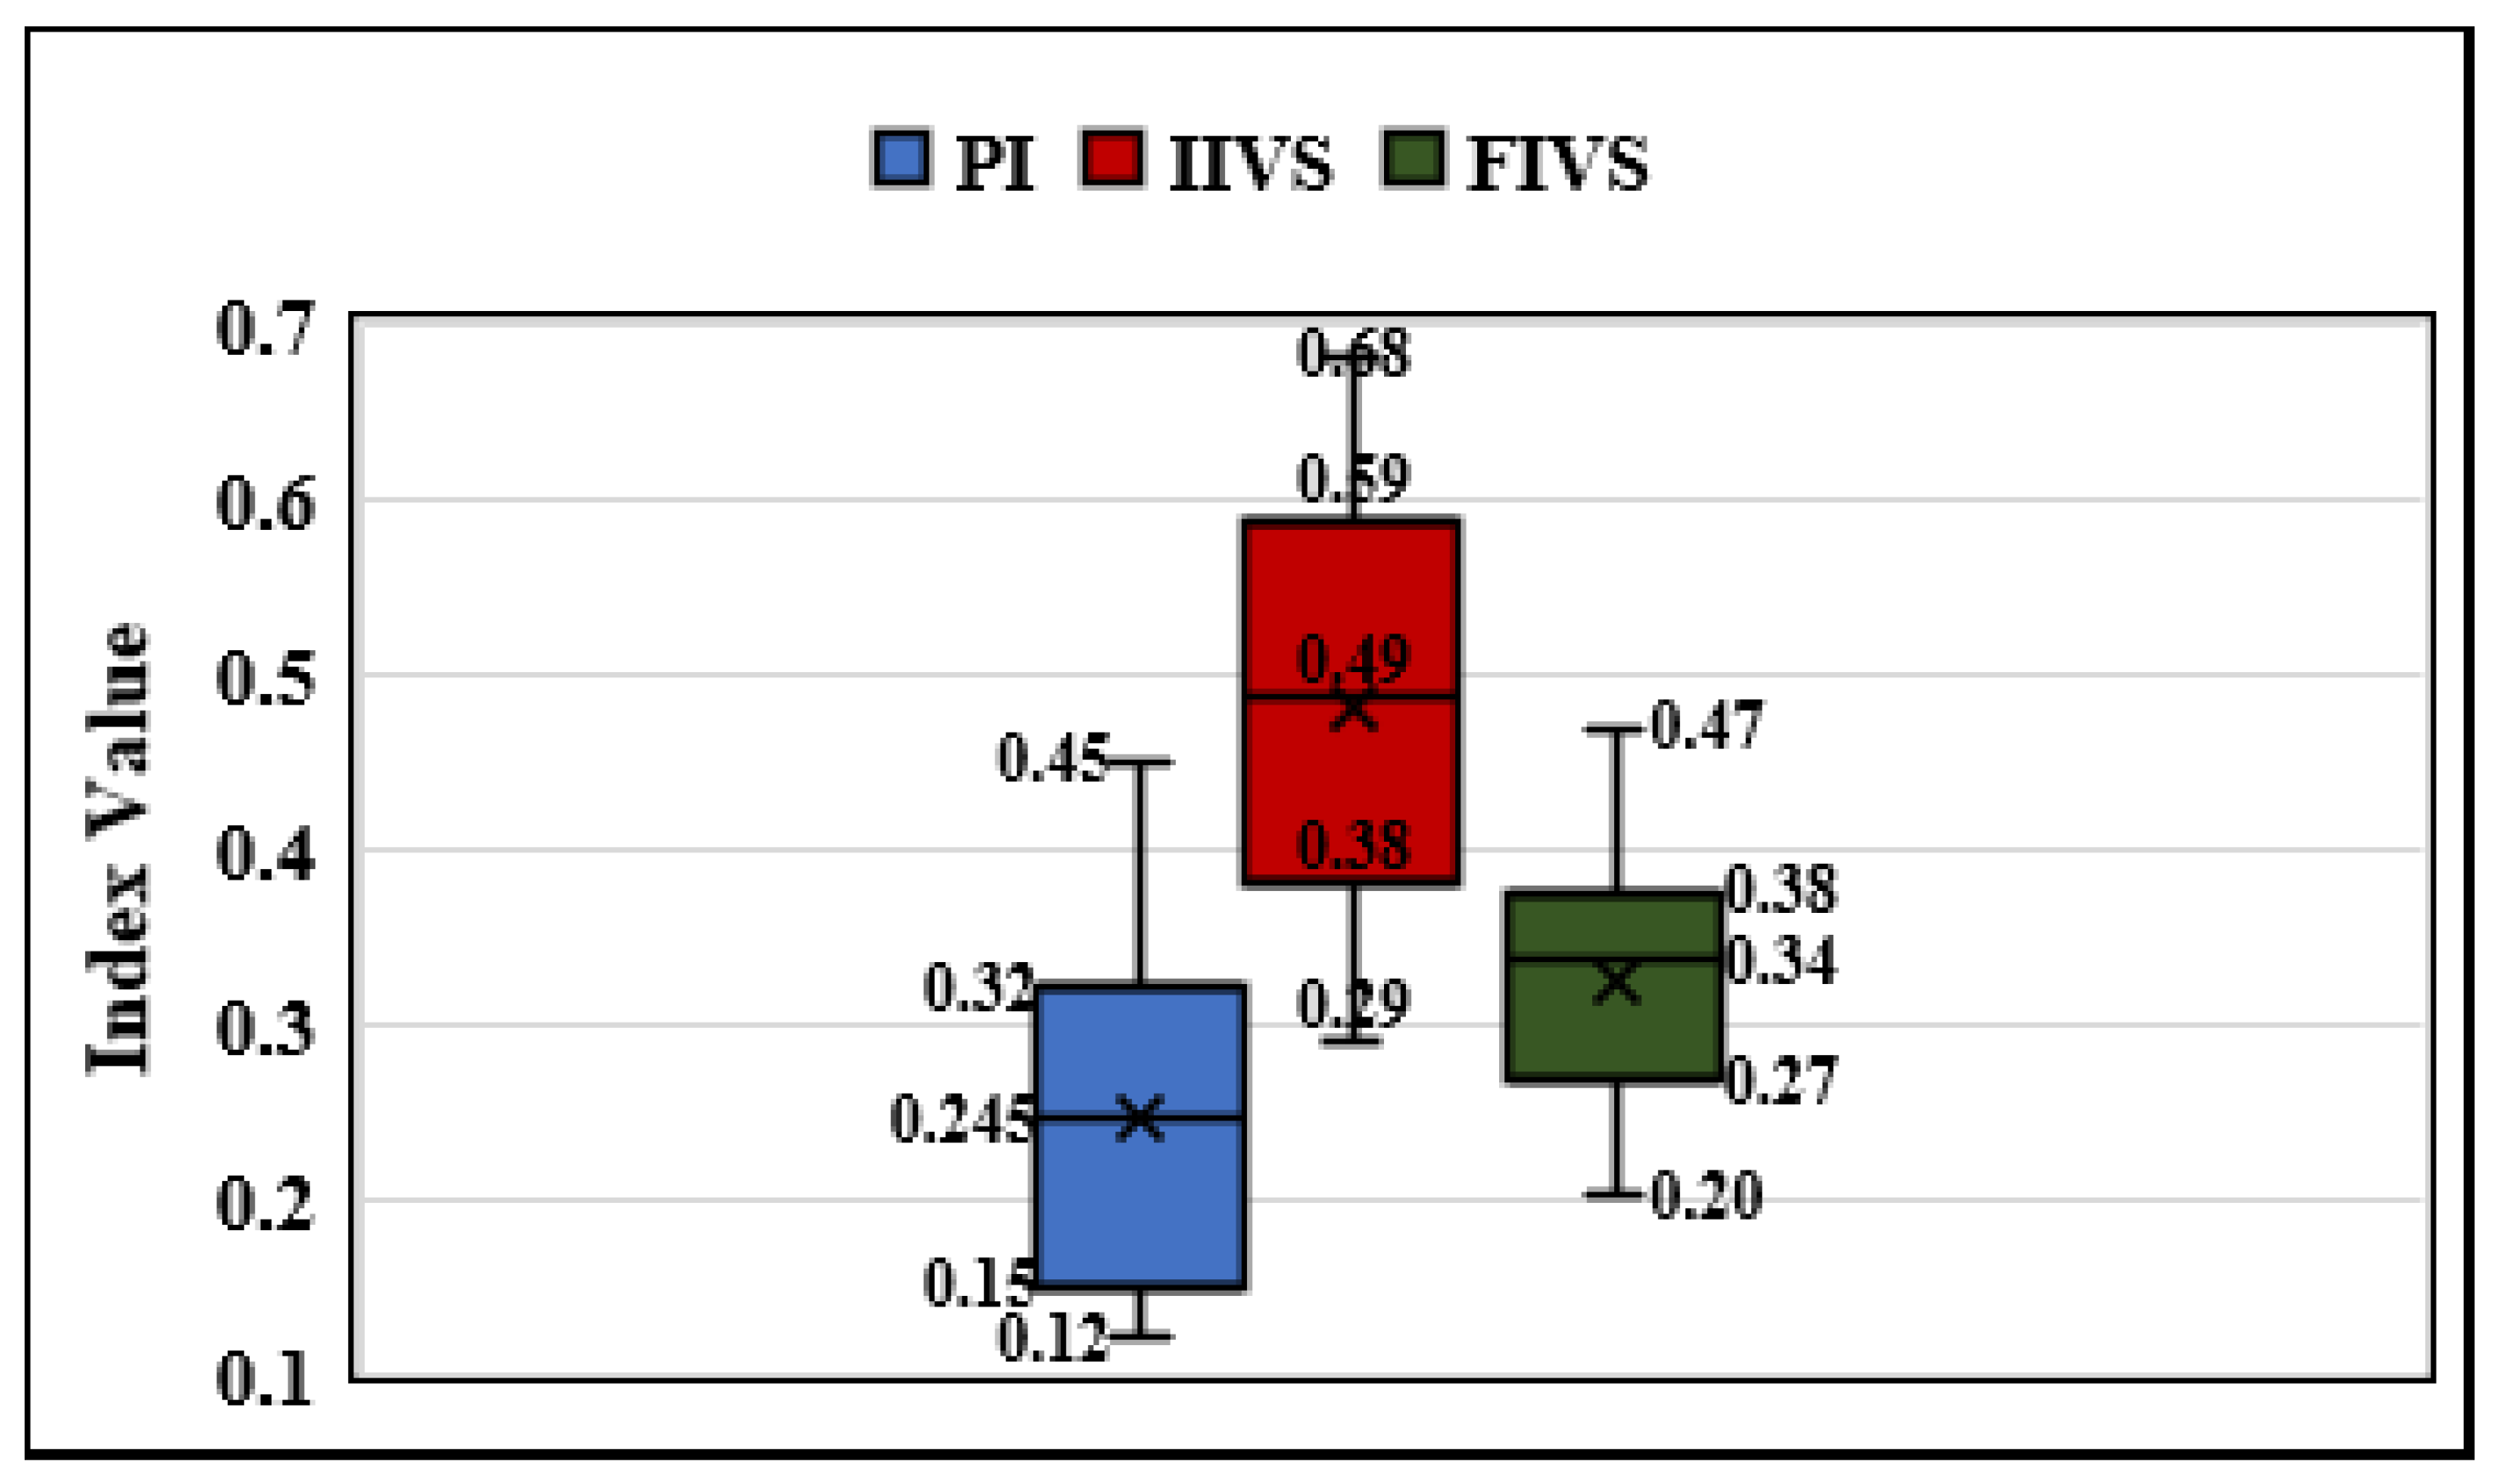
9.2. Box Plot Analysis

The boxplot can offer a fast-visual summary that easily describes data characteristics such as the center, range, and any points located outliers (Tukey 1977). On the whole, the box contains half of the data and the higher edge of the box shows the three-quarters percentile, while the lower edge represents the quarter percentile. The median can be denoted by a line drawn in the intermediate of the box. The data range (minimum and maximum values of the data sets) can be represented by ends two lines unless the data contain outliers’ values. The outliers are represented by remarks placed below the value of Q1− 1.5(IQR) or above the value of Q3 + 1.5(IQR), where Q1 is the quarter percentile, Q3 is the three quarters percentile, and IQR can be calculated as the difference between Q3 and Q1. The outliers are categorized on the graph with a small circle or point above or below the range.
In this study, a boxplot analysis is drawn as shown in Figure 4 for the purpose of summarizing and comparing the groups of data for the three indices. It is noted that there are no outliers for all indices which indicate that all values are reliable and close. The extreme values appear in the IIVS whereas the smallest values appear in PI. On the other hand, the maximum range value was for IIVS (0.39) followed by PI (0.33) whereas the lowest range value is for FIVS (0.27).

9.3. Risk Groups Analysis

Table 5 summarizes the statistical data for the model output (FIVS) for the 9 identified risk groups. It is noticed that the maximum number of risk factors were in Group 05 (Early preventive actions) while Group 02 (Travel within the country) and Group 06 (Health conditions) are affected by 3 factors only for each group representing minimum risk factor number in a group. However, the maximum mean is for Group 03 (Daily activities) with a value 0.43 followed by Group 04 (Home isolation), while lowest mean value (0.271) is for Group 09. Although Group 05 contains maximum number of risk factors (12 factors), however it does not represent the largest range. On the other hand, Group 07 represents greater range while it contains 4 risk factors only. According to mean values, it can be concluded that Group 03 is the riskiest group followed by Group 04. Although Group 05 does not have a high mean value, it is considered a very important group due to the high number of risk factors controlling such a group.

10. Applying the Model to Other Case Studies

The following steps summarize the application of the proposed model in other countries, or different case studies:
  • Identifying all risk factors affecting the epidemic. The risk factors and risk groups defined in this study may be suitable and can be utilized and modified.
  • Defining the objectives which will be affected by the epidemic such as virus spread.
  • Collecting data concern the risk factors characteristics such as probability of occurrence and the impact on the identified objectives.
  • Defining the logical rules and the relation among inputs and the output as introduced in the proposed model.
  • Applying the model on all risk factors and studying the results to support any required decisions.

11. Conclusions

This research presents a new qualitative risk analysis model created on a fuzzy logic tool to evaluate the risk factors affecting COVID-19’s spread. The model is developed to assess and prioritize the identified risk factors by relating the probability of the occurrence and impact on COVID-19 spread. Based on literature and field surveys, 46 risk factors were identified and categorized under nine risk groups. The model uses 25 logical rules for describing the relations among risk factors. Three new indices were developed to represent inputs and outputs of the model. The model has been tested and verified in Saudi Arabia. Conclusions from this study can be specified as follows:
  • Poor social distance and overcrowding are the most important risk factors. On the level of risk groups, (daily activities) is the most important risk group followed by (Home isolation) risk group.
  • Although risk group (Early preventive actions) was affected by 12 risk factors which give it great importance, the impact of such group is insignificant. This result is achieved due to the application of preventive measures by the Saudi government.
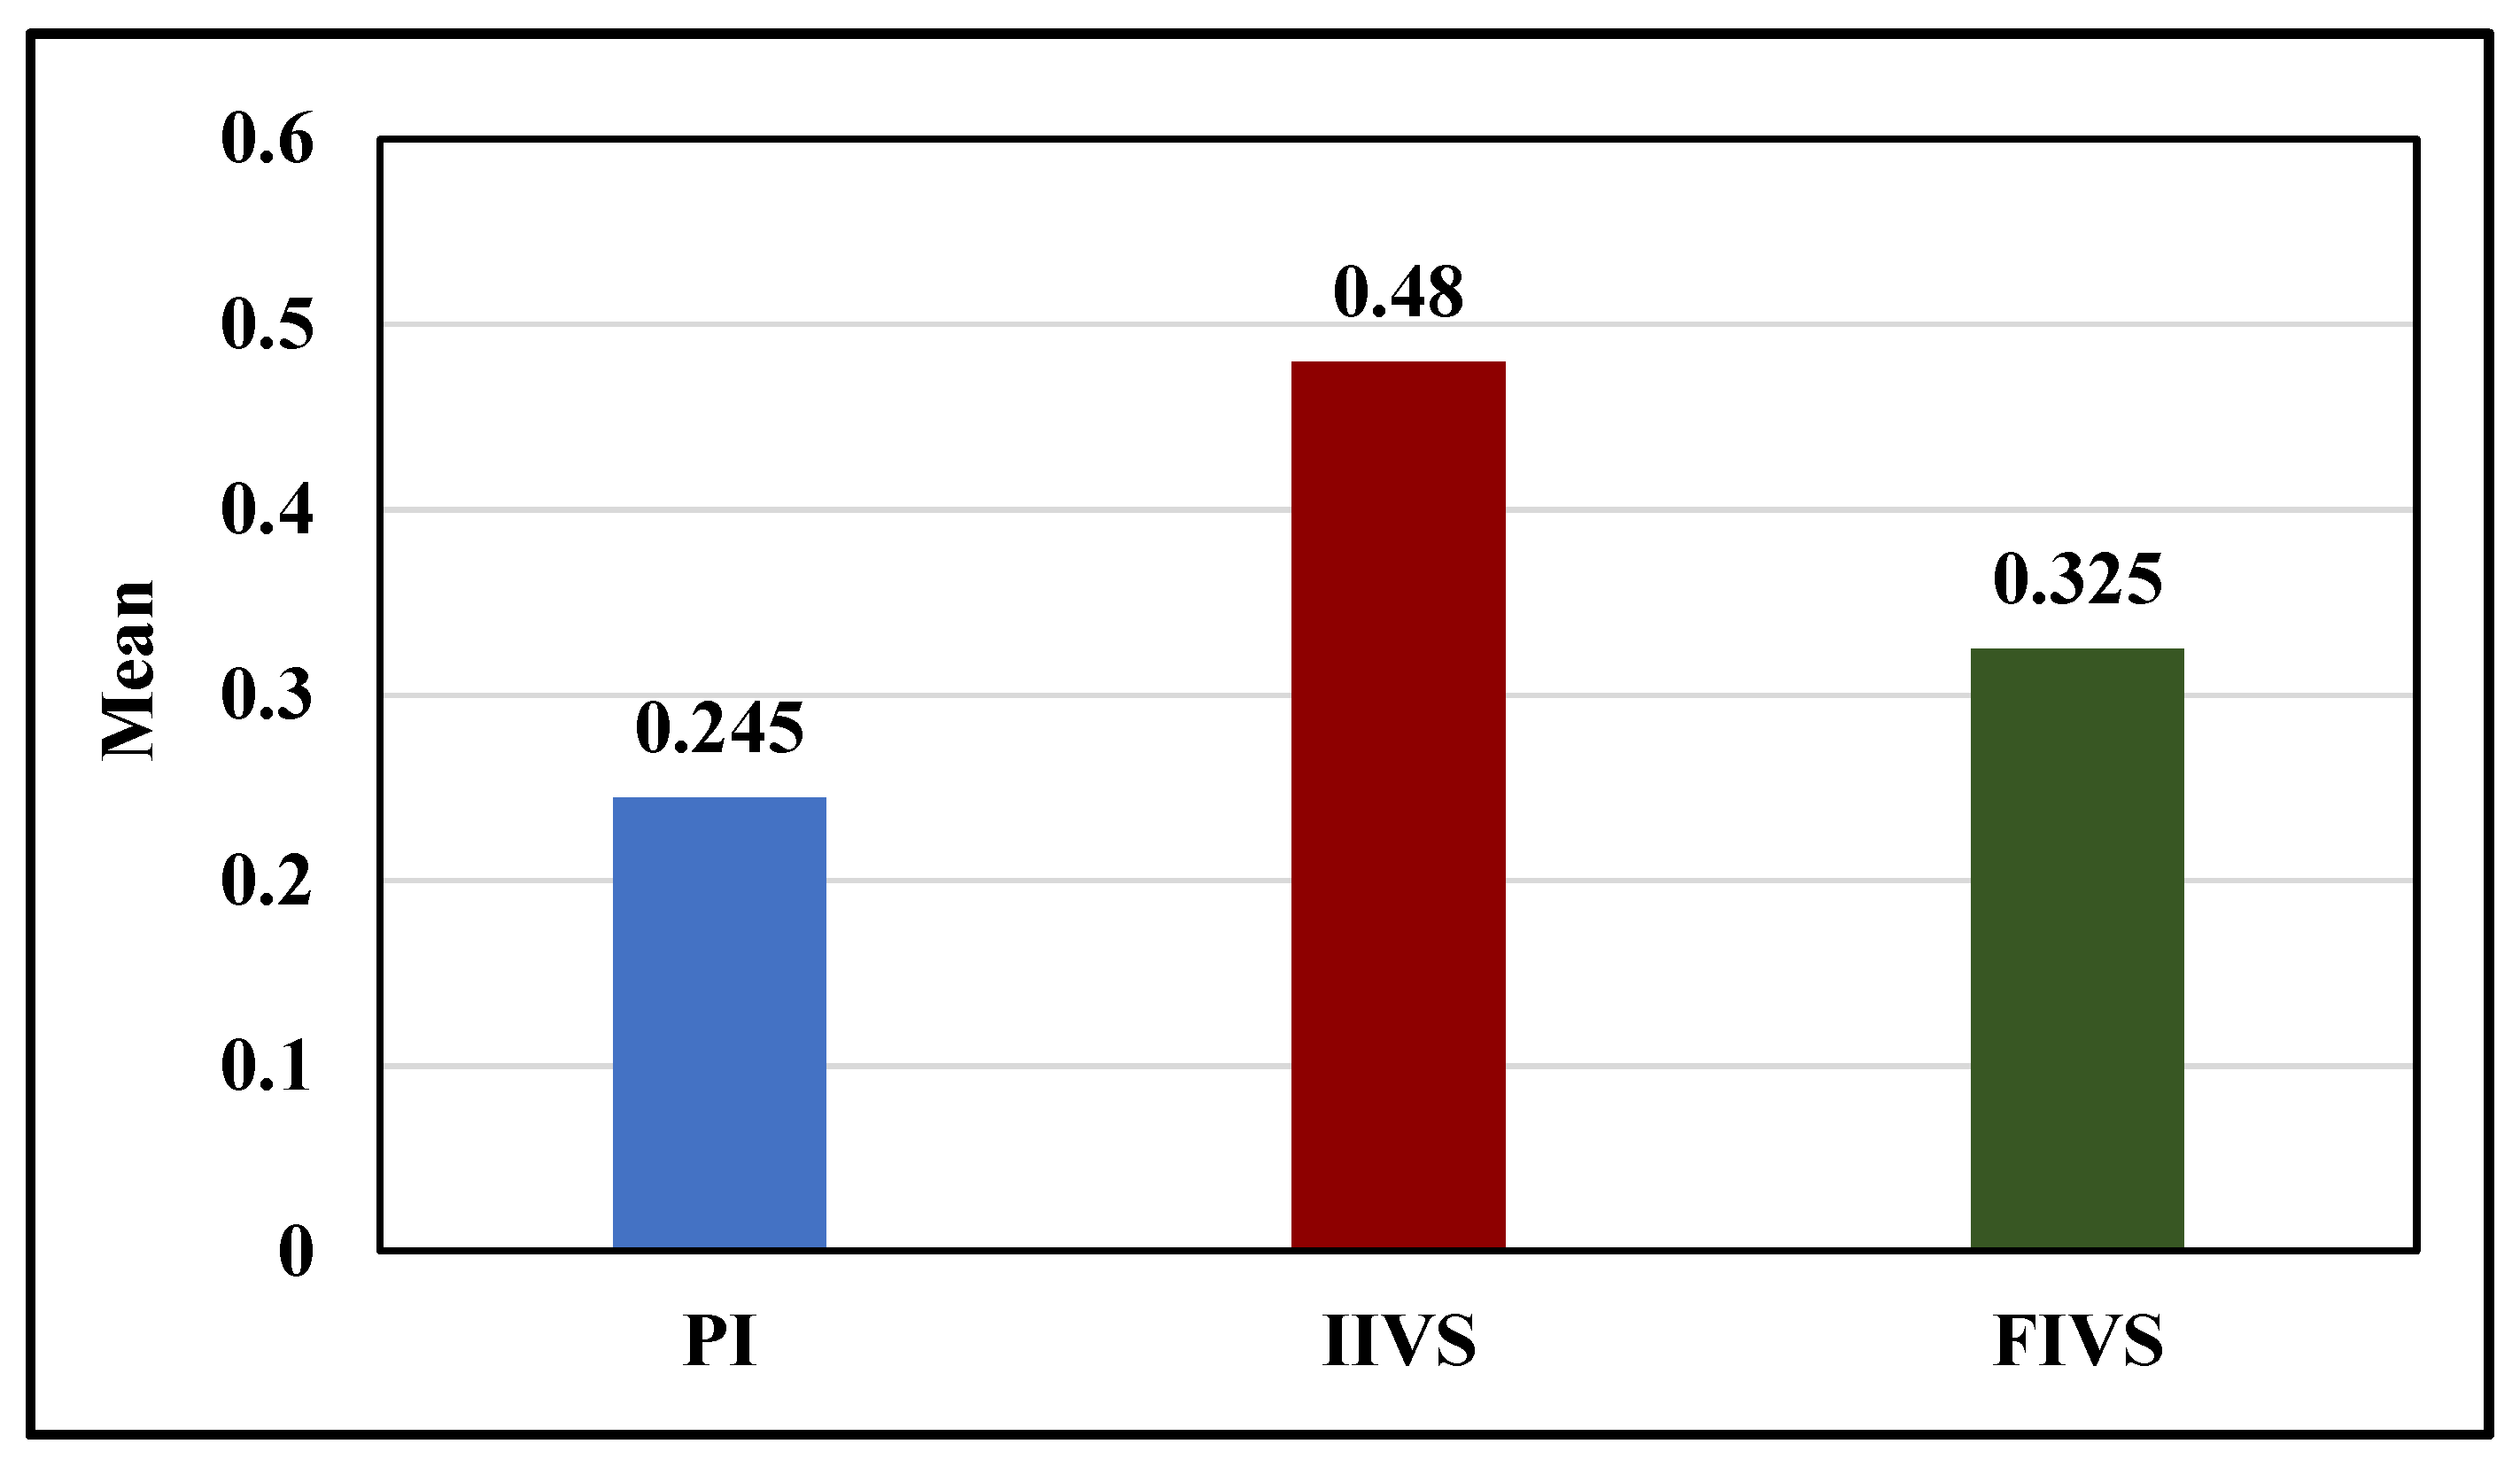
  • By studying the statistical results due to relation among the three developed indices, it was concluded that average mean for IIVS represents the maximum value among the three indices followed by FIVS, then PI. On the other hand, the maximum range value is for IIVS followed by PI, while the lowest value is for FIVS. The maximum values for risk factors appear in the IIVS and minimum values appear in PI. There is significant correlation between IIVS and FIVS while the correlation between PI and FIVS is positive with no significance. In contrast, it can be noted that there is no association between PI and IIVS.
  • The existing model can be applied in all countries using slight modifications and it is not restricted to Saudi Arabia. Applying the fuzzy logic technique appended flexibility and ease of usage in addressing the problem.
  • It is recommended that in medical health facilities key risk factors obtainable in this study to be considered as well as the proposed model for the assessment of risk factors affecting any virus’s spread.
  • As the proposed model represents a new technique in epidemics science, it is recommended for extending this work to cover risk management processes. The proposed model determines the qualitative effect only for the risk factors for COVID-19’s spread, so the model should be extended to cover quantitative risk analysis. Furthermore, the model should be studied to support decisions based on quantitative risk analysis to solve many epidemic problems.

Author Contributions

Data curation, U.H.I. and M.A.; Formal analysis, A.B. and M.M.A.O.; Funding acquisition, M.A.; Investigation, U.H.I.; Methodology, U.H.I.; Project administration, A.B.; Software, U.H.I.; Writing—original draft, M.M.A.O.; Writing—review and editing, M.A. All authors have read and agreed to the published version of the manuscript.

Funding

This research was funded by the Deanship of Scientific Research, Taif University, Saudi Arabia grant number (49-441-1). The authors appreciate the financial support of this respected organization.

Institutional Review Board Statement

Not applicable.

Informed Consent Statement

Not applicable.

Data Availability Statement

Not applicable.

Conflicts of Interest

The authors declare no conflict of interest.

References

  1. Aldila, Dipo, Sarbaz H. A. Khoshnaw, Egi Safitri, Yusril Rais Anwar, Aanisah R. Q. Bakry, Brenda M. Samiadji, Demas A. Anugerah, M. Farhan Alfarizi Gh, Indri D. Ayulani, and Sheryl N. Salim. 2020. A Mathematical Study on the Spread of COVID-19 Considering Social Distancing and Rapid Assessment: The Case of Jakarta, Indonesia. Chaos, Solitons & Fractals 139: 110042. [Google Scholar] [CrossRef]
  2. Alshammari, Thamir M., Ali F. Altebainawi, and Khalidah A. Alenzi. 2020. Importance of Early Precautionary Actions in Avoiding the Spread of COVID-19: Saudi Arabia as an Example. Saudi Pharmaceutical Journal 28: 898–902. [Google Scholar] [CrossRef] [PubMed]
  3. Alzahrani, Saleh I., Ibrahim A. Aljamaan, and Ebrahim A. Al-Fakih. 2020. Forecasting the Spread of the COVID-19 Pandemic in Saudi Arabia Using ARIMA Prediction Model under Current Public Health Interventions. Journal of Infection and Public Health 13: 914–19. [Google Scholar] [CrossRef]
  4. Arji, Goli, Hossein Ahmadi, Mehrbakhsh Nilashi, Tarik A. Rashid, Omed Hassan Ahmed, Nahla Aljojo, and Azida Zainol. 2019. Fuzzy Logic Approach for Infectious Disease Diagnosis: A Methodical Evaluation, Literature and Classification. Biocybernetics and Biomedical Engineering 39: 937–55. [Google Scholar] [CrossRef]
  5. Ceylan, Zeynep. 2020. Estimation of COVID-19 Prevalence in Italy, Spain, and France. Science of The Total Environment 729: 138817. [Google Scholar] [CrossRef]
  6. Coşkun, Hamit, Nazmiye Yıldırım, and Samettin Gündüz. 2021. The Spread of COVID-19 Virus through Population Density and Wind in Turkey Cities. Science of The Total Environment 751: 141663. [Google Scholar] [CrossRef]
  7. Crotta, Matteo, Antonio Lavazza, Ana Mateus, and Javier Guitian. 2018. Quantitative Risk Assessment of Hepatitis E Virus: Modelling the Occurrence of Viraemic Pigs and the Presence of the Virus in Organs of Food Safety Interest. Microbial Risk Analysis 9: 64–71. [Google Scholar] [CrossRef] [Green Version]
  8. Dai, Zhichu, Kitling Fan, Li Zhang, Meixiang Yang, Qingqin Yu, Lichang Liu, and Lingpong Leung. 2020. Risk Factors for Influenza B Virus–Associated Pneumonia in Adults. American Journal of Infection Control 48: 194–98. [Google Scholar] [CrossRef] [PubMed]
  9. Hossain, M. Pear, Alvin Junus, Xiaolin Zhu, Pengfei Jia, Tzai-Hung Wen, Dirk Pfeiffer, and Hsiang-Yu Yuan. 2020. The Effects of Border Control and Quarantine Measures on the Spread of COVID-19. Epidemics 32: 100397. [Google Scholar] [CrossRef] [PubMed]
  10. Huang, Lei, Xiuwen Zhang, Xinyue Zhang, Zhijian Wei, Lingli Zhang, Jingjing Xu, Peipei Liang, Yuanhong Xu, Chengyuan Zhang, and Aman Xu. 2020. Rapid Asymptomatic Transmission of COVID-19 during the Incubation Period Demonstrating Strong Infectivity in a Cluster of Youngsters Aged 16-23 Years Outside Wuhan and Characteristics of Young Patients with COVID-19: A Prospective Contact-Tracing Study. Journal of Infection 80: e1–e13. [Google Scholar] [CrossRef]
  11. Iqbal, Muhammad Mazhar, Irfan Abid, Saddam Hussain, Naeem Shahzad, Muhammad Sohail Waqas, and Muhammad Jawed Iqbal. 2020. The Effects of Regional Climatic Condition on the Spread of COVID-19 at Global Scale. Science of The Total Environment 739: 140101. [Google Scholar] [CrossRef]
  12. Issa, Usama Hamed. 2012a. Developing an Assessment Model for Factors Affecting the Quality in the Construction Industry. Journal of Civil Engineering and Architecture 6: 364–71. [Google Scholar] [CrossRef] [Green Version]
  13. Issa, Usama Hamed. 2012b. A Model for Time Overrun Quantification in Construction of Industrial Projects Based on Risk Evaluation. Journal of American Science 8: 523–29. [Google Scholar]
  14. Issa, Usama H., and Aly Ahmed. 2014. On the Quality of Driven Piles Construction Based on Risk Analysis. International Journal of Civil Engineering 12: 121–29. [Google Scholar]
  15. Issa, Usama Hamed, Aly Ahmed, and Keizo Ugai. 2013. A Decision Support System for Ground Improvement Projects Using Gypsum Waste Case Study: Embankments Construction in Japan. Civil and Environmental Research 3: 74–84. [Google Scholar]
  16. Issa, Usama Hamed, Salah Attia Mosaad, and Mohamed Salah Hassan. 2019. A Model for Evaluating the Risk Effects on Construction Project Activities. Journal of Civil Engineering and Management 25: 687–99. [Google Scholar] [CrossRef]
  17. Kindhi, Berlian Al, Tri Arief Sardjono, Mauridhi Hery Purnomo, and Gijbertus Jacob Verkerke. 2019. Hybrid K-Means, Fuzzy C-Means, and Hierarchical Clustering for DNA Hepatitis C Virus Trend Mutation Analysis. Expert Systems with Applications 121: 373–81. [Google Scholar] [CrossRef]
  18. Liebetrau, Albert M. 1983. Measures of Association. Newcastle upon Tyne: SAGE. [Google Scholar]
  19. Lin, Jun, Weihao Huang, Muchen Wen, Dehong Li, Shuyi Ma, Jiawen Hua, Hang Hu, Shan Yin, Yanjun Qian, Peiling Chen, and et al. 2020. Containing the Spread of Coronavirus Disease 2019 (COVID-19): Meteorological Factors and Control Strategies. Science of The Total Environment 744: 140935. [Google Scholar] [CrossRef]
  20. Ma, Yueling, Yadong Zhao, Jiangtao Liu, Xiaotao He, Bo Wang, Shihua Fu, Jun Yan, Jingping Niu, Ji Zhou, and Bin Luo. 2020. Effects of Temperature Variation and Humidity on the Death of COVID-19 in Wuhan, China. Science of The Total Environment 724: 138226. [Google Scholar] [CrossRef]
  21. Massad, Eduardo, Marcelo Nascimento Burattini, and Neli Regina Ortega. 1999. Fuzzy Logic and Measles Vaccination: Designing a Control Strategy. International Journal of Epidemiology 28: 550–57. [Google Scholar] [CrossRef] [PubMed] [Green Version]
  22. Ndaïrou, Faïçal, Iván Area, Juan J. Nieto, and Delfim F. M. Torres. 2020. Mathematical Modeling of COVID-19 Transmission Dynamics with a Case Study of Wuhan. Chaos, Solitons & Fractals 135: 109846. [Google Scholar] [CrossRef]
  23. Novák, Vilém, and Stephan Lehmke. 2006. Logical Structure of Fuzzy IF-THEN Rules. Fuzzy Sets and Systems 157: 2003–29. [Google Scholar] [CrossRef]
  24. Oliveira, Ana R. S., José Piaggio, Lee W. Cohnstaedt, D. Scott McVey, and Natalia Cernicchiaro. 2018. A Quantitative Risk Assessment (QRA) of the Risk of Introduction of the Japanese Encephalitis Virus (JEV) in the United States via Infected Mosquitoes Transported in Aircraft and Cargo Ships. Preventive Veterinary Medicine 160: 1–9. [Google Scholar] [CrossRef]
  25. Pasalari, Hasan, Angila Ataei-Pirkooh, Mahdi Aminikhah, Ahmad Jonidi Jafari, and Mahdi Farzadkia. 2019. Assessment of Airborne Enteric Viruses Emitted from Wastewater Treatment Plant: Atmospheric Dispersion Model, Quantitative Microbial Risk Assessment, Disease Burden. Environmental Pollution 253: 464–73. [Google Scholar] [CrossRef] [PubMed]
  26. Pereira, Claudia Cristina de Aguiar, Carla Jorge Machado, and Roberto do Nascimento Rodrigues. 2007. Profiles of multiple causes of death related to HIV/AIDS in the cities of São Paulo and Santos, Brazil, 2001. Cadernos de Saude Publica 23: 645–55. [Google Scholar] [CrossRef] [PubMed] [Green Version]
  27. Reyna, Valerie F., and Mary B. Adam. 2003. Fuzzy-Trace Theory, Risk Communication, and Product Labeling in Sexually Transmitted Diseases. Risk Analysis: An Official Publication of the Society for Risk Analysis 23: 325–42. [Google Scholar] [CrossRef]
  28. Robson, Barry. 2020. COVID-19 Coronavirus Spike Protein Analysis for Synthetic Vaccines, a Peptidomimetic Antagonist, and Therapeutic Drugs, and Analysis of a Proposed Achilles’ Heel Conserved Region to Minimize Probability of Escape Mutations and Drug Resistance. Computers in Biology and Medicine 121: 103749. [Google Scholar] [CrossRef]
  29. Saadat, Saeida, Deepak Rawtani, and Chaudhery Mustansar Hussain. 2020. Environmental Perspective of COVID-19. Science of The Total Environment 728: 138870. [Google Scholar] [CrossRef]
  30. Shiina, Akihiro, Tomihisa Niitsu, Osamu Kobori, Keita Idemoto, Tasuku Hashimoto, Tsuyoshi Sasaki, Yoshito Igarashi, Eiji Shimizu, Michiko Nakazato, Kenji Hashimoto, and et al. 2020. Relationship between Perception and Anxiety about COVID-19 Infection and Risk Behaviors for Spreading Infection: A National Survey in Japan. Brain, Behavior, & Immunity-Health 6: 100101. [Google Scholar] [CrossRef]
  31. Tah, Joseph H. M., and V. Carr. 2000. A Proposal for Construction Project Risk Assessment Using Fuzzy Logic. Construction Management and Economics 18: 491–500. [Google Scholar] [CrossRef]
  32. Tah, Joseph H. M., and V. Carr. 2001. Knowledge-Based Approach to Construction Project Risk Management. Journal of Computing in Civil Engineering 15: 170–77. [Google Scholar] [CrossRef]
  33. Teng, Yue, Dehua Bi, Guigang Xie, Yuan Jin, Yong Huang, Baihan Lin, Xiaoping An, Yigang Tong, and Dan Feng. 2017. Model-Informed Risk Assessment for Zika Virus Outbreaks in the Asia-Pacific Regions. Journal of Infection 74: 484–91. [Google Scholar] [CrossRef] [Green Version]
  34. Thukral, Sunny, and Vijay Rana. 2019. Versatility of Fuzzy Logic in Chronic Diseases: A Review. Medical Hypotheses 122: 150–56. [Google Scholar] [CrossRef]
  35. Tukey, John W. 1977. Exploratory Data Analysis. London: Pearson. [Google Scholar]
  36. Varotsos, Costas A., and Vladimir F. Krapivin. 2020. A New Model for the Spread of COVID-19 and the Improvement of Safety. Safety Science 132: 104962. [Google Scholar] [CrossRef] [PubMed]
  37. Vieira, Luciana Cristina Pompeo Ferreira da Silva, Paloma Maria da Silva Rocha Rizol, and Luiz Fernando Costa Nascimento. 2019. Fuzzy Logic and Hospital Admission Due to Respiratory Diseases Using Estimated Values by Mathematical Model. Ciencia & Saude Coletiva 24: 1083–90. [Google Scholar]
  38. Xia, Xiao-ying, Jing Wu, He-lei Liu, Hong Xia, Bei Jia, and Wen-xiang Huang. 2020. Epidemiological and Initial Clinical Characteristics of Patients with Family Aggregation of COVID-19. Journal of Clinical Virology 127: 104360. [Google Scholar] [CrossRef]
  39. Yan, Qinling, Yingling Tang, Dingding Yan, Jiaying Wang, Linqian Yang, Xinpei Yang, and Sanyi Tang. 2020. Impact of Media Reports on the Early Spread of COVID-19 Epidemic. Journal of Theoretical Biology 502: 110385. [Google Scholar] [CrossRef] [PubMed]
  40. Zadeh, Lotfi A. 2008. Is There a Need for Fuzzy Logic? Information Sciences 178: 2751–79. [Google Scholar] [CrossRef]
Figure 1. The main phases in fuzzy logic method.
Risks 09 00038 g001
Figure 2. Membership functions used for proposed model.
Risks 09 00038 g002
Figure 3. The average mean for the three indices.
Risks 09 00038 g003
Figure 4. Boxplot analysis for groups of data of the inputs and output indices.
Risks 09 00038 g004
Table 1. The identified risk factors affecting the spread of coronavirus disease 2019 (COVID-19) under 9 groups.
Factor No. Risk Factor
Risk Group 01: Travel Abroad
1Destination: To far places or to area with high epidemics
2Transit
3Long duration and Prolonged stay
4High contact rate between passengers and crews
5Poor compliance to personal protective measures
6Cheap flights or using economic class
Risk Group 02: Travel Within the Country
7Far destination
8Crowded public transport
9Poor compliance to personal protective measures
Risk Group 03: Daily activities
10Poor social distance
11Poor compliance to personal protective measures
12Crowdedness
13Reusable items
Risk Group 04: Home Isolation
14Lack of consciousness
15Poor Personal hygiene practices
16Lack of separate healthy isolation room
17Lack of single use items
18Lack of awareness and compliance of contacts at home
Risk Group 05: Early Preventive Actions
19Late border control and quarantine measures
20Incomplete restriction of international and domestic flights
21Poor screening programme
22Shortage of surveillance data
23Shortage of protective supplies at health care centers
24Lack of remote health education programme
25Lack of appropriate treatment protocol
26Delayed curfew when needed
27Poor ability for remote/online working
28Lack of areas for isolation and quarantine
29Inappropriate disposal of garbage and sewage
30Lack of financial support
Risk Group 06: Health Conditions
31Underlying health conditions
32Age extremities
33Pregnancy
Risk Group 07: Hospitals and Healthcare Buildings
34Shortage of isolation hospitals
35Lack of PPE supplies
36Shortage of medications and inappropriate treatment protocols
37Lack of infection control programme
Risk Group 08: Meteorological Factors or Microclimatic Conditions
38Poor airflow and ventilation
39High humidity
40inappropriate air temperature
41Lack of exposure to sunlight
Risk Group 09: Socioeconomic Status
42Lack of financial support
43Inappropriate sick leave system
44Lack of remote health education
45Low Per capita income level
46Low level of culture and education
Table 2. Fuzzy associative memories (FAMs) rules and linguistic variables for inputs and output of the proposed model.
ScaleImpact on COVID-19 Spread
RareUnlikelyModerateLikelyVery Likely
ProbabilityTrivialVery LowVery LowLowLowMedium
MinorVery LowLowLowMediumMedium
ModerateLowLowMediumMediumHigh
MajorLowMediumMediumHighVery High
ExtremeMediumMediumHighVery HighVery High
Table 3. Severity Index for Virus’s Spread (SIVS) and Fuzzy Index for Virus’s Spread (FIVS) values and ranking for all identified risk factors affecting COVID-19 spread.
Factor No. Group No.Risk FactorPIIIVSSIVSFIVSRank Due to FIVS
10G03Poor social distance0.380.680.260.4691
12G03Crowdedness0.390.680.270.4682
15G04Poor Personal hygiene practices 0.290.660.190.4523
14G04Lack of consciousness0.320.630.200.4244
37G07Lack of infection control programme0.310.620.190.4165
11G03Poor compliance to personal protective measures 0.390.620.240.4136
8G02Crowded public transport0.280.610.170.4087
31G06Underlying health conditions0.410.380.160.3878
9G02Poor compliance to personal protective measures 0.310.580.180.3849
18G04Lack of awareness and compliance of contacts at home0.380.530.200.38410
5G01Poor compliance to personal protective measures 0.240.570.140.37611
13G03Reusable items0.320.570.180.37612
27G05Poor ability for remote/online working0.190.550.100.37313
19G05Late border control and quarantine measures 0.150.620.090.36914
16G04Lack of separate healthy isolation room0.340.560.190.36715
25G05Lack of appropriate treatment protocol0.140.580.080.35716
26G05Delayed curfew when needed0.140.560.080.35717
7G02Far destination0.390.330.130.34518
23G05Shortage of protective supplies at health care centers0.130.610.080.34519
35G07Lack of PPE supplies0.130.620.080.34420
41G08Lack of exposure to sunlight0.360.330.120.3421
38G08Poor airflow and ventilation 0.250.530.130.33922
17G04Lack of single use items0.330.490.160.33823
30G05Lack of financial support0.120.610.070.33224
46G09Low level of culture and education0.320.390.120.33225
4G01High contact rate between passengers and crews0.240.520.120.32926
32G06Age extremities0.450.320.140.32827
33G06Pregnancy0.320.330.110.32728
1G01Destination:To far places or to area with high epidemics0.210.510.110.31729
40G08inappropriate air temperature 0.290.320.090.29530
45G09Low Per capita income level0.290.350.100.29531
36G07Shortage of medications and inappropriate treatment protocols0.140.480.070.28332
42G09Lack of financial support0.250.290.070.27633
39G08High humidity 0.250.390.100.27234
20G05Incomplete restriction of international and domestic flights0.140.460.060.26735
6G01Cheap flights or using economic class0.210.380.080.25236
34G07Shortage of isolation hospitals0.140.420.060.23837
24G05Lack of remote health education programme0.150.420.060.23638
28G05Lack of areas for isolation and quarantine0.150.420.060.23639
44G09Lack of remote health education0.120.410.050.23240
29G05Inappropriate disposal of garbage and sewage0.180.410.070.22841
43G09Inappropriate sick leave system0.150.390.060.2242
2G01Transit0.160.320.050.20743
3G01Long duration and Prolonged stay0.160.310.050.20744
22G05Shortage of surveillance data0.120.380.050.20645
21G05Poor screening programme0.150.360.0540.20346
Table 4. Results of Spearman and Kendall tests for risk model inputs and outputs.
Input/OutputPI and IIVSPI and FIVSIIVS and FIVS
Spearmann −0.0010.5580.739
Kendall−0.0040.4130.582
Table 5. The mean and range values for the nine risk groups affecting COVID-19.
Group No.Group NameFactors Numbers in GroupMeanRange
1Travel Abroad60.280.17
2Travel Within the Country30.380.06
3Daily activities40.430.09
4Home Isolation50.390.11
5Early Preventive Actions120.290.17
6Health Conditions30.350.06
7Hospitals and Healthcare Buildings40.320.18
8Meteorological Factors or Microclimatic Conditions 40.310.07
9Socioeconomic Status50.270.11
Publisher’s Note: MDPI stays neutral with regard to jurisdictional claims in published maps and institutional affiliations.

