Smallholder Farmers’ Willingness to Pay for Agricultural Production Cost Insurance in Rural West Java, Indonesia: A Contingent Valuation Method (CVM) Approach

Abstract
:1. Introduction
2. Indonesian Agricultural Production Cost Insurance
3. Methodology
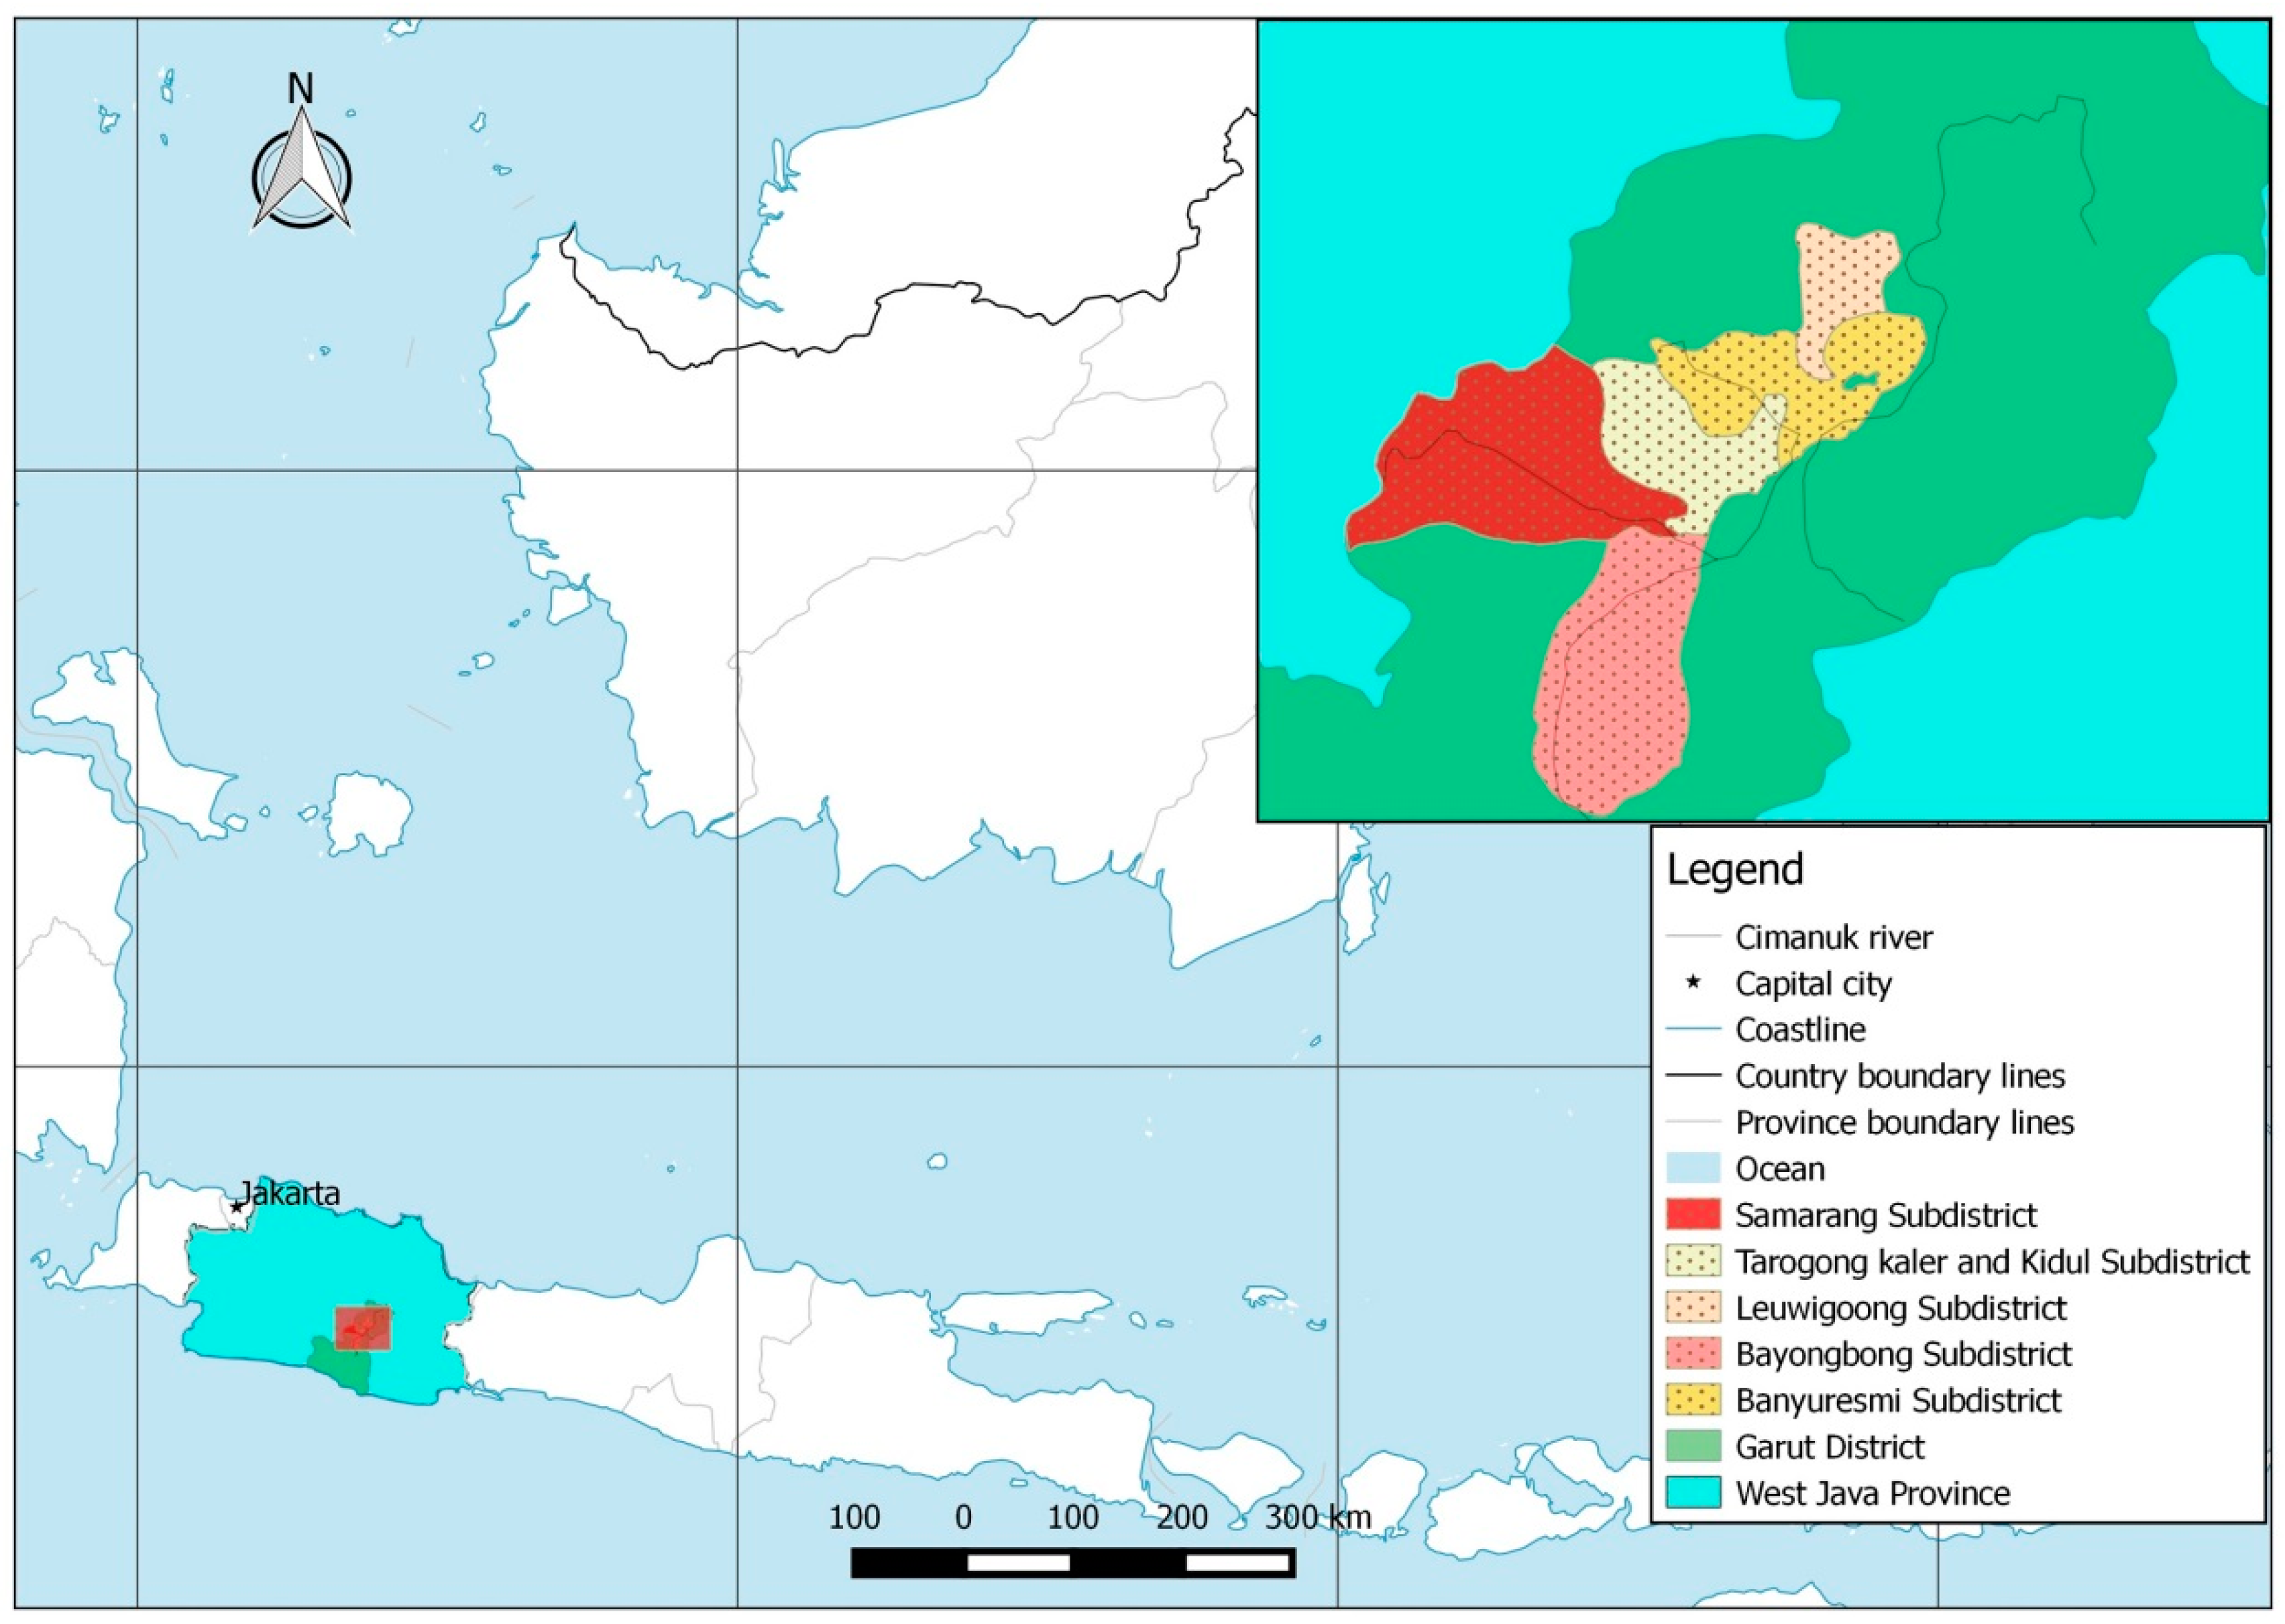
3.1. Area and Data Collection
“The government has a program called ‘agricultural production cost insurance’ for smallholder farmers. Farmers with the insurance will receive the indemnity equal to production cost, Rp 6 mil/ha/cropping season ($444/ha/cropping season), if 75 percent of farmland area under the insurance is destroyed by disasters”.
3.2. CVM and Variables
3.3. Data Analysis
4. Results and Discussion
4.1. Farmers’ Characteristics
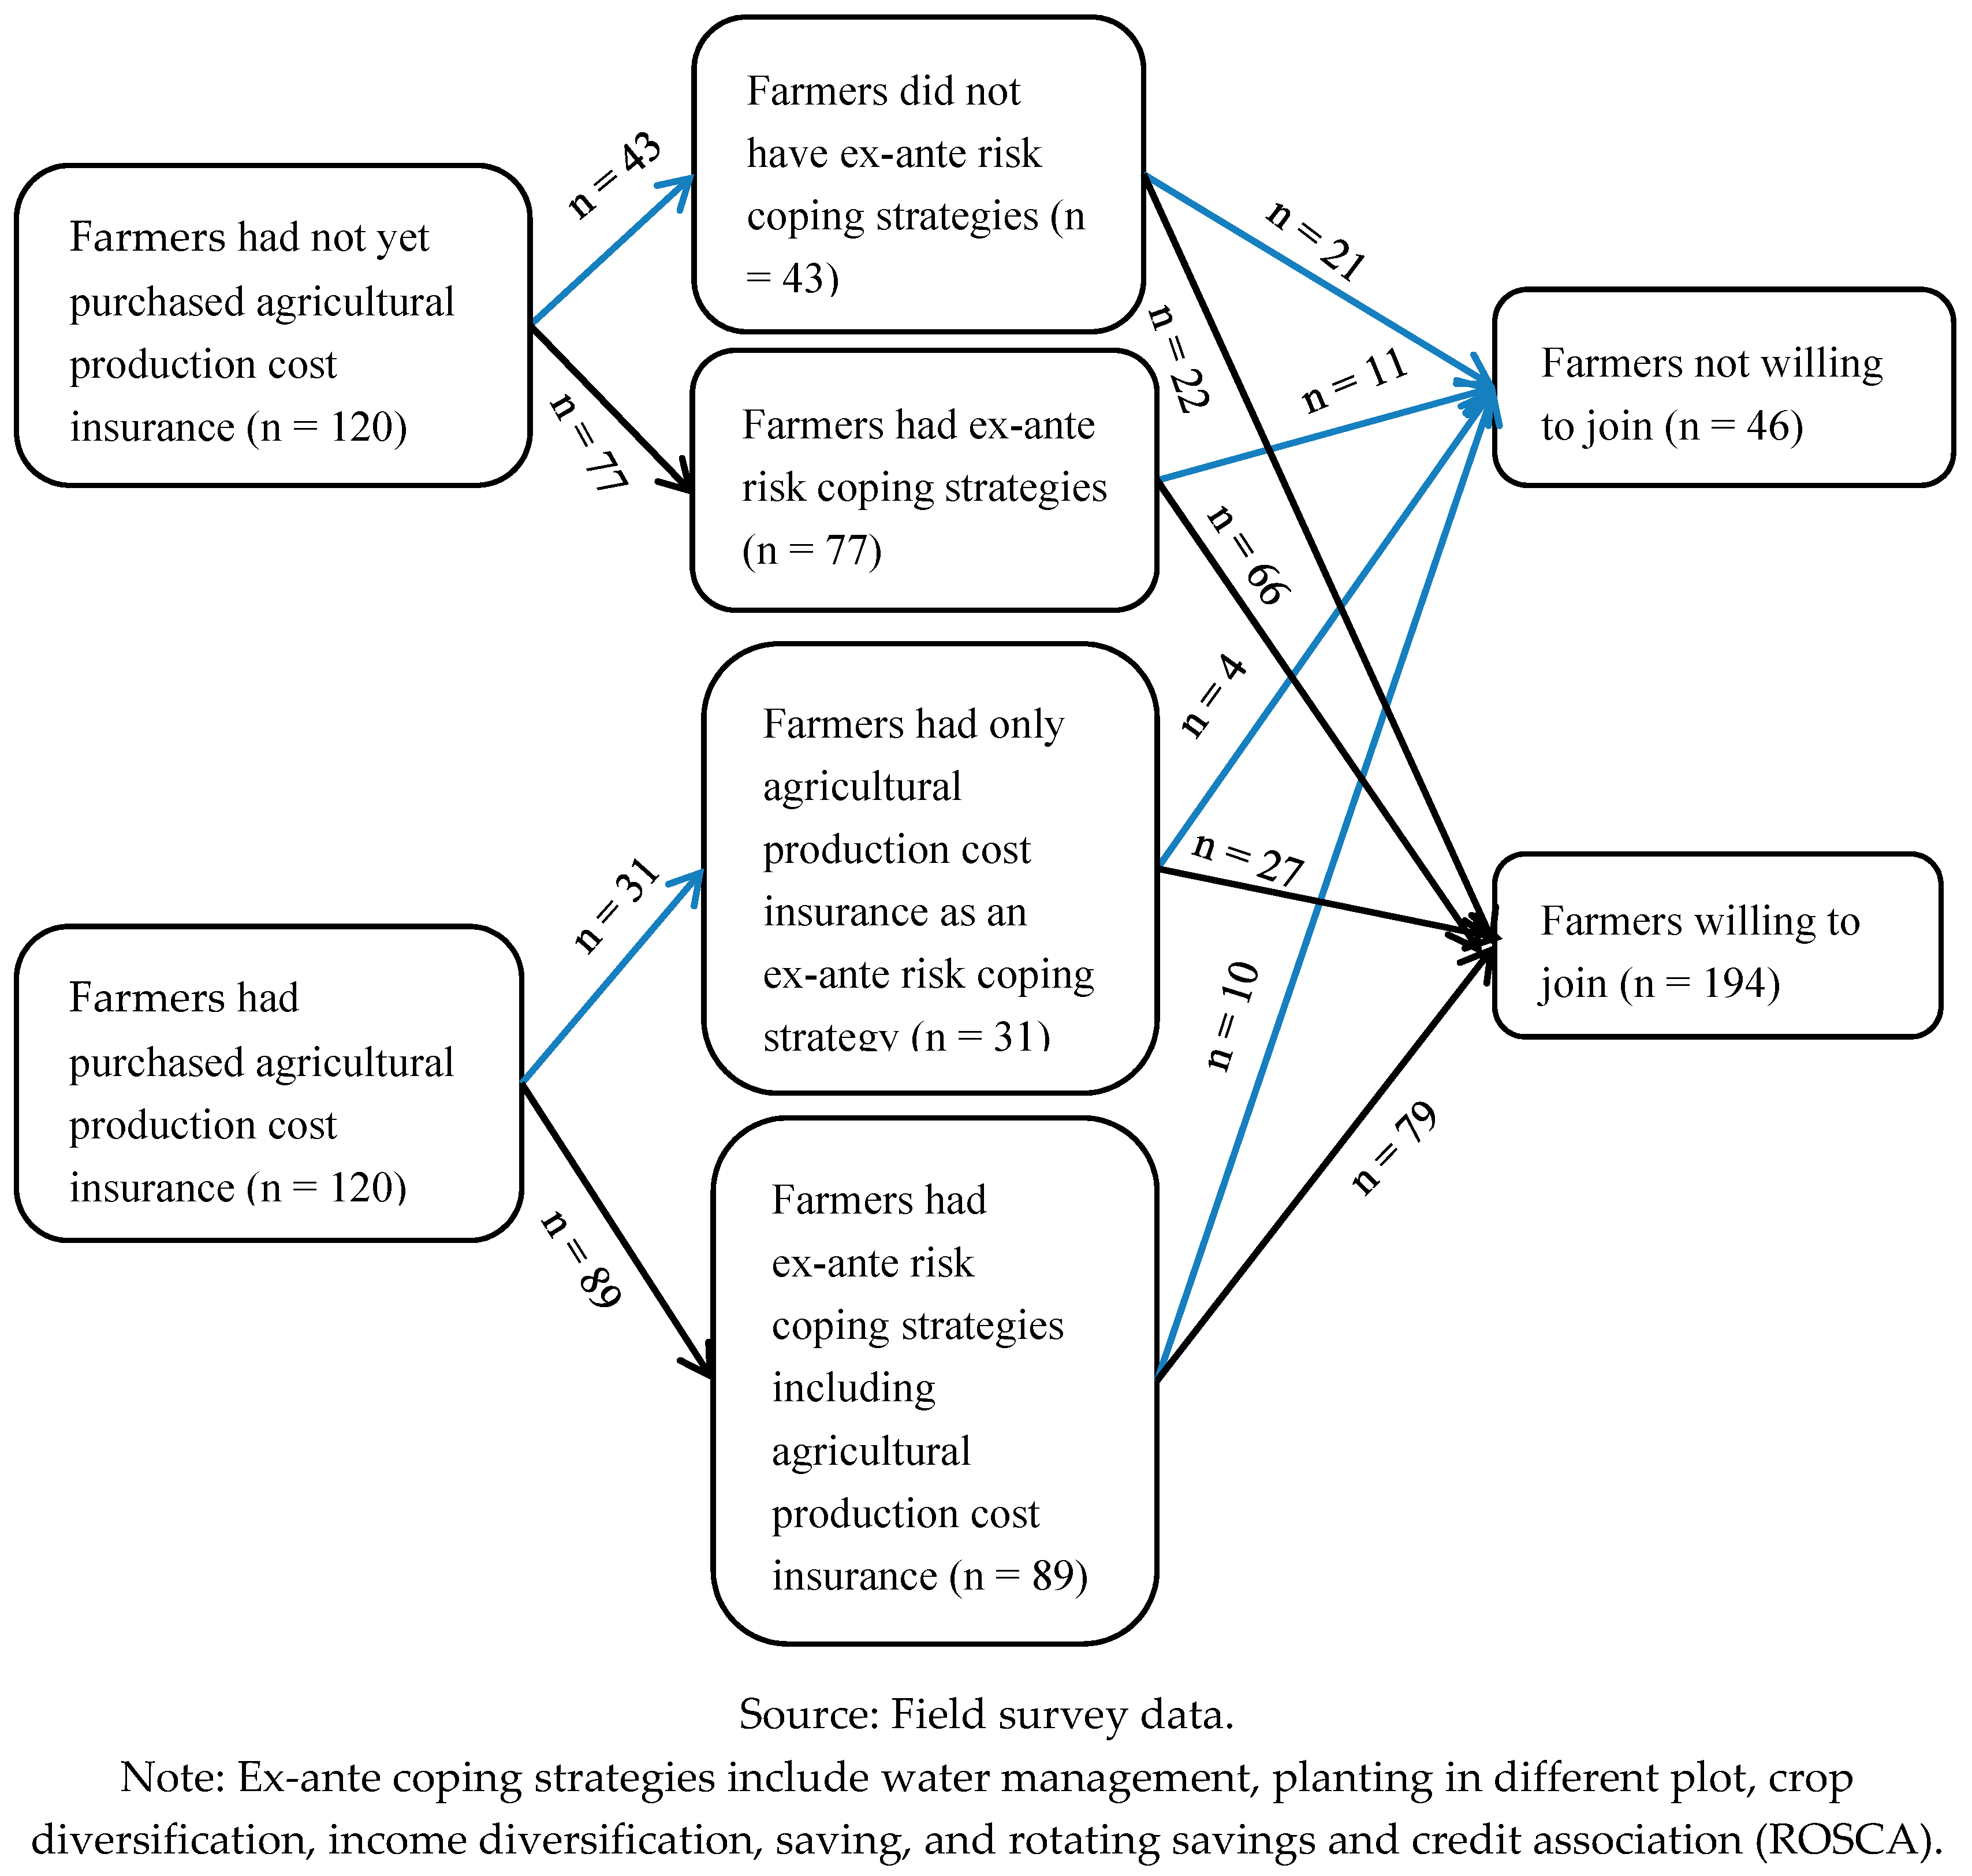
4.2. Farmers’ Willingness to Join
- (1)
- The majority (194 farmers, 80.8 percent) of 240 farmers were willing to pay “in principal join” for agricultural production cost insurance;
- (2)
- Farmers who had not yet purchased agricultural production cost insurance:
- (a)
- Out of 120 farmers who had not yet purchased agricultural production cost insurance, 43 farmers (35.8 percent) had no ex-ante risk coping strategies, of whom 22 farmers (51 percent) were willing to join in the insurance. Therefore, farmers who had the willingness to join and did not have the willingness to join were almost equal;
- (b)
- Farmers who had not yet taken agricultural production cost insurance but had other ex-ante risk coping strategies numbered 77 (64 percent), of whom 66 farmers were willing to join in the insurance. Thus, in this group, farmers who were willing to join in the insurance were a higher number than those who were not.
- (3)
- Farmers who had already purchased agricultural production cost insurance:
- (a)
- Out of 120 farmers who had already purchased the insurance, 31 farmers (25 percent) had taken out only agricultural production cost insurance as an ex-ante coping strategy. Of these 31 farmers, 27 (87 percent) were willing to continue to join in the insurance;
- (b)
- The remaining 89 farmers had more ex-ante coping strategies, including insurance. Seventy-nine farmers (89 percent) of these 89 farmers were willing to join in the insurance.
- (1)
- For farmers who had not yet purchased agricultural production cost insurance, 22 out of 43 farmers (51 percent) who had not adopted any ex-ante risk coping strategies, and 66 farmers out of 77 farmers (85.7 percent) who had already adopted ex-ante risk coping strategy, were willing to join in the insurance;
- (2)
- Among farmers who had already purchased agricultural production cost insurance, 4 out of 31 farmers (12.9 percent) who had only agricultural production cost insurance as an ex-ante risk coping strategy, and 10 out of 89 farmers (11.2 percent) who had ex-ante risk coping strategies, including the agricultural production cost insurance, were not willing to join in the insurance, despite having purchased the insurance in the previous cropping season.
4.3. Determinants of Farmers’ WTP
4.4. Mean Value of WTP
5. Conclusions
Author Contributions
Funding
Acknowledgments
Conflicts of Interest
References
- Adger, W. Neil. 2003. Social Capital, Collective Action, and Adaptation to Climate Change. Economic Geography 79: 387–404. [Google Scholar] [CrossRef]
- Ali, Akhter. 2013. Farmers’ Willingness to Pay for Index Based Crop Insurance in Pakistan: A Case Study on Food and Cash Crops of Rain-Fed Areas. Agricultural Economics Research Review 26: 241–48. [Google Scholar]
- Asuransi Jasa Indonesia (Jasindo). 2017. Agricultural Insurance Customer Data. Jasindo: Unpublished. [Google Scholar]
- Barnett, Barry J., and Oliver Mahul. 2007. Weather Index Insurance for Agriculture and Rural Areas in Lower-Income Countries. American Journal of Agricultural Economics 89: 1241–47. [Google Scholar] [CrossRef]
- Barret, Christopher B., Thomas Reardon, and Patrick Webb. 2001. Nonfarm Income Diversification and Household Livelihood Strategies in Rural Africa: Concepts, Dynamics, and Policy Implications. Food Policy 26: 315–31. [Google Scholar] [CrossRef]
- Boer, Rizaldi, and Yuli Suharnoto. 2014. Climate Change Impact on Indonesia Food Crop. Paper presented at The Sixth Executive Forum on Natural Resource Management: Water & Food in a Changing Environment at SEARCA Headquarters, Los Baños, The Philippines, April 11–13. [Google Scholar]
- Boyd, Milton, Jeffrey Pai, H. Holly Wang, and Ke Wang. 2011. Factors Affecting Crop Insurance Purchases in China: The Inner Mongolia Region. China Agricultural Economic Review 3: 441–50. [Google Scholar] [CrossRef]
- Central Bureau of Statistics (CBS). 2016. Garut District in Figures. Garut: CBS. [Google Scholar]
- Cohen, Joel B., and Michael J. Houston. 1972. Cognitive Consequences of Brand Loyalty. Journal of Marketing Research 9: 97–99. [Google Scholar] [CrossRef]
- Collins English Dictionary. 2012. Collins English Dictionary—Complete & Unabridged 2012 Digital Edition. New York: Harper Collins Publishers. [Google Scholar]
- Danso-Abbeam, Gideon, Kwabena Nyarko Addai, and Dennis Ehiakpor. 2014. Willingness to Pay for Farm Insurance by Smallholder Cocoa Farmers in Ghana. Journal of Social Science for Policy Implications 2: 163–83. [Google Scholar]
- Di Falco, Salvatore, Felice Adinolfi, Martino Bozzola, and Fabian Capitanio. 2014. Crop Insurance as A Strategy for Adapting to Climate Change. Journal of Agricultural Economics 65: 485–504. [Google Scholar] [CrossRef]
- Fraser, Rob. 1992. An Analysis of Willingness to Pay for Crop Insurance. Australian Journal of Agricultural Economics 36: 83–95. [Google Scholar] [CrossRef]
- Freedy, John R., Darlene L. Shaw, Mark P. Jarrell, and Cheryl R. Masters. 1992. Towards an Understanding of the Psychological Impact of Natural Disasters: An Application of the Conservation Resources Stress Model. Journal of Traumatic Stress 5: 441–54. [Google Scholar] [CrossRef]
- Fukui, Seiichi, and Kana Miwa. 2016. Determinants and Health Impacts of Purchasing Community Based Health Insurance: A Case Study in Rural Cambodia. Kyoto: Kyoto University. [Google Scholar]
- Geospatial Information Agency (BIG). 2017. Peta Dasar Indonesia. Geospatial Information Agency. Available online: http://portal.ina-sdi.or.id/home/ (accessed on 5 August 2018).
- Goodwin, Barry K. 1994. Premium Rate Determination in the Federal Crop Insurance Program: What Do Averages Have to Say About Risk? Journal of Agricultural and Resource Economics 19: 382–95. [Google Scholar]
- Goodwin, Barry K. 2001. Association Problems with Market Insurance in Agriculture. American Journal of Agricultural Economics 83: 643–49. [Google Scholar] [CrossRef]
- Goodwin, Barry K., and Vincent H. Smith. 1995. The Economics of Crop Insurance and Disaster AID. Washington: American Enterprise Institute. [Google Scholar]
- Greatrex, Helen, James Hansen, Samantha Garvin, Rahel Diro, Sari Blakeley, Margot Le Guen, Koli Rao, and Daniel Osgood. 2015. Scaling up Index Insurance for Smallholder Farmers: Recent Evidence and Insights. New York: Columbia University, Climate Change, Agriculture and Food Security. [Google Scholar]
- Gulseven, Osman. 2014. Estimating the Demand Factors and Willingness to Pay for Agricultural Insurance. Australian Journal of Engineering Research 1: 13–18. [Google Scholar]
- Haab, Timothy C., and Kenneth E. McConnell. 2002. Valuing Environmental and Natural Resources: The Econometrics of Non-Market Valuation. Northampton: Edward Elgar Publishing. [Google Scholar]
- Ito, Seiro, and Hisaki Kono. 2010. Why Is the Take-up of Microinsurance Is so Low? Evidence from Health Insurance Scheme in India. The Developing Economics 48: 74–101. [Google Scholar] [CrossRef]
- Just, Richard E., Linda Calvin, and John Quiggin. 1999. Adverse Selection in Crop Insurance Actuarial and Asymatric Information Incentives. American Agricultural Economics Association 81: 834–49. [Google Scholar] [CrossRef]
- Kabede, Yohannes, and Ayalneh Bogale. 1992. Risk Behavior and New Agricultural Technologies: The Case of Producers in the Central Highlands of Ethiopia. Quarterly Journal of International Agriculture 31: 510–20. [Google Scholar]
- Kirby, Kris N, Ricardo Godoy, Victoria Reyes-Garcia, Elizabeth Byron, Lilian Apaza, Wiliam Leonard, Eddy Perez, Vincent Vadez, and David Wilkie. 2002. Correlates of Delay-Discount Rates: Evidence from Tsimane’Amerindians of the Bolivian Rain Forest. Journal of Economic Psychology 23: 291–316. [Google Scholar] [CrossRef]
- Long, Q. T., T. B. Minh, C. N. Manh, and T. V. Thanh. 2013. Farm Households’ Willingness to Pay for Crop (Micro) Insurance in Rural Vietnam: An Investigation Using Contingent Valuation Method. Working Paper 64. Rahmania, Algeria: East Asian Development Network (EADN). [Google Scholar]
- Mahul, Olivier, and Charles J. Stutley. 2010. Government Support to Agricultural Insurance: Challenges and Options for Developing Countries. Washington: The World Bank. [Google Scholar]
- McCharty, Nancy. 2003. Demand for Rainfall—Index Based Insurance: A Case Study from Morocco. Discussion Paper 106. Washington: International Food Policy Research Institute. [Google Scholar]
- National Disaster Management Authority (BNPB). 2017. Natural Hazards in Indonesia. BNPB. Available online: http://dibi.bnpb.go.id (accessed on 16 October 2017).
- Naylor, Rosamond L., David S. Battisti, Daniel J. Vimont, Walter P. Falcon, and Marshall B. Burke. 2007. Assessing Risks of Climate Variability and Climate Change for Indonesian Rice Agriculture. Proceedings of the National Academy of Sciences of the United States of America 104: 7752–57. [Google Scholar] [CrossRef] [PubMed]
- Parliament Library and Reference, Research, Documentation and Information Service (LARRDIS). 2015. Crop Insurance in India. LARRDIS. Available online: http://164.100.47.134/intranet/CROP%20INSURANCE%20IN%20INDIA.pdf (accessed on 1 August 2017).
- Reyes, Celia M., Christian D. Mina, Reneli Ann B. Gloria, and Sarah Joy P. Mercado. 2015. Review of Design and Implementation of the Agricultural Insurance Programs of the Philippine Crop Insurance Corporation. Discussion Paper 2015-07. Makati City: Philippine Institute for Development Studies. [Google Scholar]
- Rothschild, Michael, and Joseph Stiglitz. 1976. Equilibrium in Competitive Insurance Markets: An Essay on the Economics of Imperfect Information. The Quarterly Journal of Economics 9: 629–49. [Google Scholar] [CrossRef]
- Sarris, Alexander, Panayiotis Karfakis, and Luc Christiaensen. 2006. Producer Demand and Welfare Benefits of Rainfall Insurance in Tanzania. Rome: Food and Agriculture Organization. [Google Scholar]
- Schechter, Laura. 2007. Traditional Trust Measurement and the Risk Confound: An Experiment in Rural Paraguay. Journal of Economic Behavior and Organization 62: 272–92. [Google Scholar] [CrossRef]
- Sherrick, Bruce J., Peter J. Barry, Paul N. Ellinger, and Gary D. Schnitkey. 2004. Factor Influencing Farmers’ Crop Insurance Decisions. American Journal of Agricultural Economics 86: 103–14. [Google Scholar] [CrossRef]
- Smith, V. Kerry. 2006. Fifty Years of Contingent Valuation. In Handbook on Contingent Valuation, 1st ed. Northampton: Edward Elgar Publishing, pp. 7–50. [Google Scholar]
- Smith, Vincent H., and Alan E. Baquet. 1996. The Demand for Multiple Peril Crop Insurance: Evidence from Montana Wheat Farms. American Journal of Agricultural Economics 78: 189–201. [Google Scholar] [CrossRef]
- Smith, Barry, and Mark W. Skinner. 2002. Adaptation Options in Agriculture to Climate Change: A Typology. Mitigation and Adaptation Strategies for Global Change 7: 85–114. [Google Scholar] [CrossRef]
- Stone, Wendy. 2001. Measuring Social Capital: Towards a Theoretically Informed Measurement Framework for Researching Social Capital in Family and Community Life. Melbourne: Australian Institute of Family Studies. [Google Scholar]
- Supari, Ester Salimun, Elvin Aldrian, Ardhasena Sopaheluwakan, Liew Juneng, and Fredolin Tangang. 2017. ENSO Modulation of Seasonal Rainfall and Extremes in Indonesia. Climate Dynamics 51: 2559–80. [Google Scholar] [CrossRef]
- The Ministry of Agriculture of the Republic of Indonesia (MoA). 2015. The Description of Asuransi Usatani Padi (AUTP); Jakarta: The Ministry of Agriculture of the Republic of Indonesia.
- The Ministry of Agriculture of the Republic of Indonesia (MoA). 2017a. Statistics of Climate, Crop Pest and Diseases and Climate Change Impact 2012–2014; Jakarta: The Ministry of Agriculture.
- The Ministry of Agriculture of the Republic of Indonesia (MoA). 2017b. The Guidance for the Utilization of Rice Insurance Premium Subsidy 2017; Jakarta: The Ministry of Agriculture of the Republic of Indonesia.
- The Ministry of Agriculture of the Republic of Indonesia (MoA). 2018. The Evaluation of Rice and Livestock Insurance 2018; Jakarta: Evaluation of Agricultural Insurance Implementation.
- Warner, Koko, Kess Van Der Geest, Sonke Kreft, Salemul Huq, S. Harmeling, Koen Kusters, and Alex De Sherbinin. 2012. Evidence from the Frontlines of Climate Change: Loss and Damage to Communities Despite Coping and Adaptation. Bonn: United Nations University Institute for Environment and Human Security (UNU-EHS). [Google Scholar]
- Zhang, Yaoqi, and Yiqing Li. 2005. Valuing or Pricing Natural and Environmental Resources? Environmental Science & Policy 8: 179–86. [Google Scholar]
- Zhang, Xingming, Weixia Yin, Jun Wang, Tao Ye, Jintao Zhao, and Jing’ai Wang. 2015. Crop Insurance Premium Ratemaking Based on Survey Data: A Case Study from Dingxing County, China. Journal International of Disaster Risk Science 6: 2017–215. [Google Scholar] [CrossRef]
| 1 | It is only in Indonesia that the production cost insurance is fully implemented without being mixed with other types of insurance. Meanwhile, in other countries, such as India and the Philippines, the agricultural production cost insurance is mixed with yield insurance. |
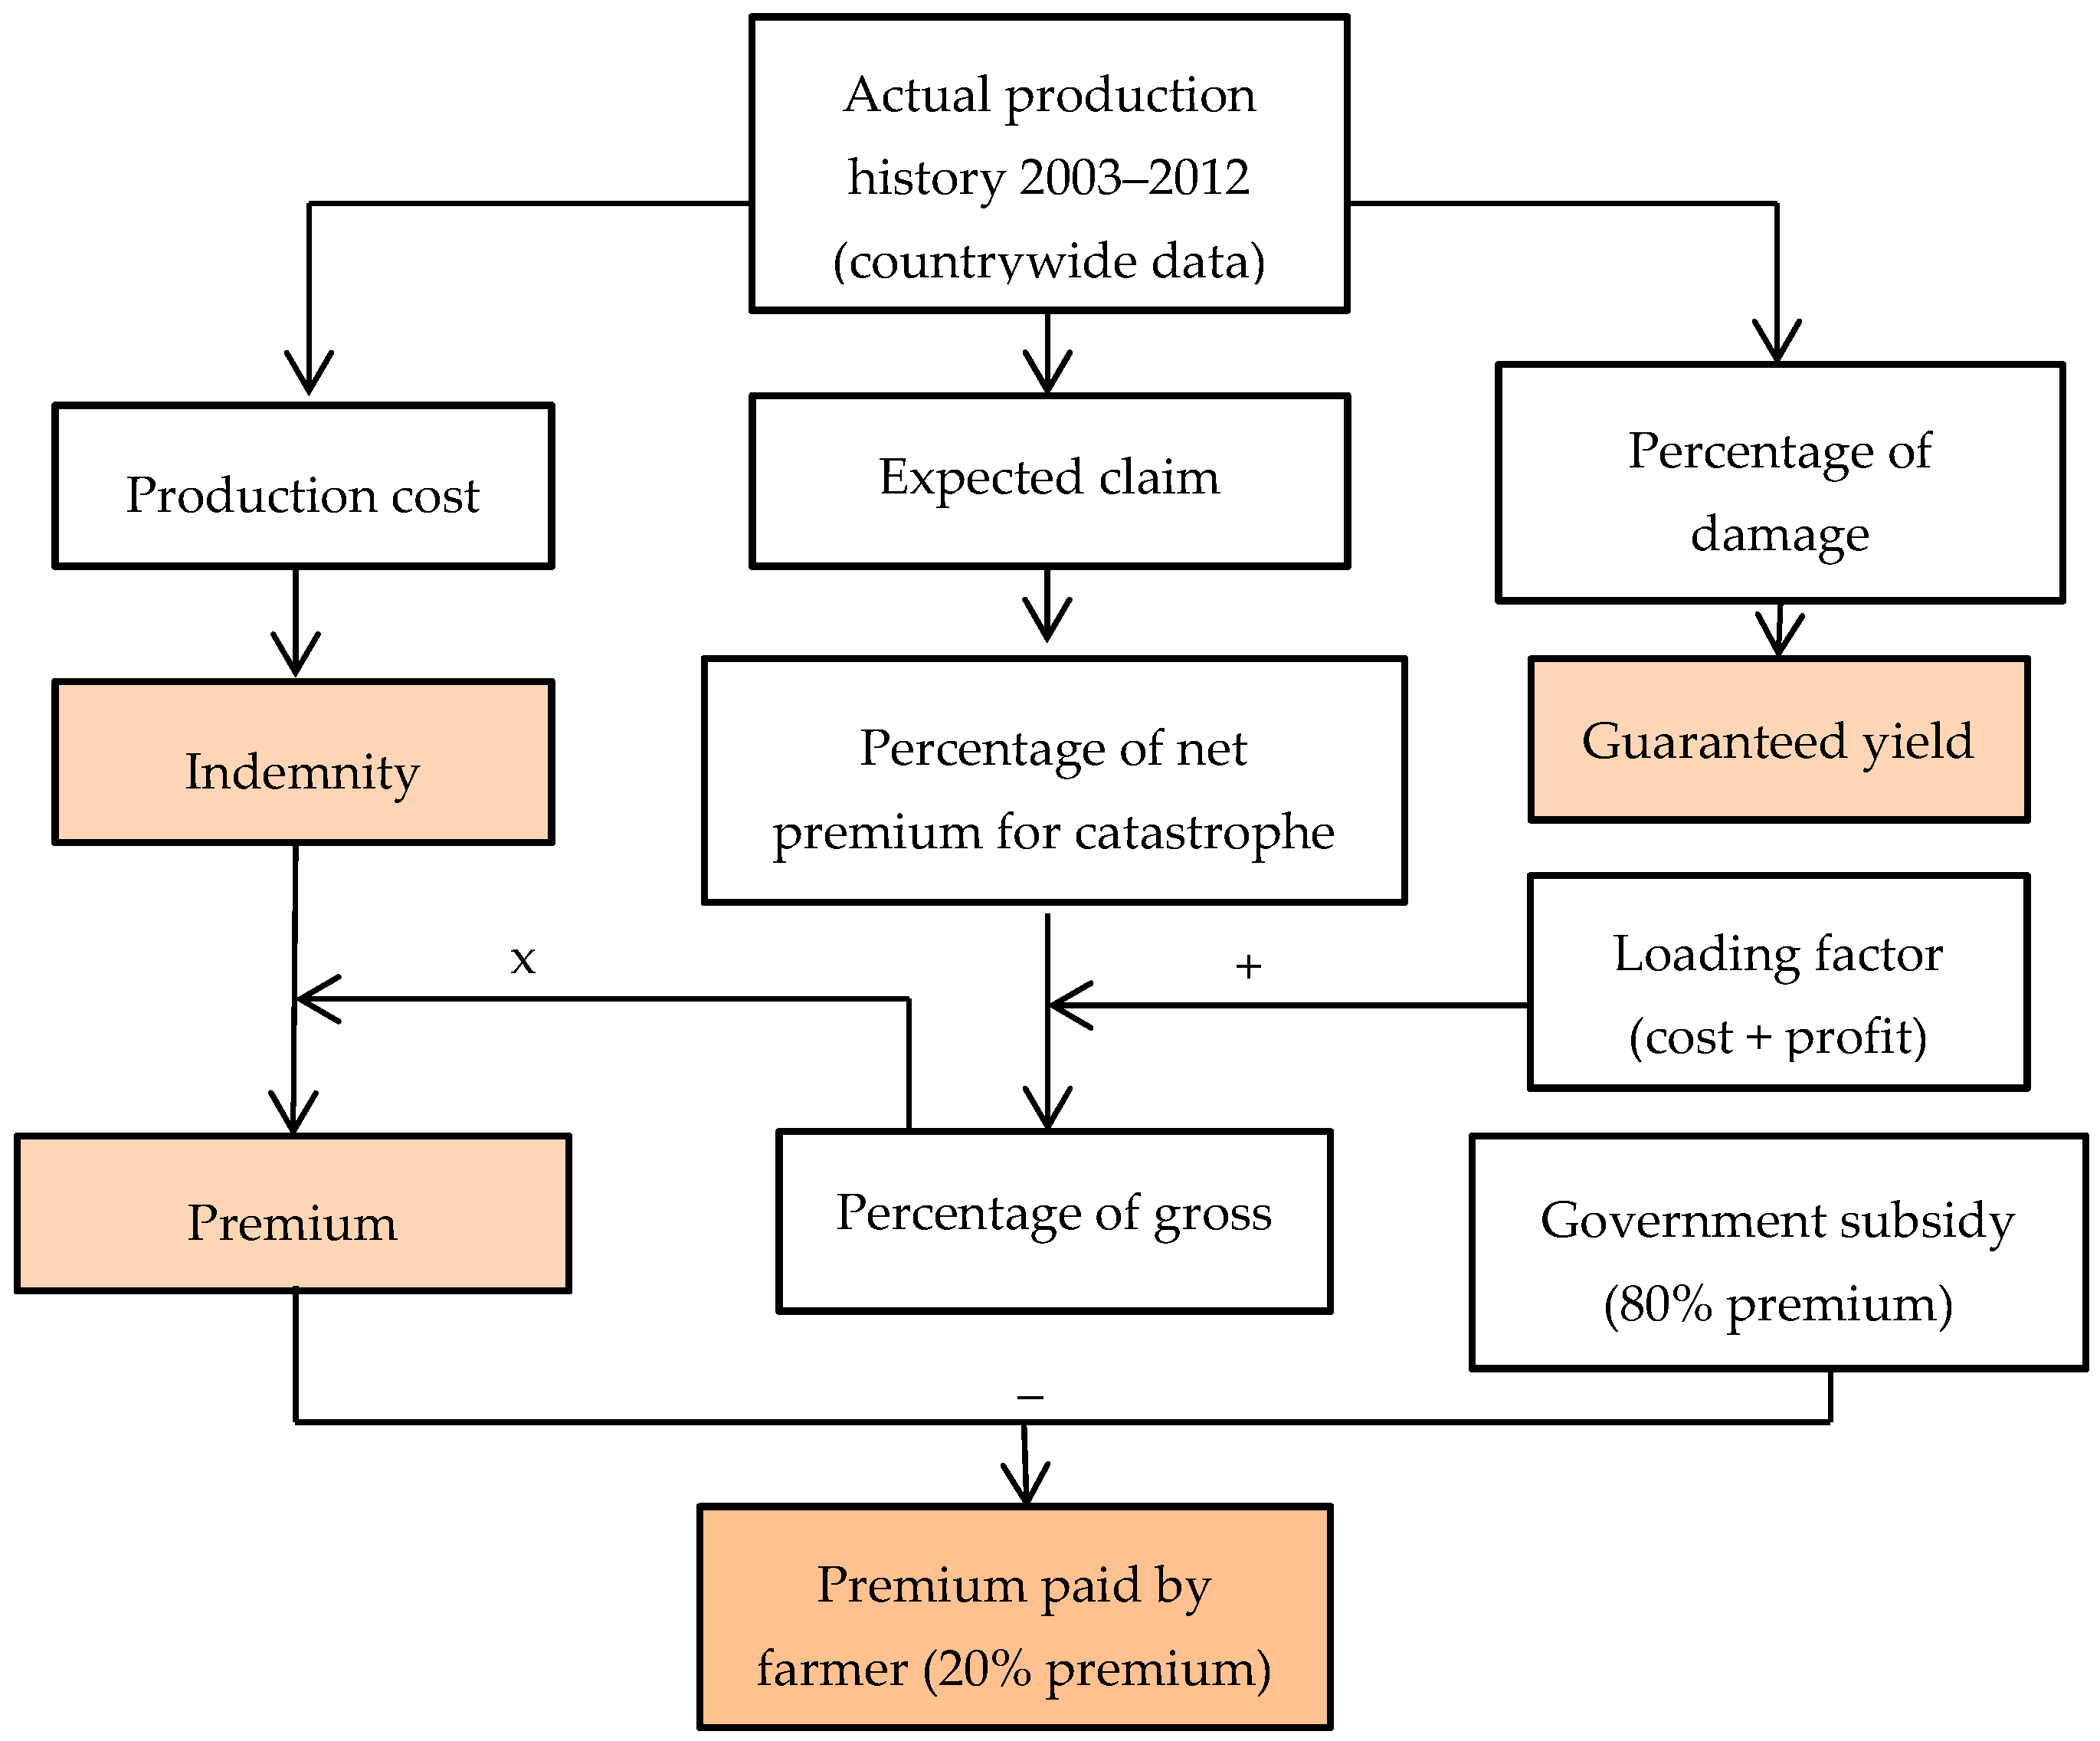
| 2 | Premium subsidy is financial assistance provided by the government that helps farmers to pay for the premium of agricultural production cost insurance. The current premium subsidy of agricultural production cost insurance is 80 percent of the premium. |
| 3 | The relation of catastrophe premium , expected claim net premium , gross premium , and loading factor (β) are as follows: ; . Because λ is set at 10 percent of the expected claim, and β is set at 55 percent of the gross premium (G), the equation can be rewritten as follows: . |
| 4 | Taluka and mandal are subdivisions of a district which consist of several villages (Collins English Dictionary 2012). Taluka is used in certain states such as Gujarat, Goa, and Karnataka, while mandal appears in Andhra Pradesh and Telanggana. Taluka and mandal are equal to subdistrict in Indonesia. |
| 5 | Farmers’ participation in agricultural production cost insurance in 2017 in West Java Province was 36.9 percent of the target (112,213 ha out of 304,000 ha), while in the Garut district, 24 percent of farmland was insured from the target amount (1920 ha out of 8000 ha) (MoA 2018). |


| Variable | Description | Symbol | Expected Sign |
|---|---|---|---|
| Bid/premium | Bid offered to a farmer (Rp) | BID | Negative |
| Personal characteristics | |||
| Age | Age of farmer (year) | AGE | Negative |
| Education | Farmer’s formal education (year) | EDU | Positive |
| Sex | 1 = male, 0 = otherwise | SEX | Positive/negative |
| Risk behavior | Money taken by a farmer in risk game (Rp) | RISK | Positive |
| Discount rate | Farmer’s preference in discount rate game | DISC | Negative |
| Trust | Money given by farmer in trust game (Rp) | TRUST | Positive/negative |
| Disaster experience | Average disaster experience (disaster number/cropping season) | DISEXP | Positive |
| Percentage of damage | The highest percentage of damage (percentage) | PDM | Positive |
| Expected production next cropping season | 1 = high, if expected production next cropping season > average, 0 = otherwise | ENP | Negative |
| Previous purchase of agricultural production cost insurance | 1 = purchase agricultural production cost insurance, 0 = otherwise | PPA | Positive |
| Economic characteristics | |||
| Per-capita living expenditure | Per-capita living expenditure (Rp/year/person) | EXPD | Positive |
| Asset value | Total physical (nonland) and financial asset values (Rp) | ASST | Positive |
| Farming characteristics | |||
| Farmland size | Farmland managed by farm household (ha) | LAND | Positive |
| Type of farmland | 1 = rain-fed, 0 = irrigation | TF | Positive |
| Landholding | |||
| Dummy sharecropping | 1 = sharecropping, 0 = otherwise | SHARE | Positive |
| Dummy rent in cash | 1 = rent in cash, 0 = otherwise, (privately owned land as a base case) | RIC | Positive |
| Rice production cost | Rice production cost including in-kind (Rp mil/ha/cropping season) | PC | Positive |
| Institutional characteristics | |||
| Contact with extension service | 1 = contact with extension service, 0 = otherwise | CES | Positive |
| Access to financial institution | |||
| Bank account | 1 = own bank account, 0 = otherwise | BANK | Positive/negative |
| Locations | |||
| Dummy downstream | 1 = living in the downstream area, 0 = otherwise | DSTR | Positive/negative |
| Dummy midstream | 1 = living in the midstream area, 0 = otherwise (Upstream as a base case) | USTR | Positive/negative |
| Independent Variables | All Farmers (n = 240) | |
|---|---|---|
| Mean | Std. Dev | |
| Personal characteristics | ||
| Age (year) | 52 | 9.4 |
| Education (year) | 6.8 | 2.6 |
| Sex (% male) | 90.4 | 29.5 |
| Risk behavior (Rp) | 20,125 | 6,101 |
| Discount rate | 0.44 | 0.20 |
| Trust (Rp) | 9020 | 5312 |
| Expected production next cropping season | 0.48 | 0.50 |
| Disaster experience (times/cropping season) | 1.7 | 0.38 |
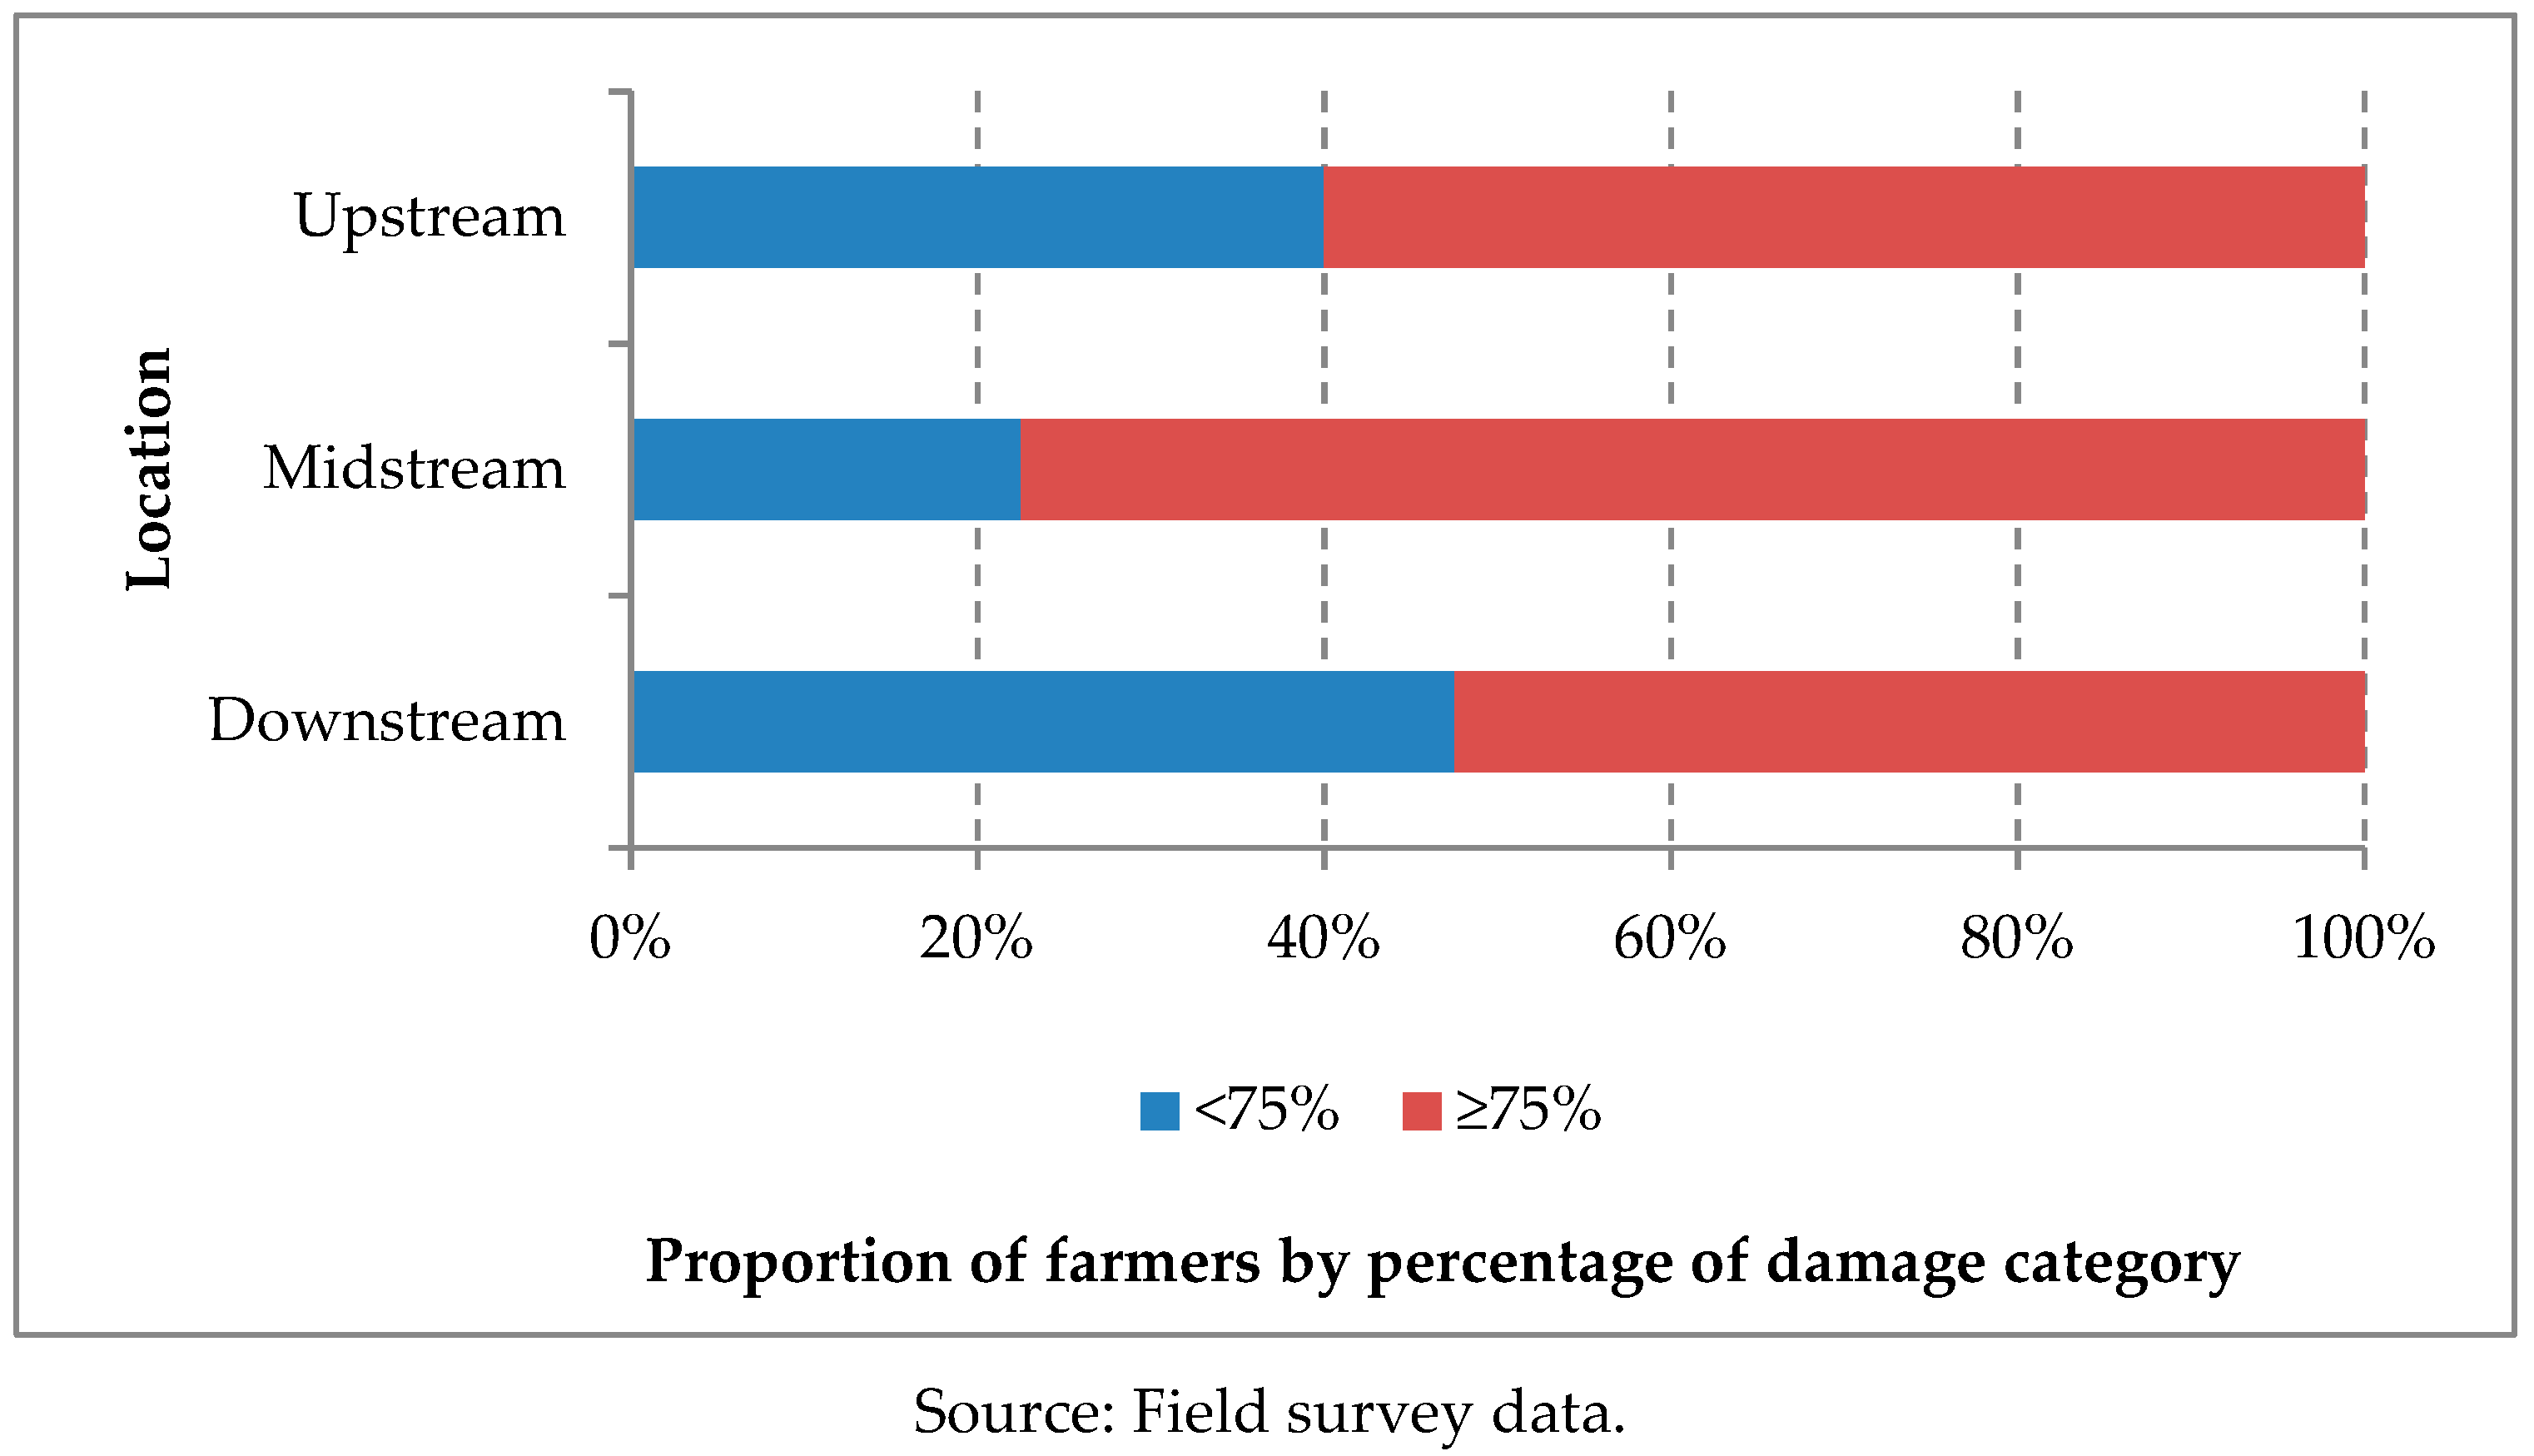
| Percentage of damage (%) | 73.9 | 25.6 |
| Previous purchase of agricultural production cost insurance (%) | 50 | 50 |
| Economic characteristics | ||
| Per-capita living expenditure (Rp mil/year) | 10.1 | 2.482 |
| Asset (Rp mil) | 80.9 | 88.06 |
| Farming characteristics | ||
| Farmland size (ha) | 0.47 | 0.32 |
| Type of farmland (% rain-fed) | 21 | 41 |
| Landholding | ||
| Dummy sharecropping (%) | 51 | 5.01 |
| Dummy rent in cash (%) | 10 | 3.06 |
| (Privately owned land as a base case) | ||
| Institutional characteristics | ||
| Contact with extension service (% farmers) | 51 | 50 |
| Access to financial institution | ||
| Bank account (% ownership) | 25 | 43.39 |
| Location | Farmland Size (ha) | Production Cost (Rp mil/ha) | ||||
|---|---|---|---|---|---|---|
| Class | Average | Without In-Kind | With In-Kind | Average without In-Kind | Average with In-Kind | |
| Downstream | 0.28 | 5.86 | 10.84 | 5.93 | 10.25 | |
| 0.79 | 6.09 | 8.85 | ||||
| Midstream | 0.29 | 7.87 | 12.88 | 7.61 | 11.61 | |
| 0.79 | 7.36 | 10.46 | ||||
| Upstream | 0.29 | 6.10 | 10.52 | 5.84 | 10.01 | |
| 0.72 | 5.22 | 7.96 | ||||
| Total | 0.47 | 6.45 | 10.62 | |||
| Reason | Rank |
|---|---|
| Indemnity cannot compensate rice production cost | 3.08 |
| Percentage of damage is too high as a claim requirement | 2.98 |
| Need more information | 2.83 |
| Risk is low in farmland | 1.91 |
| Don’t have any additional budget to purchase insurance | 1.82 |
| Not need insurance because of having other risk coping strategies | 1.67 |
| I have already purchased insurance but no disasters | 1.30 |
| Group | Willingness to Pay | Downstream | Midstream | Upstream | Total |
|---|---|---|---|---|---|
| Farmers had not yet purchased | No | 12 | 13 | 18 | 43 |
| Yes | 16 | 17 | 12 | 45 | |
| Farmers had purchased | No | 8 | 8 | 9 | 25 |
| Yes | 28 | 27 | 26 | 81 | |
| Total | 64 | 65 | 65 | 194 |
| Variables | Estimated Coefficient | Marginal Effect a | Odds Ratio | SE | ||
|---|---|---|---|---|---|---|
| Coef. | SE | Coef. | SE | |||
| Dependent variable: 1 if a farmer is willing to pay a bid at a certain level, 0 otherwise | ||||||
| Constant | −13.7198 *** | 4.5838 | 0.0011−4 *** | 0.0005−2 | ||
| Bid (x1) | −0.0001 *** | 0.0001−1 | −0.0001−1 *** | 0.0037−4 | 0.9998 *** | 0.0039−2 |
| Personal characteristics | ||||||
| Age2 (x2) | −0.0004 | 0.0003 | −0.0004−1 | 0.0003−1 | 0.9996 | 0.0003 |
| Education (x3) | 0.3176 ** | 0.1556 | 0.0331 ** | 0.0155 | 1.3738 ** | 0.2137 |
| Sex (x4) | 0.2949 | 0.7175 | 0.0307 | 0.0745 | 1.3430 | 0.9637 |
| Risk behavior (x5) | 0.0001 *** | 0.0001−1 | 0.0001−1 *** | 0.0053−3 | 1.0001 *** | 0.0053−2 |
| Discount rate (x6) | 0.3579 | 1.5148 | 0.0373 | 0.1575 | 1.4304 | 2.1668 |
| Trust (x7) | 0.0001 | 0.0001−1 | −0.0017−3 | 0.0057−3 | 0.9999 | 0.0055−2 |
| Expected production next cropping season (x8) | −1.2339 ** | 0.5840 | −0.1285 ** | 0.0578 | 0.2912 ** | 0.1700 |
| Disaster experience (x9) | 0.0773 | 0.7227 | 0.0081 | 0.0752 | 1.0804 | 0.7808 |
| Percentage of damage (x10) | 0.0293 ** | 0.0146 | 0.0031 ** | 0.0015 | 1.0297 ** | 0.0151 |
| Previous purchase of agricultural production cost insurance (x11) | 1.0622 | 0.7026 | 0.1106 | 0.0719 | 2.8928 | 2.0326 |
| Economic characteristics | ||||||
| Per-capita expenditure (x12) | 0.0461 | 0.1297 | 0.0048 | 0.0135 | 1.0472 | 0.1359 |
| Asset value (x13) | 0.0304 *** | 0.0099 | 0.0032 *** | 0.0009 | 1.0309 *** | 0.0103 |
| Farming characteristics | ||||||
| Farmland size (x14) | 2.6706 * | 1.6139 | 0.2781 * | 0.1644 | 14.4482 * | 23.3180 |
| Type of farmland (x15) | −0.5200 | 0.7779 | −0.0541 | 0.0806 | 0.5945 | 0.4625 |
| Landholding | ||||||
| Dummy sharecropping (x16) | −0.4910 | 0.6616 | −0.0511 | 0.0684 | 0.6120 | 0.4049 |
| Dummy rent in cash (x17) | −0.8564 | 1.0015 | −0.0892 | 0.1035 | 0.4247 | 0.4253 |
| (Privately owned land as a base case) | ||||||
| Production cost (x18) | 0.4912 ** | 0.2201 | 0.0511 ** | 0.0219 | 1.6342 ** | 0.3597 |
| Institutional characteristics | ||||||
| Contact with an extension service (x19) | 2.4748 *** | 0.7276 | 0.2577 *** | 0.0658 | 11.8792 *** | 8.6435 |
| Access to financial institution | ||||||
| Bank account (x20) | −0.7421 | 0.6525 | −0.0773 | 0.0674 | 0.4761 | 0.3106 |
| Locations | ||||||
| Dummy downstream (x21) | 1.7994 ** | 0.7115 | 0.1874 ** | 0.0689 | 6.0461 ** | 4.3016 |
| Dummy midstream (x22) | 0.2047 | 0.8019 | 0.0213 | 0.0834 | 1.2272 | 0.9839 |
| (Upstream as a base case) | ||||||
| Predicted 1s that were actual 1s (%) | 86.72 | Log likelihood function | −63.6722 | |||
| Predicted 0s that were actual 0s (%) | 77.27 | Prob (Chi2 > value) | 0.0000 | |||
| Power of Prediction | 0.8351 | Pseudo R2 | 0.4933 | |||
| Linktest: | Variance Inflation | 2.35 | ||||
| _hat | 0.000 | Factor (VIF) | ||||
| _hatsq | 0.762 | |||||
| Indicator | All Farmers | Farmers Had Not Yet Purchased | Farmers Had Already Purchased |
|---|---|---|---|
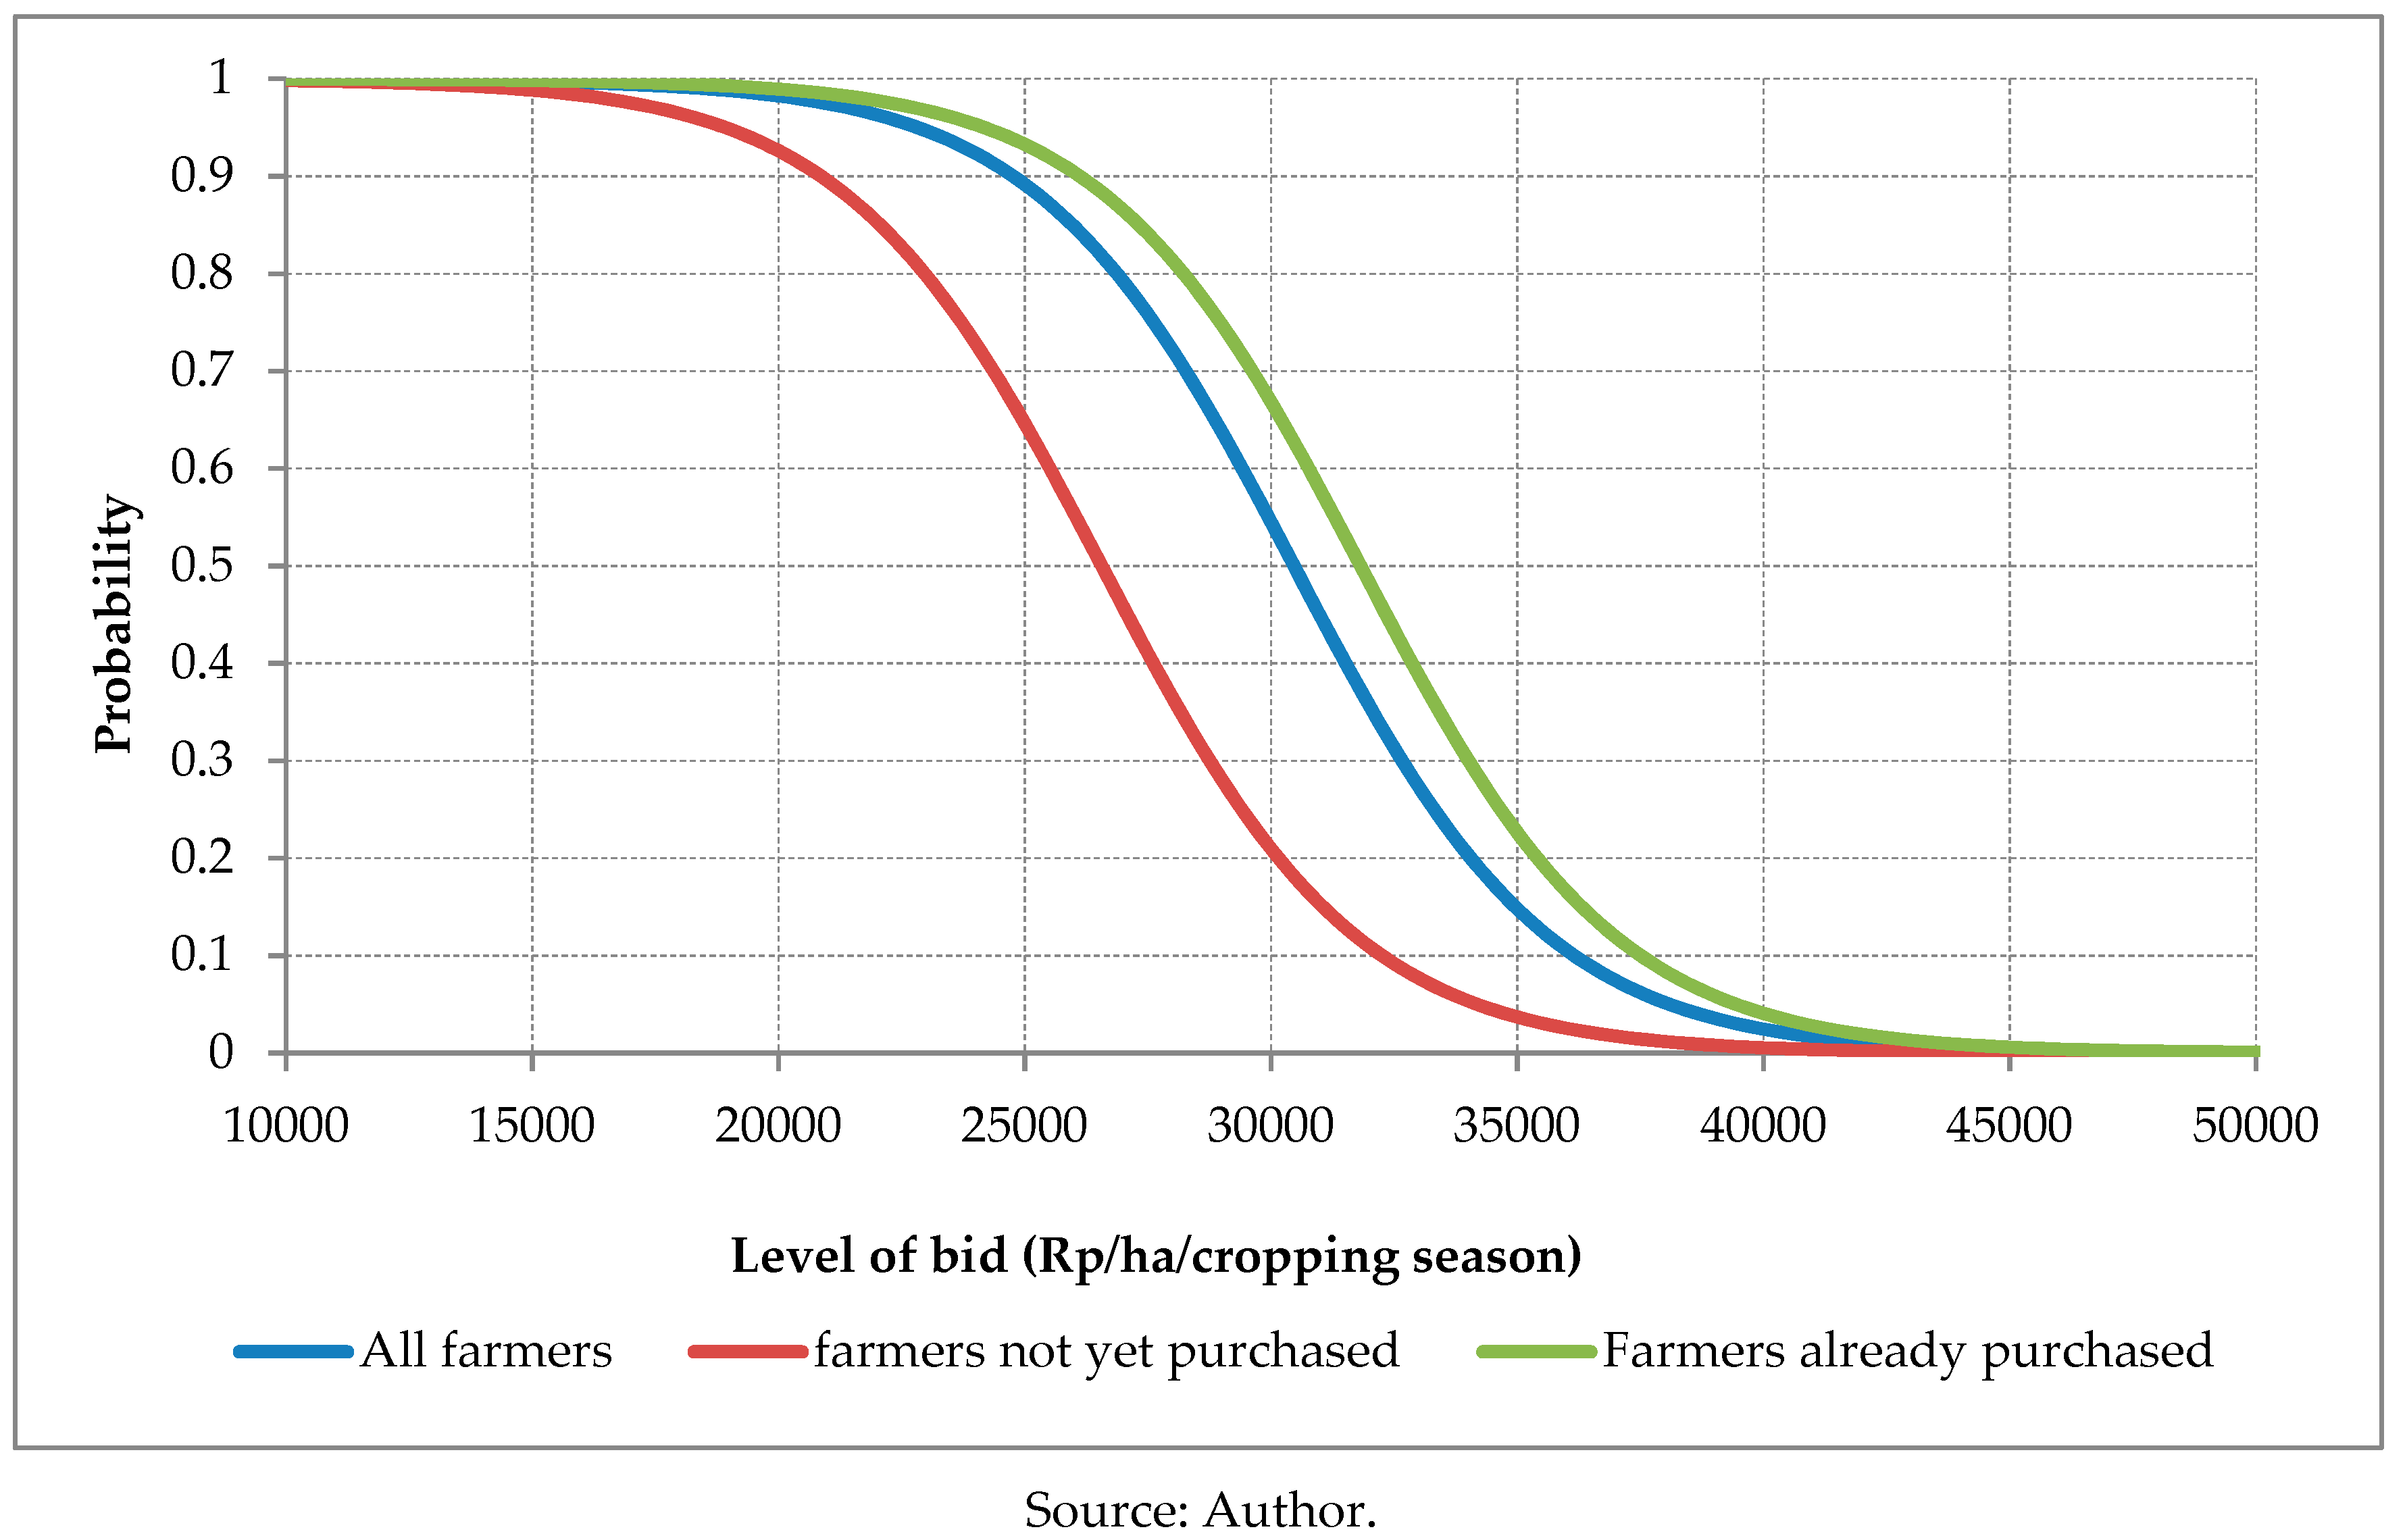
| WTP (Rp/ha/cropping season) | 30,358 | 26,369 | 31,853 |
| Standard error | 12,475 | 9403 | 9769 |
| n | 240 | 120 | 120 |
| Indicator | All Farmers | Downstream | Midstream | Upstream |
|---|---|---|---|---|
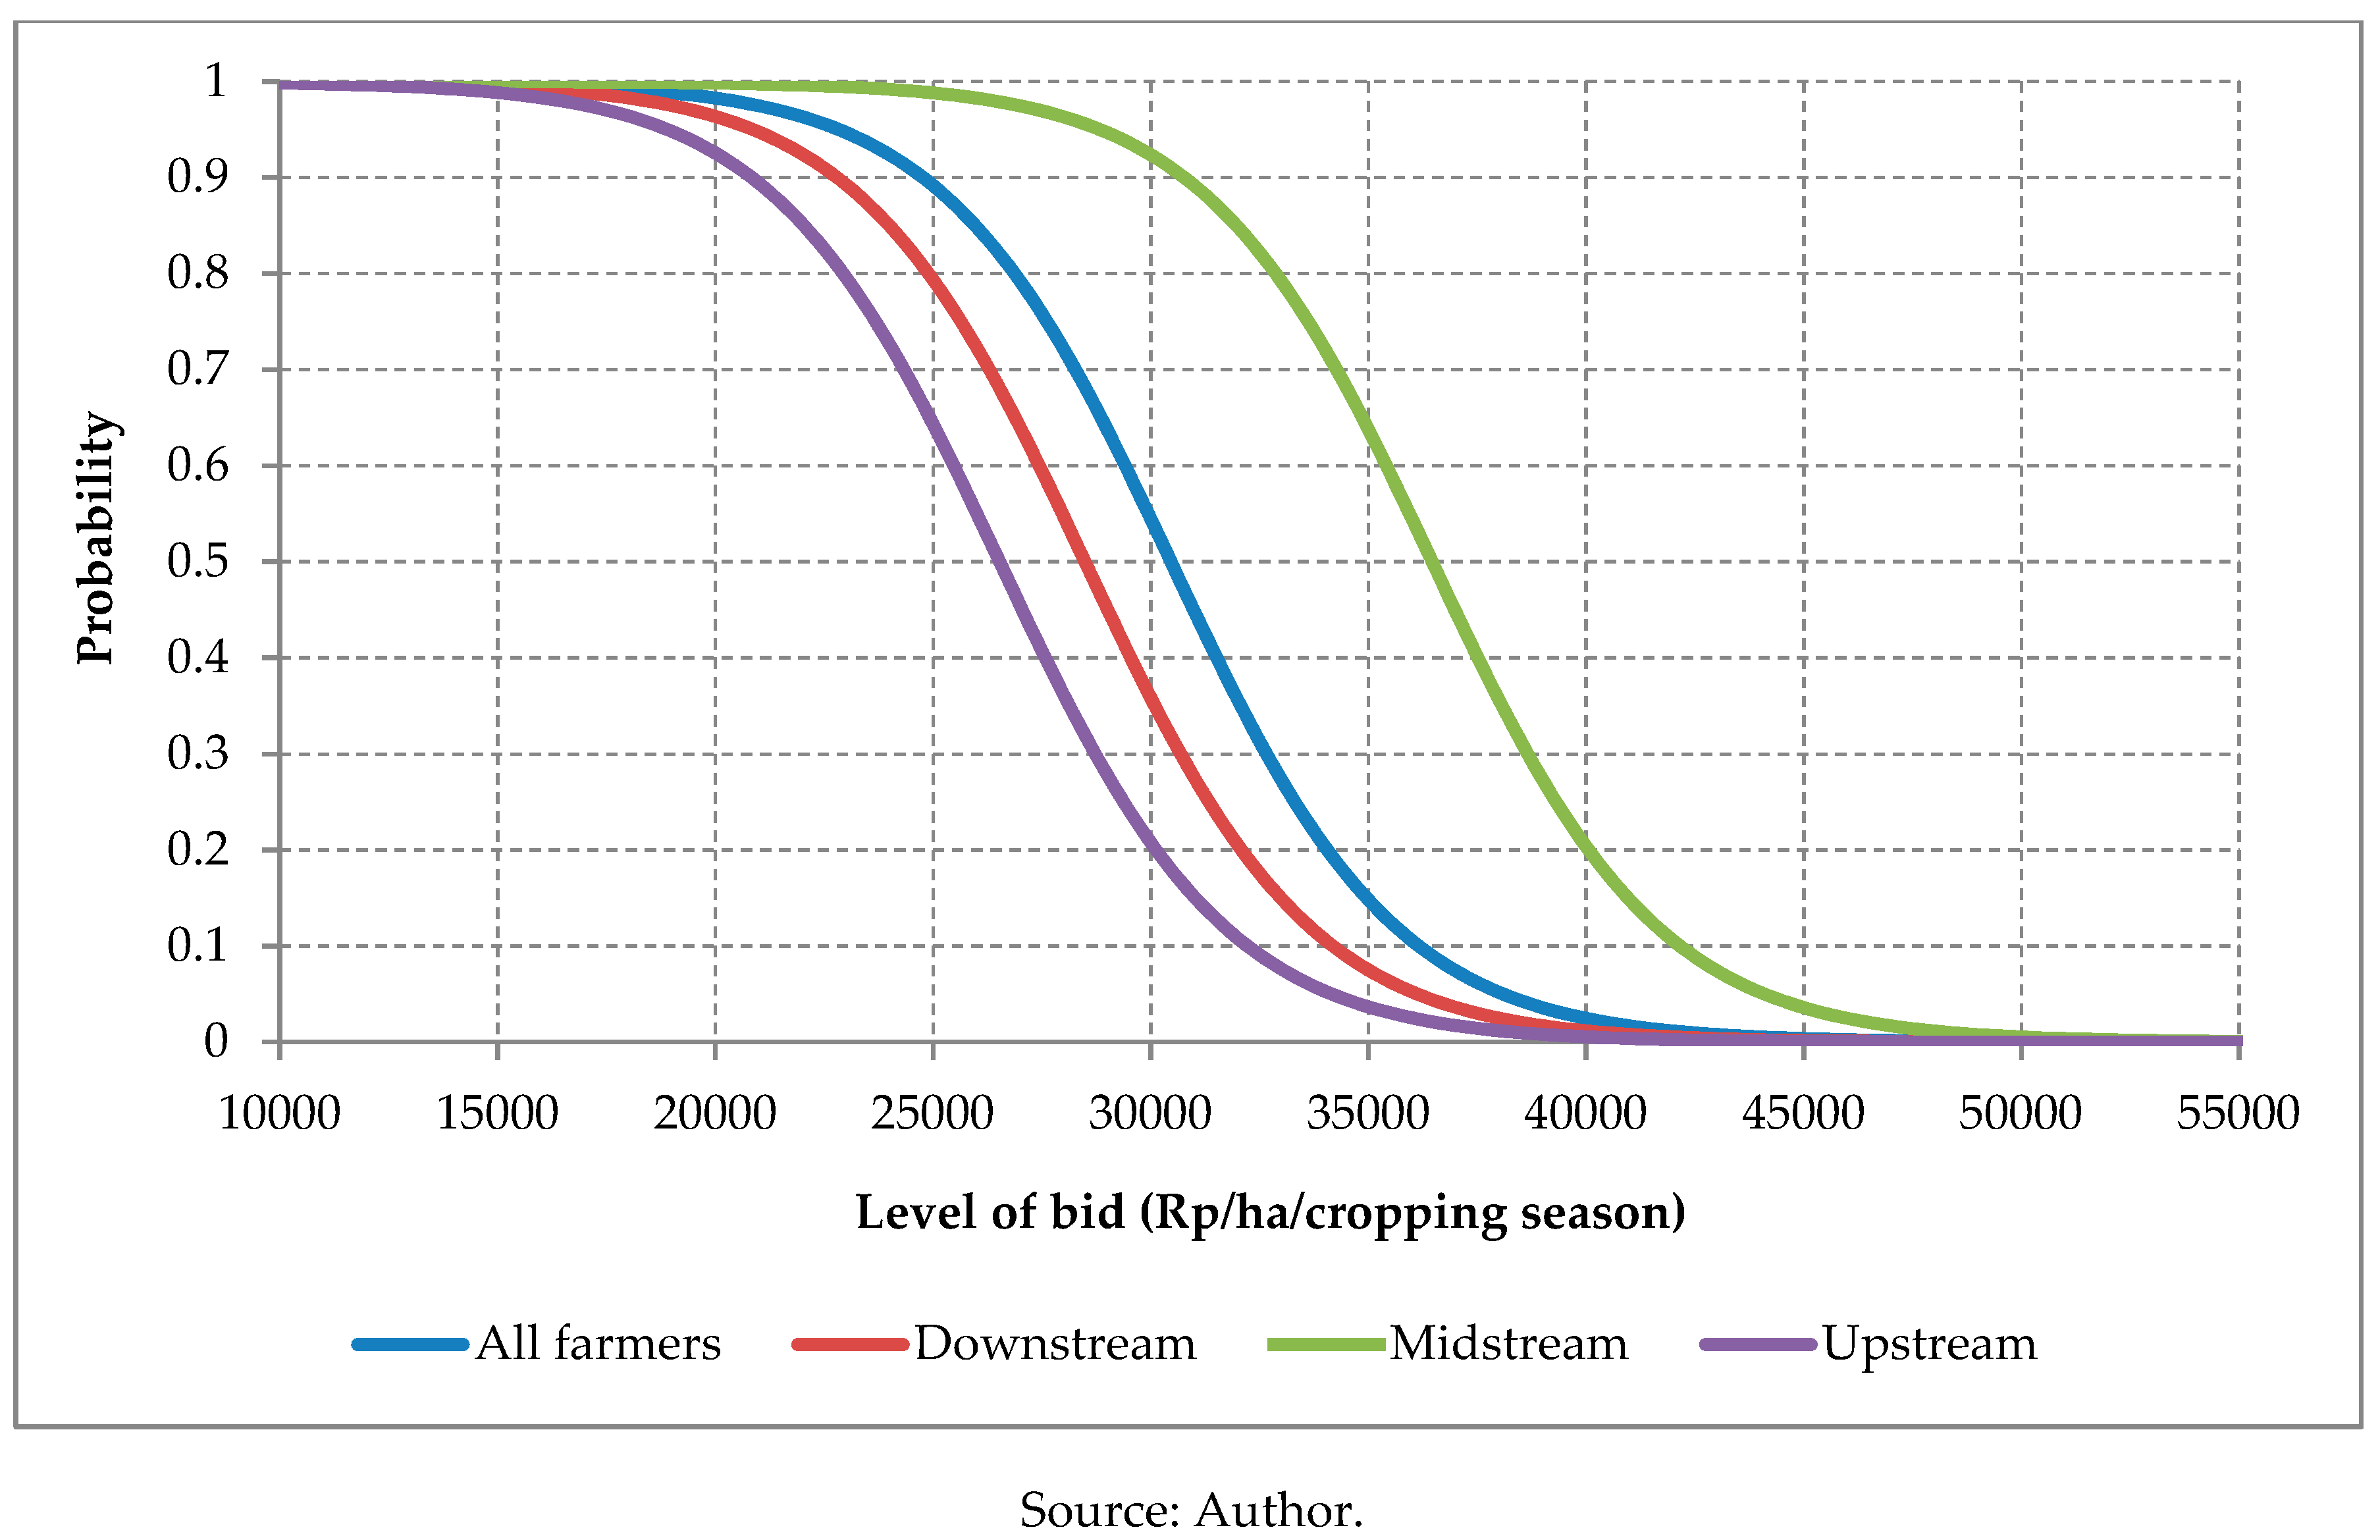
| WTP (Rp/ha/cropping season) | 30,358 | 28,794 | 36,318 | 26,267 |
| Standard error | 12,475 | 8881 | 10,046 | 9680 |
| n | 240 | 80 | 80 | 80 |
© 2019 by the authors. Licensee MDPI, Basel, Switzerland. This article is an open access article distributed under the terms and conditions of the Creative Commons Attribution (CC BY) license (http://creativecommons.org/licenses/by/4.0/).
Share and Cite
Mutaqin, D.J.; Usami, K. Smallholder Farmers’ Willingness to Pay for Agricultural Production Cost Insurance in Rural West Java, Indonesia: A Contingent Valuation Method (CVM) Approach. Risks 2019, 7, 69. https://doi.org/10.3390/risks7020069
Mutaqin DJ, Usami K. Smallholder Farmers’ Willingness to Pay for Agricultural Production Cost Insurance in Rural West Java, Indonesia: A Contingent Valuation Method (CVM) Approach. Risks. 2019; 7(2):69. https://doi.org/10.3390/risks7020069
Chicago/Turabian StyleMutaqin, Dadang Jainal, and Koichi Usami. 2019. "Smallholder Farmers’ Willingness to Pay for Agricultural Production Cost Insurance in Rural West Java, Indonesia: A Contingent Valuation Method (CVM) Approach" Risks 7, no. 2: 69. https://doi.org/10.3390/risks7020069
APA StyleMutaqin, D. J., & Usami, K. (2019). Smallholder Farmers’ Willingness to Pay for Agricultural Production Cost Insurance in Rural West Java, Indonesia: A Contingent Valuation Method (CVM) Approach. Risks, 7(2), 69. https://doi.org/10.3390/risks7020069