Assessing Vertical Equity in Defined Benefit Pension Plans: An Application to Switzerland
Abstract
1. Introduction
2. Actuarial Concepts: Actuarial Fairness and Actuarial Neutrality
3. Econometric Approach
4. Institutional Background
4.1. The Swiss OASI System
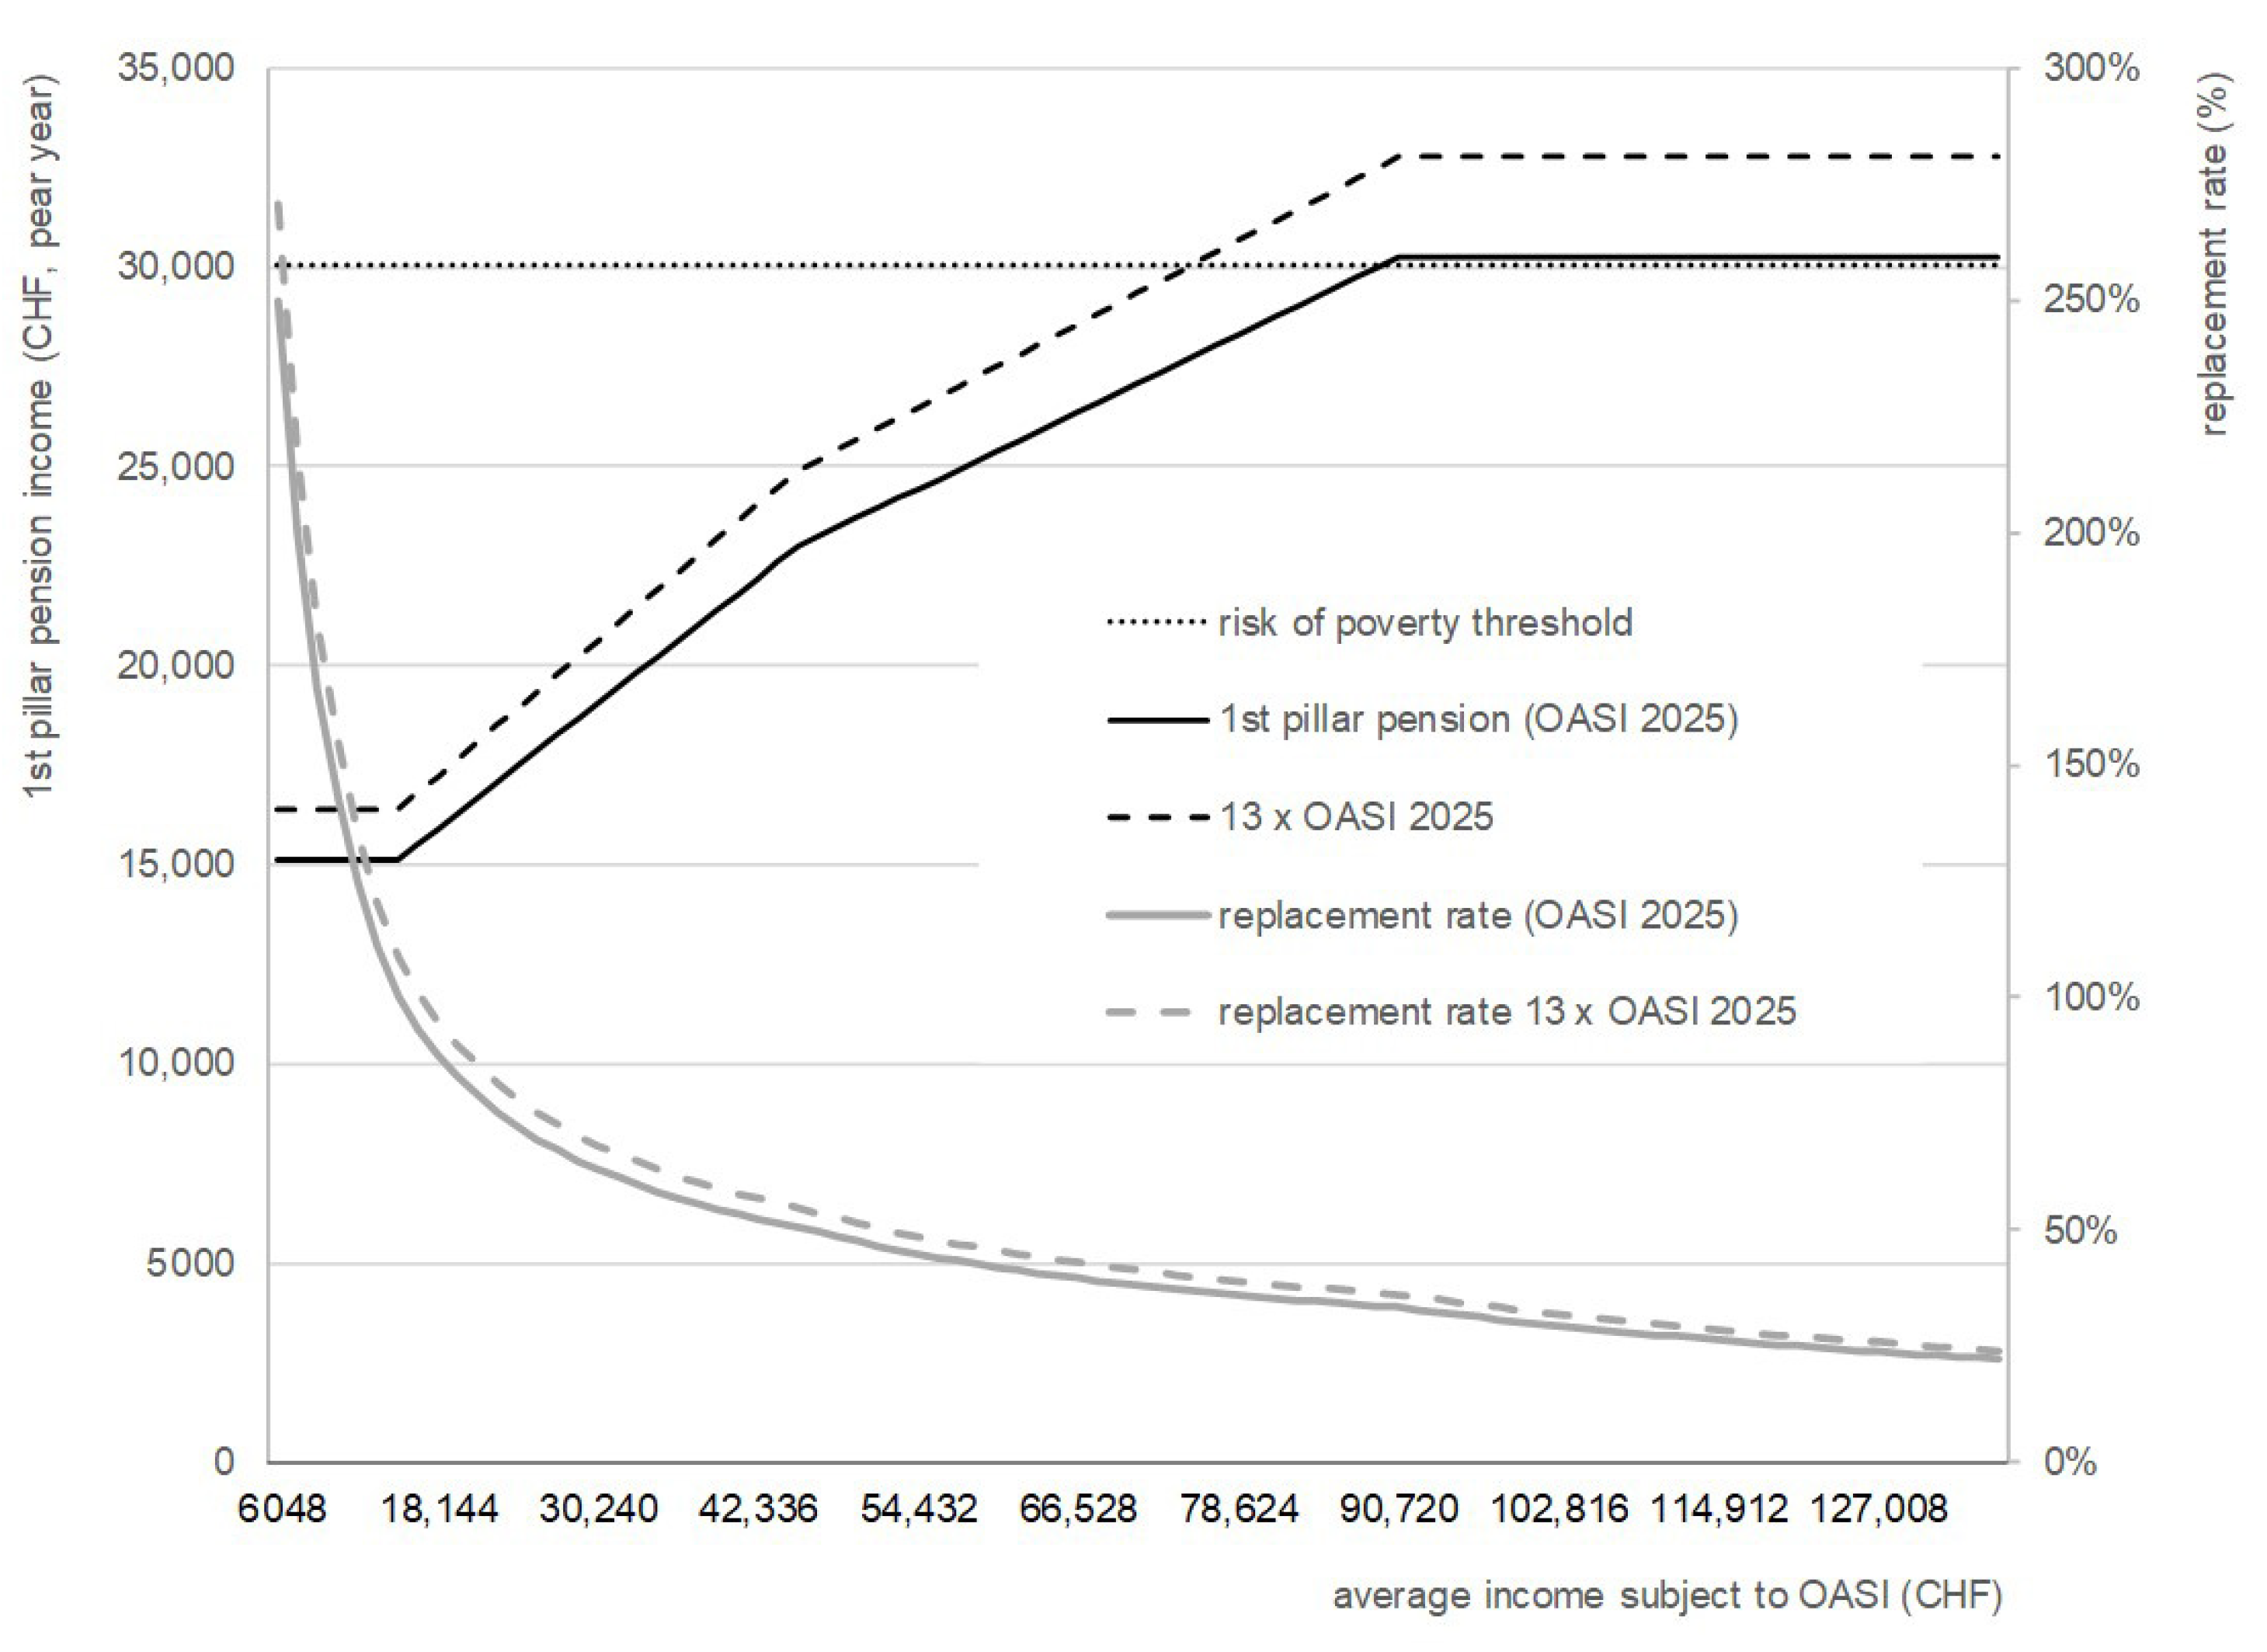
4.1.1. The Pension Formula
4.1.2. Additional Elements of Vertical Equity
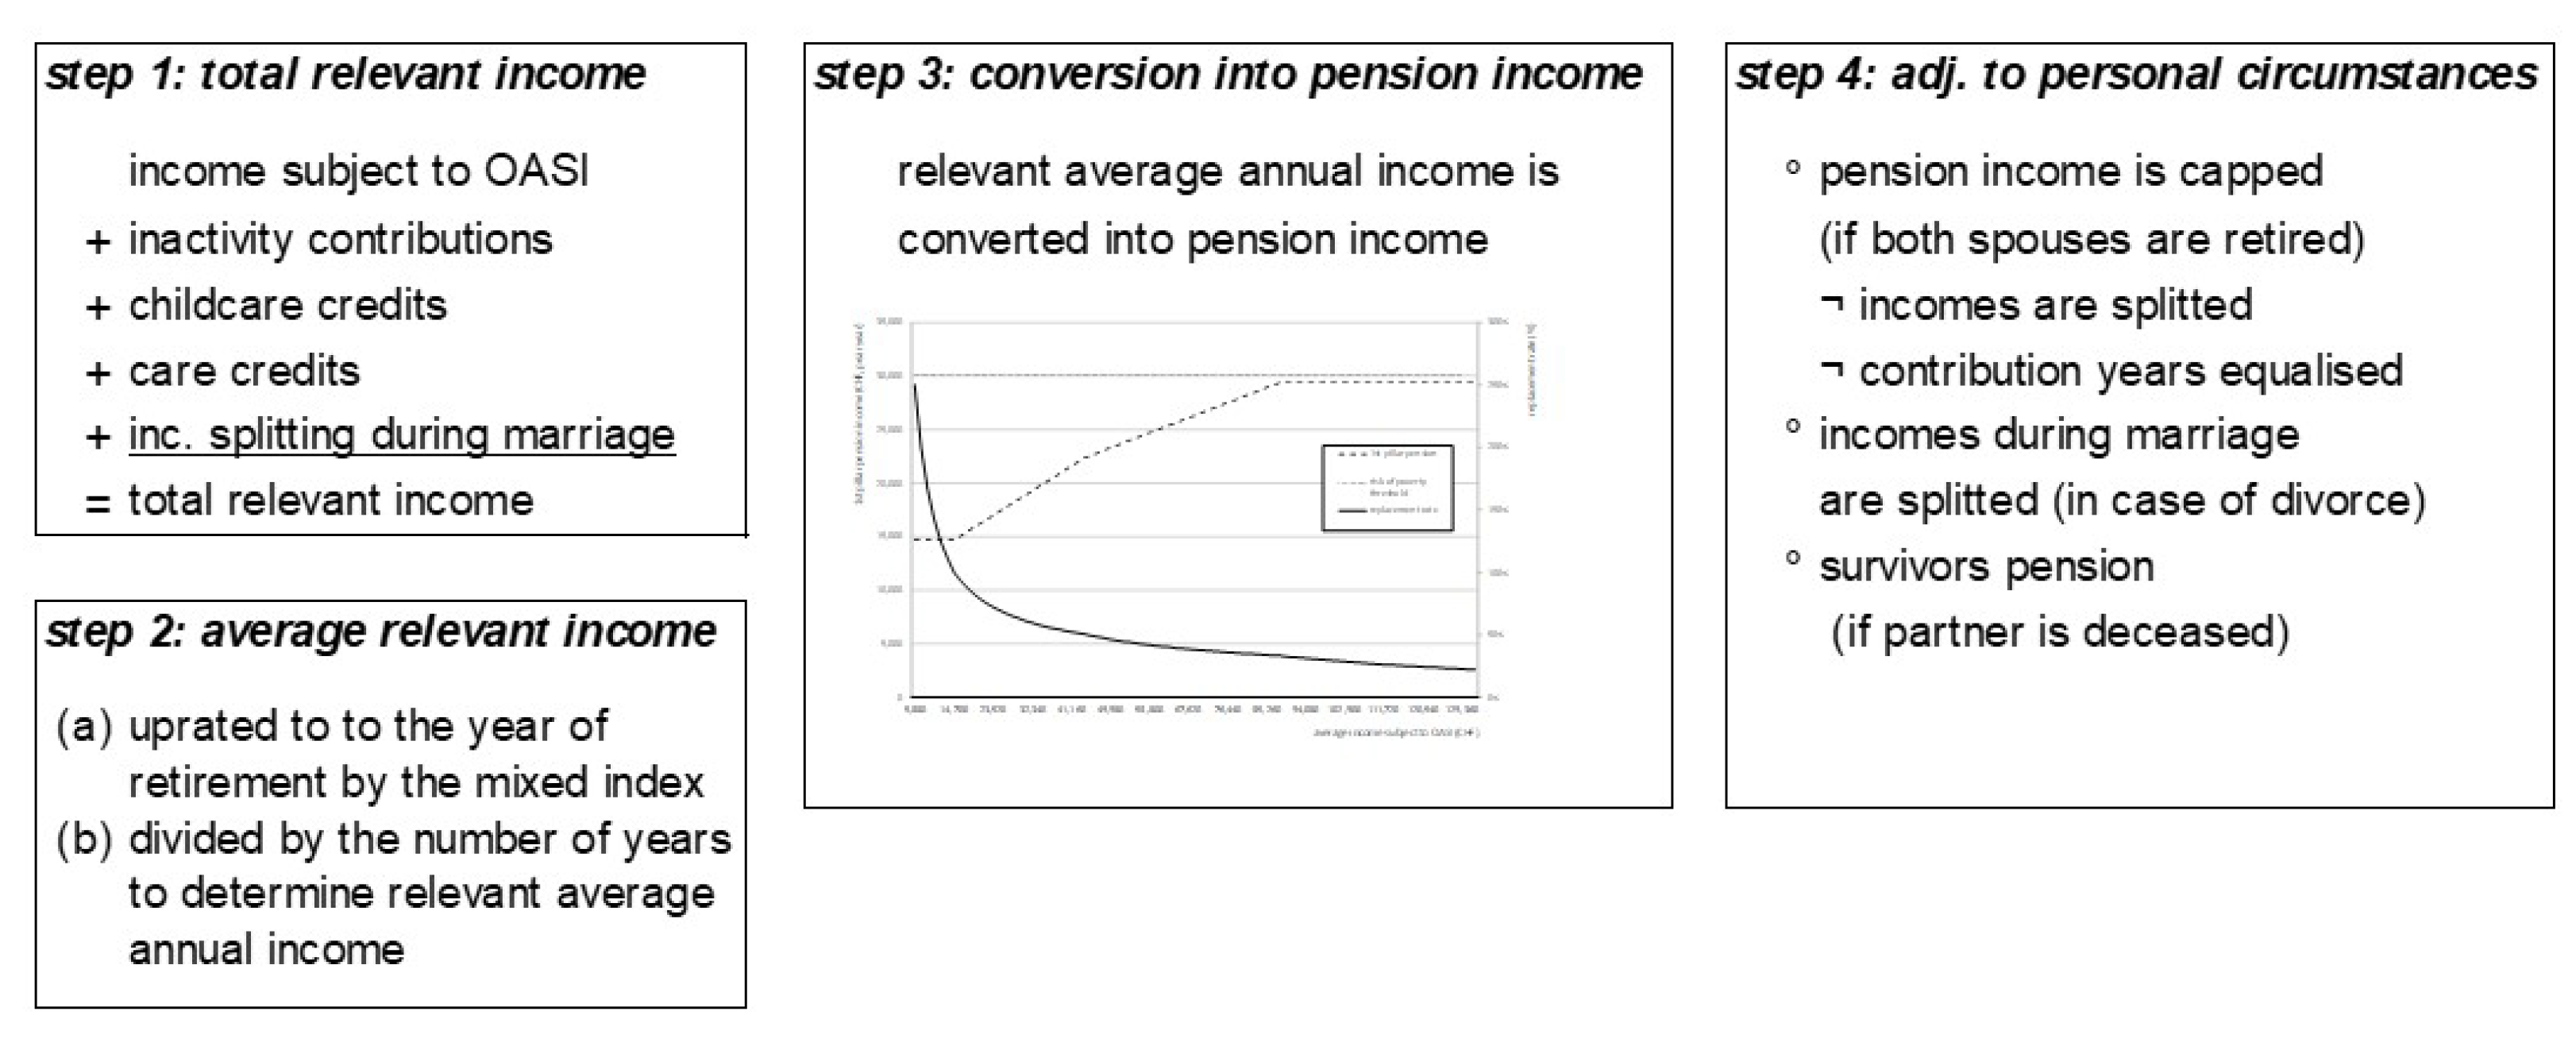
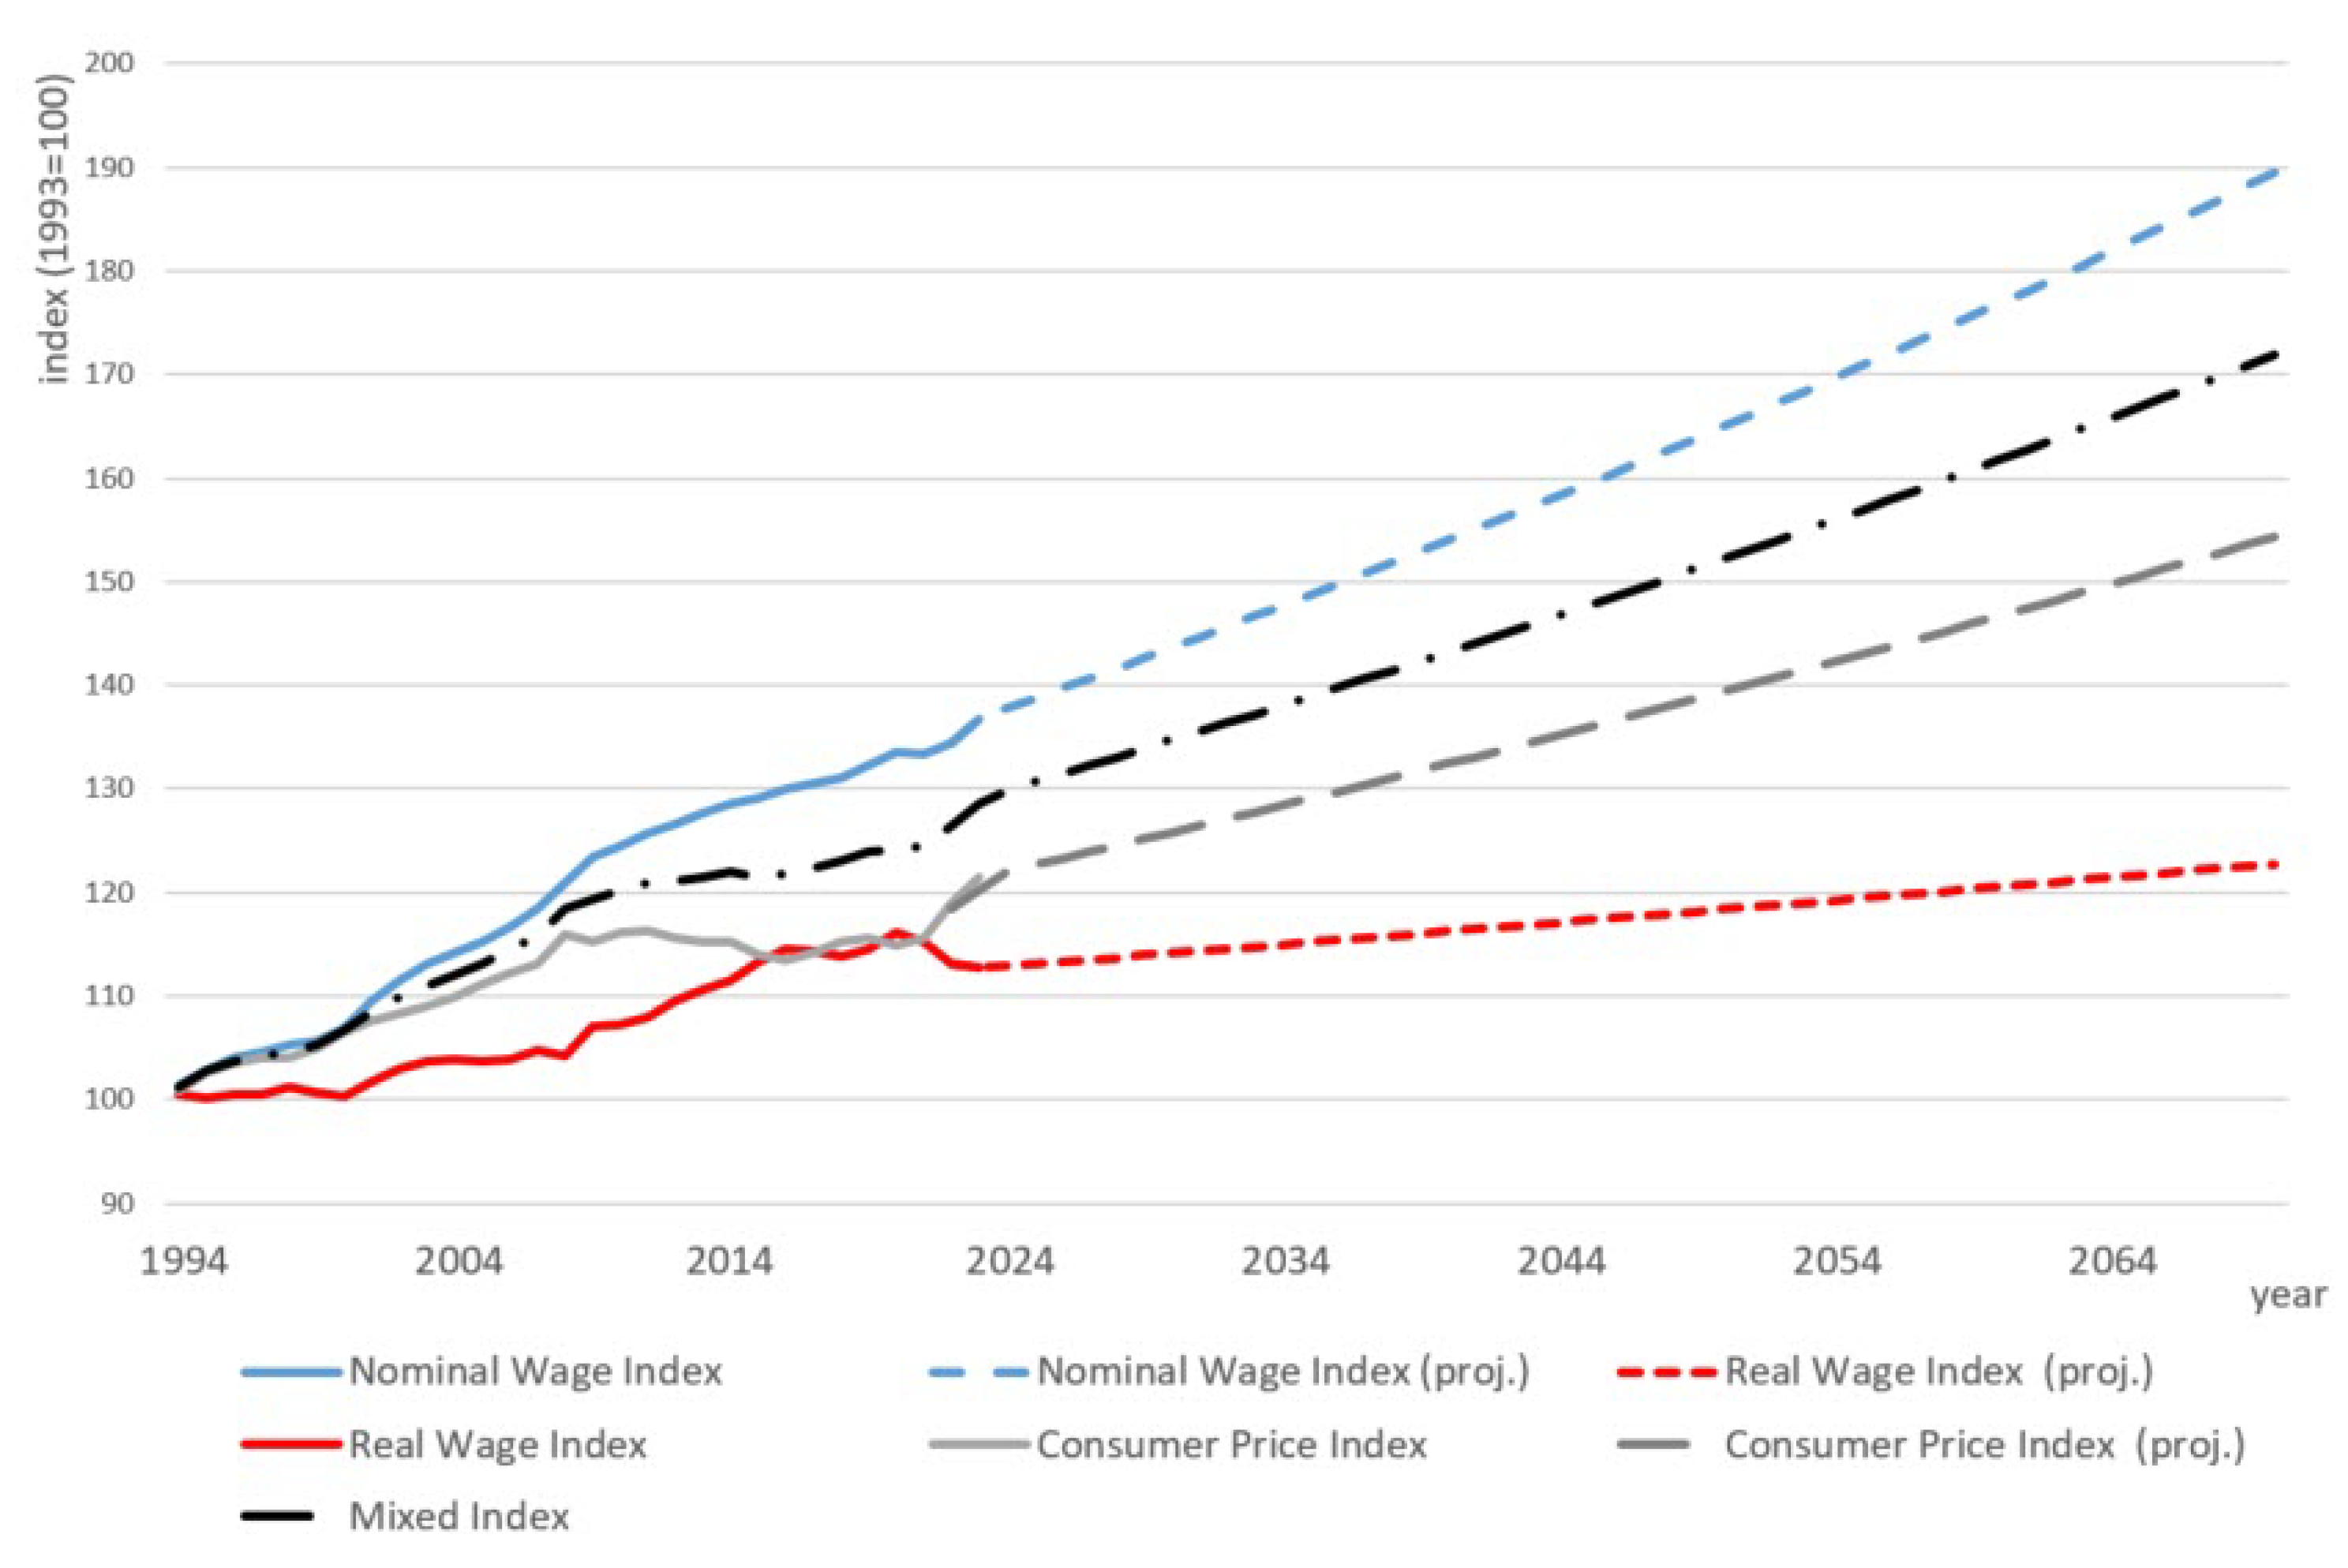
4.1.3. Determination of Pension Income
4.2. Relevance
5. Simulation and Calibration
5.1. Model Description
5.2. Simulation and Alignment
5.3. Simulation of Population Projections and Labor Market Dynamics
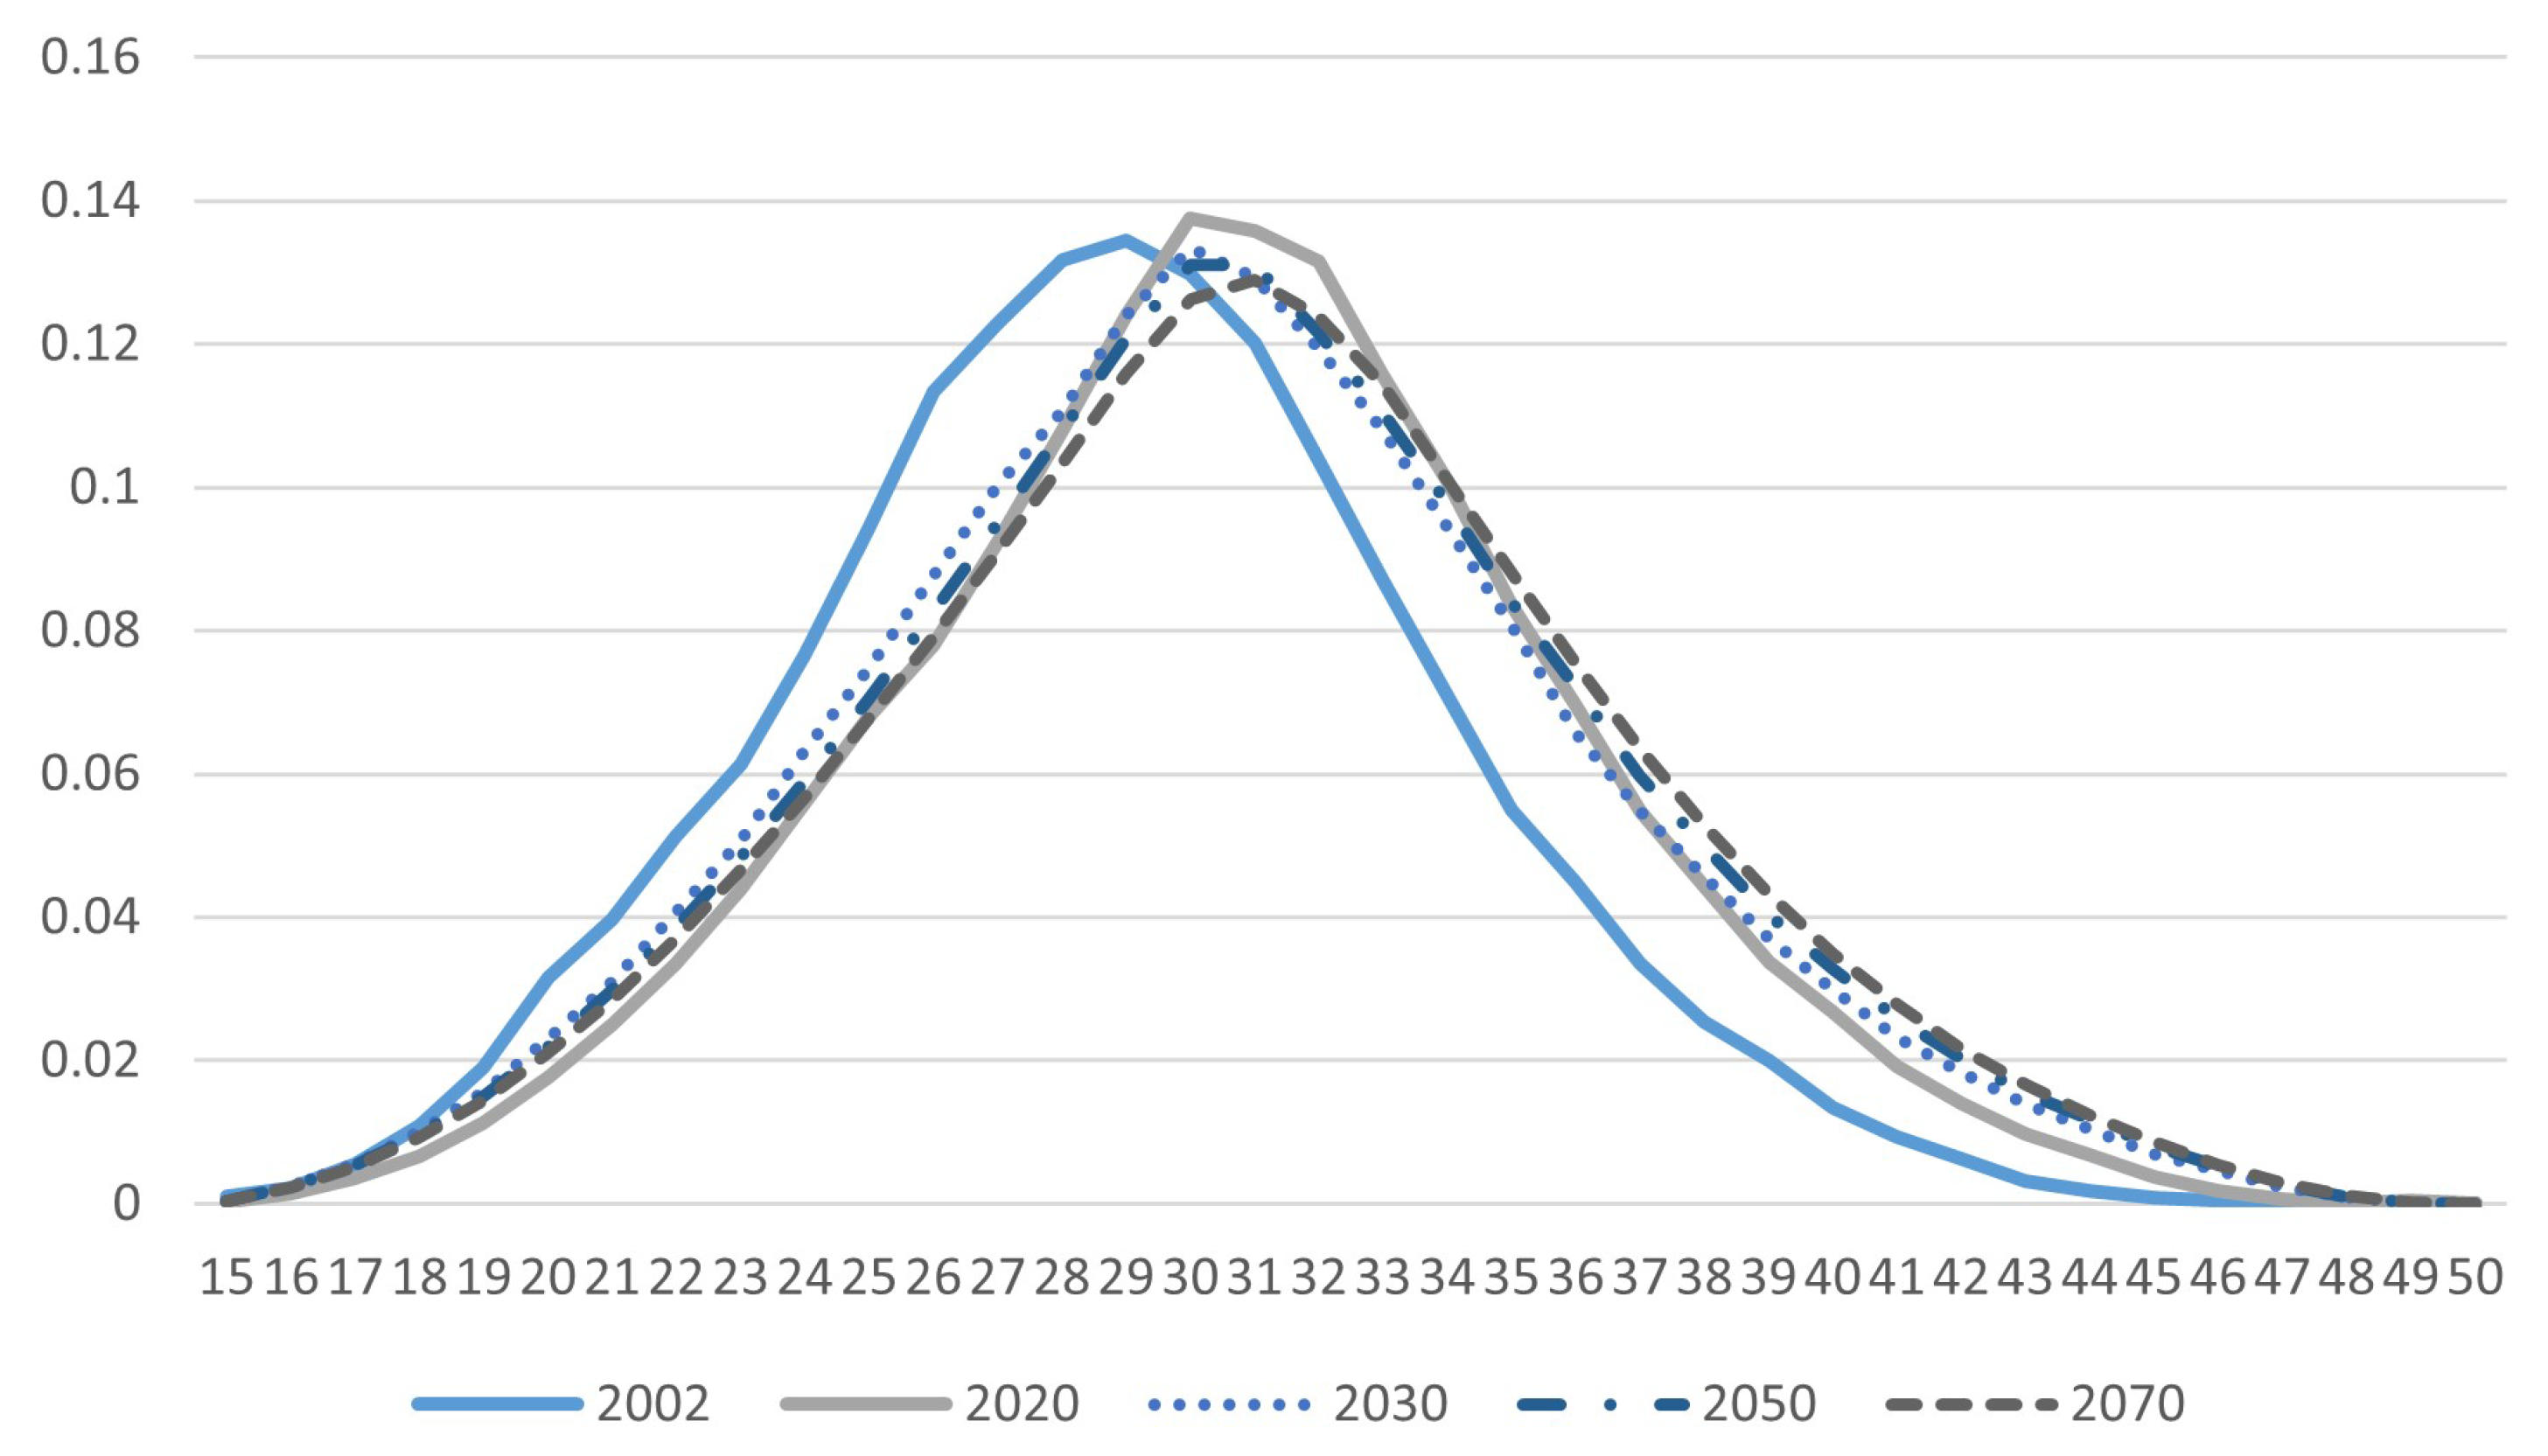
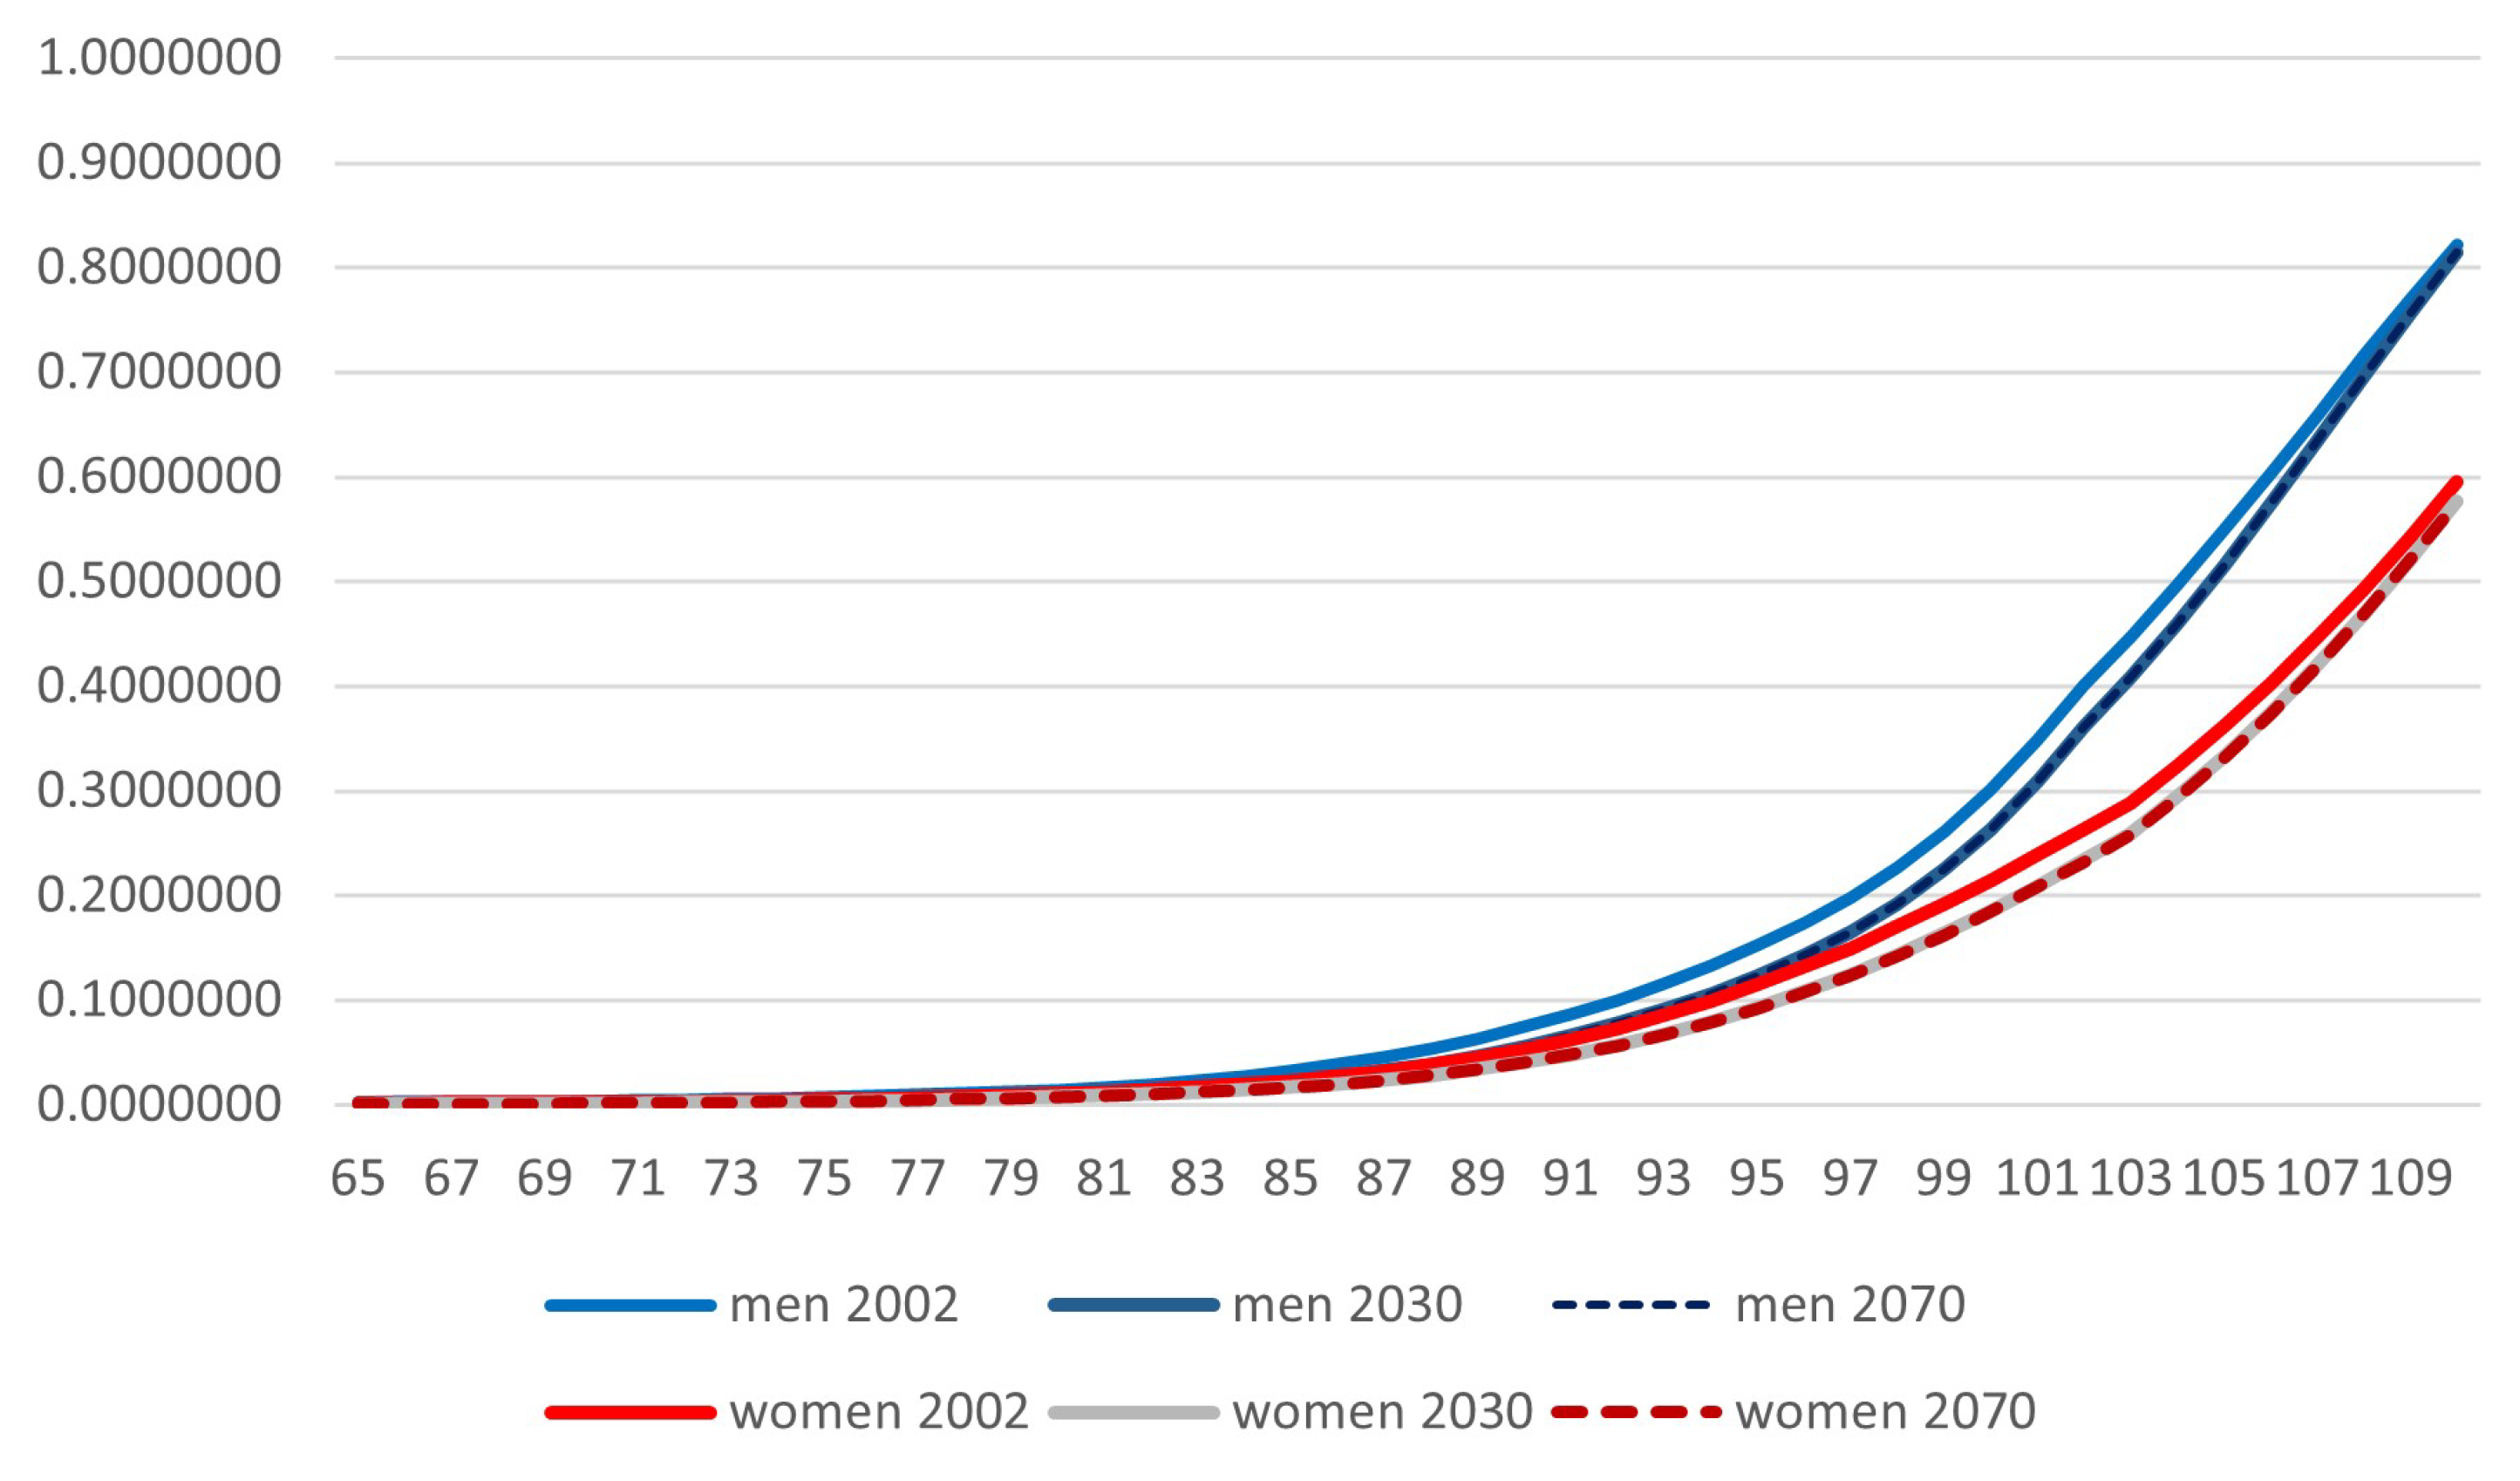
5.3.1. Fertility and Mortality
5.3.2. Immigration and Emigration
5.3.3. Development of Working Population
6. Results
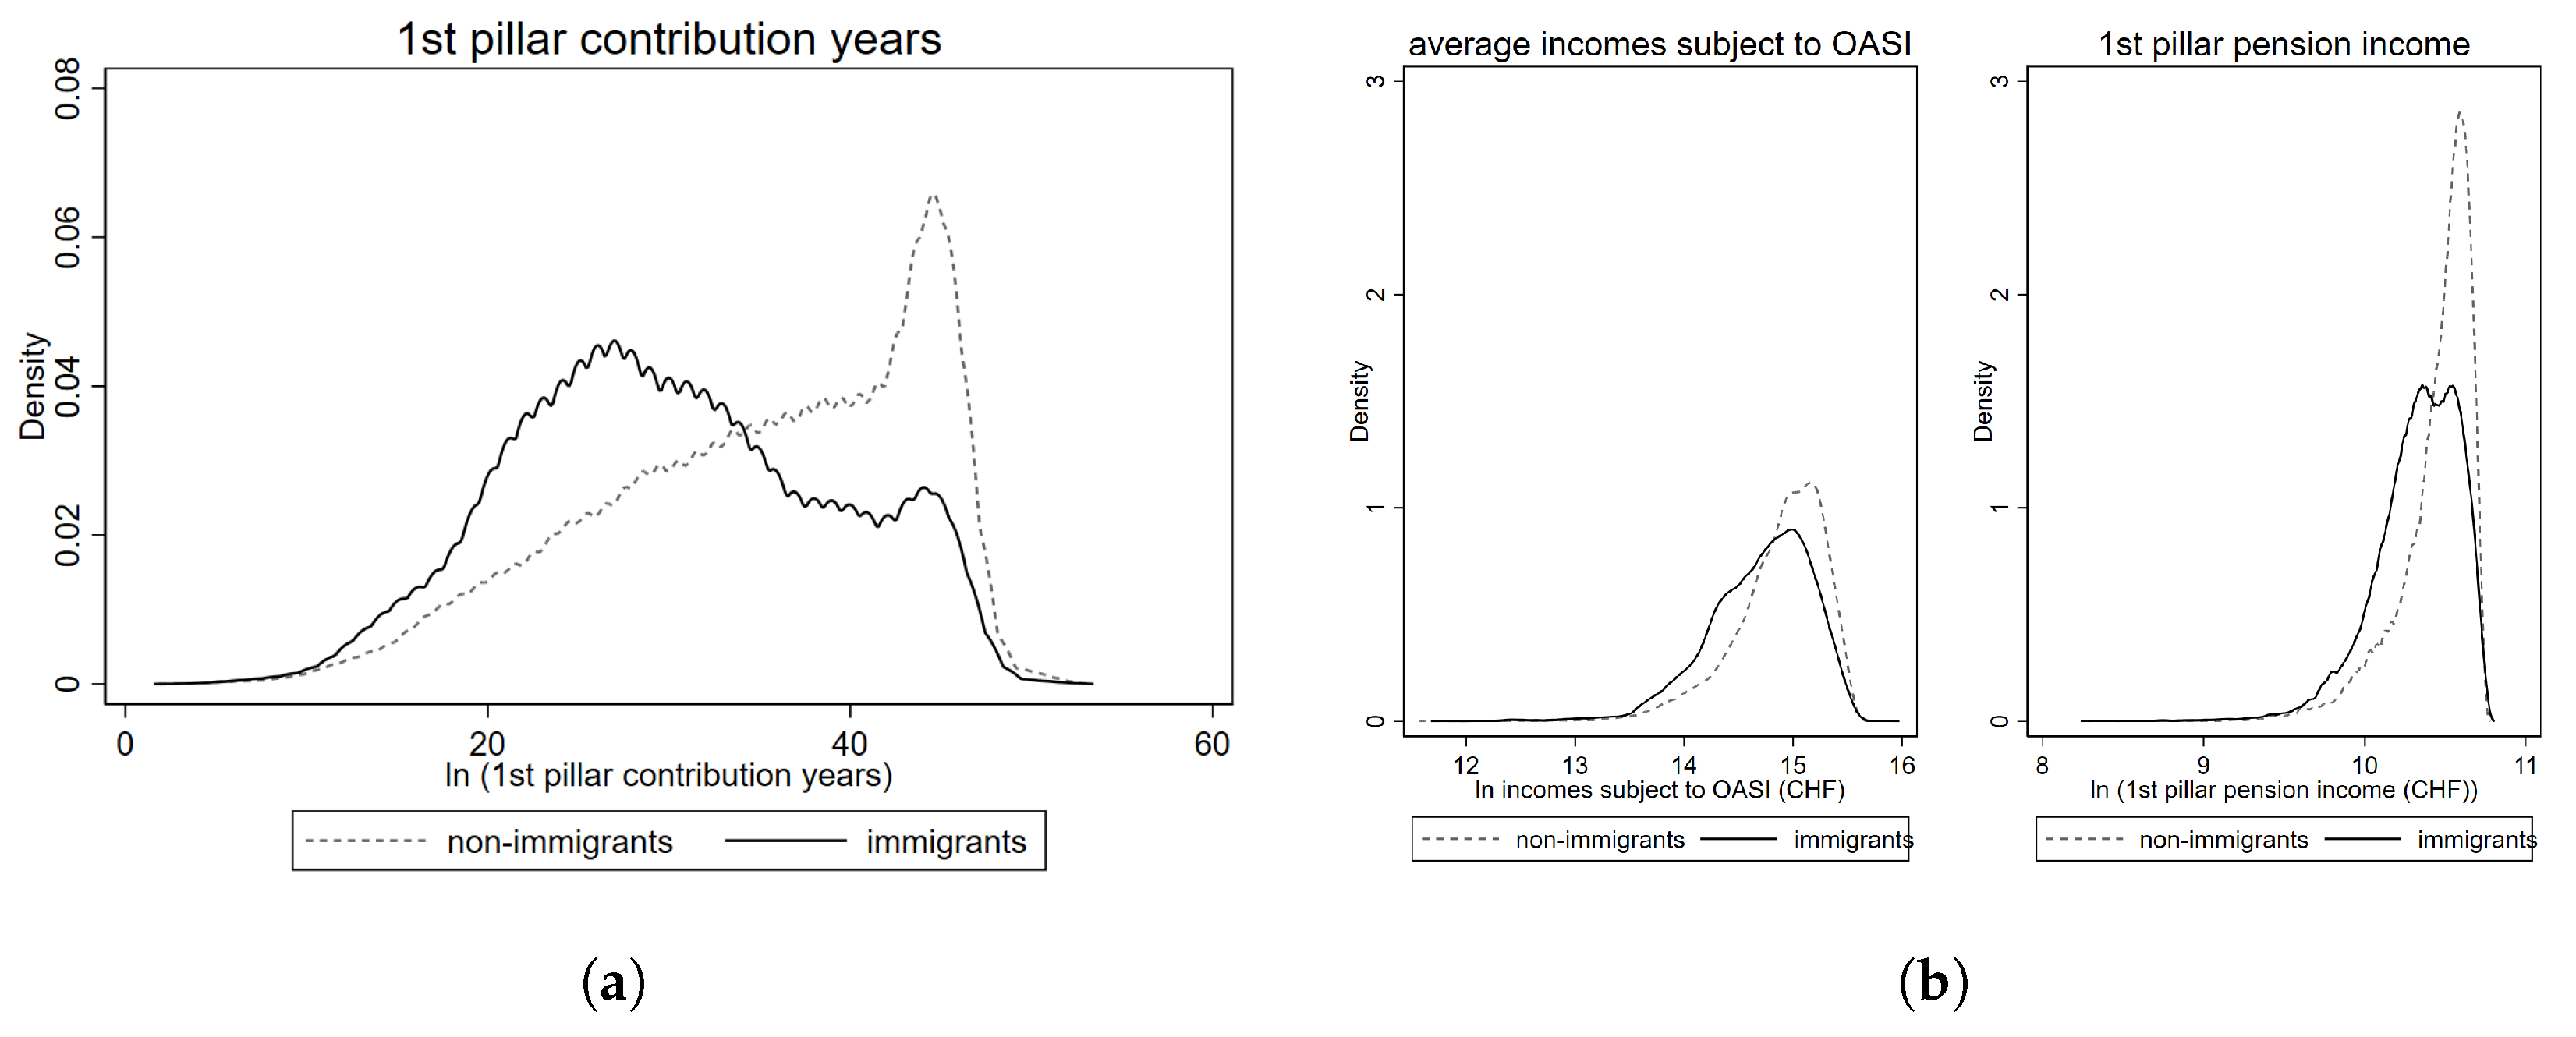
6.1. Descriptive Statistics
- Work History Variables—Aggregated incomes subject to OASI, including labor income and contributions from non-employed persons (e.g., unemployment benefits, disability, and survivors’ pensions);
- Inactivity Contributions—Included as a form of interpersonal solidarity for single persons and spousal solidarity for married persons;
- Sum of Childcare and Care Credits—Used as an instrument of caregiver solidarity;
- Partner’s Pension Assessment Base—Includes incomes subject to OASI, inactivity contributions, childcare, and care credits. The bases of both partners are summed and split for married or divorced partners, serving as an instrument of spousal solidarity;
- Partner’s Contribution Years—Included as they are equalized when determining the pension for married partners with two pensions, serving as an instrument of spousal solidarity.
6.2. Application 1: Assessing the Impact of the Accrual Rate on Vertical Equity
6.3. Application 2: Assessing Actuarial Neutrality
6.4. Application 3: Assessing Vertical Equity Across Marital Statuses
7. Discussion
Author Contributions
Funding
Institutional Review Board Statement
Informed Consent Statement
Data Availability Statement
Acknowledgments
Conflicts of Interest
Abbreviations
| DB | defined benefit |
| DC | defined contribution |
| DMSM | dynamic microsimulation model |
| EEA | European Economic Area |
| FSO | Federal Statistical Office |
| OB | Oaxaca-Blinder |
| OASI | Old Age and Survivors’ Insurance |
| RIF | recentered influence function |
| SRA | statutory retirement age |
| UQPE | Unconditional Quantile Partial Effect |
Appendix A
Appendix B
| Alignment | Source | Data | Dimensions | Age Groups | Scenario Variants |
|---|---|---|---|---|---|
| Mortality | FSO | BEVNAT, ESPOP, STATPOP | gender | year | Scenario A-00-2020 |
| Births | FSO | BEVNAT, ESPOP, STATPOP | female | year | Scenario A-00-2020 |
| Population | FSO | BEVNAT, ESPOP, STATPOP | gender | 5-year brackets | Scenario A-00-2020 |
| Fertility | FSO | BEVNAT, ESPOP, STATPOP | female | year | Scenario A-00-2020 |
| Marriage | FSO | BEVNAT | gender, civil state | 5-year brackets | |
| Divorce | FSO | BEVNAT | gender | 5-year brackets | |
| Disability | FSO | IV | gender | 5-year brackets | |
| Care | FSO | SGB | gender | year | |
| Care giving | FSO | SGB | gender | year | |
| Early retirement | FSO | NRS | gender | year | |
| Labor market participation | FSO | SAKE | gender | year | |
| Part-time | FSO | SAKE | gender | 5-year brackets | 3 categories of PT work |
| Unemployment | FSO | SAKE | gender | 5-year brackets | |
| Immigration | FSO | STATPOP | gender, nationality | Year | Scenario A-00-2020 |
| Emigration | FSO | STATPOP | gender, nationality | Year | Scenario A-00-2020 |
| 1 | A generalization of the econometric approach is provided in Section 4.2. |
| 2 | Section 4.1.3 offers an overview of the determination of first pillar of the pension income and the various income components of the relevant income. |
| 3 | This method is related to the Kitagawa decomposition, which focuses on a binary dependent outcome variable (Kitagawa 1955). |
| 4 | In the context of wage decomposition, this effect is often called the “discrimination effect”. |
| 5 | The Federal Council is the highest executive authority in Switzerland. It serves as the federal cabinet and consists of seven members who collectively act as the head of state and government. |
| 6 | The Federal Assembly is Switzerland’s national legislature, consisting of two chambers—the National Council and the Council of States. The National Council represents the Swiss population, with members elected based on proportional representation. The Council of States represents the cantons. |
| 7 | Decisions on popular initiatives require a double majority. This means that not only must a majority of the overall votes be achieved, but there must also be a majority of votes in at least 12 of the 23 cantons. |
| 8 | Surviving married women are entitled to a widow’s pension if they have at least one child at the time of widowhood, or if they are at least 45 years old at the time of the spouse’s death and have been married for at least 5 years. Surviving married men receive a widower’s pension only as long as they have children under the age of 18. |
| 9 | SBDL stands for “Sorting by the Difference between Logistic adjusted predicted probability and random number”. |
| 10 | Conversion from the log results of median pension income for men: = CHF 41,233 per year and = CHF 38,063 per year. This represents an 8.3% increase in pension income. |
| 11 | Given that the results are reported in logarithmic form, the difference (10.475 − 10.535 = −0.06) translates to a 6% difference. The exponential of 10.475 corresponds to a pension income of CHF 35,419 per year for immigrants. Consequently, the difference can also be calculated as CHF 35,419 − CHF 37,609 = − CHF 2190 per year. |
References
- Auerbach, Alan J., and Ronald Lee. 2011. Welfare and generational equity in sustainable unfunded pension systems. Journal of Public Economics 95: 16–27. [Google Scholar] [CrossRef] [PubMed]
- Blinder, Alan S. 1973. Wage discrimination: Reduced form and structural estimates. Journal of Human Resources 8: 436–55. [Google Scholar] [CrossRef]
- Bonenkamp, Jan. 2009. Measuring lifetime redistribution in dutch occupational pensions. De Economist 157: 49–77. [Google Scholar] [CrossRef]
- Bonnet, Carole, Dominique Meurs, and Benoît Rapoport. 2022. Gender pension gaps along the distribution: An application to the french case. Journal of Pension Economics & Finance 21: 76–98. [Google Scholar]
- Borsch-Supan, Axel, and Anette Reil-Held. 2001. How much is transfer and how much is insurance in a pay-as-you-go system? The german case. Scandinavian Journal of Economics 103: 505–24. [Google Scholar] [CrossRef]
- Broadbent, John, Michael Palumbo, and Elizabeth Woodman. 2006. The shift from defined benefit to defined contribution pension plans–implications for asset allocation and risk management. Reserve Bank of Australia, Board of Governors of the Federal Reserve System and Bank of Canada 1: 54. [Google Scholar]
- Chénard, Denis. 2000. Individual Alignment and Group Processing: An Application to Migration Processes in DYNACAN. Occasional Papers. Cambridge: University of Cambridge, Department of Applied Economics, pp. 238–50. [Google Scholar]
- Clements, Benedict, Csaba Feher, and Sanjeev Gupta. 2014. Equity Considerations in the Design of Public Pension Systems. Washington, DC: International Monetary Fund, chap. 15. [Google Scholar] [CrossRef]
- Cordova, Karla, Markus M Grabka, and Eva Sierminska. 2022. Pension wealth and the gender wealth gap. European Journal of Population 38: 755–810. [Google Scholar] [CrossRef]
- Dekkers, Gijs. 2013. An Introduction to MIDAS_BE, the Dynamic Microsimulation Model for Belgium. Technical Report, Working Paper. Brussels: Centre for Sociological Research. [Google Scholar]
- Dekkers, Gijs, and Richard Cumpston. 2012. On weights in dynamic-ageing microsimulation models. The International Journal of Microsimulation 5: 59–65. [Google Scholar] [CrossRef]
- Dekkers, Gijs, Karel Van den Bosch, Mikkel Barslund, Tanja Kirn, Nicolas Baumann, Nataša Kump, Philippe Liégeois, Amílcar Moreira, and Nada Stropnik. 2022. How do gendered labour market trends and the pay gap translate into the projected gender pension gap? A comparative analysis of five countries with low, middle and high gpgs. Social Sciences 11: 304. [Google Scholar] [CrossRef]
- Dekkers, Gijs, Seiichi Inagaki, and Raphaël Desmet. 2012. Dynamic microsimulation modeling for policy support: An application to Belgium and possibilities for Japan. The Review of Socionetwork Strategies 6: 31–47. [Google Scholar] [CrossRef]
- Disney, Richard. 2004. Are contributions to public pension programmes a tax on employment? Economic Policy 19: 268–311. [Google Scholar] [CrossRef]
- Duleep, Harriet Orcutt, and Daniel J. Dowhan. 2008. Adding immigrants to microsimulation models. Social Security Bulletin 68: 51. [Google Scholar] [PubMed]
- Fenge, Robert, and François Peglow. 2018. Decomposition of demographic effects on the german pension system. The Journal of the Economics of Ageing 12: 61–76. [Google Scholar] [CrossRef]
- Firpo, Sergio, Nicole M. Fortin, and Thomas Lemieux. 2009. Unconditional quantile regressions. Econometrica 77: 953–73. [Google Scholar]
- Firpo, Sergio P., Nicole M. Fortin, and Thomas Lemieux. 2018. Decomposing wage distributions using recentered influence function regressions. Econometrics 6: 28. [Google Scholar] [CrossRef]
- Frassi, Benedetta, Giorgio Gnecco, Fabio Pammolli, and Xue Wen. 2019. Intragenerational redistribution in a funded pension system. Journal of Pension Economics and Finance 18: 271–303. [Google Scholar] [CrossRef]
- FSO. 2017. Sterbetafeln für die Schweiz 2008/2013. Neuchâtel: Swiss Federal Statistical Office (FSO). [Google Scholar]
- FSO. 2019. Wie geht es den Personen mit Migrationshintergrund in der Schweiz? Analysen zur Lebensqualität der Bevölkerung mit Migrationshintergrund 2017. Neuchâtel: Swiss Federal Statistical Office (FSO). [Google Scholar]
- FSO. 2020a. Fruchtbarkeit. Neuchâtel: Swiss Federal Statistical Office (FSO). [Google Scholar]
- FSO. 2020b. Szenarien zur Bevölkerungsentwicklung. Ergebnisse des Referenzszenarios. Neuchâtel: Swiss Federal Statistical Office (FSO). [Google Scholar]
- FSO. 2022a. Lohnentwicklung im Jahr 2021: Schweizerischer Lohnindex. Neuchâtel: Swiss Federal Statistical Office (FSO). [Google Scholar]
- FSO. 2022b. Periodensterbetafeln Für Die Schweiz (1876–2150) Nach Jahr, Geschlecht Und Alter. Neuchâtel: Swiss Federal Statistical Office (FSO). [Google Scholar]
- FSO. 2023. Medienmitteilung—Schweizerische Lohnstrukturerhebung (LSE) 2022. Neuchâtel: Swiss Federal Statistical Office (FSO). [Google Scholar]
- Fuest, Clemens, Judith Niehues, and Andreas Peichl. 2010. The redistributive effects of tax benefit systems in the enlarged eu. Public Finance Review 38: 473–500. [Google Scholar] [CrossRef]
- Greene, William H. 2003. Econometric Analysis, 5th ed. Upper Saddle River: Prentice Hall. [Google Scholar]
- Gustafsson, Siv. 2001. Optimal age at motherhood. theoretical and empirical considerations on postponement of maternity in europe. Journal of Population Economics 14: 225–47. [Google Scholar] [CrossRef]
- Gustman, Alan L., Thomas L. Steinmeier, and Nahid Tabatabai. 2013. Redistribution under the social security benefit formula at the individual and household levels, 1992 and 2004. Journal of Pension Economics & Finance 12: 1–27. [Google Scholar]
- Ignacio Conde-Ruiz, Jorge, and Paola Profeta. 2007. The redistributive design of social security systems. The Economic Journal 117: 686–712. [Google Scholar] [CrossRef]
- Jann, Ben. 2008. The Blinder–Oaxaca Decomposition for Linear Regression Models. The Stata Journal 8: 453–79. [Google Scholar] [CrossRef]
- Jarner, Søren F, Snorre Jallbjørn, and Torben M. Andersen. 2024. Pension system design: Roles and interdependencies of tax-financed and funded pensions. Scandinavian Actuarial Journal 2024: 813–47. [Google Scholar] [CrossRef]
- Kirn, Tanja, and Gijs Dekkers. 2023. The projected development of the Gender Pension Gap in Switzerland: Introducing MIDAS_CH. International Journal of Microsimulation 16: 100–29. [Google Scholar]
- Kitagawa, Evelyn M. 1955. Components of a difference between two rates. Journal of the American Statistical Association 50: 1168–94. [Google Scholar]
- Klos, Jonas, Tim Krieger, and Sven Stöwhase. 2022. Measuring intra-generational redistribution in PAYG pension schemes. Public Choice 190: 53–73. [Google Scholar] [CrossRef]
- Lefèbvre, Mathieu, and Pierre Pestieau. 2006. The generosity of the welfare state towards the elderly. Empirica 33: 351–60. [Google Scholar] [CrossRef]
- Li, Jinjing, and Cathal O’Donoghue. 2013. An overview of binary alignment methods in microsimulation. In New Pathways in Microsimulation. Edited by Gijs Dekkers, Marcia Keegan and Cathal O’Donoghue. London: Routledge, pp. 233–48. [Google Scholar]
- Li, Jinjing, and Cathal O’Donoghue. 2014. Evaluating binary alignment methods in microsimulation models. Journal of Artificial Societies and Social Simulation 17: 1–19. [Google Scholar] [CrossRef]
- Li, Jinjing, Cathal O’Donoghue, and Gijs Dekkers. 2014. Dynamic Microsimulation. In Handbook of Microsimulation. Edited by Cathal O’Donoghue. London: Emerald Insight, chap. 5. pp. 305–33. [Google Scholar]
- Lindbeck, Assar, and Mats Persson. 2003. The gains from pension reform. Journal of Economic Literature 41: 74–112. [Google Scholar] [CrossRef]
- McDaniel, Paul R., and James R. Repetti. 1992. Horizontal and vertical equity: The Musgrave/Kaplow exchange. Florida Tax Review 1: 607. [Google Scholar] [CrossRef]
- Oaxaca, Ronald. 1973. Male-female wage differentials in urban labor markets. International Economic Review 14: 693–709. [Google Scholar] [CrossRef]
- Oaxaca, Ronald L., and Michael Ransom. 1998. Calculation of approximate variances for wage decomposition differentials. Journal of Economic and Social Measurement 24: 55–61. [Google Scholar] [CrossRef]
- OECD. 2019. Pensions at a Glance 2019. Paris: OECD Publishing. [Google Scholar]
- OECD. 2020. International Migration Outlook 2020. Paris: OECD Publishing. [Google Scholar]
- Platanakis, Emmanouil, and Charles Sutcliffe. 2016. Pension scheme redesign and wealth redistribution between the members and sponsor: The USS rule change in october 2011. Insurance: Mathematics and Economics 69: 14–28. [Google Scholar] [CrossRef][Green Version]
- Ponds, Eduard H. M., and Bart Van Riel. 2009. Sharing risk: The netherlands’ new approach to pensions. Journal of Pension Economics & Finance 8: 91–105. [Google Scholar]
- Queisser, Monika, and Edward Whitehouse. 2006. Neutral or fair?: Actuarial concepts and pension-system design. In OECD Social, Employment and Migration Working Papers. Paris: OECD Publishing. [Google Scholar]
- Rojas, Eder Andres Guarin, Laura Bernardi, and Flurina Schmid. 2018. First and second births among immigrants and their descendants in Switzerland. Demographic Research 38: 247–86. [Google Scholar] [CrossRef]
- Schonlau, Matthias, Martin Kroh, and Nicole Watson. 2013. The implementation of cross-sectional weights in household panel surveys. Statistics Surveys 7: 37–50. [Google Scholar] [CrossRef]
- Stadelmann-Steffen, Isabelle, and Lucas Leemann. 2024. Direct democracy. In The Oxford Handbook of Swiss Politics. Edited by Patrick Emmenegger, Flavia Fossati, Silja Häusermann, Yannis Papadopoulos, Pascal Sciarini and Adrian Vatter. Oxford: Oxford University Press, pp. 156–73. [Google Scholar]
- Steiner, Ilka, and Philippe Wanner. 2019. Migrants and Expats: The Swiss Migration and Mobility Nexus. Cham: Springer Nature. [Google Scholar]
- Swiss Federal Chancellery. 2025. Initiative für eine 13. AHV-Rente. Available online: https://www.admin.ch/gov/de/start/dokumentation/abstimmungen/20240303/initiative-fuer-eine-13-ahv-rente.html (accessed on 21 March 2025).
- Swiss Federal Council. 2024. Volksabstimmung vom 3. März 2024: Initiative für eine 13. AHV-Rente. Available online: https://www.admin.ch/dam/gov/de/Dokumentation/Abstimmungen/Marz2024/marzo_DE.pdf.download.pdf/marzo_DE.pdf (accessed on 21 March 2025).
- SwissVotes. 2025. Volksabstimmung: Initiative für eine 13. AHV-Rente. Available online: https://swissvotes.ch/vote/665.00 (accessed on 21 March 2025).
- Van den Bosch, Karel, Tanja Kirn, Nataša Kump, Philippe Liégeois, Amílcar Moreira, Nada Stropnik, Mikkel Barslund, Vincent Vergnat, and Gijs Dekkers. 2024. The impact of taking up care tasks on pensions: Results of typical-case simulations for several European countries. European Journal of Social Security 26: 44–63. [Google Scholar] [CrossRef]
- Van Hek, Margriet, Gerbert Kraaykamp, and Maarten H. J. Wolbers. 2015. Family resources and male–female educational attainment: Sex specific trends for Dutch cohorts (1930–1984). Research in Social Stratification and Mobility 40: 29–38. [Google Scholar] [CrossRef]
- Verma, Vijay, Gianni Betti, and Giulio Ghellini. 2006. Cross-Sectional and Longitudinal Weighting in a Rotational Household Panel: Applications to EU-SILC. Siena: Università di Siena, Dipartimento di metodi quantitativi. [Google Scholar]
- Wolf, Ishay, and Lorena Caridad López del Río. 2024. Fair and sustainable pension system: Market equilibrium using implied options. Risks 12: 127. [Google Scholar] [CrossRef]

| Single | Married | Divorced | Widowed | Overall | ||
|---|---|---|---|---|---|---|
| One Spouse Retired | Both Retired | |||||
| Women | 22,932 | 18,444 | 20,184 | 23,364 | 26,316 | 22,608 |
| Men | 22,572 | 24,072 | 20,808 | 23,904 | 26,844 | 22,344 |
| pp | 1.6% | −23.4% | −3.0% | −2.3% | −2.0% | 1.2% |
| in % of maximal first pillar pension | ||||||
| Women | 80.0% | 64.3% | 70.4% | 81.5% | 91.8% | 78.8% |
| Men | 78.7% | 83.9% | 72.6% | 83.3% | 93.6% | 77.9% |
| 2020 | 2025 | 2030 | 2035 | 2040 | 2045 | 2050 | 2070 | |
|---|---|---|---|---|---|---|---|---|
| Perm. resident population (mill.) | 8.6 | 9.1 | 9.4 | 9.8 | 10.0 | 10.2 | 10.4 | 11.2 |
| Annual growth in % | 0.8 | 0.8 | 0.8 | 0.6 | 0.5 | 0.4 | 0.4 | 0.4 |
| Due to migration balance in % | 0.6 | 0.6 | 0.6 | 0.5 | 0.4 | 0.3 | 0.3 | 0.3 |
| Due to birth surplus in % | 0.3 | 0.2 | 0.2 | 0.2 | 0.1 | 0.1 | 0.1 | 0.1 |
| Foreigners’ share in % | 25.5 | 26.6 | 27.9 | 29.0 | 29.8 | 30.5 | 31.1 | 33.5 |
| Share of under 15-year-olds in % | 15.1 | 15.1 | 15.0 | 14.8 | 14.6 | 14.4 | 14.2 | 13.8 |
| Share of +65-year-olds and in % | 18.9 | 20.3 | 22.1 | 23.6 | 24.4 | 25.0 | 25.6 | 28.6 |
| Share of +80-Year-Olds in % | 5.4 | 6.2 | 7.0 | 7.6 | 8.5 | 9.8 | 10.7 | 13.7 |
| Age quotient in % | 30.9 | 34.0 | 38.3 | 41.8 | 43.6 | 44.9 | 46.5 | 51.5 |
| Youth quotient in % | 32.6 | 33.7 | 34.6 | 35.1 | 35.1 | 35.0 | 35.0 | 34.5 |
| Overall employment rate in % | 58.0 | 57.0 | 56.0 | 55.2 | 54.7 | 54.2 | 53.7 | 52.4 |
| Employment Rate of 15–64 in % | 84.4 | 84.3 | 84.3 | 84.6 | 84.7 | 84.6 | 84.5 | 84.5 |
| % of +65 y per 20–64-y workers | 35.6 | 39.2 | 44.0 | 47.9 | 49.9 | 51.5 | 53.3 | 57.1 |
| Single | Married | Divorced | Widowed | Overall | ||
|---|---|---|---|---|---|---|
| One Spouse Retired | Both Retired | |||||
| Women | 34,621 | 32,206 | 25,991 | 32,992 | 30,431 | 30,616 |
| Men | 36,786 | 38,990 | 26,035 | 35,486 | 32,197 | 32,285 |
| pp | −5.9% | −17.4% | −0.2% | −7.0% | −5.5% | −5.2% |
| in % of maximal first pillar pension | ||||||
| Women | 79.8% | 74.2% | 59.9% | 76.0% | 70.1% | 70.6% |
| Men | 84.8% | 89.9% | 60.0% | 81.8% | 74.2% | 74.4% |
| Observations | 17,179 | 1241 | 12,166 | 7862 | 20,583 | 59,031 |
| Decomposition | In Percent | ||||||||
|---|---|---|---|---|---|---|---|---|---|
| Coeff. | Robust SE | z | P > |z| | [95% conf. int.] | % | [95% conf. int.] | |||
| Men | |||||||||
| pp | 0.0800 | 0.0025 | 32.30 | 0.000 | 0.0752 | 0.0849 | |||
| Eff. of char. | 0.0000 | 0.0018 | 0.00 | 1.000 | −0.0036 | 0.0036 | 0 | −4.5 | 4.5 |
| Eff. of coeff. | 0.0800 | 0.0017 | 47.52 | 0.000 | 0.0767 | 0.0833 | 100 | 95.6 | 106.3 |
| Women | |||||||||
| pp | 0.0800 | 0.0036 | 22.43 | 0.000 | 0.0730 | 0.0870 | |||
| Eff. of char. | 0.0000 | 0.0026 | 0.00 | 1.000 | −0.0050 | 0.0050 | 0 | −6.3 | 6.3 |
| Eff. of coeff. | 0.0800 | 0.0025 | 32.41 | 0.000 | 0.0752 | 0.0849 | 100 | 93.7 | 106.3 |
| q10 | q25 | q50 | q75 | q90 | ||||||
|---|---|---|---|---|---|---|---|---|---|---|
| Overall | ||||||||||
| Men (13 × OASI 2026) | 10.361 *** | (0.005) | 10.512 *** | (0.003) | 10.627 *** | (0.002) | 10.706 *** | (0.001) | 10.755 *** | (0.001) |
| Men (OASI 2026) | 10.281 *** | (0.005) | 10.432 *** | (0.003) | 10.547 *** | (0.002) | 10.625 *** | (0.001) | 10.675 *** | (0.001) |
| pp (13 × OASI 26- OASI 26) | 0.080 *** | (0.007) | 0.080 *** | (0.004) | 0.080 *** | (0.002) | 0.080 *** | (0.002) | 0.080 *** | (0.002) |
| Effects of characteristics | 0.000 | (0.005) | 0.000 | (0.004) | 0.000 | (0.002) | 0.000 | (0.001) | 0.000 | (0.001) |
| Effects of coefficients | 0.080 *** | (0.005) | 0.080 *** | (0.003) | 0.080 *** | (0.002) | 0.080 *** | (0.002) | 0.080 *** | (0.001) |
| Effect of coefficients | ||||||||||
| Incomes subject to OASI | 0.000 | (0.405) | 0.000 | (0.235) | −0.000 | (0.162) | −0.120 | (0.125) | −0.329 *** | (0.098) |
| Inactivity contributions | 0.000 | (0.067) | −0.000 | (0.037) | 0.000 | (0.021) | 0.004 | (0.015) | 0.004 | (0.011) |
| Child care credits | 0.000 | (0.002) | −0.000 | (0.001) | −0.000 | (0.001) | −0.000 | (0.001) | −0.000 | (0.001) |
| Care credits | 0.000 | (0.010) | 0.000 | (0.006) | −0.000 | (0.003) | −0.001 | (0.002) | −0.003 | (0.002) |
| Contribution years | 0.000 | (0.138) | 0.000 | (0.068) | −0.000 | (0.046) | −0.019 | (0.032) | −0.026 | (0.020) |
| Constant | 0.080 | (0.358) | 0.080 | (0.192) | 0.080 | (0.130) | 0.216 * | (0.107) | 0.434 *** | (0.092) |
| Overall | ||||||||||
| Women (13 × OASI 2026) | 10.237 *** | (0.006) | 10.411 *** | (0.004) | 10.567 *** | (0.003) | 10.666 *** | (0.002) | 10.724 *** | (0.002) |
| Women (OASI 2026) | 10.157 *** | (0.006) | 10.331 *** | (0.004) | 10.487 *** | (0.003) | 10.586 *** | (0.002) | 10.644 *** | (0.002) |
| pp (13 × OASI 26- OASI 26) | 0.080 *** | (0.009) | 0.080 *** | (0.006) | 0.080 *** | (0.004) | 0.080 *** | (0.003) | 0.080 *** | (0.002) |
| Effect of characteristics | 0.000 | (0.006) | 0.000 | (0.005) | 0.000 | (0.003) | 0.000 | (0.002) | 0.000 | (0.001) |
| Effect of coefficients | 0.080 *** | (0.006) | 0.080 *** | (0.004) | 0.080 *** | (0.002) | 0.080 *** | (0.002) | 0.080 *** | (0.002) |
| Effect of coefficients | ||||||||||
| Incomes subject to OASI | 0.000 | (0.357) | −0.000 | (0.221) | 0.000 | (0.152) | −0.008 | (0.114) | −0.183 | (0.102) |
| Inactivity contributions | −0.000 | (0.004) | 0.000 | (0.002) | 0.000 | (0.002) | −0.000 | (0.001) | −0.002 | (0.002) |
| Child care credits | 0.000 | (0.004) | −0.000 | (0.002) | 0.000 | (0.002) | −0.000 | (0.002) | −0.002 | (0.002) |
| Care credits | 0.000 | (0.017) | −0.000 | (0.009) | 0.000 | (0.005) | −0.000 | (0.003) | −0.002 | (0.003) |
| Contribution years | 0.000 | (0.139) | −0.000 | (0.081) | 0.000 | (0.053) | 0.001 | (0.034) | −0.002 | (0.025) |
| Constant | 0.080 | (0.320) | 0.080 | (0.195) | 0.080 | (0.134) | 0.087 | (0.102) | 0.272 ** | (0.094) |
| Decomposition | In Percent | ||||||||
|---|---|---|---|---|---|---|---|---|---|
| Coeff. | Robust SE | z | P > |z| | [95% conf. int.] | % | [95% conf. int.] | |||
| pp | −0.0604 | 0.0042 | −14.25 | 0.00 | −0.069 | −0.052 | |||
| Eff. of char. | −0.0561 | 0.0036 | −15.73 | 0.00 | −0.063 | −0.049 | 92.8 | 84.3 | 101.4 |
| Eff. of coeff. | −0.0043 | 0.0028 | −1.54 | 0.12 | −0.010 | 0.001 | 7.2 | −1.4 | 15.8 |
| q10 | q25 | q50 | q75 | q90 | ||||||
|---|---|---|---|---|---|---|---|---|---|---|
| Overall | ||||||||||
| Immigrants | 10.146 *** | (0.008) | 10.326 *** | (0.005) | 10.475 *** | (0.004) | 10.585 *** | (0.003) | 10.661 *** | (0.003) |
| Non-immigrants | 10.238 *** | (0.005) | 10.406 *** | (0.003) | 10.535 *** | (0.002) | 10.615 *** | (0.001) | 10.667 *** | (0.001) |
| Total gap (IM − NIM) | −0.092 *** | (0.009) | −0.080 *** | (0.006) | −0.060 *** | (0.004) | −0.030 *** | (0.003) | −0.006 * | (0.003) |
| Effects of characteristics | −0.088 *** | (0.007) | −0.068 *** | (0.005) | −0.056 *** | (0.004) | −0.032 *** | (0.002) | −0.022 *** | (0.002) |
| Effects of coefficients | −0.004 | (0.006) | −0.011 ** | (0.003) | −0.004 | (0.003) | 0.002 | (0.003) | 0.016 *** | (0.004) |
| Effects of Characteristics | ||||||||||
| Incomes subject to OASI | −0.030 *** | (0.004) | −0.024 *** | (0.003) | −0.012 *** | (0.001) | −0.009 *** | (0.001) | −0.007 *** | (0.001) |
| Inactivity contributions | 0.005 *** | (0.001) | 0.000 | (0.000) | −0.001 *** | (0.000) | −0.001 * | (0.000) | −0.002 *** | (0.000) |
| Child care credits | 0.001 * | (0.001) | 0.001 * | (0.000) | 0.000 | (0.000) | 0.001 ** | (0.000) | 0.001 ** | (0.000) |
| Care credits | 0.000 | (0.002) | −0.005 *** | (0.001) | −0.007 *** | (0.001) | −0.006 *** | (0.001) | −0.004 *** | (0.001) |
| Contribution years | −0.065 *** | (0.005) | −0.041 *** | (0.003) | −0.036 *** | (0.002) | −0.018 *** | (0.001) | −0.010 *** | (0.001) |
| Effects of Coefficients | ||||||||||
| Incomes subject to OASI | −0.207 | (0.446) | 0.897 *** | (0.243) | 0.004 | (0.182) | 0.100 | (0.144) | 0.177 | (0.126) |
| Inactivity contributions | −0.011 | (0.011) | 0.012 * | (0.006) | 0.003 | (0.005) | −0.018 *** | (0.004) | 0.009 * | (0.004) |
| Child care credits | 0.003 | (0.004) | −0.005 ** | (0.002) | −0.007 *** | (0.001) | 0.003 * | (0.001) | 0.003 | (0.002) |
| Care credits | −0.047 *** | (0.014) | −0.027 *** | (0.007) | −0.000 | (0.005) | 0.004 | (0.004) | 0.006 | (0.004) |
| Contribution years | −0.227 | (0.167) | 0.078 | (0.083) | 0.908 *** | (0.061) | 0.485 *** | (0.046) | 0.337 *** | (0.037) |
| Constant | 0.486 | (0.398) | −0.967 *** | (0.201) | −0.913 *** | (0.155) | −0.571 *** | (0.127) | −0.515 *** | (0.122) |
| Single | Married | Divorced | Widowed | |||||||
|---|---|---|---|---|---|---|---|---|---|---|
| One Spouse Retired | Both Retired | |||||||||
| Overall | ||||||||||
| Women | 10.487 *** | (0.003) | 10.395 *** | (0.015) | 10.484 *** | (0.002) | 10.480 *** | (0.003) | 10.142 *** | (0.006) |
| Men | 10.547 *** | (0.002) | 10.621 *** | (0.005) | 10.503 *** | (0.003) | 10.536 *** | (0.003) | 10.162 *** | (0.009) |
| pp | −0.060 *** | (0.003) | −0.226 *** | (0.015) | −0.019 *** | (0.004) | −0.056 *** | (0.004) | −0.020 | (0.010) |
| Effect of characteristics | −0.067 *** | (0.004) | −0.209 *** | (0.021) | −0.082 *** | (0.005) | −0.103 *** | (0.005) | −0.122 *** | (0.011) |
| Effect of coefficients | 0.007 | (0.004) | −0.017 | (0.019) | 0.062 *** | (0.005) | 0.047 *** | (0.004) | 0.102 *** | (0.011) |
| Effect of characteristics | ||||||||||
| Incomes subject to OASI | −0.072 *** | (0.003) | −0.083 *** | (0.023) | −0.085 *** | (0.003) | −0.092 *** | (0.004) | −0.129 *** | (0.007) |
| Inactivity contributions | −0.014 *** | (0.003) | −0.028 | (0.015) | −0.010 *** | (0.001) | −0.019 *** | (0.003) | −0.018 *** | (0.004) |
| Child care credits | 0.019 *** | (0.001) | 0.007 * | (0.003) | 0.000 | (0.000) | 0.004 *** | (0.001) | 0.001 * | (0.001) |
| Care credits | 0.006 *** | (0.001) | −0.032 *** | (0.007) | 0.009 *** | (0.001) | 0.001 | (0.001) | 0.009 *** | (0.002) |
| Contribution years | −0.007 *** | (0.001) | −0.072 *** | (0.013) | 0.018 *** | (0.002) | −0.001 | (0.001) | 0.006 | (0.004) |
| Pension assessment base (partner) | −0.009 *** | (0.002) | 0.004 *** | (0.001) | 0.010 *** | (0.002) | ||||
| Contribution years (partner) | −0.006 *** | (0.001) | ||||||||
| Effect of coefficients | ||||||||||
| Incomes subject to OASI | 0.761 *** | (0.161) | −0.342 | (0.670) | 3.088 *** | (0.179) | 0.232 | (0.198) | 1.783 *** | (0.402) |
| Inactivity contributions | 0.135 *** | (0.015) | 0.020 | (0.024) | 0.007 * | (0.003) | 0.048 *** | (0.013) | 0.049 *** | (0.010) |
| Child care credits | 0.008 *** | (0.001) | −0.000 | (0.008) | 0.006 * | (0.003) | 0.025 *** | (0.005) | −0.016 * | (0.007) |
| Care credits | 0.022 *** | (0.004) | 0.107 *** | (0.023) | 0.039 *** | (0.006) | 0.008 | (0.005) | 0.066 *** | (0.012) |
| Contribution years | −0.370 *** | (0.050) | 1.150 *** | (0.227) | −1.790 *** | (0.073) | −0.497 *** | (0.063) | −1.062 *** | (0.106) |
| Pension assessment base (partner) | −0.206 *** | (0.061) | 0.111 ** | (0.034) | 0.799 *** | (0.136) | ||||
| Contribution years (partner) | 0.118 * | (0.050) | ||||||||
| Constant | −0.550 *** | (0.134) | −0.952 | (0.518) | −1.201 *** | (0.157) | 0.120 | (0.170) | −1.518 *** | (0.326) |
| Observations (women; men) | 7967 | 9212 | 357 | 884 | 9949 | 10,214 | 5255 | 4868 | 4677 | 1575 |
Disclaimer/Publisher’s Note: The statements, opinions and data contained in all publications are solely those of the individual author(s) and contributor(s) and not of MDPI and/or the editor(s). MDPI and/or the editor(s) disclaim responsibility for any injury to people or property resulting from any ideas, methods, instructions or products referred to in the content. |
© 2025 by the authors. Licensee MDPI, Basel, Switzerland. This article is an open access article distributed under the terms and conditions of the Creative Commons Attribution (CC BY) license (https://creativecommons.org/licenses/by/4.0/).
Share and Cite
Kirn, T.; Dekkers, G. Assessing Vertical Equity in Defined Benefit Pension Plans: An Application to Switzerland. Risks 2025, 13, 89. https://doi.org/10.3390/risks13050089
Kirn T, Dekkers G. Assessing Vertical Equity in Defined Benefit Pension Plans: An Application to Switzerland. Risks. 2025; 13(5):89. https://doi.org/10.3390/risks13050089
Chicago/Turabian StyleKirn, Tanja, and Gijs Dekkers. 2025. "Assessing Vertical Equity in Defined Benefit Pension Plans: An Application to Switzerland" Risks 13, no. 5: 89. https://doi.org/10.3390/risks13050089
APA StyleKirn, T., & Dekkers, G. (2025). Assessing Vertical Equity in Defined Benefit Pension Plans: An Application to Switzerland. Risks, 13(5), 89. https://doi.org/10.3390/risks13050089


