Article

Study on the Nonlinear Volatility Correlation Characteristics Between China’s Carbon and Energy Markets

1
School of Finance and Trade, Wenzhou Business College, Wenzhou 325035, China
2
School of Management, Xi’an University of Science and Technology, Xi’an 710054, China
*
Author to whom correspondence should be addressed.
Risks 2025, 13(10), 205; https://doi.org/10.3390/risks13100205
Submission received: 8 September 2025 / Revised: 7 October 2025 / Accepted: 13 October 2025 / Published: 17 October 2025

Abstract

The energy sector, as a major source of carbon emissions, has a significant impact on the operation of the carbon market and the management of carbon emissions. With the introduction of the “dual carbon” goals, the Chinese government has actively implemented measures to reduce carbon emissions, making the carbon market an important tool for emission reduction. Therefore, characterizing the inter-market relationships helps enhance decision-making for market participants and promotes sustainable economic development. This study selects the price of the Chinese carbon emission trading market, which began trading on 16 July 2021, as a representative of the carbon market price. In terms of energy market selection, the prices of electricity, new energy, and coal are chosen as representatives of the energy market. From the perspective of the nonlinear dependency structure between market prices, a “carbon ↔ electricity ↔ new energy ↔ coal market” multi-to-multi interaction model is constructed, and the MSVAR model is employed to study the nonlinear dependency characteristics between market prices under interactive influences. The results show that there is a significant nonlinear dependency structure between the four market prices, especially between the carbon market and the new energy market. These market prices exhibit different behavioral characteristics under different states, with non-stationary states being the most common. There is a strong positive correlation between the electricity market and new energy market prices, while the relationship between the carbon market and other market prices is relatively weaker. The relevant conclusions provide valuable insights for policymakers and investors, helping them better understand and predict future market dynamics.

1. Introduction

Against the backdrop of China’s ambitious “dual carbon” targets, the national carbon emissions trading scheme (ETS), launched in July 2021, has become a pivotal market-based instrument for decarbonization. As the energy sector is both the primary source of emissions and the core participant in the ETS, understanding the intricate linkage and volatility spillovers between the carbon market and core energy markets is crucial for policy effectiveness and financial risk management. While prior research has explored carbon-energy market dynamics, studies have often focused on mature international markets or assumed linear, stable relationships. Such approaches may be inadequate for China’s nascent national market, which is prone to structural instability and nonlinear dynamics during its initial phase. This leaves a critical research gap in characterizing the complex, regime-switching interdependencies within this new market nexus, which this study aims to address.
To fill this gap, this paper investigates the nonlinear volatility correlation and structural dependency between China’s national carbon market and its key energy counterparts—electricity, new energy, and coal. We employ a Markov Switching Vector Autoregression (MSVAR) model, a robust method for capturing structural breaks and shifts between distinct market regimes. The primary goal of this work is to provide one of the first empirical analyses of these nonlinear interactions. Our findings reveal a significant nonlinear dependency structure among the markets, where relationships vary substantially across different states, such as high- and low-volatility periods. These results offer a more nuanced understanding of the market’s behavior and provide crucial insights for policymakers designing stable regulatory frameworks and for investors developing dynamic risk-hedging strategies in China’s evolving green economy.

2. Literature Review

The relationship between carbon markets and energy markets is a particularly critical issue globally. As the world collectively works to address climate change and countries set carbon reduction targets, the interaction between these two markets has become increasingly prominent. Carbon trading, as an economic tool, is considered an effective way to control greenhouse gas emissions (Wang and Hu 2018; Wesseh et al. 2023). At the same time, the price fluctuations in the energy market also have a significant impact on the carbon market, which in turn affects the stability and development of the global economy (Ma et al. 2021). In recent years, international academia has conducted in-depth discussions on the price volatility of international carbon markets and energy markets. Daskalakis et al. (2009) established a statistical model to study the relationship between carbon prices and oil and natural gas prices, finding a significant positive correlation among the three in the short term. Reboredo (2015) studied the dependence and systemic risk between oil and renewable energy stock prices in detail, discovering significant volatility between the two. Chevallier (2011) examined the relationship between carbon prices, macroeconomic factors, and energy dynamics in the same journal, finding that specific political events and policy changes had a significant impact on the prices of all three. This finding aligns with the work of Don et al. (2014), who examine ultra-high frequency data to assess the extent of the development in the futures market of the EU Emissions Trading Scheme.
Since 2013, China has begun establishing carbon emissions trading markets in several regions. The development and expansion of these regional carbon markets have provided rich empirical data for studying the relationship between carbon markets and energy market prices. Within China, the study of the volatility relationship between regional carbon markets and energy market prices has also become a popular research field. As the world’s largest carbon emitter, China plays a critical role in global carbon emissions control and reduction. Due to differences in economic development levels, industrial structure, and energy consumption patterns across different regions in China, the relationship between carbon markets and energy market prices exhibits distinct characteristics.
An et al. (2023) explored the nonlinear multifractal relationship between carbon price volatility and China’s Economic Policy Uncertainty (CNEPU) in the Shenzhen, Beijing, Tianjin, and national carbon markets. The study found that there is no linear relationship between price volatility and CNEPU in any of the carbon markets. The association between price volatility and CNEPU has not yet formed, and in the carbon markets of Shenzhen, Beijing, and Tianjin, long-term relationships display anti-persistent multifractal characteristics, meaning that an increase in CNEPU leads to a reduction in price volatility. Shi et al. (2023) chose the Shenzhen carbon market and used a structural VAR model to study the dynamic relationships between regional carbon emission prices, energy prices, macroeconomic levels, and weather conditions in China. They found that carbon emission prices are mainly influenced by their own historical prices. They are positively correlated with oil and natural gas prices and negatively correlated with coal prices. Zhao and Sun (2022) based on the identified mechanisms between carbon markets and energy markets, applied the MS-AR model to segment the carbon price and trading volume, dividing the carbon market into different states, such as “down-fluctuation-up level of price” and “low-upper-high level fluctuation of transaction volume”. They tested the heterogeneity of corporate value fluctuations induced by pollution enterprises’ market choices under different market states. With the increasing financial attributes of carbon assets, Guo et al. (2024) and Hu and Zhou (2022), based on the Diebold-Yilmaz model, compared the carbon trading prices of the Hubei carbon market, representing China’s carbon market, with the EU carbon trading system. They found that the “carbon-commodity-financial market” linkage and stability in China are weaker than those in the EU, especially in the face of shock impacts from special events, which increases the volatility of the spillover index. After the launch of the national carbon market, research by Su et al. (2023) indicated that the return spillover index between the national carbon market, energy market, electricity market, and financial market exhibits bidirectional volatility, with significant time variability. The spillover index is also affected by domestic and international events. In fact, in the context of a relatively weak financial market effectiveness in China, with a low proportion of direct financing and insufficient innovation in carbon financial products, the linkage between carbon emissions and financial assets is weak, and carbon trading behaviors are insufficiently marketized, which still needs improvement compared to the EU (Liu et al. 2022). Results from Che and Mou (2022) show that from the perspective of short-term shocks, the carbon market has a negative constraint relationship with energy futures and spot markets. However, from the long-term dynamic volatility perspective, the return series exhibits long memory characteristics, with the volatility spillover risk of the carbon market being greater than that of the energy market. The underlying assets corresponding to energy futures and spot markets are more stable than those corresponding to carbon emissions.

3. Research Methods and Variable Selection

3.1. Research Methods

This paper primarily investigates the dynamic relationships between the carbon market, electricity market, renewable energy market, and coal market. Before applying the VAR model, it is necessary to determine the optimal lag length for each variable and conduct a cointegration test for the four variables. Conducting a cointegration test for non-stationary series is essential. In the unit root tests, this study mainly employs the Dickey–Fuller (ADF) test, the Phillips-Perron (PP) test, and the Kwiatkowski-Phillips-Schmidt-Shin (KPSS) test, as recommended by Henriques and Sadorsky (Amaefula 2021; Humbatova 2023).
The concept of regime switching was initially formed in the 1950s, with Henderson and Quandt (1958) and Goldfeld et al. (1973) being early researchers in this field, while Hamilton’s work (Hamilton 1994) is regarded as the foundation of the Markov Switching (MS) model (Hieu and Hai 2023; Henderson and Quandt 1958; Goldfeld et al. 1973; Bissinger et al. 1989).
If regime switching is not considered, the traditional Vector Autoregression (VAR) model (n-dimensional, lag p-order) can be expressed as:
y t = ϕ 1 y t 1 + ϕ 2 y t 2 + + ϕ p y t p + ε t
In this model, p represents the effective lag period that describes the economic system, ϕ j ( j = 1 , 1 , p ) denotes the n × n coefficient matrix, and ε t is the random disturbance term. It is assumed that ε t follows a Gaussian white noise distribution with E ( ε t ) = 0 , E ( ε t ε t ) = Ω . When using the traditional VAR model to study the relationships between economic variables, structural changes in time series data and nonlinear characteristics are typically ignored. Therefore, in this study, the Markov Switching Vector Autoregression (MSVAR) model is introduced to overcome these limitations. The MSVAR model represents different states during different periods. The transition probabilities between two different states in the MSVAR model can be expressed as:
P r [ s t = 1 / s t 1 = 1 ] = p P r [ s t = 0 / s t 1 = 1 ] = 1 p P r [ s t = 0 / s t 1 = 0 ] = q P r [ s t = 1 / s t 1 = 0 ] = 1 q
Here, P r represents the probability. If the current state is s t 1 = 1 , the probability of remaining in this state in the next period is p; if the current state is s t 1 = 0 , the probability of remaining in this state in the next period is q. The probability matrix corresponding to Equation (3) is:
P = p 1 q 1 p q
Equation (3) can be further expressed as:
P r [ s t = 1 / s t 1 = 1 ] = p 11 P r [ s t = 0 / s t 1 = 1 ] = p 12 P r [ s t = 0 / s t 1 = 0 ] = p 22 P r [ s t = 1 / s t 1 = 0 ] = p 21
From Equation (4), the relationship between the state variable s t and the Markov chain can be derived. Therefore, the definition of the Markov chain can be expressed as:
P r ( s t = j / s t 1 = i ) = p j i
In this section, the carbon market (CEAP), electricity market (WEID), new energy market (WNID), and coal market price (SWCP) are used to construct the MSVAR model. These four market indicators form a four-dimensional time series vector y t = ( y 1 t , y 2 t , y 3 t , y 4 t ) . For state St, p-order VAR model can be established for the time series under study:
y t = ϕ 1 ( s t ) y t 1 + ϕ 2 ( s t ) y t 2 + + ϕ p ( s t ) y t p + ε t
Here, s t is the state variable, taking values in {1,2}. s t = 1 represents the stable period, and s t = 2 represents the unstable period.
The error term μ t ( s t ) N I D ( 0 , σ ( s t ) ) . The transition probabilities across the two irreducible regimes of s t can be represented by a Markov transition matrix:
P = p 11 1 p 22 1 p 11 p 22
In Equation (7), if the regime state of the variable under study changes, the mean will also change accordingly. In the MSVAR model, the regime variable affects the coefficients of the lagged terms, the intercept, and the random disturbance terms.

3.2. Variable Selection

China’s pilot carbon emissions trading began in 2013, first launched in cities such as Shenzhen, Shanghai, and Tianjin, and gradually expanded to more regions and industries. Through these pilot projects, China explored the carbon market mechanism, encouraged enterprises to reduce carbon emissions, and promoted sustainable development. Over time, the carbon emissions trading system was gradually improved, and on 16 July 2021, the national carbon market was officially launched. It has since become the world’s largest market in terms of greenhouse gas emissions coverage, marking an important step toward achieving the carbon neutrality goal (Zou and Zhang 2020).
On the opening day of the national carbon market, the opening price was 48 yuan/ton. Within just 10 min, the cumulative transaction value exceeded 22 million yuan. By the end of the day, the total trading volume reached 4.1 million tons, with a transaction value of 210.23 million yuan. The closing price stood at 51.23 yuan/ton, representing a 6.73% increase.
In this paper, the national carbon market’s average carbon emission allowance price, the Wind electricity industry index, the Wind new energy industry index, and the Shenwan power coal industry index are selected as the research objects. The sample period spans from 16 July 2021 to 15 September 2024. After excluding invalid data, each indicator contains 902 observations, denoted, respectively, as CEAP, WEID, SWCP, and WNID (see Table 1 for details).
Due to the inability to directly obtain the average price of carbon emission allowances in the national carbon market, this study uses the calculation method from pilot exchanges (Formula (8)). Specifically, the daily carbon allowance transaction price is used as the benchmark price, which is determined by dividing the total transaction value of the allowances by the total transaction volume on that day.
P a v g = T t o t l e V t o t l e
  • P a v g is the daily carbon allowance transaction price;
  • T t o t l e is the total transaction value of the allowances on that day;
  • V t o t l e is the total transaction volume of the allowances on that day.

4. Empirical Analysis

4.1. Market Trend

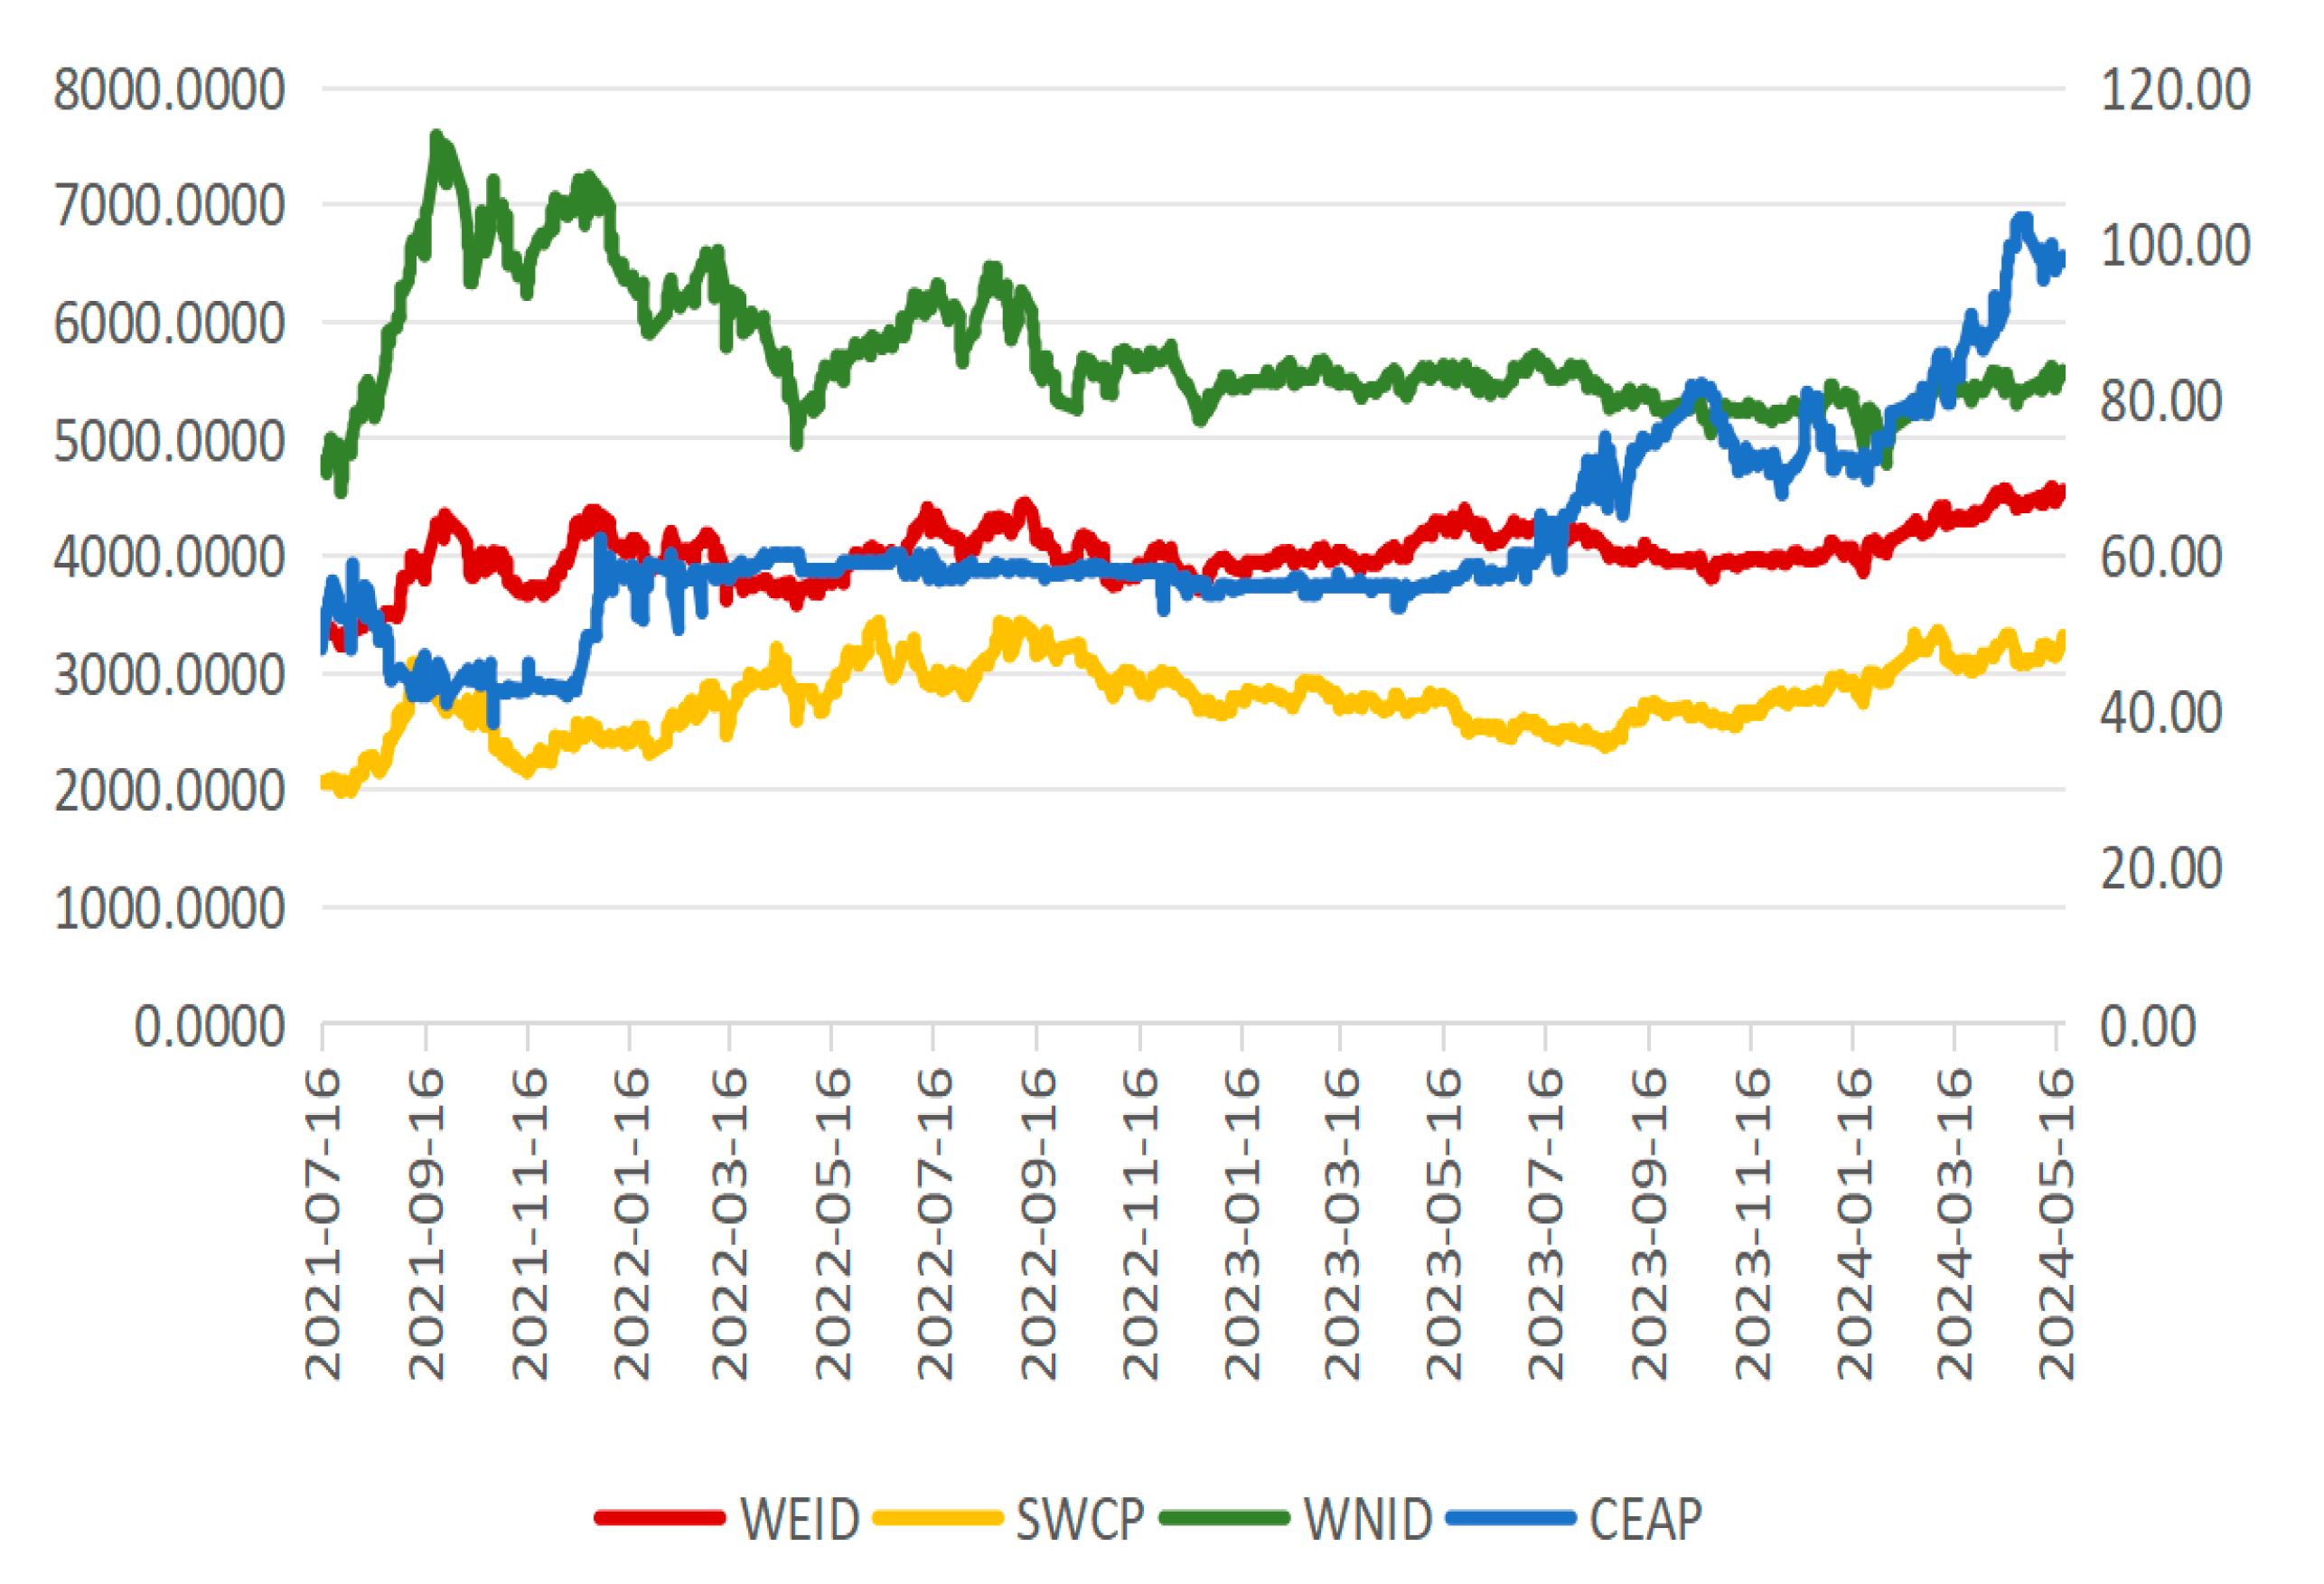
Figure 1 illustrates the price fluctuations in the carbon market, electricity market, renewable energy market, and coal market. To reduce the errors caused by data heteroscedasticity, logarithmic transformations were applied to all variables in this study to improve the accuracy of the analysis. From Figure 1, it can be seen that the national carbon market started on 16 July 2021, and the overall data range extends from 2021 to 2024.
Analysis of the Carbon Market (Blue Solid Line):
Since its launch in July 2021, China’s national carbon market has exhibited significant volatility, reflecting its nascent phase and sensitivity to policy and market dynamics. The price initiated a downward trajectory after inception, plunging to a trough of 30.92 CNY/tCO2-eq by December 2021. This initial period was characterized by sharp fluctuations, with notable peaks exceeding 58 CNY/tCO2-eq around August 2021 and early January 2022, likely driven by compliance activities and policy anticipation. Following a period of relative stability throughout much of 2023, with prices consolidating between 55 and 57 CNY/tCO2-eq, a new phase emerged in 2024. The most recent data up to September 2024 indicates a moderate yet perceptible decline, suggesting potential market adjustments to evolving regulatory frameworks or changes in the underlying supply-demand balance. The overall price path underscores the market’s ongoing discovery process and its vulnerability to both internal mechanisms and external shocks.
Analysis of the Electricity Market (Red Solid Line):
The electricity market displays clear cyclicality amid a sustained upward trend from 2021 to 2024. Following its launch, the index rose from approximately 3200 to a peak near 4400 by mid-2022, supported by economic recovery and rising power demand. A subsequent correction occurred through much of 2023, coinciding with stabilized fuel costs. However, a renewed upward momentum emerged in late 2023 and continued through 2024, establishing a new equilibrium at higher levels. This resilience reflects robust underlying demand and ongoing grid modernization efforts. Recent data shows consolidation near these elevated levels, suggesting market acceptance of revised valuation benchmarks.
Analysis of the New Energy Market (Green Solid Line):
The new energy market exhibited significant volatility while maintaining a general upward trajectory from 2021 to 2024. After reaching an initial peak of 7402.63 in September 2021, the market underwent a correction phase through much of 2022. This downturn reflected shifting investor sentiment amid changing policy expectations and global supply chain adjustments.
A notable recovery emerged in late 2022 and strengthened throughout 2023, driven by accelerated renewable energy deployment and technological breakthroughs in energy storage. The market demonstrated particular resilience during 2023–2024, establishing a new equilibrium at substantially higher levels than the initial 2021 baseline. This sustained performance underscores the sector’s growing maturity and its central role in China’s energy transition strategy. Recent price movements suggest the market is consolidating these gains while responding to evolving regulatory frameworks and international climate commitments.
Analysis of the Coal Market (Yellow Solid Line):
Coal prices displayed remarkable volatility from 2021 to 2024, cycling through distinct phases of rapid growth and subsequent adjustments. The initial surge gave way to multiple corrections, reflecting the market’s response to supply constraints and seasonal demand patterns. While early trading showed pronounced price swings, later periods witnessed relative stabilization as participants adapted to evolving market conditions. This trajectory highlights the sector’s ongoing transformation within China’s changing energy landscape, where traditional cyclicality increasingly interacts with structural shifts in energy policy and consumption patterns.
Further, the correlation matrix of the four markets can be calculated, as shown in Table 2. According to Table 2, the coal market is positively correlated with the carbon market, with a coefficient of 0.5371, which means that when the coal market rises, the carbon market also tends to rise, and vice versa. It is also positively correlated with the electricity market, with a coefficient of 0.4742, indicating that there is a certain positive relationship between the coal and electricity markets. In contrast, it exhibits a negative correlation with the new energy market, with a coefficient of −0.210. However, this relationship is statistically insignificant, suggesting it may be negligible. The carbon market is positively correlated with the electricity market, but the correlation coefficient is only 0.2213, which shows that the positive relationship between the two markets is not strong. On the other hand, the carbon market is negatively correlated with the new energy market, with a coefficient of −0.5548, meaning that when the carbon market rises, the new energy market falls, and vice versa. Finally, the electricity market and the new energy market are positively correlated, with a coefficient of 0.331174, indicating that when the electricity market rises, the new energy market also tends to rise, and vice versa.
In summary, the coal market is positively correlated with both the carbon market and the electricity market, but negatively correlated with the new energy market. The negative correlation between the carbon market and the new energy market is relatively strong. The electricity market and the new energy market are positively correlated.

4.2. Unit Root and Cointegration Test Results

The main objective of this section is to examine the dynamic relationships between the carbon market, electricity market, new energy market, and coal market based on the VAR model and MSVAR model. In the empirical analysis, four variables are considered: carbon market price (CEAP), electricity market price (WEID), new energy market price (WNID), and coal market price (SWCP). Through specific and rigorous empirical analysis, a more accurate understanding of the long-term and short-term dynamic relationships between these four markets can be achieved. In conclusion, this section aims to explore the nonlinear dependency structure among the carbon market, electricity market, new energy market, and coal market, and provide valuable insights for policymakers and investors on how these markets influence each other. The primary methods used in this section are the Dickey–Fuller (ADF) test and the Phillips and Perron (PP) test. The test results are shown in Table 3 and Table 4
From the unit root test results for the original series in Table 3, it can be observed that none of the four time series passed the stationarity test, indicating they are all non-stationary. Based on the unit root test results for the first-differenced series in Table 4, all four variables passed the stationarity test, meaning that no unit root exists, and they are all first-order integrated I(1) processes.
After completing the stationarity tests, the Johansen cointegration test was performed on the original series of the four markets to determine whether there is a cointegration relationship among them. The results of the cointegration test are shown in Table 5. The primary purpose of the cointegration test is to determine whether there exists a long-term equilibrium relationship between multiple non-stationary time series. If a cointegration relationship exists, a linear combination of these series will be stationary, even if each individual series is non-stationary.
From Table 5, it can be seen that since the statistic of 64.43102 is greater than the 0.05 critical value of 63.87610, and the p-value is 0.0449 (less than 0.05), the null hypothesis is rejected, indicating that at least one cointegration relationship exists. The Trace statistic results show that there is one cointegration relationship among the carbon market, electricity market, new energy market, and coal market. This implies that although each market may be non-stationary, some linear combination of these markets is stationary.
The confirmed cointegration relationship reveals a stable long-run equilibrium among the four markets. To model the complex dynamics of this system, we employ a Markov-Switching Vector Autoregression (MSVAR) model using the original level-series data. This approach is firmly grounded in econometric theory. The work of Sims et al. (1990) establishes the validity of conducting inference with level VARs in cointegrated systems. Furthermore, Hamilton (1994) notes that the VAR formulation in levels naturally embodies these long-run equilibrium constraints. Consequently, the MSVAR model in levels is a well-suited and robust framework for our analysis, as it directly captures the regime-dependent dynamics inherent to the markets while fully accounting for their identified long-run equilibrium relationship.

5. Nonlinear Volatility and Dependence Structure Analysis

5.1. MSVAR Model Test Results

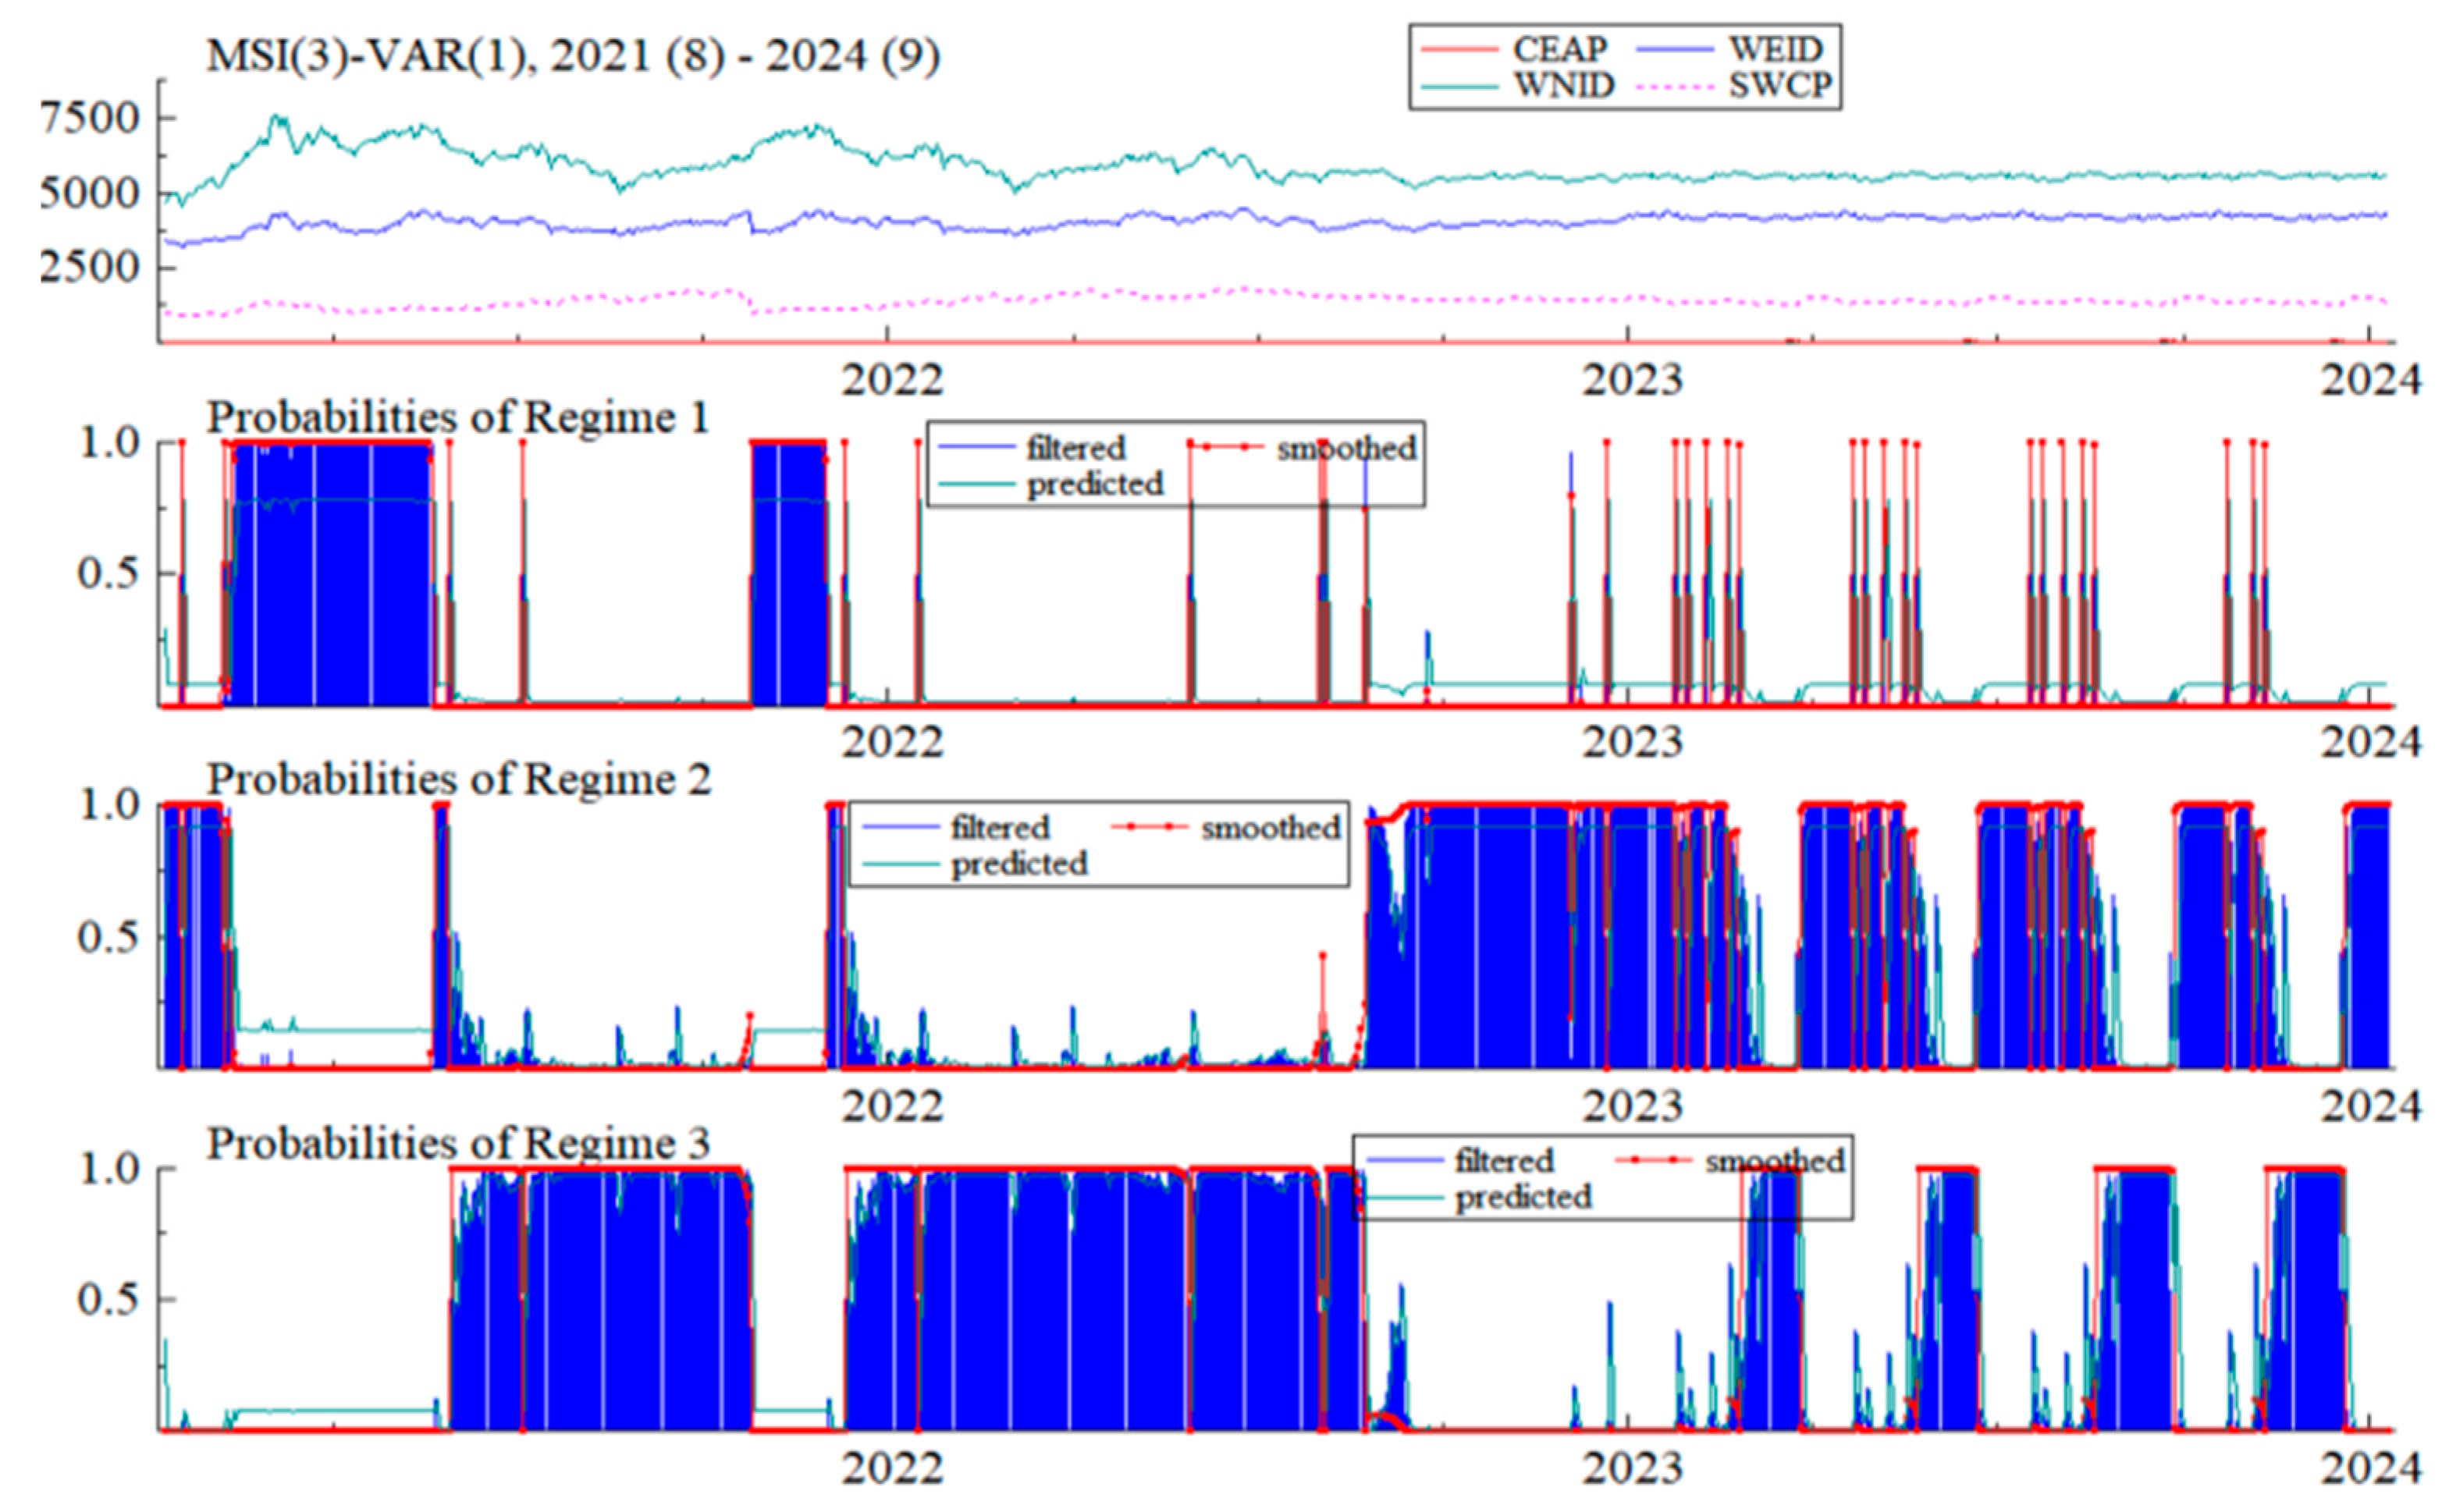
The research in the previous section has already shown that there may be structural changes and asymmetric characteristics between the prices of the four markets: the carbon market (CEAP), electricity market (WEID), new energy market (WNID), and coal market (SWCP). Therefore, it is especially necessary to use the MSVAR model for further study. In this section, the optimal lag order of the MSVAR model is selected as 1, and based on the price trends of the four markets, the regime variable is divided into three regimes: “Stable State,” “High-Volatility State,” and “Transition State.” The Stable State indicates that the market is relatively stable with low volatility, the High-Volatility State indicates that the market’s volatility has increased, possibly due to some external shocks or events, and the Transition State indicates that the market is transitioning from one state to another, possibly displaying moderate volatility and growth rates. The final model adopted in this section is the MSI(3)VAR(1). The regime-switching probabilities of the MSI(3)-VAR(1) model are shown in Figure 2 and Figure 3 and Table 6.
The analysis of Figure 2 and Figure 3 and Table 6 highlights the distinct regime-switching behaviors and the high persistence of market states across the four markets. Specifically, for the carbon market (CEAP), when in Regime 1, it has a 77.73% probability of remaining in its current state, but also a 14.43% chance of shifting to the unstable regime (Regime 2), and a 7.85% probability of transitioning to the high-volatility regime (Regime 3). These transition probabilities indicate that the market tends to stay in the stable regime for a substantial period but is also prone to regime shifts, especially toward more volatile conditions, reflecting the inherent instability during the early operational phase of China’s national carbon market as depicted in Figure 4. Similarly, for the electricity market (WEID), the probability of persisting in Regime 2 is 92.06%, indicating an extremely high degree of stability and inertia, and the likelihood of sudden regime shifts is minimal. This stability aligns with the observed relatively smooth trend of electricity prices shown in Figure 3. For new energy (WNID) and coal (SWCP) markets, the transition probabilities are also high for remaining in Regime 3, with over 97% chance of persistence, implying that these markets are predominantly in high-volatility states with strong regime dependence as visualized in Figure 2 and Figure 3. The low transition probabilities from high-volatility regimes to stable states suggest that once these markets enter turbulent periods, they tend to sustain such conditions for a significant duration. Overall, these results confirm that Chinese carbon and energy markets are characterized by regime-dependent dynamics, with a high probability of persistence within their regimes, and occasional shifts driven by market shocks or policy interventions. Recognizing this regime-switching behavior is crucial for developing effective risk management and policy strategies within China’s evolving green economy.
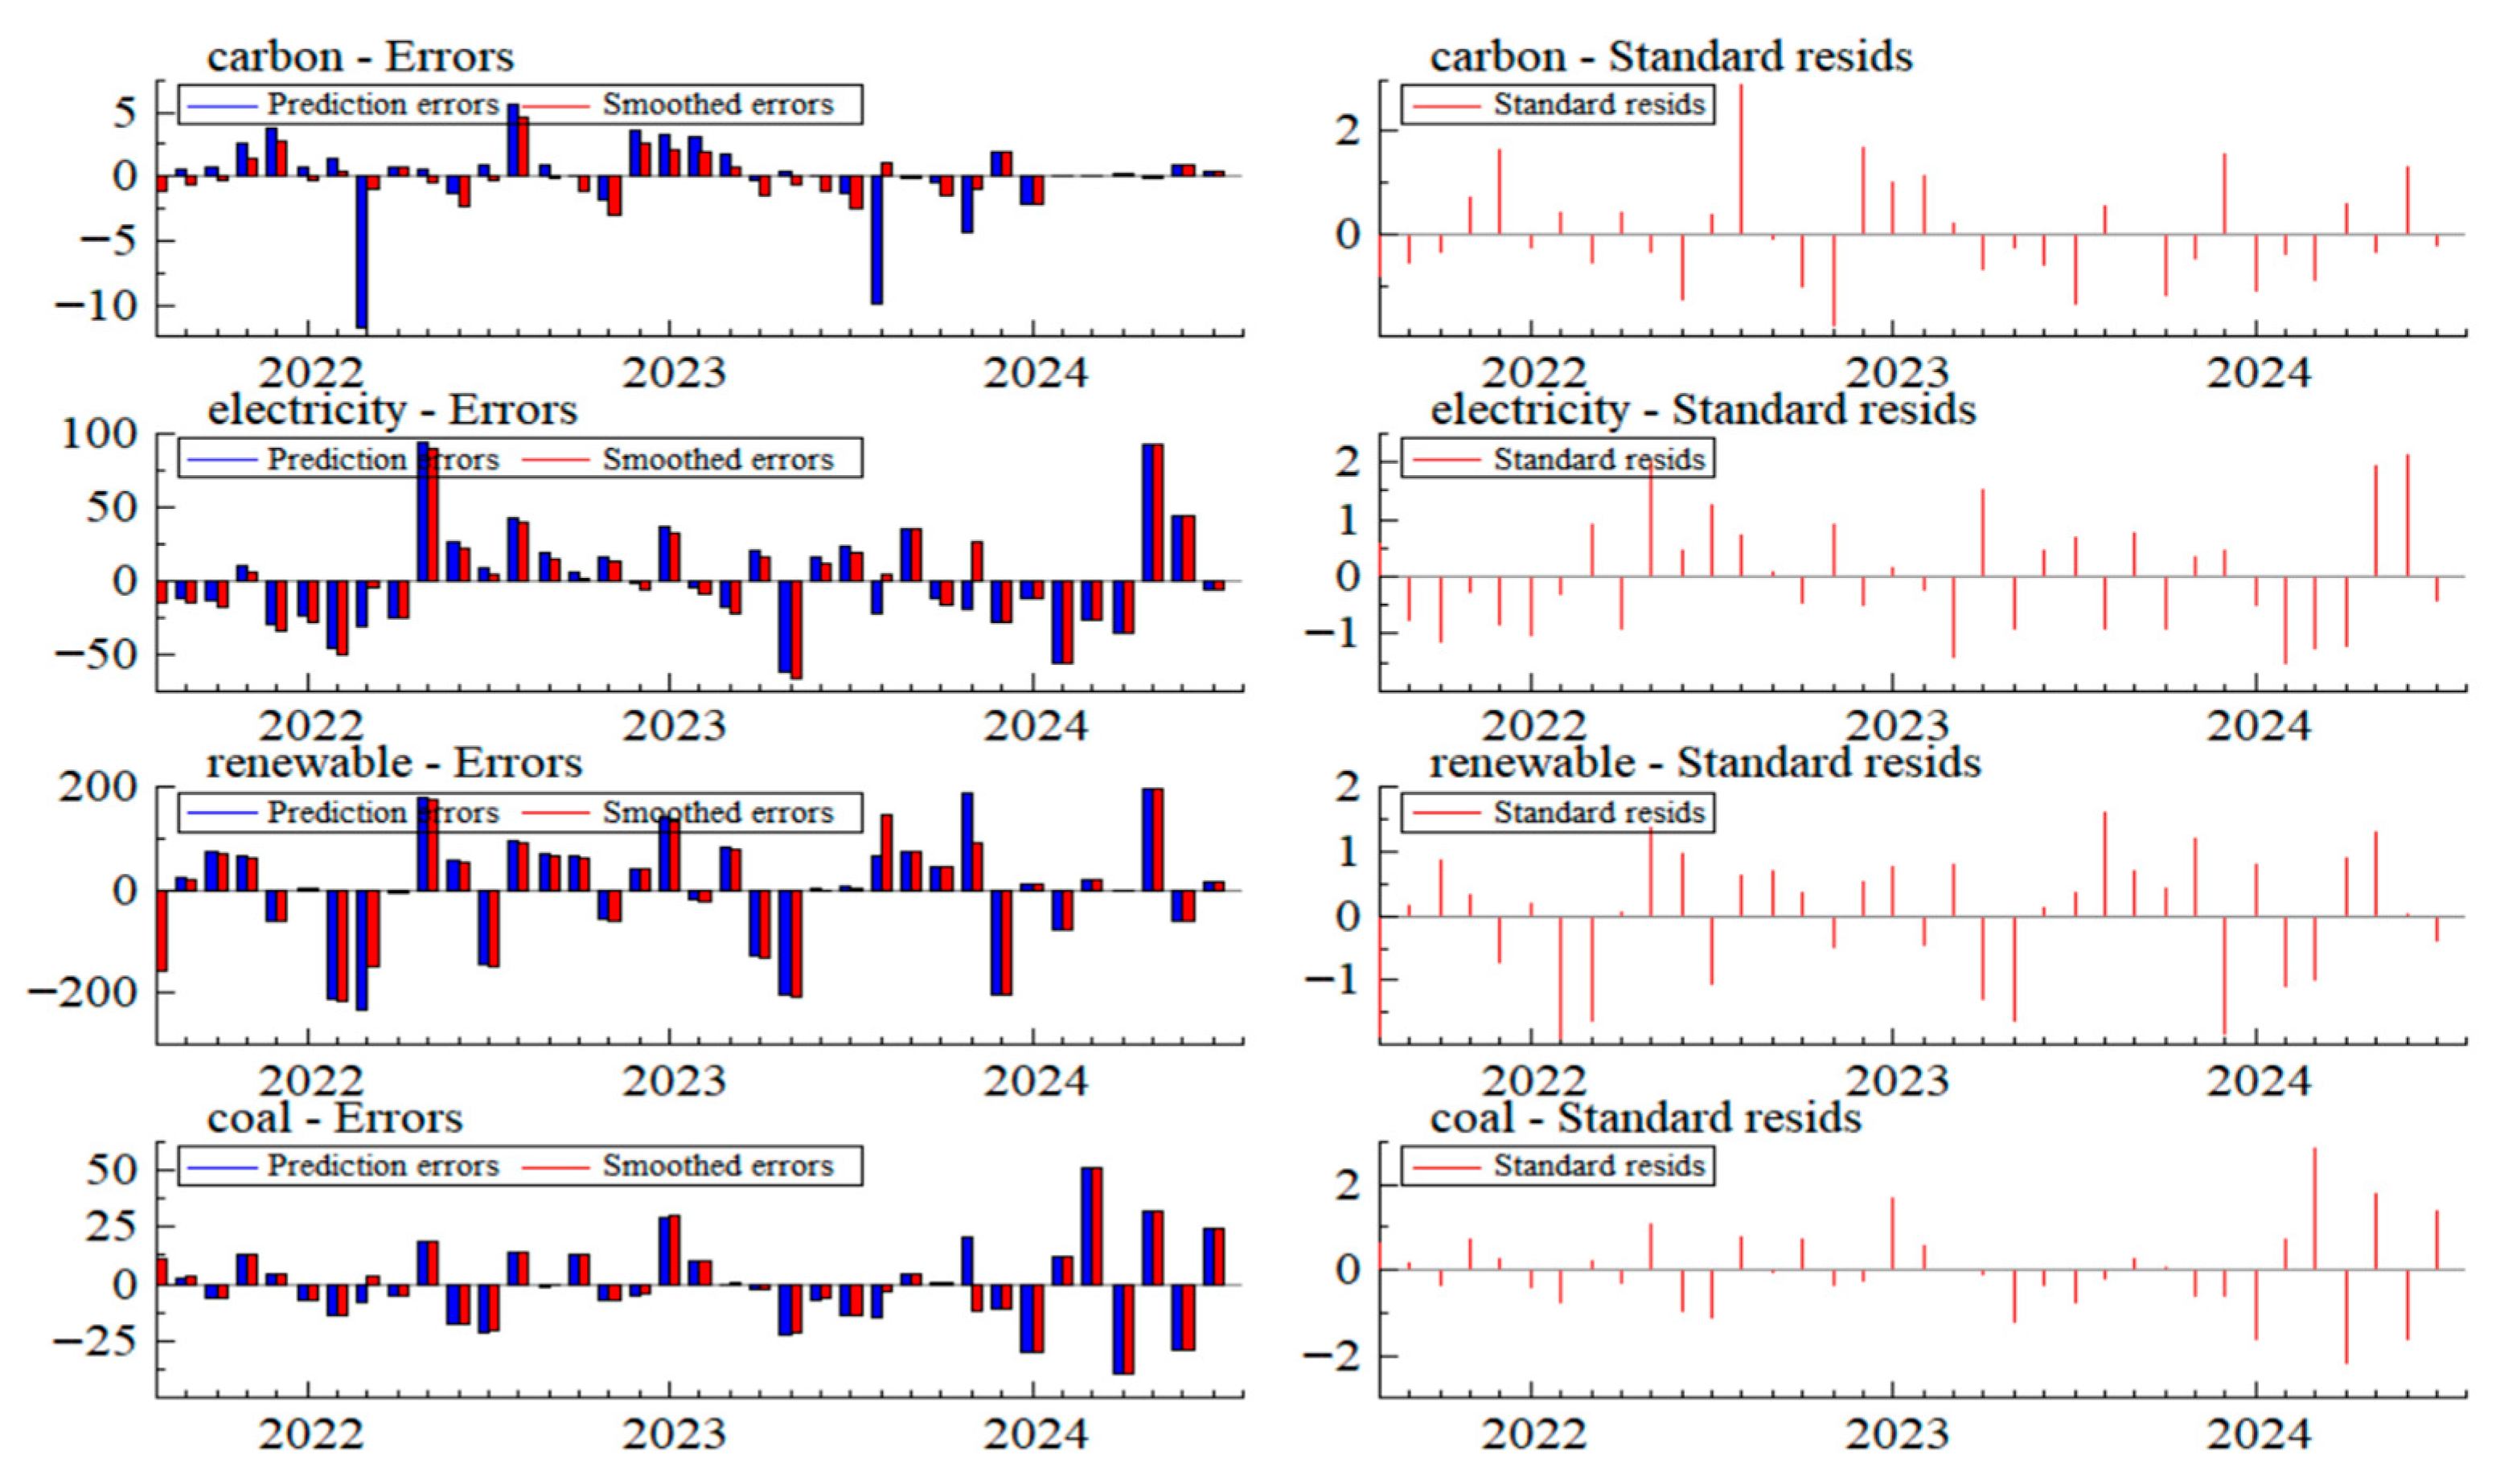
Based on the residual analysis in Figure 4, the standard residuals across the four markets generally remain within acceptable ranges throughout the sample period, exhibiting stable fluctuations without obvious deviations or extreme values. This indicates that the model fits the market dynamics reasonably well. The residuals for the carbon market (CEAP) show relatively small fluctuations from 2022 to 2024, with occasional outliers near the center, but overall they are distributed fairly uniformly, consistent with the normal distribution assumption. Similarly, the residuals for the electricity (WEID) and new energy markets (WNID) demonstrate comparable characteristics, mainly concentrated within reasonable bounds, indicating that the model effectively captures their main price fluctuation features. The residuals for the coal market (SWCP) display slight deviations, with some larger deviations at certain points in time, but still remain within acceptable limits. These results validate the robustness and reliability of the model, with the randomness and lack of systematic bias in the residuals supporting its effectiveness in describing market dynamics. Overall, the residual analysis suggests that the model adequately captures market price changes, although it may still need improvements in sensitivity to extreme fluctuations or structural shifts caused by unforeseen events.
Based on the analysis of Table 7, a comprehensive understanding of regime-switching characteristics in China’s carbon and energy markets can be obtained. Table 7 shows that the average durations in different regimes are approximately 4.5 days for the stable regime (Regime 1), accounting for about 15.81% of the time; around 12.6 days for the unstable regime (Regime 2), representing about 35.53%; and the longest for the transition regime (Regime 3), lasting about 39.2 days and covering roughly 48.66%. This indicates that markets tend to switch between states with noticeable persistence, with shorter durations in the stable regime and longer periods in high-volatility or transition states.
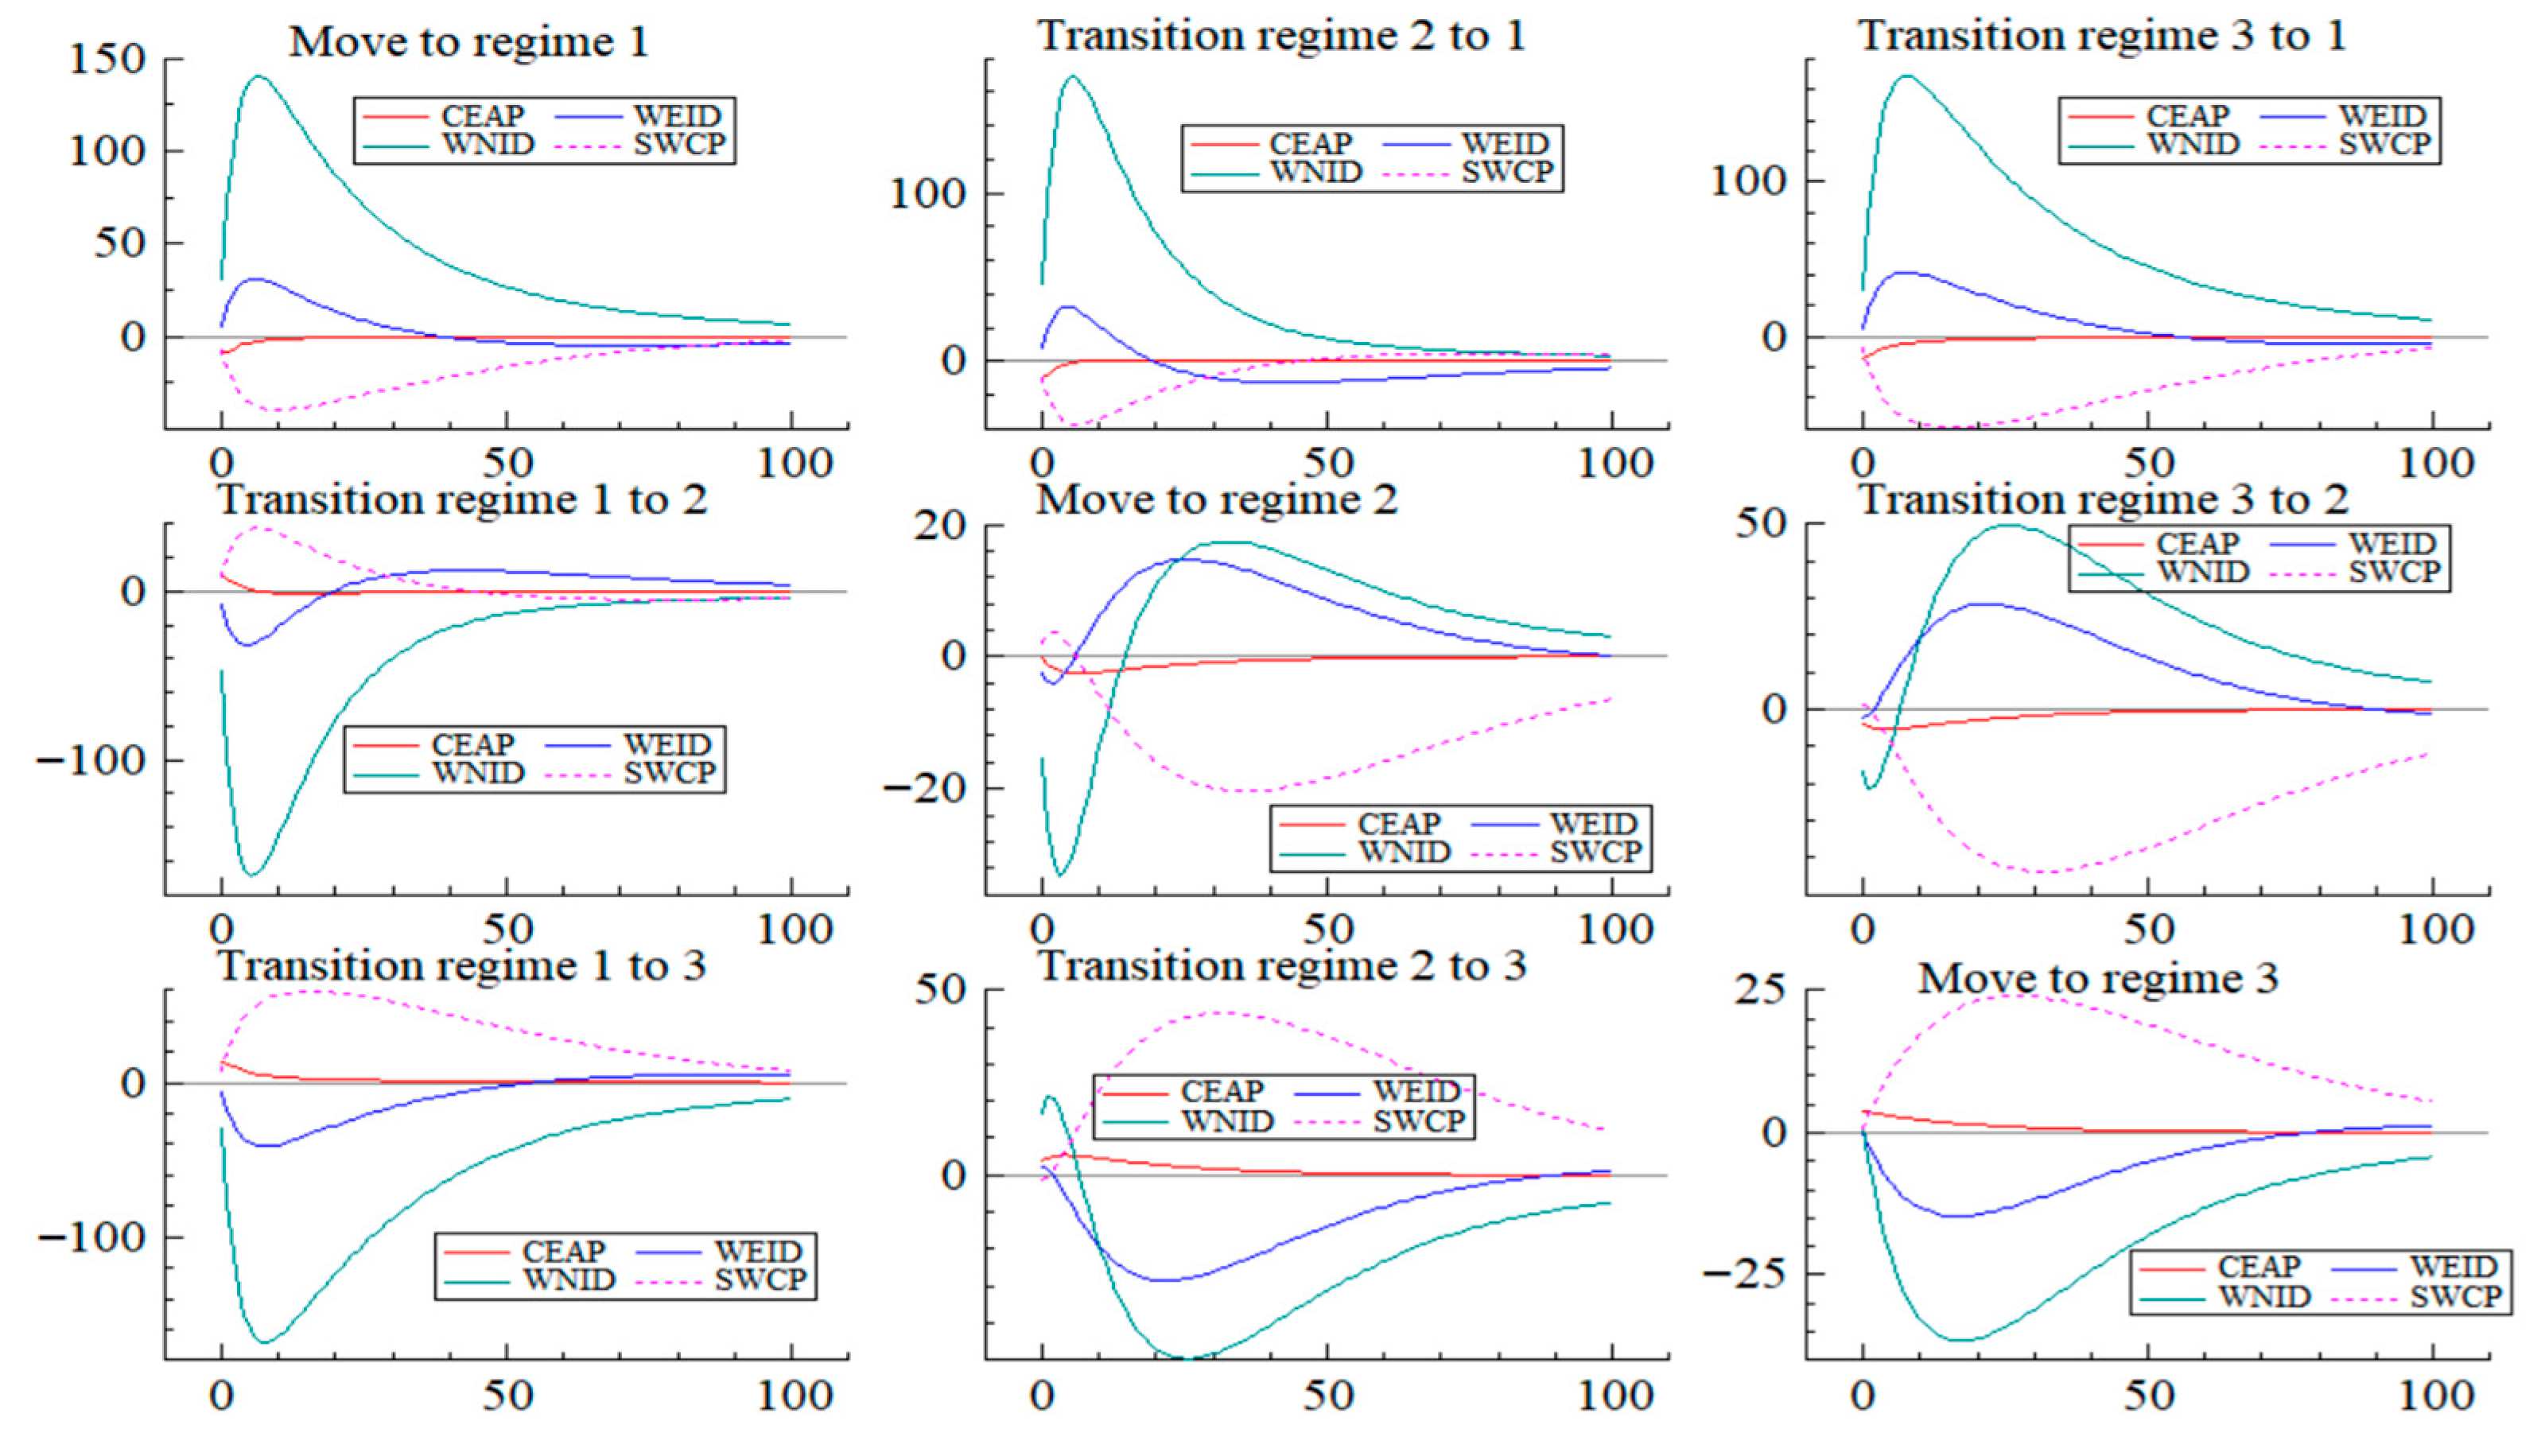
Figure 5 illustrates the transition pathways, highlighting frequent regime changes. It shows that markets easily shift from the stable regime (Regime 1) to the unstable regime (Regime 2) or directly into the high-volatility regime (Regime 3). Notably, pathways like “Transition regime 1 to 2” demonstrate such upward shifts, while other paths, such as moving back to regime 1, indicate the possibility of recovery, particularly after periods of turbulence. Combining these insights reveals that once markets enter high-volatility or transition states, they tend to stay in these regimes for extended periods, making recovery to stability more challenging. This reflects the intrinsic nonlinear and regime-dependent nature of the markets. Once in an unstable or transitional phase, markets may experience prolonged turbulence, increasing the difficulty of risk management and policy regulation.
Overall, the features indicated by Table 7 and the transition pathways depicted in Figure 5 together demonstrate the regime-switching behavior of China’s carbon and energy markets. They emphasize the importance of considering dynamic regime changes in research and policymaking to better manage price volatility and risks associated with different market states.
From Table 8, it can be clearly seen that the correlation coefficients among the markets vary significantly, highlighting different relationships during the same period. The correlation between the carbon market (CEAP) and the electricity market (WEID) is very weak and negative (−0.0132), indicating almost no linear relationship. In contrast, the correlation between WEID and the new energy market (WNID) is relatively high (0.7020), suggesting a strong positive relationship, reflecting that these markets tend to move together. The correlation between WNID and the coal market (SWCP) is moderate (0.3092), indicating a weak to moderate positive relationship. Similarly, the correlation between CEAP and SWCP is very close to zero (0.0130), implying negligible linear dependence. Overall, these correlation patterns suggest that while some markets like energy and new energy are closely linked, others like carbon and coal markets operate largely independently within the observed period.
This research indicates that the spatial transmission effects between markets vary under different regional conditions. This section will further examine the nonlinear dynamic dependence structure between the carbon market, power market, new energy market, and coal market. Table 9 presents the estimation results of the MSI(3)-VAR(1) model.
Based on the estimation results of the MSI(3)-VAR(1) model in Table 9, it is clear that each market exhibits distinct regime-dependent behaviors. Interpretation of Table 9 focuses on coefficient signs and dynamics. Model validity is supported by regime analysis (Table 6) and robustness checks (Table 10). The constant terms differ across regimes, with higher baseline levels in Regimes 2 and 3 compared to Regime 1, indicating different long-term price levels depending on the state. The lag coefficients reveal varying degrees of persistence and mean-reversion: for the carbon market (CEAP), the coefficient is positive in Regimes 1 and 3, suggesting prices tend to reinforce recent trends, while in Regime 2, the negative coefficient indicates a strong tendency for prices to revert to a long-term equilibrium.
Similarly, the electricity (WEID) and new energy (WNID) markets show high persistence in Regimes 2 and 3, with lag coefficients close to one, reflecting strong autocorrelation during these periods. In Regime 1, their coefficients are near zero, indicating weak dependence on past prices. The coal market (SWCP) exhibits a comparable pattern, with high autocorrelation in Regimes 2 and 3 and little dependence in Regime 1. These regime-specific coefficients highlight the markets’ asymmetric responses and varying volatility levels across different states. Recognizing these behaviors is crucial for understanding market stability and formulating effective risk management and policy strategies tailored to each regime.
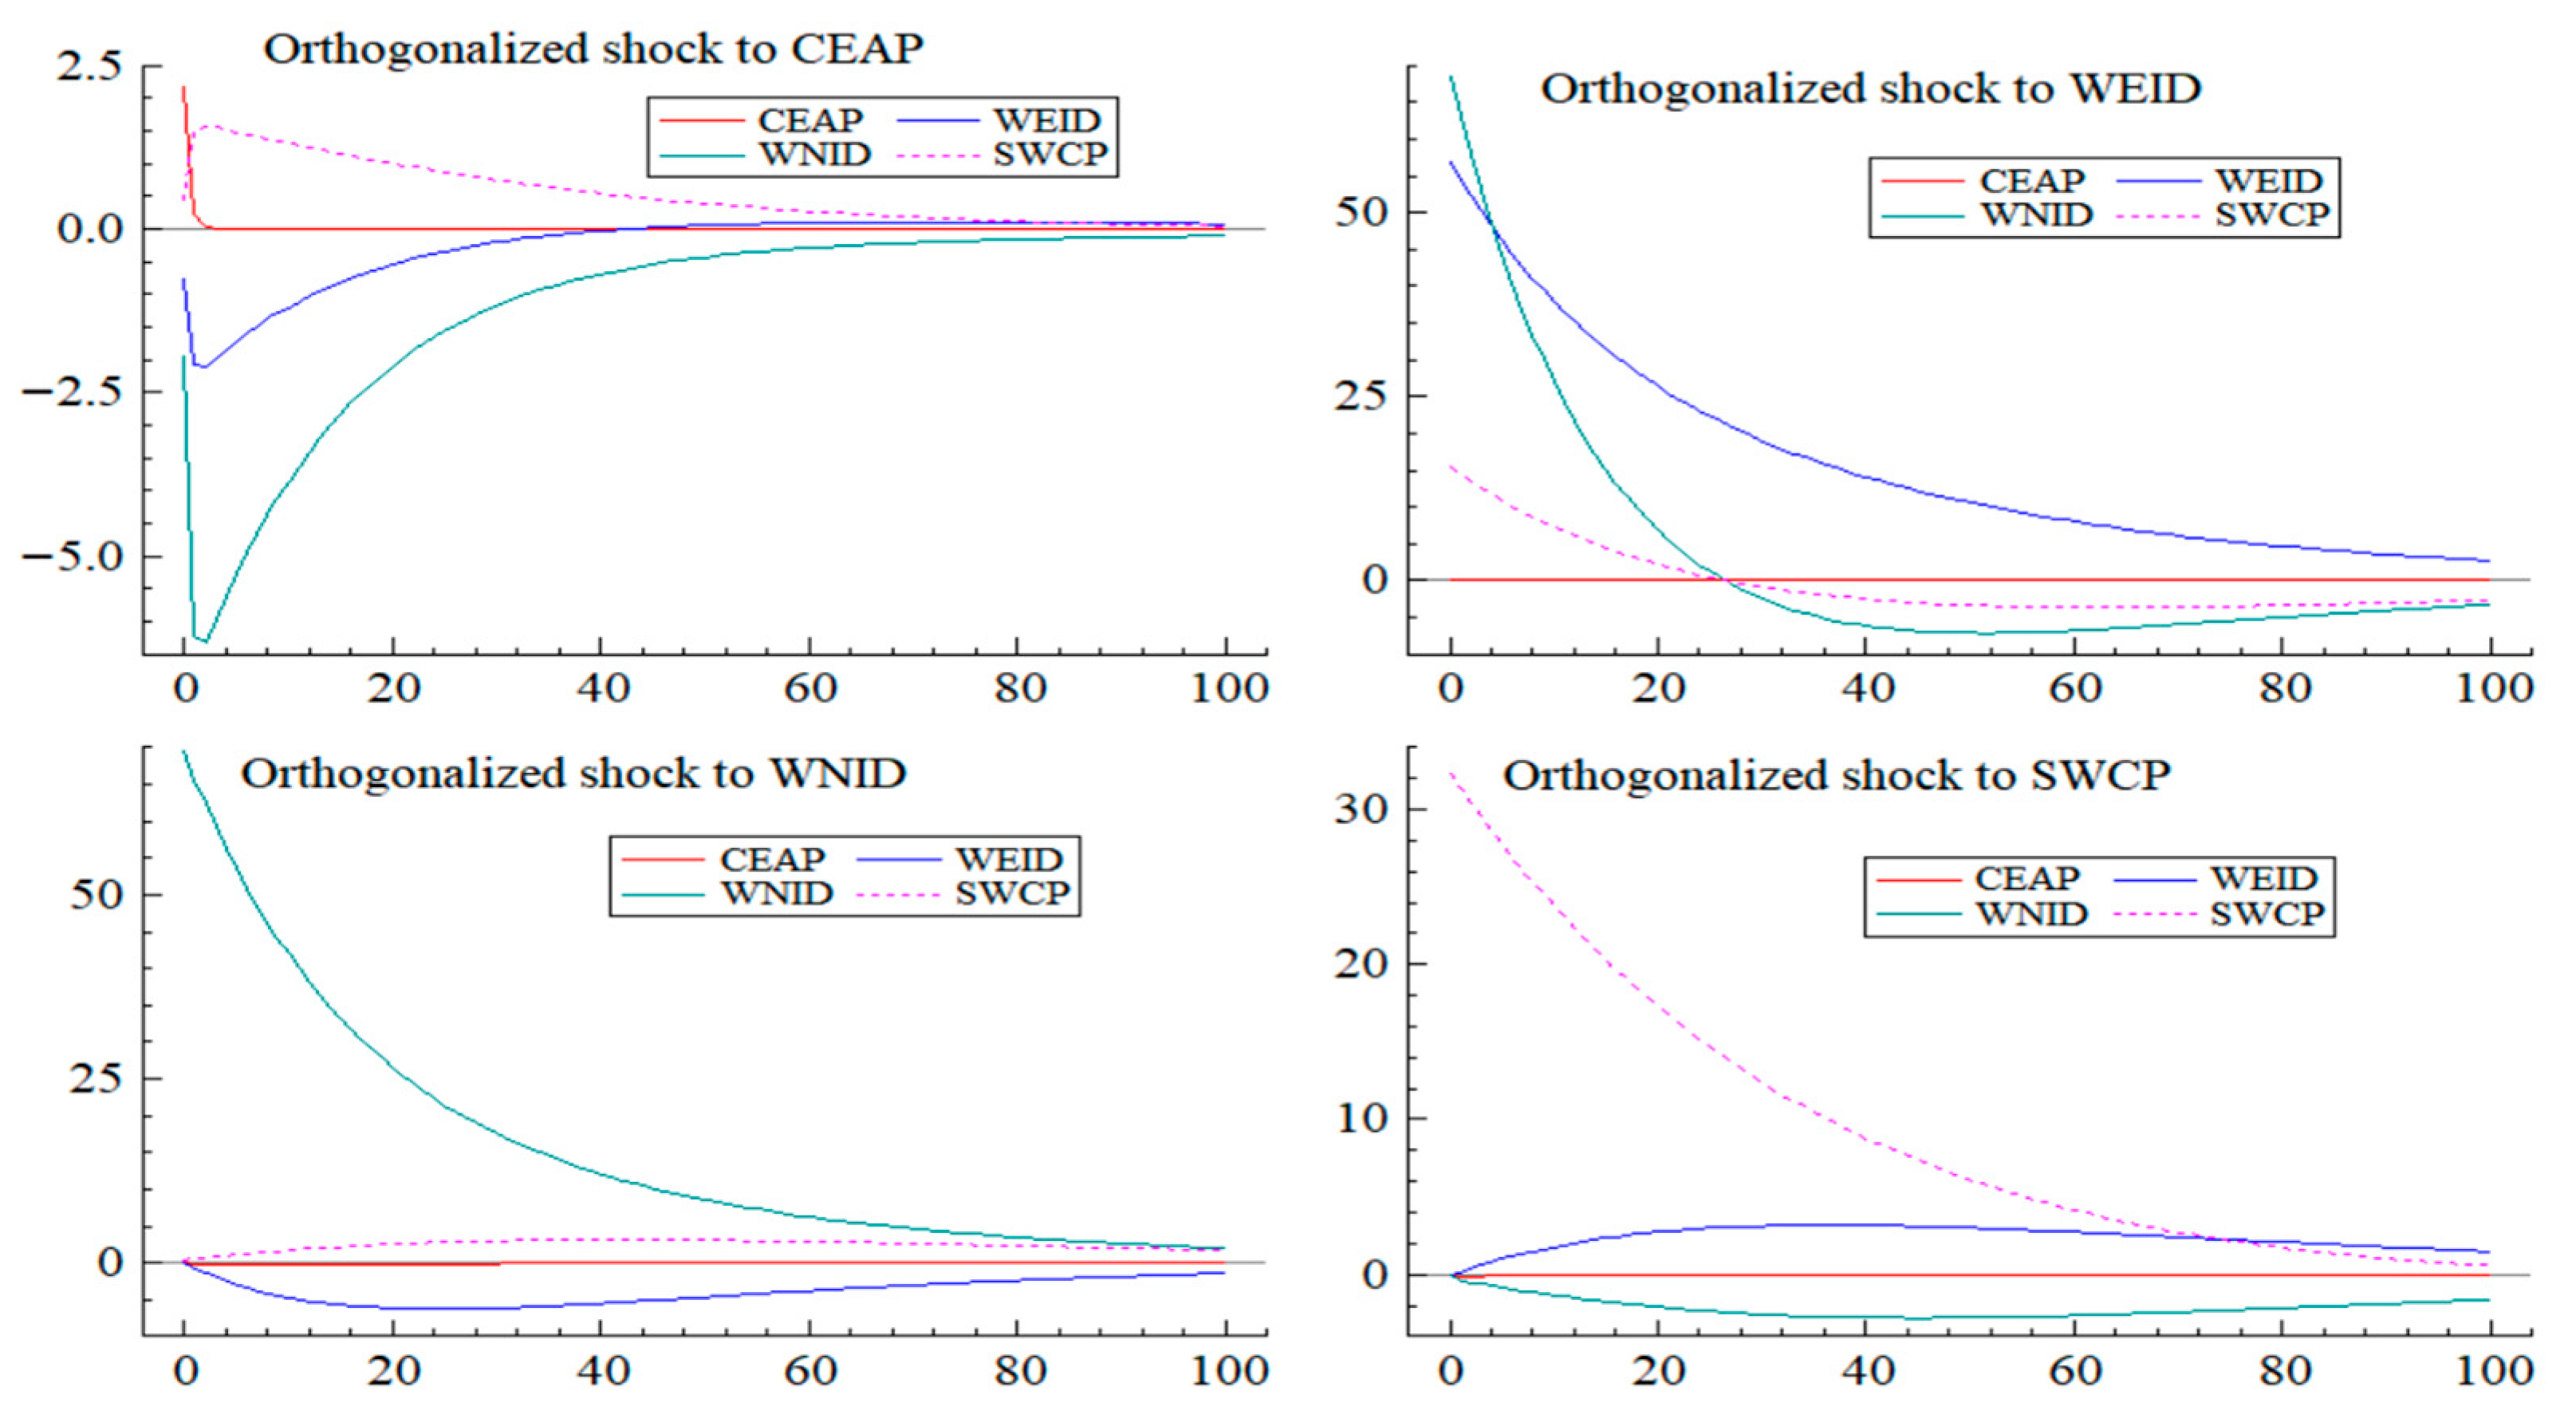
Based on the impulse response results shown in Figure 6 over a 100-period horizon, clear patterns of dynamic interactions among the four markets emerge. Shocks to the carbon market (CEAP) initially produce minor negative responses in the power market (WEID), which quickly diminish within approximately 20 periods, indicating limited long-term dependence. The effects on the WNID and SWCP following a shock to CEAP are also minimal and stabilize rapidly, suggesting weak nonlinear interactions from the carbon market to the others.
In contrast, shocks to the power market (WEID) generate more pronounced and persistent influences on the coal market (SWCP), with effects lasting over 20 to 30 periods before gradually fading. The responses of WNID and SWCP to WEID shocks display initial fluctuations that stabilize over time, reflecting a stronger short-term nonlinear dependence. Similarly, shocks originating from WNID and SWCP affect each other with oscillatory responses that gradually settle, indicating complex but stabilizing relationships over the extended horizon.
Overall, extending the analysis to 100 periods highlights that the markets’ nonlinear dependencies are characterized by strong short-term effects that weaken over time. The transient nature of these regime-dependent interactions underscores the importance of considering extended time horizons in policymaking and risk management, as short-term shocks can have significant yet temporary impacts within this interconnected system.

5.2. Robustness Check with Nonlinear Granger Causality Test

A particularly noteworthy finding from the nonlinear Granger causality test results provides independent validation for the core findings of this study. The tests reveal significant nonlinear causal relationships among China’s carbon and energy markets, with transmission pathways demonstrating clear asymmetric characteristics.
① Bidirectional nonlinear causality exists between the carbon and new energy markets (CEAP ↔ WNID, p-values 0.008 and 0.023, respectively). This finding corroborates the regime-dependent dynamics observed in the MSVAR model, confirming the complex feedback mechanism between these two markets. Carbon price fluctuations not only directly affect the new energy sector, but also develop expectations in the new energy industry and provide feedback for carbon market expectations.
② The electricity market occupies a central position in the entire system. Tests reveal significant unidirectional nonlinear causality from the electricity market to both the coal market (WEID → SWCP, p = 0.001) and new energy market (WEID → WNID, p = 0.004). This suggests that changes in electricity demand simultaneously affect the supply-demand dynamics of both traditional and new energy sources, highlighting the pivotal role of the electricity market in the energy system.
③ The causal relationships exhibit significant asymmetry. The influence strength of the electricity market on the coal market (test statistic 4.215) is noticeably higher than its influence on the new energy market (test statistic 3.789), reflecting the current characteristic of China’s energy structure still being dominated by coal power. Meanwhile, the feedback effect from the coal market to the electricity market is insignificant (p = 0.287), indicating a one-way price transmission mechanism.
④ The direct relationship between carbon and electricity markets remains weak. Neither causal relationship between these two markets is significant (p-values 0.365 and 0.441, respectively), possibly stemming from the ongoing development of China’s carbon allowance allocation mechanism for the power sector, leaving room for improvement in the transmission efficiency of carbon price signals to electricity costs.

5.3. Discussion of Causal Mechanisms

A particularly noteworthy finding from our analysis is the negative correlation of −0.55 between the carbon market and the new energy market, as shown in Table 2. While this seems counterintuitive, as a higher carbon price should theoretically benefit the renewable sector, this “adverse movement” can be explained by several underlying causal mechanisms present in China’s nascent market environment.
First, the policy uncertainty channel plays a significant role. In its initial phase, China’s carbon market price is highly sensitive to policy signals. Extreme volatility or unexpected spikes in the carbon price may not be interpreted by investors as a stable, long-term incentive for green investment. Instead, it can be perceived as a sign of regulatory instability and heightened policy risk across the entire green sector. Given that new energy projects are capital-intensive and rely heavily on stable, long-term policy support, such uncertainty can deter investment and trigger a sell-off in new energy stocks, creating a negative correlation with the carbon price.
Second, the investor sentiment contagion channel is also critical. As both the carbon market and the new energy market are key components of the “green economy” theme, they often attract a similar cohort of thematic investors. Turbulence in the carbon market, as a new and less understood asset class, can create a “risk-off” sentiment that quickly spills over to the new energy sector. Investors may choose to reduce their exposure across all green assets to avoid volatility, leading to a concurrent downturn that manifests as a negative correlation if the carbon price itself is spiking due to non-fundamental reasons (e.g., compliance rushes). This explains why the relationship is complex, as our MSVAR impulse response results (Figure 6) also show the dependency changing from positive to negative over time, reflecting these shifting dynamics rather than a simple, static relationship.
6. Conclusions and Policy Implications

6.1. Summary of Conclusions

Considering factors such as the initial policy impact, market development trajectory, and market volatility, the carbon market price starting from 16 July 2021, in China’s carbon emissions trading market, is selected as the representative of the carbon market price. In terms of energy markets, electricity, new energy, and coal markets are chosen as representatives of the energy market prices, taking into account six factors: market share, output, carbon emissions contribution, policy importance, market complexity, data availability, market maturity, and development stage. The time span for this analysis is from 16 July 2021 to 15 September 2024. Based on the MSI(3)-VAR(1) model, this section conducts an in-depth dynamic analysis of the carbon market (CEAP), electricity market (WEID), new energy market (WNID), and coal market (SWCP). The main conclusions are as follows:
(1) Market States and Transitions: The analysis identifies a dynamic regime-switching environment in China’s carbon-energy complex. Markets cycled through three distinct states, with a pronounced tendency to remain in non-stable conditions. The so-called “Transition State” (Regime 3) was the dominant market condition, covering nearly half (48.66%) of the sample with the longest average duration (39.2 days), suggesting periods of prolonged adjustment. The “High-Volatility State” (Regime 2) accounted for over a third (35.53%) of the time, while classic “Stable State” (Regime 1) periods were relatively rare (15.81%) and short-lived. This regime structure highlights the markets’ inherent instability and frequent departures from equilibrium during the study period.
(2) Market Dynamics: The impulse response analysis reveals that the impact of shocks in one market on others is mostly short-lived, decaying over approximately 20 periods. However, over longer horizons, the relationships are complex and nonlinear. For example, impacts from the carbon market are limited and diminish over time, while the effects of shocks from electricity and coal markets are more prolonged (20–30 periods) and gradually stabilize, reflecting intricate interdependence.
(3) Market relationships are complex and asymmetric: The correlation matrix shows a strong positive correlation between electricity and renewable energy markets (0.7577), indicating they tend to move together. Meanwhile, the negative correlation between the carbon and renewable energy markets (−0.55) suggests a more competitive or hedging relationship. These relationships are affected by external policies, market sentiment, and structural factors, especially in the early stages of China’s carbon market.
(4) Model Fit and Effectiveness: Residual analysis confirms the model’s ability to capture the main dynamics, with few anomalies observed, although some extreme events still pose risks that require attention. The findings support the suitability of the MSI(3)-VAR(1) model in studying these interconnected markets with regime-switching behavior.
Through the MSI(3)-VAR(1) model, this study provides an in-depth dynamic analysis of the carbon, electricity, new energy, and coal markets. The research reveals that these markets exhibit different behavioral characteristics under different states, showing structural changes and nonlinear features. Among the three states, the Transition State (Regime 3) is the most prevalent, accounting for 48.66% of the sample period, followed by the High-Volatility State (35.53%) and the Stable State (15.81%). Moreover, there is a strong positive nonlinear dependence between the electricity market and the new energy market, while the carbon market has a relatively weak dependence on the other markets. The conclusions provide valuable insights for policymakers and investors, helping to better understand and predict the future dynamics of these markets.

6.2. Policy Implications

Based on our empirical findings of nonlinear and regime-switching dynamics, this study offers the following specific policy and investment implications that address regulation, financial products, and investor behavior.
(1) For Policymakers and Regulators:
The evidence of significant volatility and a dominant “High-Volatility State” underscores the need for mechanisms to ensure market stability. Regulators should focus on enhancing policy transparency and predictability to reduce the policy uncertainty that adversely impacts related markets like the new energy sector. Furthermore, exploring the implementation of a market stability reserve (MSR), similar to the EU-ETS, could help to manage severe price fluctuations and foster long-term investor confidence. Coordinated policy design between the carbon market and the electricity market is also essential to ensure the carbon price signal is effectively transmitted.
(2) For Financial Market Development:
To help market participants manage the identified volatility risks, there is an urgent need to accelerate the development of carbon-based financial derivatives. The introduction of carbon futures and options would provide crucial hedging instruments for power generation companies and other emitters. This would not only allow them to lock in future carbon costs but also improve the price discovery function of the spot market, ultimately leading to more stable and efficient market integration.
(3) For Investors and Corporate Strategists:
Our findings demonstrate that the relationship between China’s carbon and energy markets is not static but state-dependent. Investors should therefore move beyond simple correlation analysis for portfolio management. It is crucial to adopt dynamic, regime-aware investment strategies that adjust asset allocation between carbon-intensive and new energy sectors based on the prevailing market state (e.g., high- vs. low-volatility regime). For corporations, the identified cross-market linkages should be integrated into their strategic risk management frameworks to better anticipate and mitigate financial exposures from carbon price volatility.

Author Contributions

Conceptualization, T.Z. and S.Z.; methodology, T.Z.; software, T.Z.; validation, T.Z.; formal analysis, T.Z.; investigation, T.Z.; resources, T.Z. and S Z.; data curation, T.Z.; writing—original draft preparation, T.Z.; writing—review and editing, T.Z.; visualization, T.Z. and S.Z.; supervision, S.Z.; project administration, T.Z.; funding acquisition, T.Z. All authors have read and agreed to the published version of the manuscript.

Funding

This research was funded by Zhejiang Province Education Science Planning 2025 General Planning Project, grant number 2025SCG184 and The APC was funded by the first author.

Data Availability Statement

The data presented in this study were obtained from third-party commercial databases, including the WIND Database and Shenwan Securities Research. Access to these raw data is not free and requires a paid subscription with the respective providers. The processed data supporting the findings of this study can be made available by the authors upon reasonable request and with the permission of the original data providers.

Acknowledgments

This research was supported by the Zhejiang Province Education Science Planning 2025 General Planning Project (No. 2025SCG184). The authors sincerely thank the anonymous referees as well as the editors.

Conflicts of Interest

The authors declare no conflicts of interest.

References

  1. Amaefula, Chibuzo. 2021. A Simple Integration Order Test: An Alternative to Unit Root Testing. European Journal of Mathematics and Statistics 2: 77–85. [Google Scholar] [CrossRef]
  2. An, Yuchen, Kunliang Jiang, and Jiashan Song. 2023. Does a Cross-Correlation of Economic Policy Uncertainty with China’s Carbon Market Really Exist? A Perspective on Fractal Market Hypothesis. Sustainability 15: 10818. [Google Scholar] [CrossRef]
  3. Bissinger, Peter H., Rotraud Wieser, Barbara Hamilton, and Helmut Ruis. 1989. Control of Saccharomyces Cerevisiae Catalase T Gene (CTT1) Expression by Nutrient Supply via the RAS-Cyclic AMP Pathway. Molecular and Cellular Biology 9: 1309–15. [Google Scholar] [CrossRef]
  4. Che, Guangjun, and Yunyi Mou. 2022. Research on the Long-Term and Short-Term Dynamic Relationship Between the Energy Market and the Guangdong Carbon Emission Market: Based on the Energy Futures Market and Spot Market. Zhejiang Finance 11: 58–67. (In Chinese). [Google Scholar]
  5. Chevallier, Julien. 2011. A Model of Carbon Price Interactions with Macroeconomic and Energy Dynamics. Energy Economics 33: 1295–312. [Google Scholar] [CrossRef]
  6. Daskalakis, Georgios, Dimitris Psychoyios, and Raphael N. Markellos. 2009. Modeling CO2 Emission Allowance Prices and Derivatives: Evidence from the European Trading Scheme. Journal of Banking & Finance 33: 1230–41. [Google Scholar] [CrossRef]
  7. Don, Bredin, Stuart Hyde, and Cal Muckley. 2014. A Microstructure Analysis of the Carbon Finance Market. International Review of Financial Analysis 34: 222–34. [Google Scholar] [CrossRef]
  8. Goldfeld, Stephen M., Richard E. Quandt, Takeshi Amemiya, and Susan M. Johnson. 1973. A Markov Model for Switching Regressions. Journal of Econometrics 1: 3–15. [Google Scholar] [CrossRef]
  9. Guo, Na, Peiyao Wang, Nalin Xie, and Jingshan Liu. 2024. Research on the Risk Spillover Effect of the International Commodity Market on China’s Financial Market: An Asymmetric Analysis Based on Shock Size and Good and Bad Volatility. South China Economy 1: 91–106. (In Chinese). [Google Scholar] [CrossRef]
  10. Hamilton, James D. 1994. Time Series Analysis. Princeton: Princeton University Press. Available online: https://api.pageplace.de/preview/DT0400.9780691218632_A40156688/preview-9780691218632_A40156688.pdf (accessed on 15 February 2024).
  11. Henderson, James M., and Richard E. Quandt. 1958. Microeconomic Theory: A Mathematical Approach. New York: McGraw-Hill. [Google Scholar]
  12. Hieu, Vu Minh, and Ngo Thanh Hai. 2023. The Role of Environmental, Social, and Governance Responsibilities and Economic Development on Achieving the SDGs: Evidence from BRICS Countries. Economic Research-Ekonomska Istraživanja 36: 1338–60. [Google Scholar] [CrossRef]
  13. Hu, Guanghui, and Xiongfei Zhou. 2022. The Impact of Carbon Price Volatility on the Stock Prices of Energy Companies in China. Productivity Research 1: 121–27. (In Chinese). [Google Scholar] [CrossRef]
  14. Humbatova, Samira. 2023. The Impact of Oil Prices on State Budget Income and Expenses: Case of Azerbaijan. International Journal of Energy Economics and Policy 13: 189–212. [Google Scholar] [CrossRef]
  15. Liu, Zhiyang, Xindi Ma, and Yaoshu Xie. 2022. Research on the Mutual Influence Between the Carbon Market, Energy Market, and Financial Market: A Comparative Perspective Before and After the Launch of the National Carbon Emissions Trading Market. Securities Market Guide 6: 36–46. Available online: https://docs.static.szse.cn/www/aboutus/research/secuities/daily/W020220609382599136094.pdf (accessed on 15 February 2024). (In Chinese).
  16. Ma, ZongYing, YanMin Yan, Rui-Jin Wu, Na Wei, and RuiBo Wu. 2021. Research on the Correlation Between WTI Crude Oil Futures Price and European Carbon Futures Price. Frontiers in Energy Research 9: 735665. [Google Scholar] [CrossRef]
  17. Reboredo, Juan C. 2015. Is There Dependence and Systemic Risk Between Oil and Renewable Energy Stock Prices? Energy Economics 48: 32–45. [Google Scholar] [CrossRef]
  18. Shi, Chunbo, Qian Zeng, Jie Zhi, Yuting Tao, Wenjie Liao, and Chenglong Zhang. 2023. A Study on the Response of Carbon Emission Rights Price to Energy Price, Macroeconomy, and Weather Conditions. Environmental Science and Pollution Research 30: 33833–48. [Google Scholar] [CrossRef]
  19. Sims, Christopher A., James H. Stock, and Mark W. Watson. 1990. Inference in Linear Time Series Models with some Unit Roots. Econometrica 58: 113–44. [Google Scholar] [CrossRef]
  20. Su, Lei, Bofei Jing, and Tingting Ju. 2023. Analysis of the Spillover Effects of China’s Carbon Emissions Trading Market: A Perspective from the Energy, Electricity, and Financial Markets. Commercial Economics 6: 167–72. (In Chinese). [Google Scholar] [CrossRef]
  21. Wang, Zhonghua, and Yao Hu. 2018. An Empirical Analysis of the Factors Affecting the Carbon Price in China. Journal of Industrial Technological Economics 37: 128–36. (In Chinese). [Google Scholar] [CrossRef]
  22. Wesseh, Presley K., Jiaying Chen, and Boqiang Lin. 2023. Electricity Price Modeling from the Perspective of Start-Up Costs: Incorporating Renewable Resources in Non-Convex Markets. Frontiers in Sustainable Energy Policy 2: 1204650. [Google Scholar] [CrossRef]
  23. Zhao, Tianyu, and Wei Sun. 2022. The Linkage Mechanism Between Carbon Markets, Energy Markets, and Corporate Value. Commercial Research 5: 35–45. (In Chinese). [Google Scholar] [CrossRef]
  24. Zou, Shaohui, and Tian Zhang. 2020. Cross-correlation analysis between energy and carbon markets in China based on multifractal theory. International Journal of Low-Carbon Technologies 15: 389–97. [Google Scholar] [CrossRef]
Figure 1. Price Trends of Carbon, Electricity, New Energy, and Coal Markets.
Risks 13 00205 g001
Figure 2. Transition Probabilities of Regimes in the Carbon, Electricity, New Energy, and Coal Markets.
Risks 13 00205 g002
Figure 3. Three-Regime States of the Carbon, Electricity, New Energy, and Coal Markets.
Risks 13 00205 g003
Figure 4. Standard residuals of the Carbon, Electricity, New Energy, and Coal Markets.
Risks 13 00205 g004
Figure 5. Regime shifts in the Carbon, Electricity, New Energy, and Coal Markets.
Risks 13 00205 g005
Figure 6. Impulse Response Based on the MSVAR Model.
Risks 13 00205 g006
Table 1. Definition of Variables.
MarketsMeasurement VariableIndicator DescriptionVariable RepresentationData Source
Carbon MarketNational Carbon Emission Trading MarketNational Carbon Market Average Carbon Quota PriceCEAPShanghai Environment Exchange
Energy MarketElectricity MarketWind Electricity Industry Index PriceWEIDWIND Database
Coal MarketShenwan Power Coal Industry Index PriceSWCPShenwan Securities Research
New Energy MarketWind New Energy Industry Index PriceWNIDWIND Database
Table 2. Correlation Matrix of Markets.
Coal MarketCarbon MarketElectricity MarketNew Energy Market
Coal Market1
Carbon Market0.5371 ***1
Electricity Market0.4742 ***0.2213 *1
NewEnergy Market−0.2101−0.5548 ***0.3312 ***1
Note: *, *** denote significance at the 10% and 1% levels, respectively.
Table 3. ADF and PP Unit Root Test Results for the Original Series.
MarketADF ValuePP Value1%Critical Value5%Critical Value10%Critical ValueConclusions
CEAP−1.6301−7.3752−3.966336−3.413866−3.129013Non-stationary
WEID−3.13912−3.16555−3.966336−3.413866−3.129013Non-stationary
WNID−2.64525−2.62767−3.966336−3.413866−3.129013Non-stationary
SWCP−2.30596−2.25891−3.966336−3.413866−3.129013Non-stationary
Table 4. ADF and PP Unit Root Test Results for the First-Differenced Series.
MarketADF ValuePP Value1%Critical Value5%Critical Value10%Critical ValueConclusions
CEAP−18.8611−66.8363−3.96634−3.41387−3.12901Stationary
WEID−22.15365−22.1543−3.96634−3.41387−3.12901Stationary
WNID−22.85922−22.8796−3.96634−3.41387−3.12901Stationary
SWCP−24.88692−24.8228−3.96634−3.41387−3.12901Stationary
Table 5. Cointegration Test Results.
Hypothesized No. of CE(s)EigenvalueTrace Statistic0.05 Critical Valuep-Value
None0.05307464.4310263.87610.0449
At most 10.04102137.1095542.915250.1686
At most 20.02480316.1246825.872110.4826
At most 30.0070443.54171512.517980.8069
Table 6. MSI(3)VAR(1) Regime State Transition Probability Matrix.
Regime 1Regime 2Regime 3
Regime 10.77730.14430.07845
Regime 20.079390.92060.00004875
Regime 30.014390.011130.9745
Table 7. Market Regime Characteristics.
Sample SizeProbabilityDuration (Days)
Regime 1 (Stable State)142.70.15814.49
Regime 2 (High-Volatility State)319.20.355312.59
Regime 3 (Transition State)440.10.486639.19
Table 8. Correlation between Carbon, Power, New Energy, and Coal Markets during the Same Period.
CEAPWEIDWNIDSWCP
CEAP1——————
WEID−0.0132 **1————
WNID−0.0200 **0.7020 ***1——
SWCP0.0130 **0.4326 ***0.3092 *** 1
Note: **, *** denote significance at the 5%, and 1% levels, respectively.
Table 9. Estimation Results of the MSI(3)-VAR(1) Model.
CEAPWEIDWNIDSWCP
Constant (Region 1)34.8708214.5089580.260347.0564
Constant (Region 2)44.8951206.5806533.509756.3904
Constant (Region 3)48.7105209.0072550.122554.9087
CEAP_10.107158−0.631648−2.0100910.4753
WEID_10.0057450.972264−0.0231−0.0155
WNID_1−0.002397−0.0116040.94390.0036
SWCP_1−0.0033340.004822−0.01180.9721
Standard Error2.18696756.962597.709135.8525
Table 10. Results of Nonlinear Granger Causality Tests.
Null HypothesisTest Statisticp-ValueConclusions (α = 0.05)
CEAP does not Granger-cause WNID3.4520.008Reject
WNID does not Granger-cause CEAP2.9870.023Reject
WEID does not Granger-cause SWCP4.2150.001Reject
SWCP does not Granger-cause WEID1.2340.287Fail to Reject
WEID does not Granger-cause WNID3.7890.004Reject
WNID does not Granger-cause WEID1.5670.152Fail to Reject
CEAP does not Granger-cause WEID1.0450.365Fail to Reject
WEID does not Granger-cause CEAP0.8930.441Fail to Reject
Disclaimer/Publisher’s Note: The statements, opinions and data contained in all publications are solely those of the individual author(s) and contributor(s) and not of MDPI and/or the editor(s). MDPI and/or the editor(s) disclaim responsibility for any injury to people or property resulting from any ideas, methods, instructions or products referred to in the content.