5.1. MSVAR Model Test Results
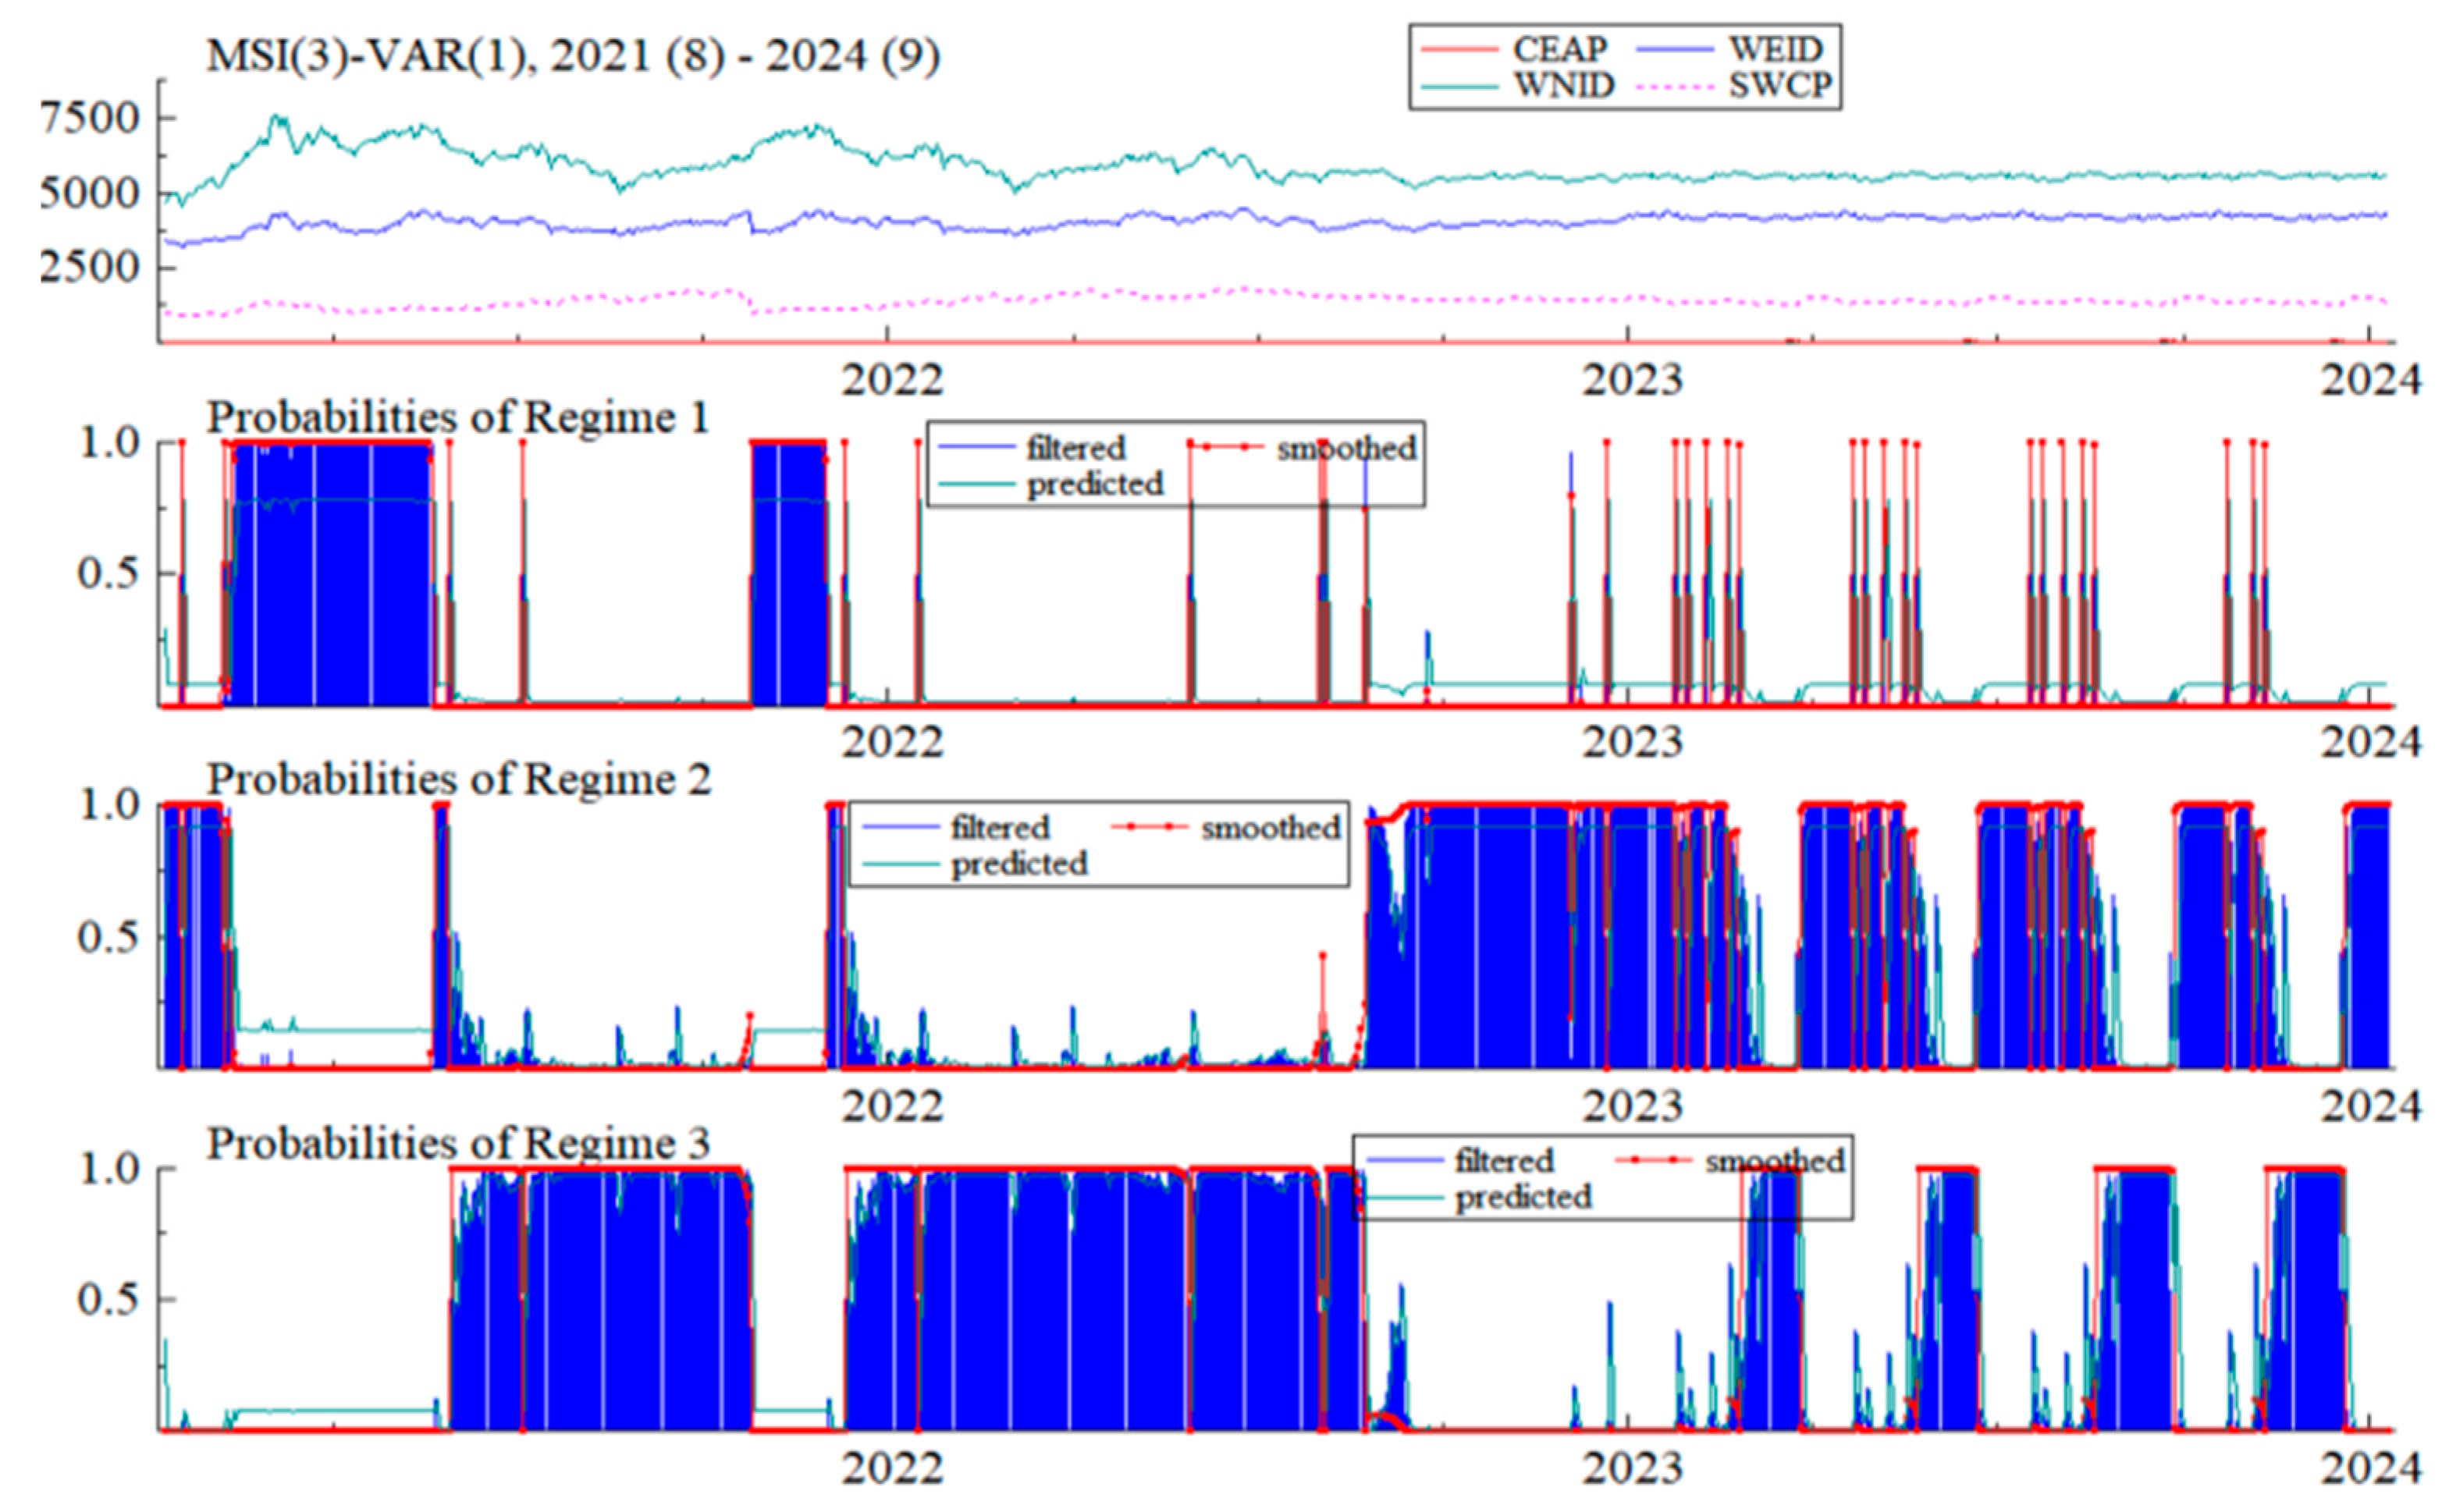
The research in the previous section has already shown that there may be structural changes and asymmetric characteristics between the prices of the four markets: the carbon market (CEAP), electricity market (WEID), new energy market (WNID), and coal market (SWCP). Therefore, it is especially necessary to use the MSVAR model for further study. In this section, the optimal lag order of the MSVAR model is selected as 1, and based on the price trends of the four markets, the regime variable is divided into three regimes: “Stable State,” “High-Volatility State,” and “Transition State.” The Stable State indicates that the market is relatively stable with low volatility, the High-Volatility State indicates that the market’s volatility has increased, possibly due to some external shocks or events, and the Transition State indicates that the market is transitioning from one state to another, possibly displaying moderate volatility and growth rates. The final model adopted in this section is the MSI(3)VAR(1). The regime-switching probabilities of the MSI(3)-VAR(1) model are shown in
Figure 2 and
Figure 3 and
Table 6.
The analysis of
Figure 2 and
Figure 3 and
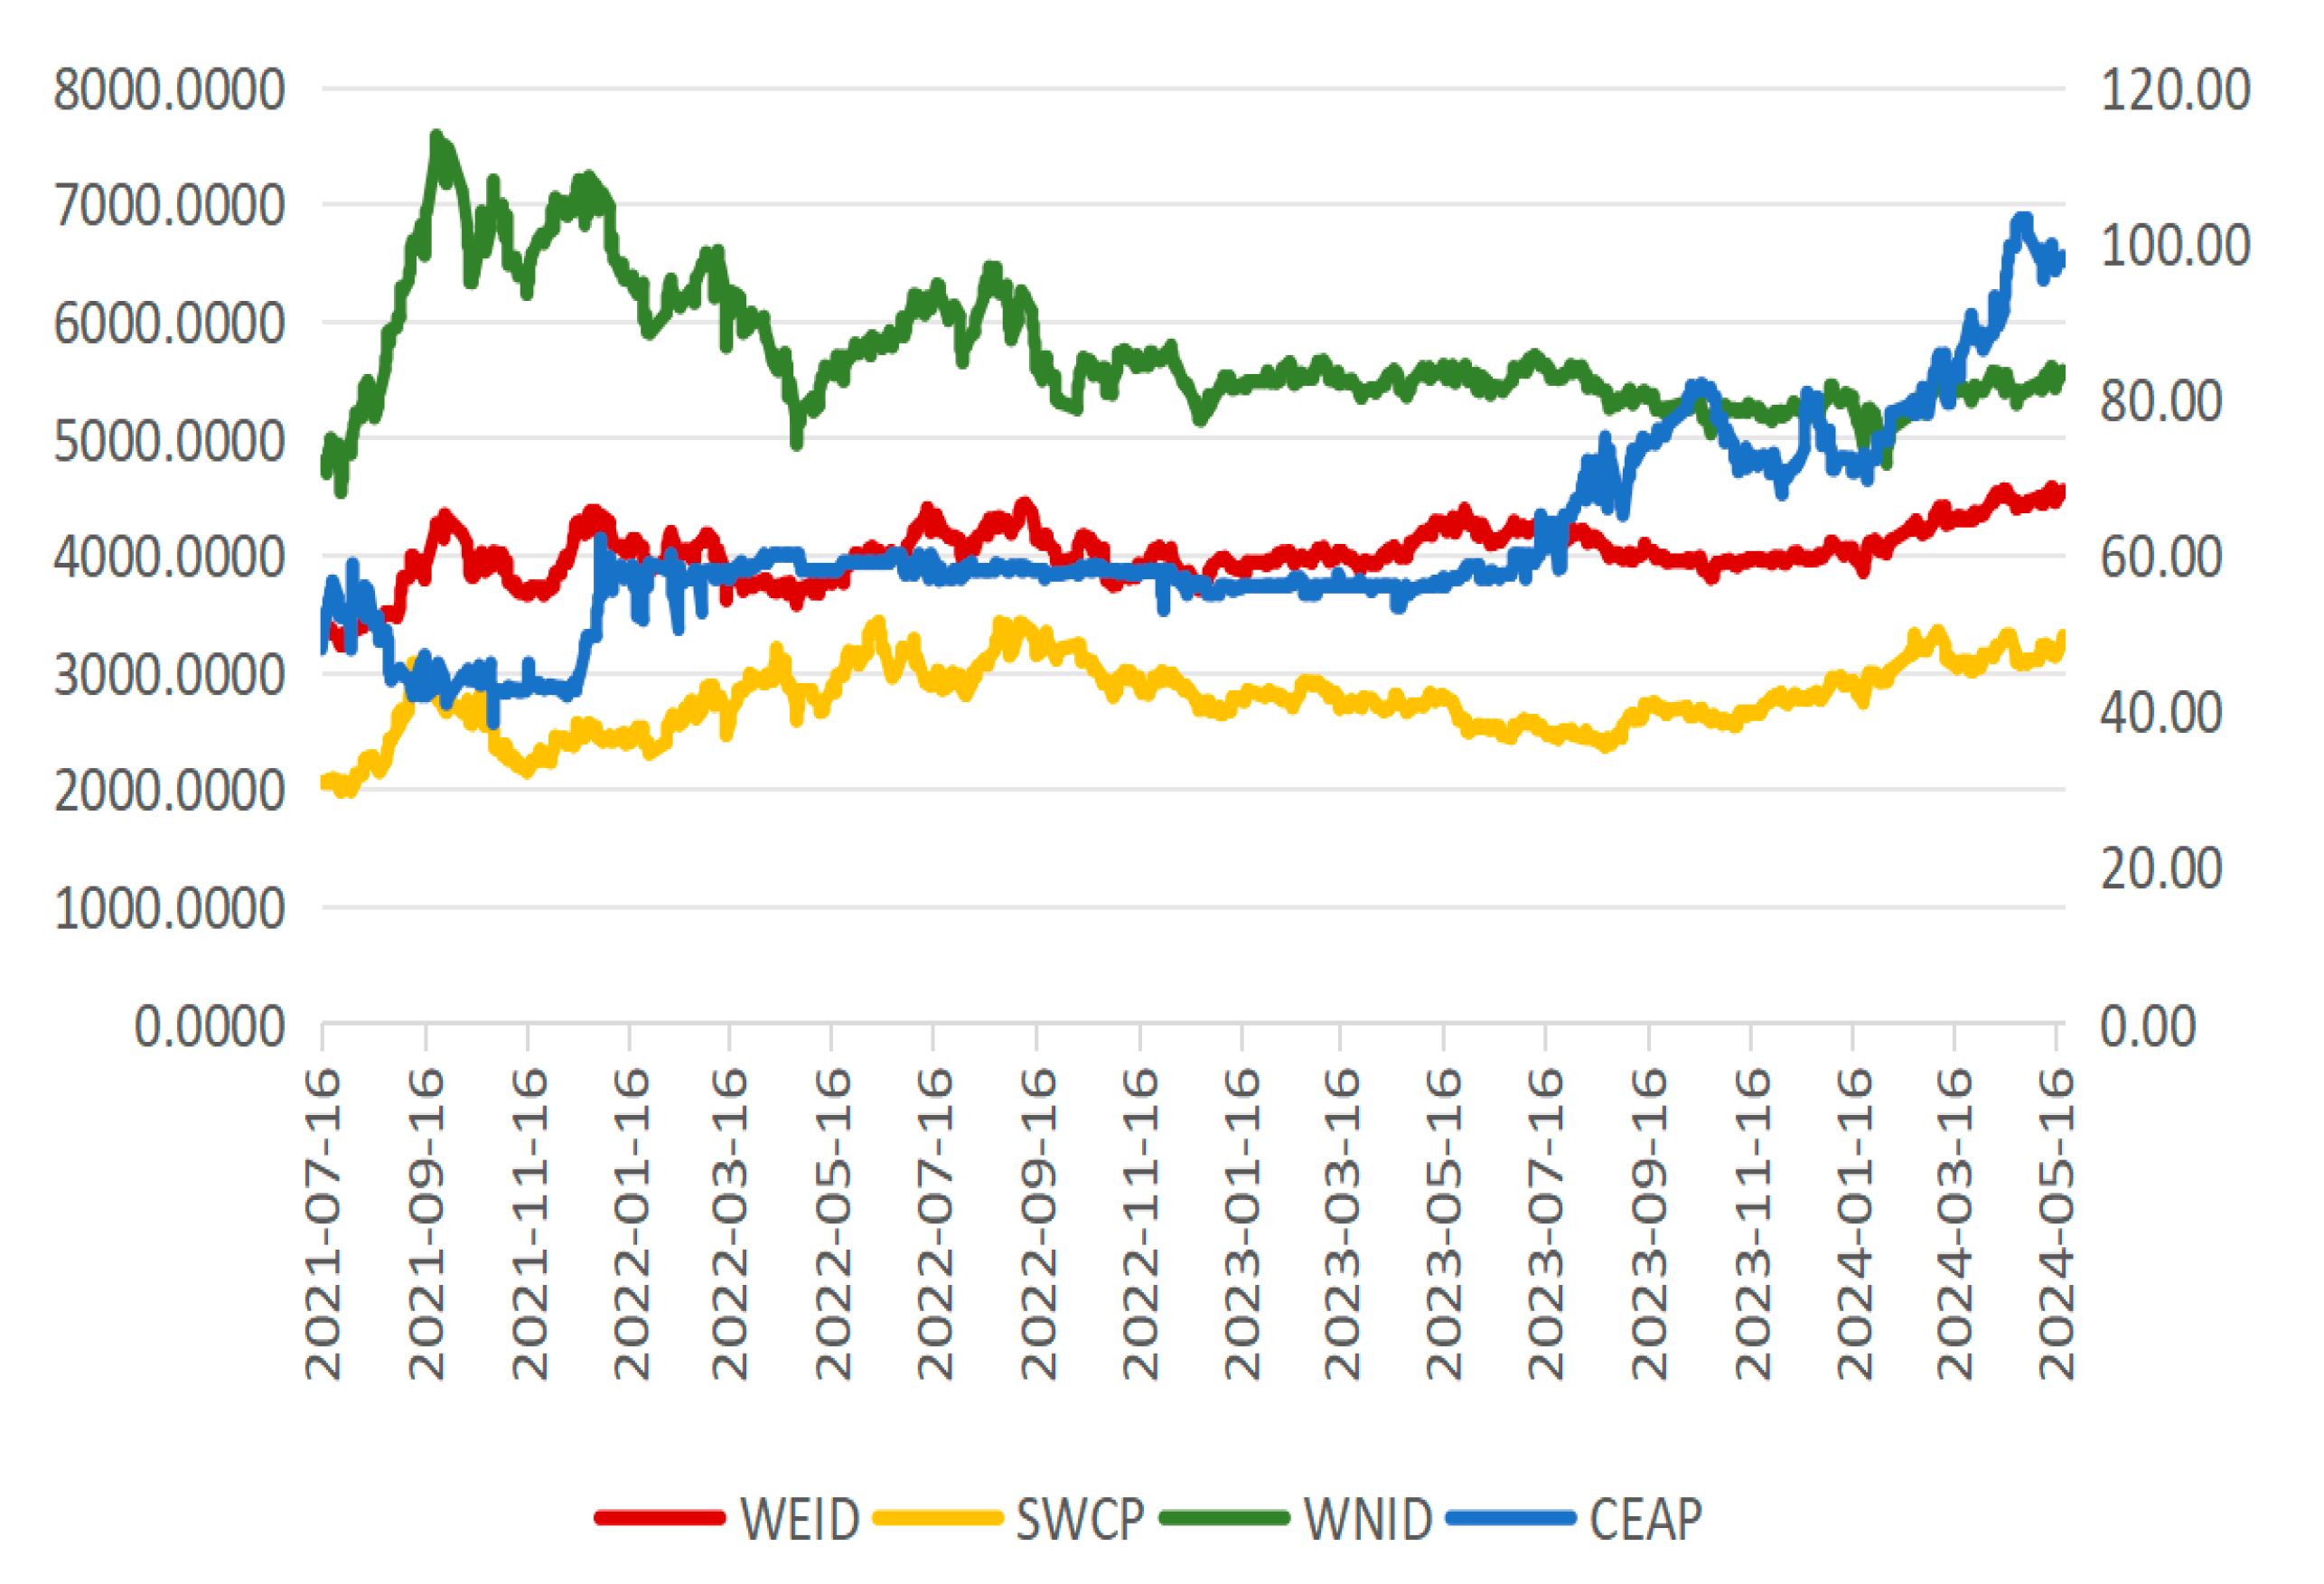
Table 6 highlights the distinct regime-switching behaviors and the high persistence of market states across the four markets. Specifically, for the carbon market (CEAP), when in Regime 1, it has a 77.73% probability of remaining in its current state, but also a 14.43% chance of shifting to the unstable regime (Regime 2), and a 7.85% probability of transitioning to the high-volatility regime (Regime 3). These transition probabilities indicate that the market tends to stay in the stable regime for a substantial period but is also prone to regime shifts, especially toward more volatile conditions, reflecting the inherent instability during the early operational phase of China’s national carbon market as depicted in
Figure 4. Similarly, for the electricity market (WEID), the probability of persisting in Regime 2 is 92.06%, indicating an extremely high degree of stability and inertia, and the likelihood of sudden regime shifts is minimal. This stability aligns with the observed relatively smooth trend of electricity prices shown in
Figure 3. For new energy (WNID) and coal (SWCP) markets, the transition probabilities are also high for remaining in Regime 3, with over 97% chance of persistence, implying that these markets are predominantly in high-volatility states with strong regime dependence as visualized in
Figure 2 and
Figure 3. The low transition probabilities from high-volatility regimes to stable states suggest that once these markets enter turbulent periods, they tend to sustain such conditions for a significant duration. Overall, these results confirm that Chinese carbon and energy markets are characterized by regime-dependent dynamics, with a high probability of persistence within their regimes, and occasional shifts driven by market shocks or policy interventions. Recognizing this regime-switching behavior is crucial for developing effective risk management and policy strategies within China’s evolving green economy.
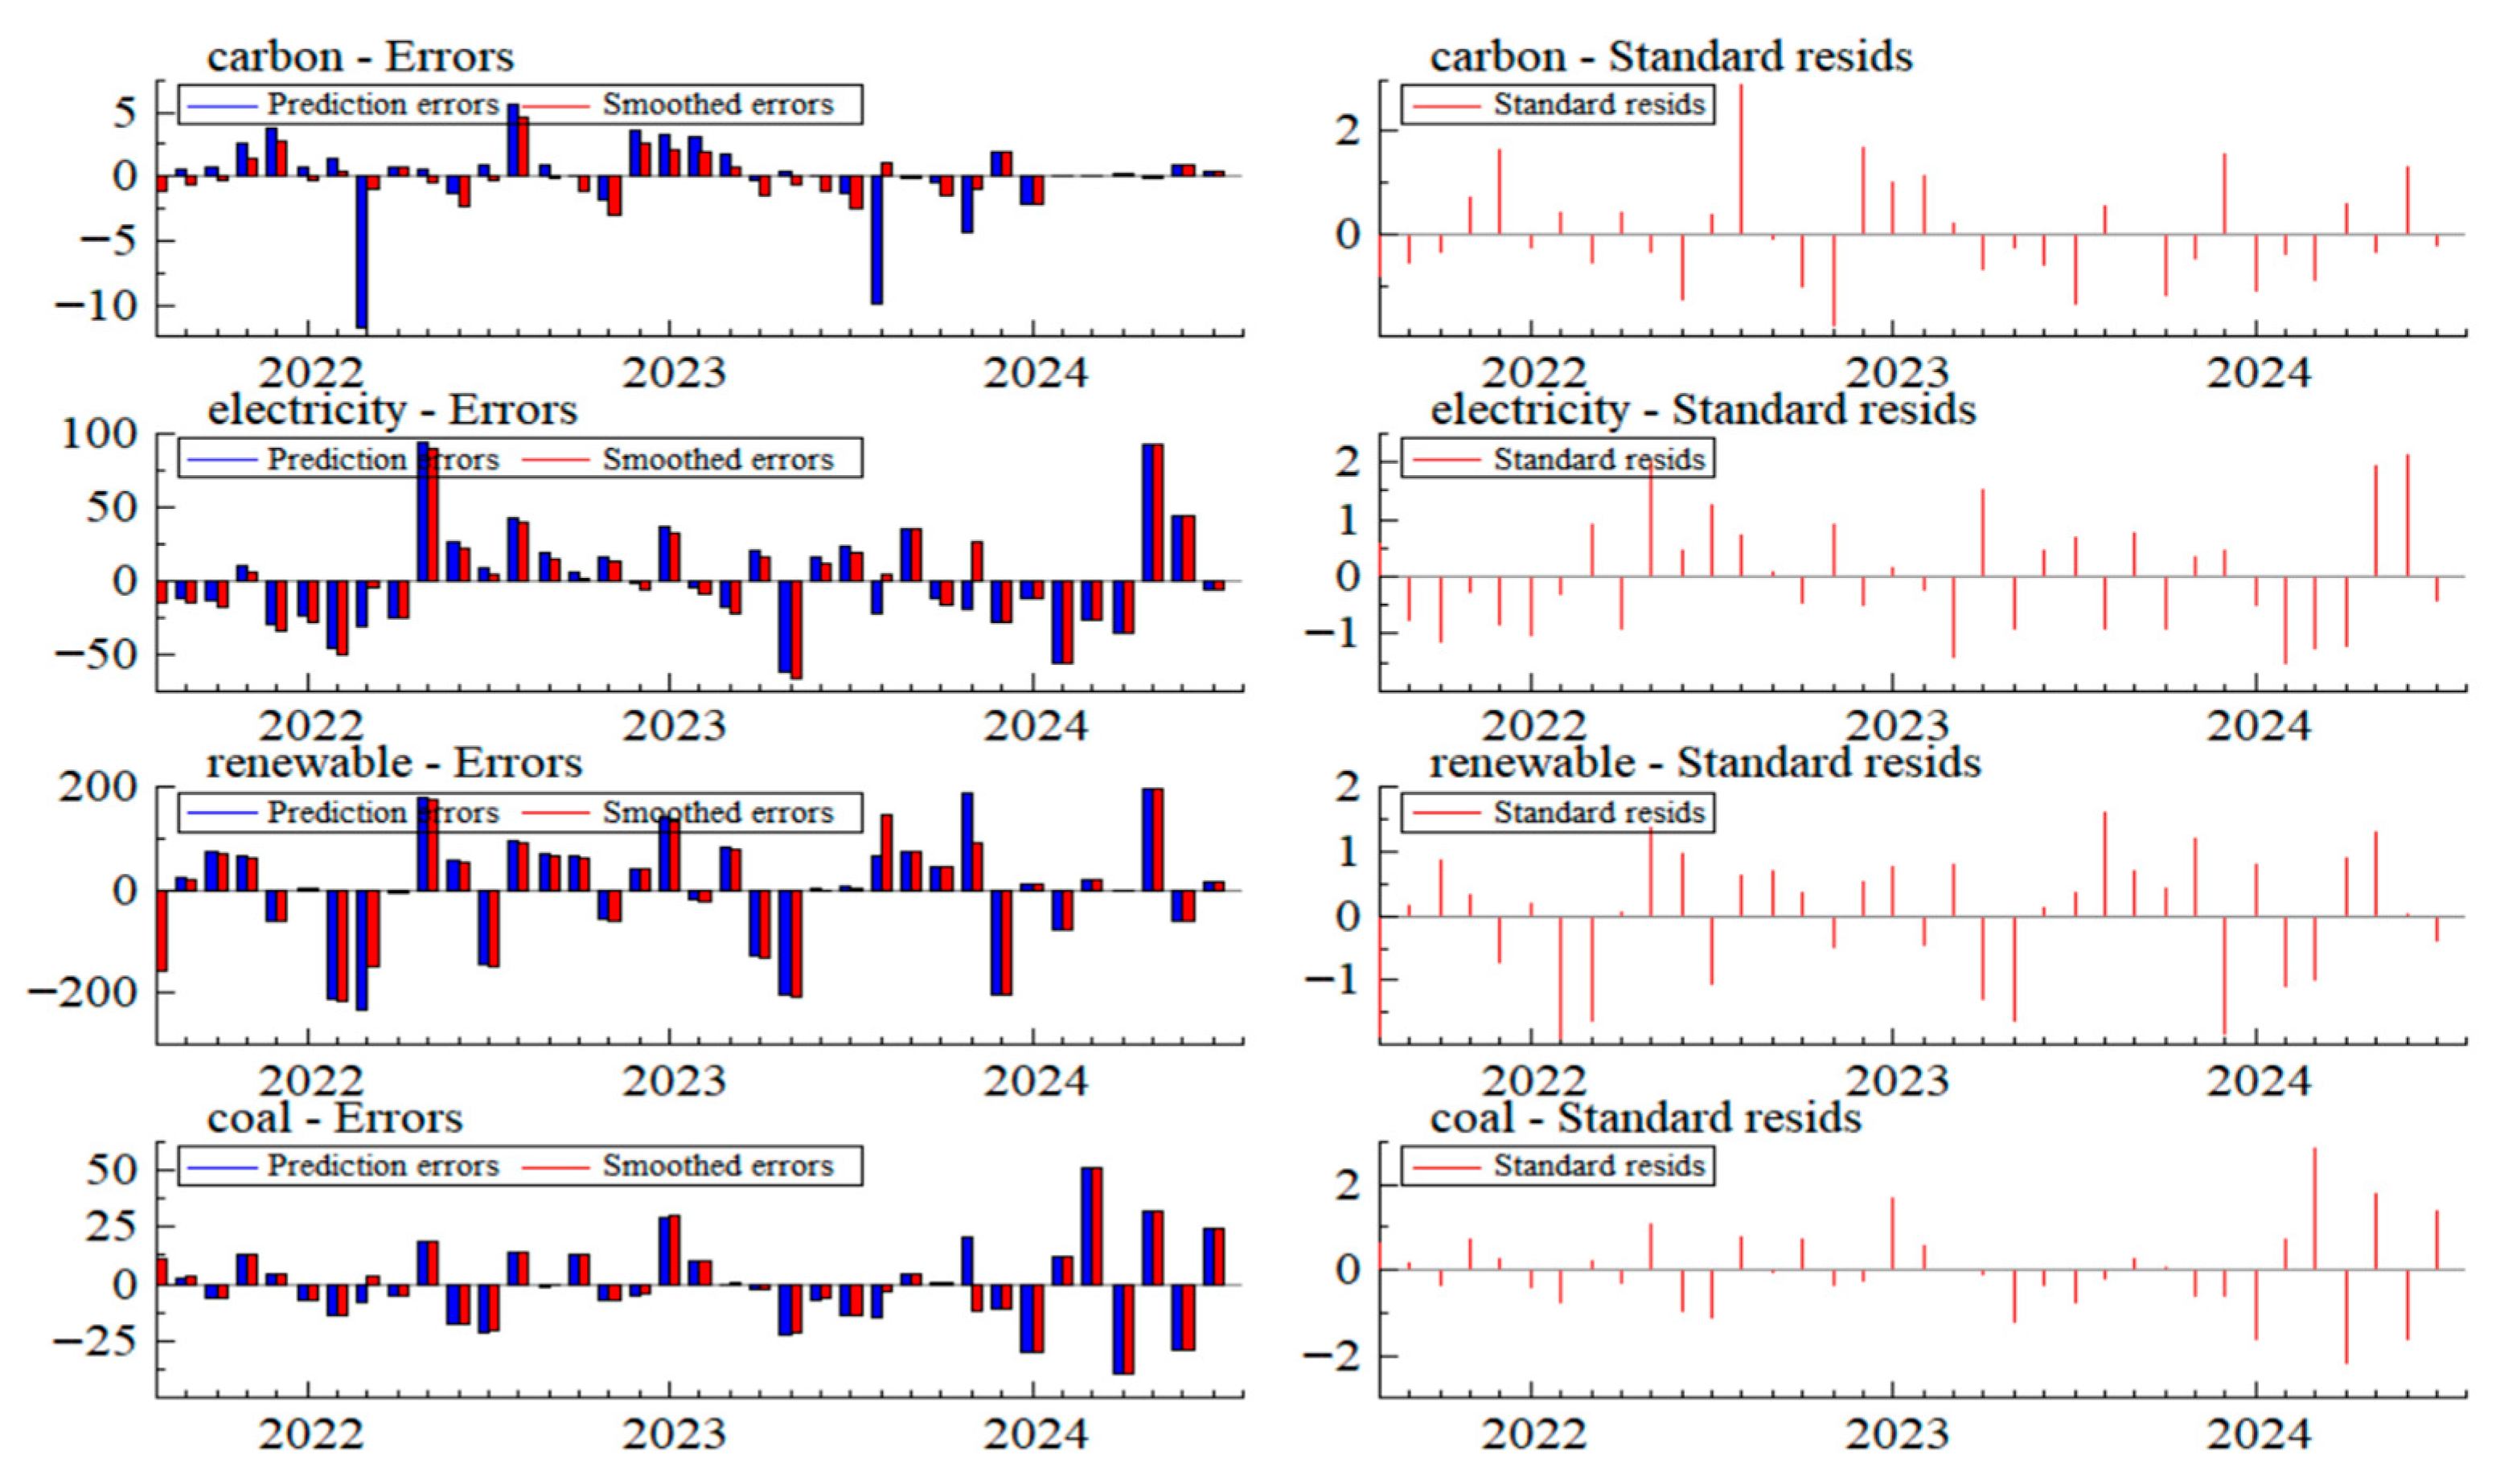
Based on the residual analysis in
Figure 4, the standard residuals across the four markets generally remain within acceptable ranges throughout the sample period, exhibiting stable fluctuations without obvious deviations or extreme values. This indicates that the model fits the market dynamics reasonably well. The residuals for the carbon market (CEAP) show relatively small fluctuations from 2022 to 2024, with occasional outliers near the center, but overall they are distributed fairly uniformly, consistent with the normal distribution assumption. Similarly, the residuals for the electricity (WEID) and new energy markets (WNID) demonstrate comparable characteristics, mainly concentrated within reasonable bounds, indicating that the model effectively captures their main price fluctuation features. The residuals for the coal market (SWCP) display slight deviations, with some larger deviations at certain points in time, but still remain within acceptable limits. These results validate the robustness and reliability of the model, with the randomness and lack of systematic bias in the residuals supporting its effectiveness in describing market dynamics. Overall, the residual analysis suggests that the model adequately captures market price changes, although it may still need improvements in sensitivity to extreme fluctuations or structural shifts caused by unforeseen events.
Based on the analysis of
Table 7, a comprehensive understanding of regime-switching characteristics in China’s carbon and energy markets can be obtained.
Table 7 shows that the average durations in different regimes are approximately 4.5 days for the stable regime (Regime 1), accounting for about 15.81% of the time; around 12.6 days for the unstable regime (Regime 2), representing about 35.53%; and the longest for the transition regime (Regime 3), lasting about 39.2 days and covering roughly 48.66%. This indicates that markets tend to switch between states with noticeable persistence, with shorter durations in the stable regime and longer periods in high-volatility or transition states.
Figure 5 illustrates the transition pathways, highlighting frequent regime changes. It shows that markets easily shift from the stable regime (Regime 1) to the unstable regime (Regime 2) or directly into the high-volatility regime (Regime 3). Notably, pathways like “Transition regime 1 to 2” demonstrate such upward shifts, while other paths, such as moving back to regime 1, indicate the possibility of recovery, particularly after periods of turbulence. Combining these insights reveals that once markets enter high-volatility or transition states, they tend to stay in these regimes for extended periods, making recovery to stability more challenging. This reflects the intrinsic nonlinear and regime-dependent nature of the markets. Once in an unstable or transitional phase, markets may experience prolonged turbulence, increasing the difficulty of risk management and policy regulation.
Overall, the features indicated by
Table 7 and the transition pathways depicted in
Figure 5 together demonstrate the regime-switching behavior of China’s carbon and energy markets. They emphasize the importance of considering dynamic regime changes in research and policymaking to better manage price volatility and risks associated with different market states.
From
Table 8, it can be clearly seen that the correlation coefficients among the markets vary significantly, highlighting different relationships during the same period. The correlation between the carbon market (CEAP) and the electricity market (WEID) is very weak and negative (−0.0132), indicating almost no linear relationship. In contrast, the correlation between WEID and the new energy market (WNID) is relatively high (0.7020), suggesting a strong positive relationship, reflecting that these markets tend to move together. The correlation between WNID and the coal market (SWCP) is moderate (0.3092), indicating a weak to moderate positive relationship. Similarly, the correlation between CEAP and SWCP is very close to zero (0.0130), implying negligible linear dependence. Overall, these correlation patterns suggest that while some markets like energy and new energy are closely linked, others like carbon and coal markets operate largely independently within the observed period.
This research indicates that the spatial transmission effects between markets vary under different regional conditions. This section will further examine the nonlinear dynamic dependence structure between the carbon market, power market, new energy market, and coal market.
Table 9 presents the estimation results of the MSI(3)-VAR(1) model.
Based on the estimation results of the MSI(3)-VAR(1) model in
Table 9, it is clear that each market exhibits distinct regime-dependent behaviors. Interpretation of
Table 9 focuses on coefficient signs and dynamics. Model validity is supported by regime analysis (
Table 6) and robustness checks (
Table 10). The constant terms differ across regimes, with higher baseline levels in Regimes 2 and 3 compared to Regime 1, indicating different long-term price levels depending on the state. The lag coefficients reveal varying degrees of persistence and mean-reversion: for the carbon market (CEAP), the coefficient is positive in Regimes 1 and 3, suggesting prices tend to reinforce recent trends, while in Regime 2, the negative coefficient indicates a strong tendency for prices to revert to a long-term equilibrium.
Similarly, the electricity (WEID) and new energy (WNID) markets show high persistence in Regimes 2 and 3, with lag coefficients close to one, reflecting strong autocorrelation during these periods. In Regime 1, their coefficients are near zero, indicating weak dependence on past prices. The coal market (SWCP) exhibits a comparable pattern, with high autocorrelation in Regimes 2 and 3 and little dependence in Regime 1. These regime-specific coefficients highlight the markets’ asymmetric responses and varying volatility levels across different states. Recognizing these behaviors is crucial for understanding market stability and formulating effective risk management and policy strategies tailored to each regime.
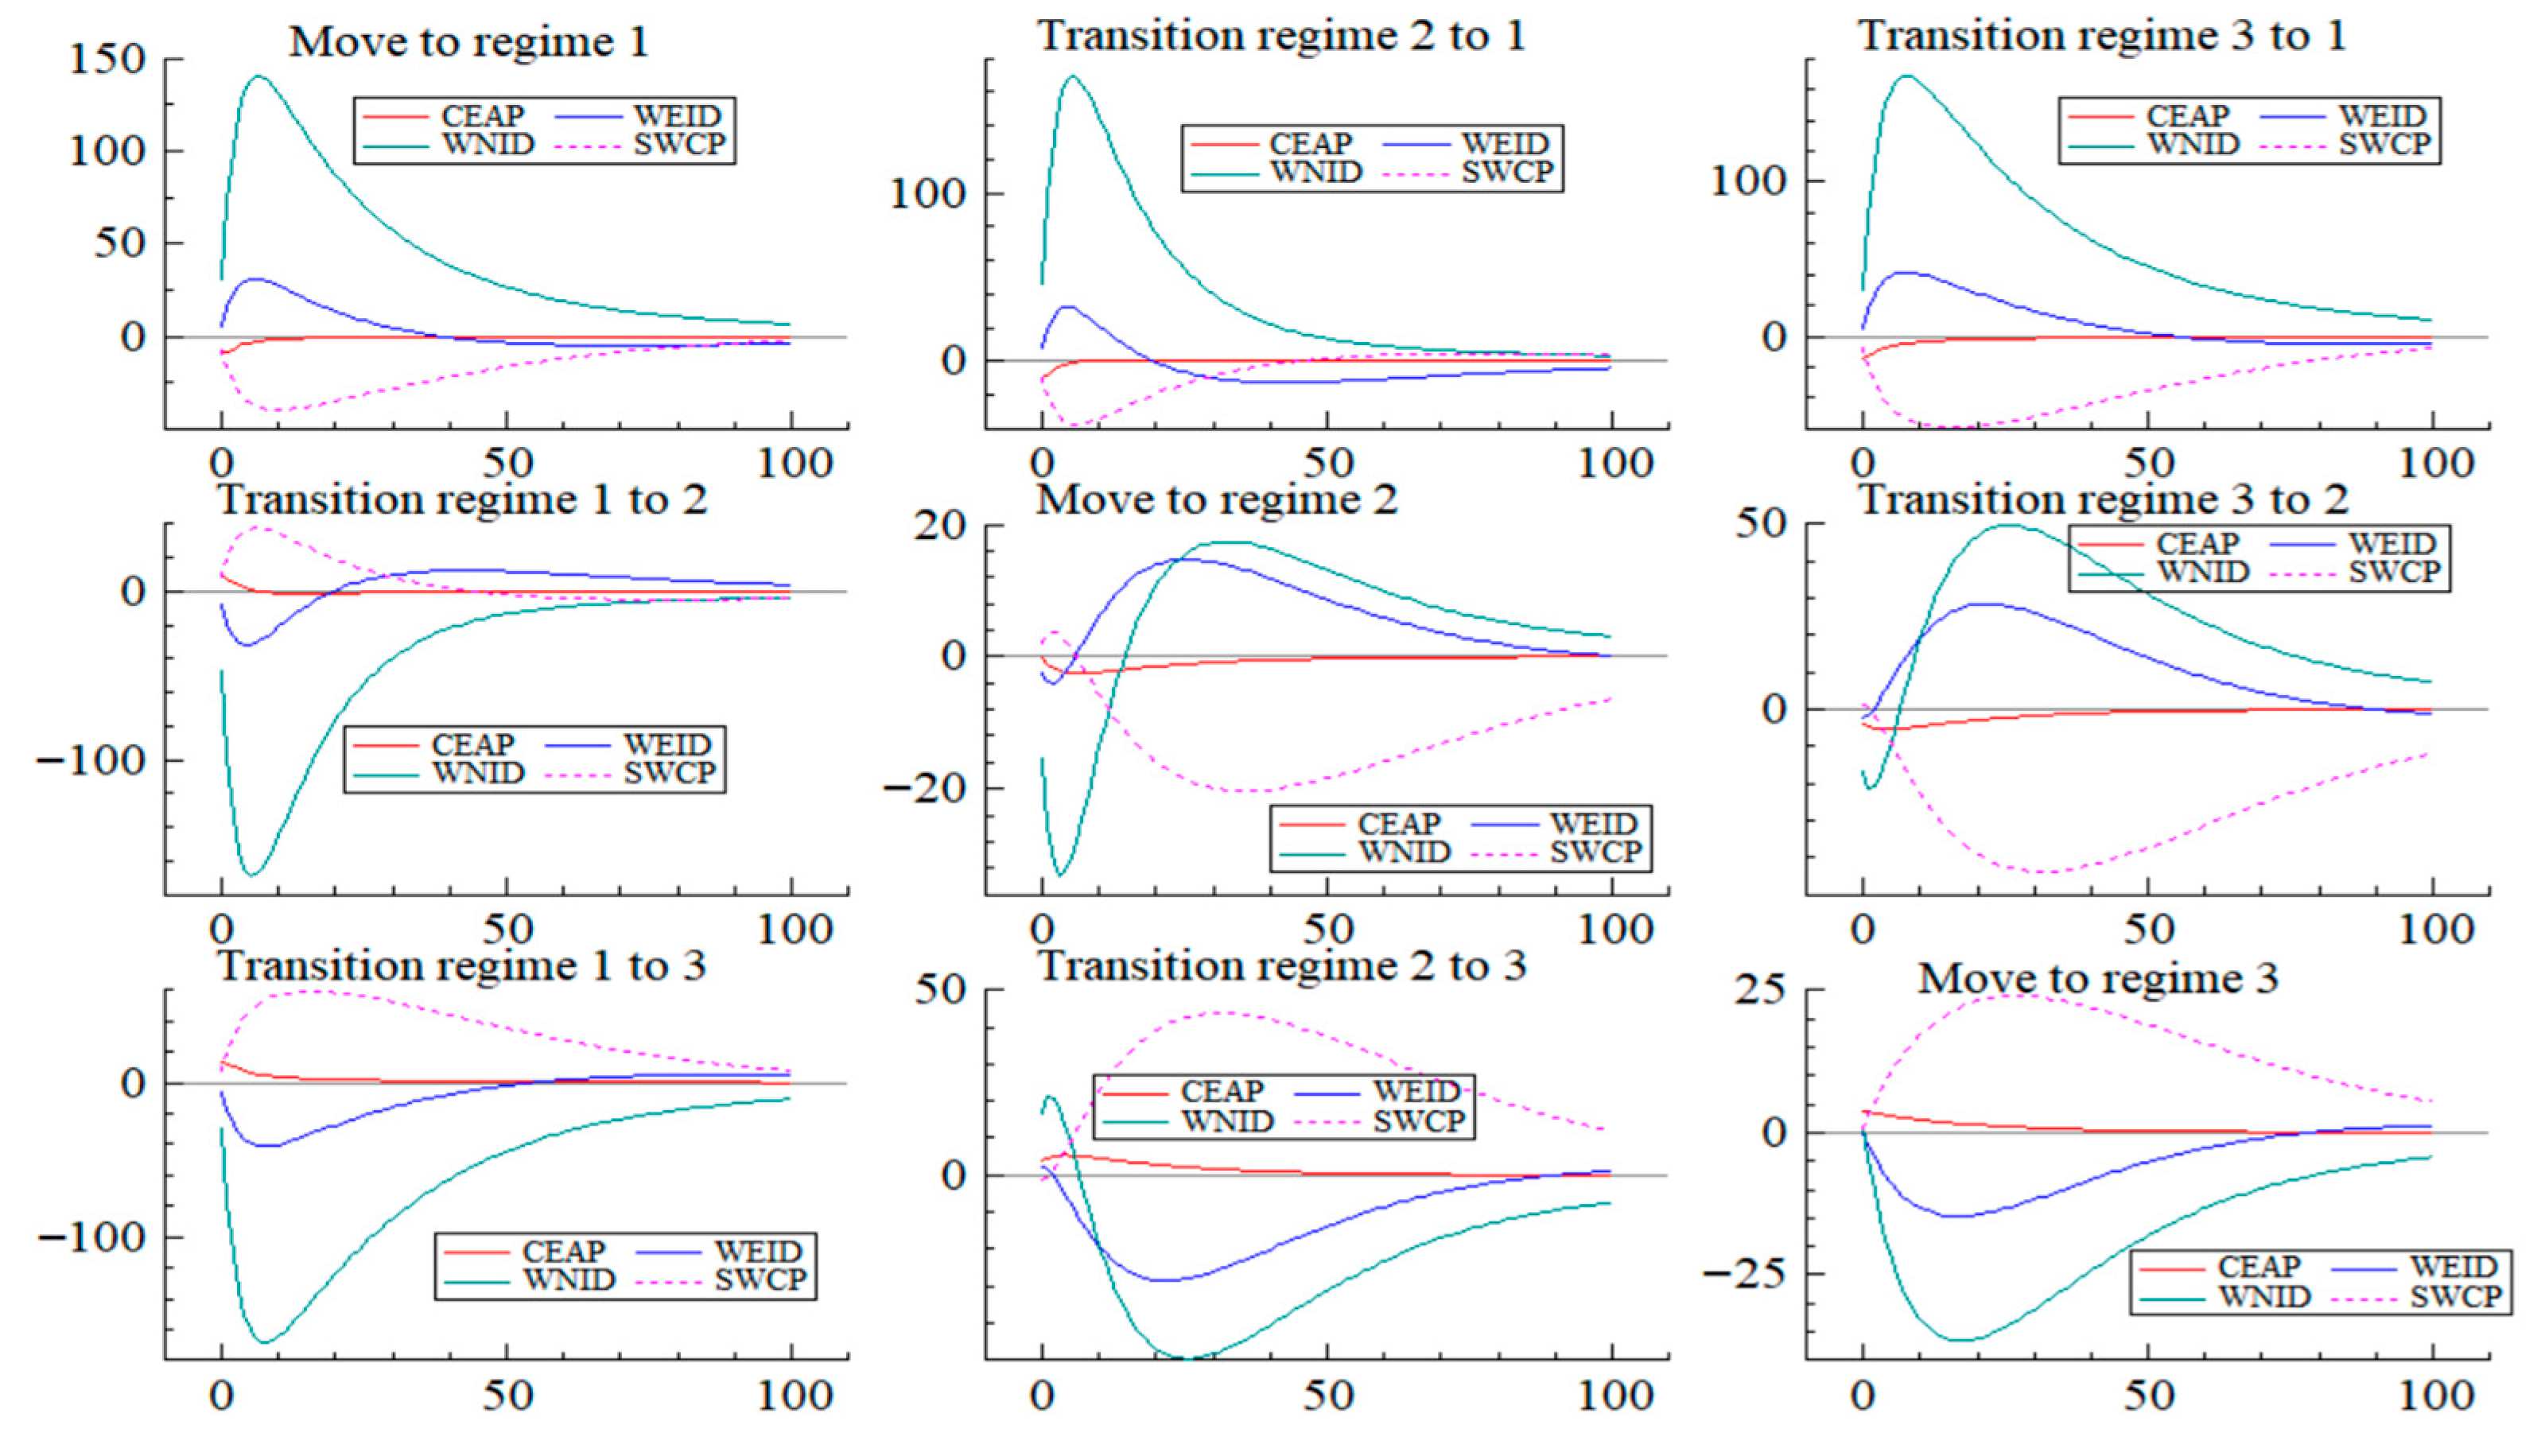
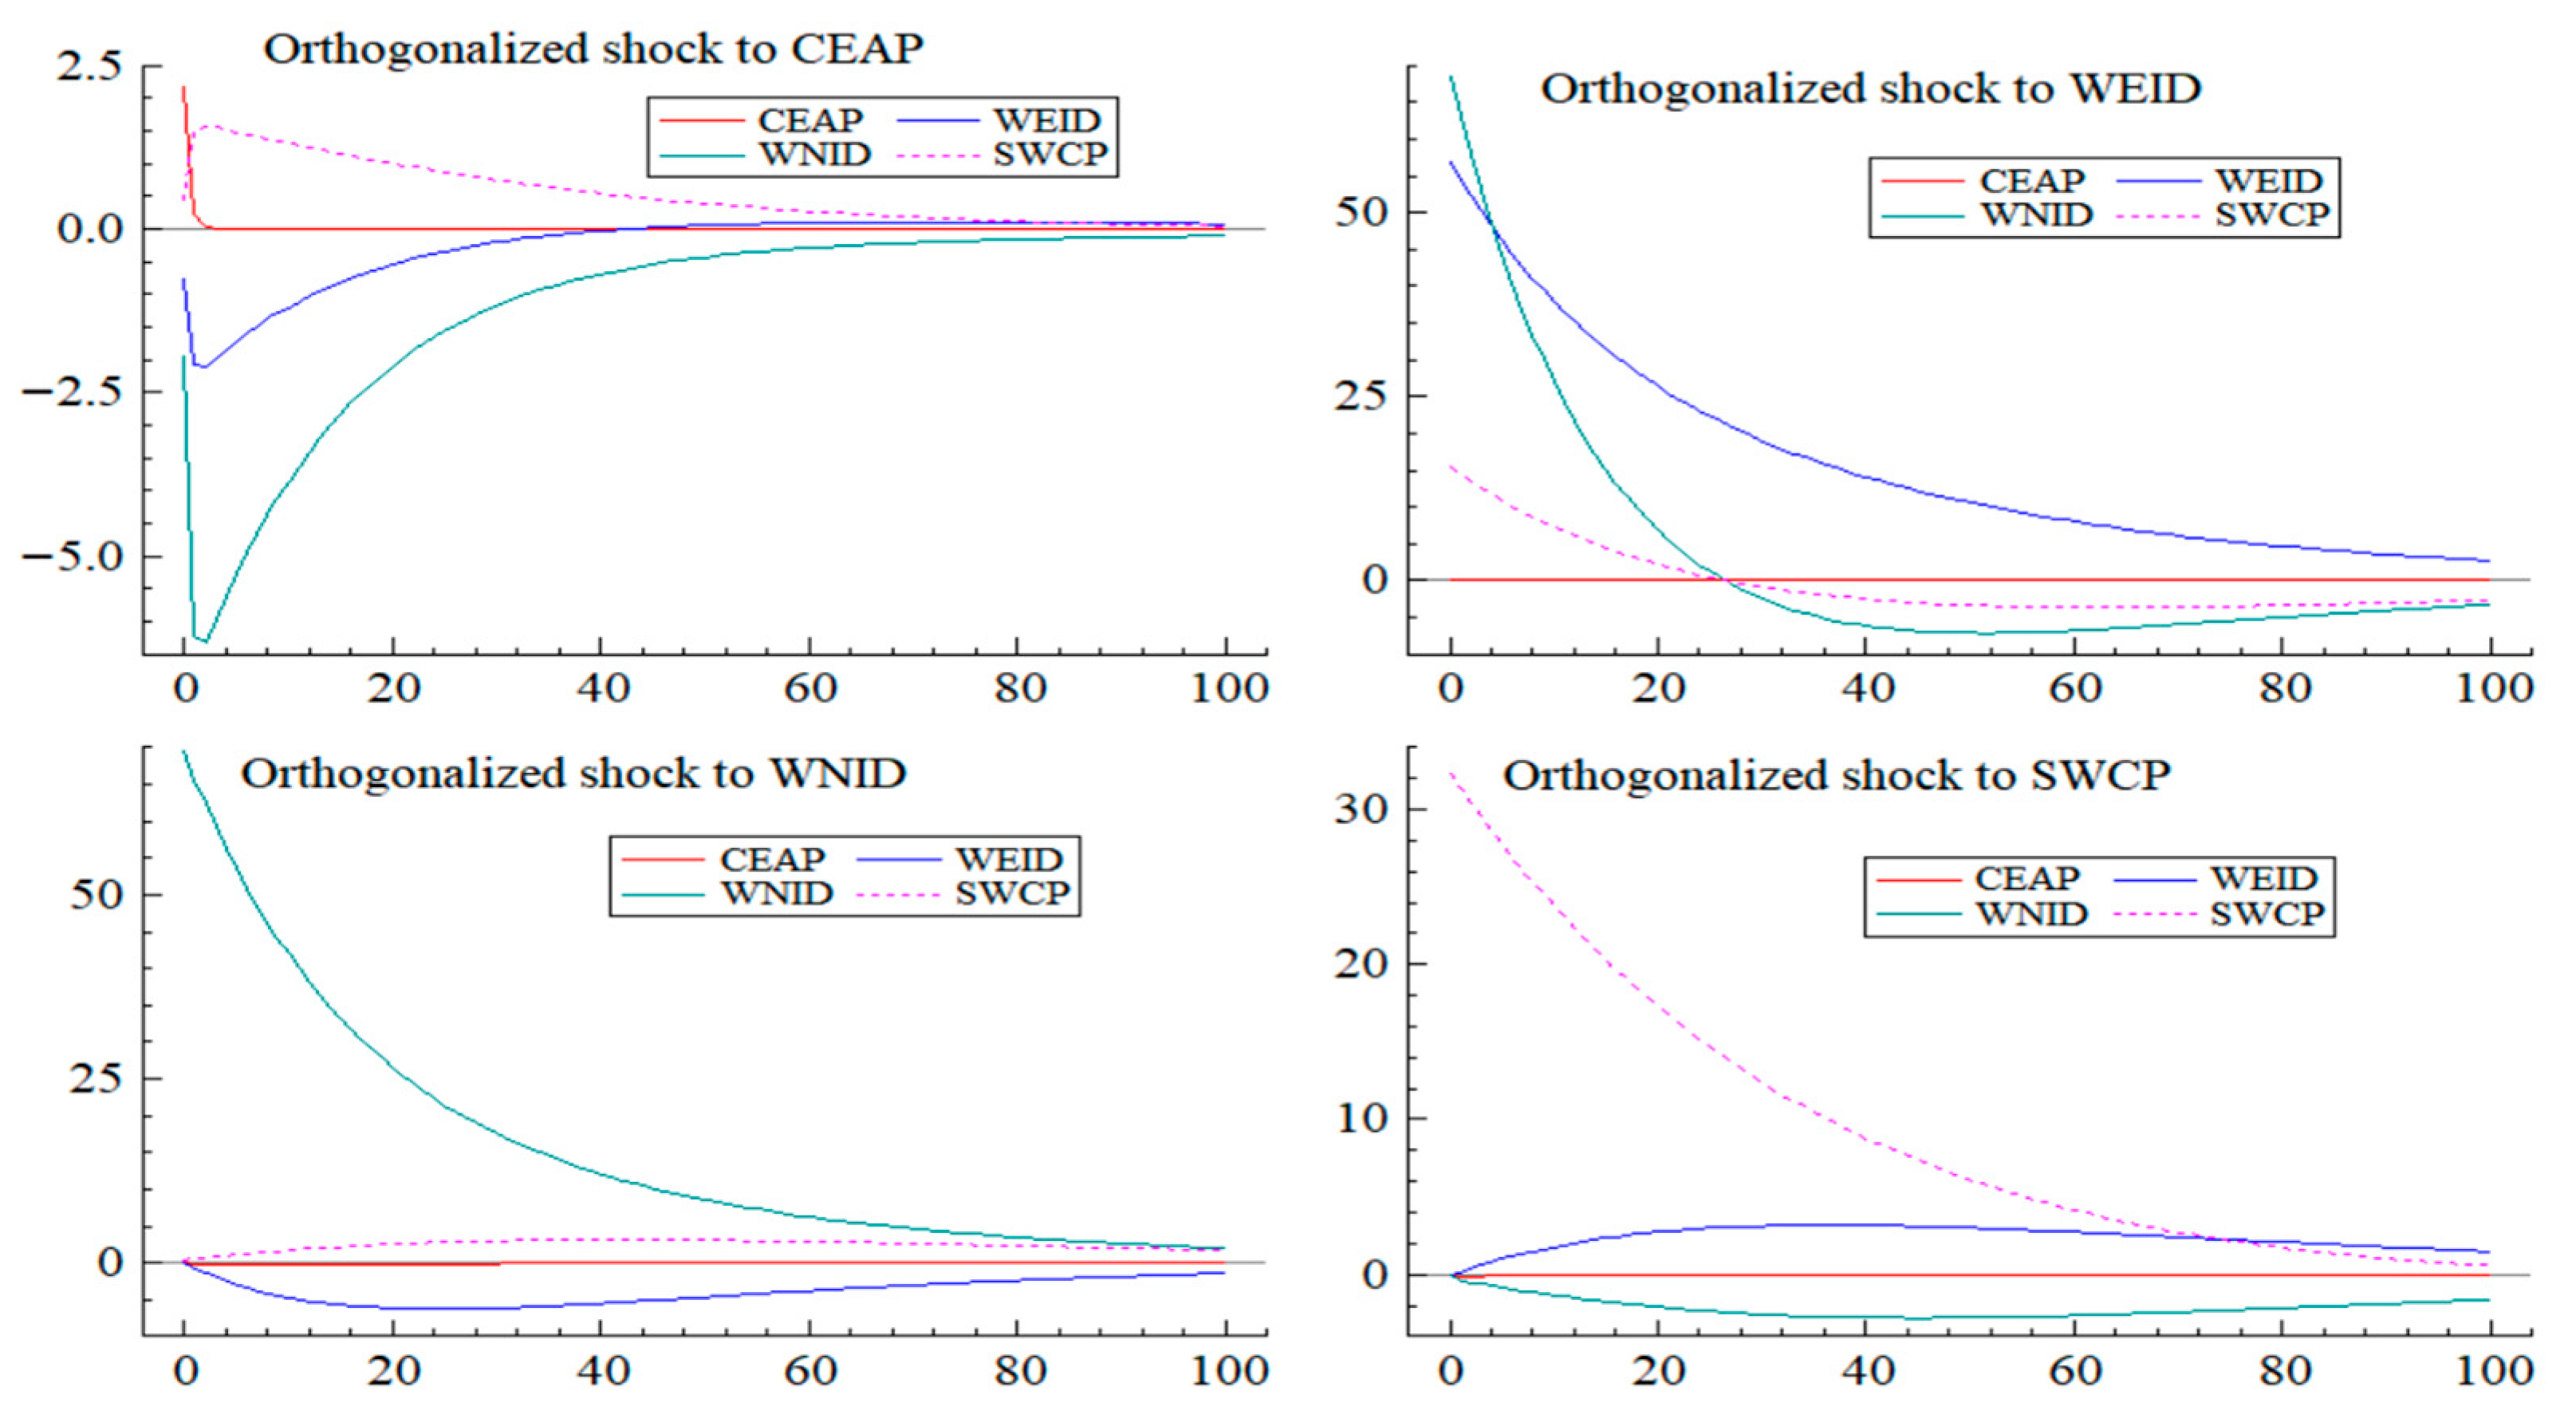
Based on the impulse response results shown in
Figure 6 over a 100-period horizon, clear patterns of dynamic interactions among the four markets emerge. Shocks to the carbon market (CEAP) initially produce minor negative responses in the power market (WEID), which quickly diminish within approximately 20 periods, indicating limited long-term dependence. The effects on the WNID and SWCP following a shock to CEAP are also minimal and stabilize rapidly, suggesting weak nonlinear interactions from the carbon market to the others.
In contrast, shocks to the power market (WEID) generate more pronounced and persistent influences on the coal market (SWCP), with effects lasting over 20 to 30 periods before gradually fading. The responses of WNID and SWCP to WEID shocks display initial fluctuations that stabilize over time, reflecting a stronger short-term nonlinear dependence. Similarly, shocks originating from WNID and SWCP affect each other with oscillatory responses that gradually settle, indicating complex but stabilizing relationships over the extended horizon.
Overall, extending the analysis to 100 periods highlights that the markets’ nonlinear dependencies are characterized by strong short-term effects that weaken over time. The transient nature of these regime-dependent interactions underscores the importance of considering extended time horizons in policymaking and risk management, as short-term shocks can have significant yet temporary impacts within this interconnected system.
5.2. Robustness Check with Nonlinear Granger Causality Test
A particularly noteworthy finding from the nonlinear Granger causality test results provides independent validation for the core findings of this study. The tests reveal significant nonlinear causal relationships among China’s carbon and energy markets, with transmission pathways demonstrating clear asymmetric characteristics.
① Bidirectional nonlinear causality exists between the carbon and new energy markets (CEAP ↔ WNID, p-values 0.008 and 0.023, respectively). This finding corroborates the regime-dependent dynamics observed in the MSVAR model, confirming the complex feedback mechanism between these two markets. Carbon price fluctuations not only directly affect the new energy sector, but also develop expectations in the new energy industry and provide feedback for carbon market expectations.
② The electricity market occupies a central position in the entire system. Tests reveal significant unidirectional nonlinear causality from the electricity market to both the coal market (WEID → SWCP, p = 0.001) and new energy market (WEID → WNID, p = 0.004). This suggests that changes in electricity demand simultaneously affect the supply-demand dynamics of both traditional and new energy sources, highlighting the pivotal role of the electricity market in the energy system.
③ The causal relationships exhibit significant asymmetry. The influence strength of the electricity market on the coal market (test statistic 4.215) is noticeably higher than its influence on the new energy market (test statistic 3.789), reflecting the current characteristic of China’s energy structure still being dominated by coal power. Meanwhile, the feedback effect from the coal market to the electricity market is insignificant (p = 0.287), indicating a one-way price transmission mechanism.
④ The direct relationship between carbon and electricity markets remains weak. Neither causal relationship between these two markets is significant (p-values 0.365 and 0.441, respectively), possibly stemming from the ongoing development of China’s carbon allowance allocation mechanism for the power sector, leaving room for improvement in the transmission efficiency of carbon price signals to electricity costs.
5.3. Discussion of Causal Mechanisms
A particularly noteworthy finding from our analysis is the negative correlation of −0.55 between the carbon market and the new energy market, as shown in
Table 2. While this seems counterintuitive, as a higher carbon price should theoretically benefit the renewable sector, this “adverse movement” can be explained by several underlying causal mechanisms present in China’s nascent market environment.
First, the policy uncertainty channel plays a significant role. In its initial phase, China’s carbon market price is highly sensitive to policy signals. Extreme volatility or unexpected spikes in the carbon price may not be interpreted by investors as a stable, long-term incentive for green investment. Instead, it can be perceived as a sign of regulatory instability and heightened policy risk across the entire green sector. Given that new energy projects are capital-intensive and rely heavily on stable, long-term policy support, such uncertainty can deter investment and trigger a sell-off in new energy stocks, creating a negative correlation with the carbon price.
Second, the investor sentiment contagion channel is also critical. As both the carbon market and the new energy market are key components of the “green economy” theme, they often attract a similar cohort of thematic investors. Turbulence in the carbon market, as a new and less understood asset class, can create a “risk-off” sentiment that quickly spills over to the new energy sector. Investors may choose to reduce their exposure across all green assets to avoid volatility, leading to a concurrent downturn that manifests as a negative correlation if the carbon price itself is spiking due to non-fundamental reasons (e.g., compliance rushes). This explains why the relationship is complex, as our MSVAR impulse response results (
Figure 6) also show the dependency changing from positive to negative over time, reflecting these shifting dynamics rather than a simple, static relationship.
