Abstract
This study investigates whether publicly listed cannabis shares provide enough risk-adjusted returns to warrant their incorporation into diversified portfolios. An equally weighted portfolio of cannabis companies is constructed using monthly data from January 2015 to December 2024. Risk-adjusted performance is assessed using the Sharpe, Sortino, and Omega ratios and compared to the Russell 3000 Index and the FTSE All-World ex-US Index. In addition, we estimate both unconditional and conditional Fama–French five-factor model enhanced by momentum. The findings indicate that cannabis stocks persistently underperform U.S. and global benchmarks in both absolute and risk-adjusted metrics. Downside risk is elevated because cannabis portfolios exhibit much higher value at risk (VaR) and conditional value at risk (CVaR) than broad indices, especially after COVID-19. The findings show that cannabis stocks are quite volatile and fail to generate significant returns on a risk-adjusted basis. The study highlights the sector’s structural vulnerabilities and cautions investors, portfolio managers, and regulators against treating cannabis shares as dependable long-term investments.
1. Introduction
The social and legal perception of cannabis has shifted significantly over the past 20 years, and continues to evolve (Carliner et al. 2017). The U.S. cannabis market is projected to increase from $36.94 billion in 2024 to $91.10 billion by 2033 at a compound annual growth rate (CAGR) of 10.55%.1 This growth is likely to be supported by expanding legalization, increased medical use cases, rising consumer acceptance, and product innovation. As a result, investor interest in cannabis stocks has increased over the past few years. Despite growing interest in cannabis stocks, their long-term risk-adjusted returns remains largely unstudied. Often grouped with “sin stocks,” cannabis firms face distinct challenges, including inconsistent regulations and federal prohibition despite state-level legalization in the U.S. This duality creates legal uncertainties that limit banking services, increase compliance costs, and lead to significant valuation disparities (Parker et al. 2019; Conti-Brown 2018).
Speculative interest in the cannabis sector has grown, reflected by increased exchange-traded funds (ETF) and retail trading activity during market volatility (Fabozzi and Malhotra 2025). However, this sector tends to underperform and experiences high volatility and low profitability (Chen et al. 2021), in contrast to traditional sin stocks, where exclusion usually leads to higher returns (Fabozzi et al. 2008; Salaber 2007; Blitz and Swinkels 2023). This study examines whether cannabis equities provide risk-adjusted diversification benefits or if fundamental weaknesses prevent them from achieving a sin or sentiment premium.
Given the changing nature of societal attitudes towards cannabis and the projected growth of this sector, this research extends previous the growing literature by providing a first-of-its-kind 10-year analysis of publicly traded cannabis stocks by employing unconditional and conditional asset-pricing models with five factors and momentum and integrating downside risk measures. We benchmark cannabis equities’ risk-adjusted performance against the Russell 3000 index and the FTSE All-World ex-US index. In terms of the literature on sin stocks and thematic investing, this paper provides additional context for an important but still-emerging sector. Over the last few years, investors have been eyeing cannabis equities as more jurisdictions have moved toward legalization of the plant, and its market is quickly maturing. However, unlike its more established “sin stock” relatives like alcohol and tobacco, cannabis companies are structurally disadvantaged by their fragmented and sometimes-contradictory regulation, federal prohibition in key markets like the U.S., weak fundamentals, and a speculative trading environment, causing market volatility and uncertainty. For investors and portfolio managers, understanding whether cannabis stocks provide an adequate risk-adjusted return is of the utmost importance, as, without this, there is a risk that investors are taking by exposing their capital to a sector that is hurts their portfolios’ efficiency, and policymakers are missing the mark on the vulnerabilities of this nascent industry.
Prior work has shown that sin stocks can generate excess returns due to exclusionary pressures (the “shunned stock” hypothesis), but evidence for cannabis is sparse, mixed, and often anecdotal or event-driven. Most studies focus on short time frames (e.g., post-legalization announcements or pandemic periods), use basic performance measures, or examine ETFs rather than individual equities. Very few employ advanced multi-factor models, long-horizon datasets, or robust downside risk metrics such as VaR, CVaR, and Omega ratios. This leaves unanswered whether cannabis stocks, as a distinct case of “contentious assets”, behave like other sin stocks with a stigma premium or whether they consistently underperform.
The central question is: Do cannabis equities deliver positive abnormal returns or meaningful diversification benefits when evaluated over a long horizon with robust risk-adjusted measures, or do structural and regulatory disadvantages make them a persistently unattractive investment class?
The study uses monthly data on publicly listed cannabis stocks from January 2015 to December 2024, alongside benchmark indices (Russell 3000 and FTSE All-World ex-U.S.). Performance is assessed through Sharpe, Sortino, and Omega ratios. To capture systematic risk exposures, we apply both unconditional and conditional Fama–French five-factor models augmented with momentum. We further compute downside risk metrics (VaR and CVaR) and examine adjusted Sharpe ratios to account for non-normal return distributions. The analysis is conducted for the full sample and for the subperiod beginning March 2020 to reflect COVID-19 and subsequent market shocks, while acknowledging that other shocks (policy changes, regulatory setbacks, liquidity crises) also shaped outcomes.
This research provides a systematic ten-year evaluation of cannabis equities using multi-factor models and downside risk measures. The findings show persistent negative alphas, unfavorable Sharpe and Sortino ratios, and extreme downside risk compared to broad U.S. and global indices. On the contrary, adding cannabis to a portfolio dilutes efficiency and creates significant tail risk. This has implications for investors in terms of managing cannabis exposure; for portfolio managers in terms of questioning whether diversification claims are exaggerated; and for regulators who might infer structural disadvantages, and a long-term capital formation impediment, based on its ongoing underperformance.
The remainder of the paper is structured as follows. In Section 2, we review previous studies that investigated the sin stocks, cannabis equities, and exchange-traded funds. Section 3 discusses the data used in this study. In Section 4, we discuss the methodology to evaluate the performance of cannabis stocks. Section 5 summarizes the empirical results of our analysis. Finally, Section 6 concludes our study.
2. Previous Studies
A growing body of research has examined the performance of “sin” stocks, but only a handful of studies have investigated cannabis equities as part of this broader debate. This section examines cannabis in the context of contentious assets, highlighting areas of similarity and difference. The review is organized into three parts: (1) studies that examine the performance of traditional sin stocks, (2) analysis of cannabis alone, and (3) findings on cannabis stock investments and their implications for diversified portfolios.
2.1. Sin Stocks
The paradox of sin stocks has been the subject of academic research. Previous studies indicate that industries including tobacco, alcohol, and gambling may experience higher performance because institutional investors are restricted from participation due to regulatory or social considerations. The “shunned stock hypothesis” suggests that this exclusion leads to underpricing and potentially excess returns (Fabozzi et al. 2008; Hong and Kacperczyk 2009). For instance, Salaber (2007) reported that sin stocks in eighteen European countries generated higher returns in environments with frequent litigation, while Fabozzi et al. (2008) observed annualized returns approaching 19 percent, implying that social stigma may not reduce profitability.
Subsequent research offers alternative interpretations. Blitz and Fabozzi (2017) posit that conventional risk factors account for much of the observed anomaly, rather than any distinct moral premium. Rezaeian and Racine (2024) reported no consistent evidence of increased inherent risk among sin stocks, although gambling equities show greater idiosyncratic volatility. Additional behavioral perspectives suggest that pension funds commonly exclude sin stocks, contributing to observable mispricing (Hong and Kacperczyk 2009), while Hamdan (2024) noted that risk-adjusted returns for these stocks tend to be higher in Northern Europe, where cultural acceptance is greater. These studies suggest that any premium related to sin stocks is event-driven, context-specific, and affected by cultural norms and associated risk factors.
Other studies have emphasized the role of sentiment and ESG considerations. Liston (2016) found that the apparent abnormal returns of sin stocks vanish once investor sentiment is controlled for, whereas Liston-Perez and Gutierrez (2018) reported that sin portfolios are less sensitive to waves of irrational sentiment than the S&P 500, making them potential hedges during periods of extreme optimism or pessimism. Zerbib (2022) and Horn (2023) linked sin stocks to the ESG debate, showing that while ESG-oriented firms face lower risk and cost of capital, sin stocks are associated with higher idiosyncratic risk outside of recessions. Similarly, Alessandrini and Jondeau (2019) found that ESG-oriented smart beta portfolios outperform those with sin stock exposure.
Taken together, this literature demonstrates that the persistence of a “sin premium” is not universal but contingent on cultural norms, investor sentiment, wealth, and ESG factors. Against this background of contested evidence, cannabis has emerged as a new candidate for classification as a sin asset, raising the question of whether its risk-return profile resembles or diverges from these earlier patterns.
2.2. Cannabis as a Distinct Case
Cannabis equities have recently been included among sin stocks. These stocks encounter various regulatory and structural challenges that influence their cost of capital and operating risks. In the United States, cannabis remains illegal at the federal level, while some states have legalized it, resulting in uncertainties regarding banking services, financing costs, and regulatory compliance expenses (Parker et al. 2019; Conti-Brown 2018).
Research has identified issues such as increased volatility and weak fundamentals. Weisskopf (2020) finds that cannabis equities display low correlations with traditional assets, suggesting possible portfolio diversification benefits, though these benefits come with higher costs for investors. Chen et al. (2021)’s study found that the gains in medicinal cannabis company stock prices were temporary, because they increased after the announcement of cannabis legalization and then reverted to previous levels. On the other hand, Turley et al. (2024) suggested that cannabis equities may be undervalued compared to other sin sectors and could outperform the market if US federal legalization occurs.
Additional research has examined the impact of investor attention and behavior on cannabis stock performance. Papadamou et al. (2022) found that Google search activity and liquidity are positively related to cannabis stock returns, suggesting that the sector is highly sensitive to speculative investor attention in the face of regulatory uncertainty. Afik et al. (2022) found that regulatory announcements and legalization news drive abnormal positive returns, highlighting the event-driven nature of much of cannabis performance. Cox and Cheng (2021) provided evidence that a portfolio of cannabis stocks outperformed NASDAQ, DJIA and S&P 500 between 1996 and 2020 but had very high volatility, skewness, and kurtosis, and is thus not suitable for risk averse investors. Goodwin (2024) recently reported that cannabis stocks have become more correlated with broader equity markets as the regulatory landscape continues to develop, though they remain highly volatile and policy-sensitive.
These findings suggest that while cannabis shares certain features with sin stocks—social stigma, exclusion, and episodic gains—it also suffers from structural disadvantages not faced by tobacco, alcohol, or gambling. The unsettled evidence raises the question of whether cannabis equities can sustain long-term risk-adjusted performance or whether they represent a fundamentally weaker asset class.
2.3. Cannabis Performance and Portfolio Implications
Moving beyond individual securities, there has been an effort to study cannabis as a portfolio asset class. Fabozzi and Malhotra (2025) documented that cannabis ETFs significantly underperformed the U.S. and global benchmarks while providing little diversification benefit during COVID-19. The authors concluded this reflected poor security selection and market timing ability. Meehan and Corbet (2024) compared the performance of socially responsible and sin portfolios during COVID-19 and found that socially responsible investment portfolios outperformed sin stock portfolios, which were more volatile and prone to drawdowns and losses. Nurasiah et al. (2020) highlighted the economic relevance of sin stocks by showing that the aggregate market capitalization of sin stocks represented a larger U.S. GDP contribution than oil stocks, in contrast to moral arguments that stigmatize such investments. Sagbakken and Zhang (2022) found no evidence of a persistent sin stock premium in Europe for the 2006–2020 period and Humphrey and Tan (2013) show that portfolios that screen out sin stocks do not necessarily underperform.
Overall, these studies highlight that the risk-return characteristics of sin assets are far from homogeneous. In the case of cannabis, the verdict is especially unclear given the fragmented regulatory landscape, speculative trading environment, and fragile fundamentals of the sector. Attracting investor attention and benefiting from event-driven catalysts may create short-term spurts of performance, but evidence of consistent diversification benefits or long-term abnormal performance is lacking.
The extant research has produced mixed and sometimes contradictory results. Few studies have used long enough horizons, multi-factor models or downside risk measures (VaR, CVaR, Omega ratios, etc.) to answer one of the key open questions: whether cannabis assets exhibit similar risk-return dynamics to other sin stocks, a stigmatized yet capable of generating excess returns, or if cannabis represents a structurally disadvantaged sector that underperforms over the long term. To help answer this gap, the following research uses a systematic approach to analyzing cannabis equities over an entire decade, against U.S. and Global benchmarks, using advanced performance and risk measures.
3. Data
Data on monthly returns of cannabis stocks is sourced from Morningstar Direct. The sample begins with 69 publicly traded firms in January 2015 and expands to 134 by December 2024. We analyze returns across this full horizon to capture both the industry’s long-run trajectory and its resilience during episodes of market stress. March 2020 marks a natural breakpoint: the onset of COVID-19 and subsequent global market dislocations. This period brought liquidity shortages, sharp investor risk re-pricing, heightened volatility in small-cap and unprofitable firms, and renewed regulatory uncertainty—factors that disproportionately affected cannabis equities relative to more established sectors.
Accordingly, we split the sample into pre- and post-March 2020 subperiods. This allows us to test whether underperformance is a persistent structural feature of cannabis stocks or whether it intensifies during crisis and regulatory stress regimes. Such a design follows established empirical practice in asset pricing research, where exogenous shocks are used to identify differences in risk-adjusted performance across regimes. By explicitly accounting for this breakpoint, our analysis strengthens causal inference and avoids conflating normal industry dynamics with extraordinary crisis effects.
Table 1 summarizes the performance of cannabis stocks compared to broader U.S. and global equity markets. From January 2015 to December 2024, an evenly weighted cannabis equities portfolio generated an average monthly return of −0.40 percent. The FTSE All World Ex U.S. Index produced a return of 0.29 percent while the Russell 3000 Index achieved an average positive return of 0.95 percent. The cannabis equities exhibited long-term underperformance relative to benchmarks across multiple timeframes.

Table 1.
Summary statistics of monthly rates of returns.
From January 2020 to December 2024, the post-COVID-19 era revealed a significant difference in performance. The Russell 3000 Index advanced 1.29 percent and the FTSE All World Ex U.S. Index gained 0.47 percent, but cannabis stocks recorded an average monthly loss of 0.87 percent during this timeframe. The financial outcomes of these developments failed to provide benefits to investors despite increasing public interest in the sector and regulatory support throughout the pandemic.
The ratio of return per unit of risk underscores the disappointing performance of cannabis stocks. Throughout the entire study period, cannabis stocks experienced a negative return per unit of risk at −0.02, which indicated investors assumed significant risk without receiving any financial returns. The indicator showed further deterioration, reaching −0.04 after the COVID-19 pandemic. The Russell 3000 Index and the FTSE All World Ex U.S. Index demonstrated positive risk-adjusted returns, which confirms that cannabis companies did not deliver returns to investors even though they exhibited extreme volatility.
The evidence demonstrates that cannabis equities did not generate value for investors when assessed in absolute terms alongside risk-adjusted metrics. The performance of these companies does not match the industry’s general confidence level, which makes one question the long-term investment case for cannabis equities.
4. Model and Methodology
This study evaluates the performance of cannabis equities relative to broad U.S. and global benchmarks using risk-adjusted performance metrics and multi-factor models. Monthly return data for 134 publicly listed cannabis companies from January 2015 to December 2024 are analyzed alongside the Russell 3000 Index and the FTSE All World ex-U.S. Index.
We compute the Sharpe, Sortino, and Omega ratios to evaluate risk-adjusted performance.
4.1. The Sharpe Ratio
The Sharpe ratio (Sharpe 1966) measures an investment’s excess return per unit of total volatility. The Sharpe ratio serves as a practical tool for investors and portfolio managers to assess whether the additional risk taken on an equity investment is adequately rewarded. By comparing returns to those of a risk-free asset, it helps determine whether a portfolio is delivering value beyond simply bearing risk. A positive ratio indicates that the investment achieves favorable risk-adjusted returns. Since it incorporates return volatility, the measure highlights the importance of diversification, where broader portfolio diversification typically translates into more stable returns and a stronger Sharpe ratio. The Sharpe ratio is given in Equation (1).
where
Rp = the portfolio returns
Rf = the risk-free rate
σP = standard deviation of the portfolio.
4.2. The Sortino Ratio
The Sortino ratio (Sortino and Van der Meer 1991) isolates downside volatility by measuring returns relative to the standard deviation of negative outcomes. Unlike the Sharpe ratio, which penalizes both upside and downside variation, the Sortino ratio concentrates exclusively on harmful volatility, making it particularly useful for evaluating high-risk portfolios. This helps investors better understand the frequency and extent of losses faced by investors. Our research shows notably low Sortino ratios for cannabis companies, which supports the finding that these investments expose investors to greater downside risk without providing equivalent upside potential. The Sortino Ratio is given in Equation (2).
where RP and Rf are described as above, and σd is the standard deviation of the portfolio’s negative returns.
4.3. The Omega Ratio
Keating and Shadwick’s (2002) Omega ratio evaluates asset performance by comparing the probability-weighted gains above a specified threshold with the probability-weighted losses below it. Unlike the Sharpe ratio, which relies solely on mean and variance, the Omega ratio incorporates the entire return distribution, capturing asymmetries and tail risks often overlooked by traditional measures. Equation (3) presents the formal expression for the Omega ratio.
With F(x) the cumulative distribution function (the probability that the return will ≤x), r is a user-chosen threshold and a, b the integration bounds. being investment intervals. This essentially represents the probability-weighted ratio of gains to losses around a chosen threshold.
4.4. Multi-Factor Model
Past research on sin stocks has mostly relied on basic models like CAPM or simple return analysis (Fabozzi et al. 2008; Hong and Kacperczyk 2009). Cannabis studies have often been narrow, event-driven, short-term, or anecdotal (Chen et al. 2021; Weisskopf 2020; Turley et al. 2024). While informative, these approaches overlook key questions about cannabis share price trends over the long term. To fill this gap, we use the Fama and French (2015) five-factor model with Carhart’s (1997) momentum factor added. This methodology enables us to ascertain if cannabis stocks provide excess returns that cannot be attributed only to systematic risk considerations, while also considering the influence of speculative trading patterns that are particularly prominent in this industry.
The inclusion of the five standard factors (market risk, size, or SMB, value or HML, profitability or RMW, and investment or CMA) is similarly based on the particularities of cannabis equities. A large number of companies in the sector are small-cap, unprofitable, and highly investment aggressive. Thus, SMB, RMW, and CMA exposures help to better explain return behavior. A further add-on is momentum (MOM) given the overwhelming influence of retail sentiment, legalization-driven trading, and hype-driven returns that cannabis stocks have been subject to. Ignoring momentum would likely result in the mis-estimation of alpha and a failure to account for a well-documented pricing anomaly.
Equation (4) shows the five-factor plus momentum model, which uses monthly returns.
where
is the percentage return for firm i in month t.
is the yield on the US Treasury bill for month t.
is the return on the CRSP value-weighted index for month t.
represents market risk and excess market return, reflecting the general risk of stock market investing.
(Small minus Big) factor captures the return difference between small-cap and large-cap stocks by subtracting the large-cap portfolio’s return from that of the small-cap portfolio. A positive SMB indicates small caps have outperformed large caps.
(High minus Low) factor measures the performance gap between value stocks (low price-to-book) and growth stocks (high price-to-book). It is calculated by subtracting the return of growth stocks from that of value stocks; a positive HML means value stocks outperformed growth stocks.
(Robust minus Weak) measures how much better profitable companies have performed than unprofitable ones. It is calculated as the return of profitable companies minus that of unprofitable companies. A positive RMW indicates that profitable firms outperformed their weaker counterparts.
(Conservative minus Aggressive) is a factor that measures the historical performance differential between companies with conservative (low investment) strategies and those with aggressive (high investment) strategies. It is calculated as the return of a portfolio composed of conservative firms minus the return of a portfolio composed of aggressive firms. A positive CMA value indicates that conservative companies have outperformed their aggressive counterparts.
(Momentum) measures the persistence of relative performance in an asset. It describes the observed pattern where assets with higher performance continue to rise, while those with lower performance tend to underperform.
εi,t = an error term.
Our use of the enhanced multi-factor model is thus both methodological and conceptual in nature. As reviewed in Section 2, existing literature has been inconclusive on whether cannabis is more akin to other sin stocks that have exhibited a stigma premium, or whether structural disadvantages predominate. We leverage this model to empirically evaluate whether cannabis equities can generate positive abnormal returns net of risk factors, or whether they exhibit persistently negative alphas, as we would expect given their weak fundamentals. The methodology therefore serves to operationalize the gap in the extant literature and give empirical grounds to the question of whether cannabis equities have a role in diversified portfolios.
4.5. Robustness Check
The literature on cannabis equities has so far relied heavily on static models and short time windows, which may obscure important dynamics in such a volatile and regulatory-sensitive sector (Chen et al. 2021; Weisskopf 2020). To ensure that our findings are not artifacts of model choice or sampling period, we conduct several robustness checks that extend beyond the unconditional multi-factor framework.
First, we assess the robustness of our findings by incorporating conditional alpha evaluations of cannabis equities into our analysis. We also compute Value at Risk (VaR) and Conditional Value at Risk (CVaR) or Expected Shortfall (ES) to reinforce our conclusions and verify their consistency across various methodological frameworks and scenarios.
These robustness checks reinforce the contribution of our study. The conditional models connect to the literature by acknowledging the time-varying nature of risk exposures in cannabis equities, while the downside risk measures extend the empirical framework to incorporate fat-tailed losses that traditional models overlook. This approach allows us to test whether cannabis equities’ underperformance is robust to alternative specifications and to provide investors with a fuller picture of the risks and inefficiencies in this sector.
4.5.1. Conditional Factor Models
Traditionally, investors have depended on established indicators such as the Sharpe ratio and Jensen’s (1968) alpha to assess risk-adjusted returns. While these metrics assume static risk exposures, they often fail to account for the evolving nature of financial markets, which may lead to misleading assessments by disregarding time-varying fluctuations in risk and risk premiums.
To address these shortcomings, Ferson and Schadt (1996) developed a conditional performance evaluation framework that integrates time-varying information into analysis. Their model extends Jensen’s (1968) alpha by including a vector of lagged public information variables, thus enabling more accurate estimation of conditional alpha. This modification replaces unconditional betas with conditional, time-dependent betas and expected returns, offering a dynamic perspective on fund performance. Their findings indicate that augmenting performance models with lagged interest rates and dividend yields enhances predictive accuracy and equips investors with better insights into future market dynamics, due to the established correlation between these variables and stock returns.
Ferson and Schadt (1996) specifically proposed a conditional methodology utilizing widely recognized financial indicators: the three-month Treasury bill rate (TR3M), the term structure slope (SLOPE)—measured as the yield differential between 30-year Treasury bonds and three-month Treasury bills—the corporate bond market quality spread (QS) derived from the yield spread between Moody’s BAA- and AAA-rated corporate bonds, and the S&P 500 Index dividend yield. By applying a one-month lag to these variables, researchers are able to more effectively capture temporal changes, ultimately enhancing the robustness of performance evaluations.
The following equation presents the resulting conditional models, where Zj,t−1 represents the demeaned value of the unconditional elements:
4.5.2. Analysis of the Downside Risk of Monthly Returns
Value at Risk (VaR) and Expected Shortfall (ES) are widely recognized risk measures employed in finance to evaluate potential portfolio losses during unfavorable market conditions. Both metrics provide critical insights into the downside risks associated with cannabis stocks, enabling a thorough assessment of the resilience of cannabis-related equities.
VaR is a quantitative tool that estimates the maximum potential loss a portfolio may incur within a specified time frame at a defined confidence level. For cannabis stocks, VaR allows for quantification of potential downside risk related to underlying investments. A lower VaR indicates reduced exposure to significant losses, while a higher VaR denotes increased vulnerability under adverse market conditions. By comparing the VaR across different investment choices, investors can assess various risk management strategies and evaluate performance stability, thereby facilitating more informed decisions regarding cannabis equities amid volatility.
Expected Shortfall (ES), also known as Conditional VaR (CVaR), extends upon the concept of VaR by calculating the average magnitude of losses that exceed the VaR threshold. ES captures the mean expected loss in scenarios where losses surpass the established VaR limit. Like VaR, ES supports investors in evaluating the potential downside risk of these portfolios. An investment exhibiting a lower ES suggests that losses beyond the VaR threshold tend to be less severe on average, highlighting distinctions in risk mitigation and overall performance characteristics.
5. Empirical Analysis
We begin our investigation into the risk-adjusted performance of Cannabis stocks by first examining the correlation of their monthly returns with the broader equity markets.
5.1. Correlation Analysis
Table 2 shows the relationship of monthly returns between two main benchmark indices—the Russell 3000 Index and the FTSE All World Ex U.S. Index—along with an equally weighted portfolio of cannabis companies. The study spans two separate periods: the post-COVID-19 era from March 2020 to December 2024 and January 2015 to December 2024.
Table 2.
Correlation among monthly returns.
With a correlation between cannabis equities and the Russell 3000 Index of 0.52 for the whole data period, the co-movement with the larger U.S. equity market was indicated as somewhat modest. At 0.44, the correlation with the FTSE All World Ex U.S. Index was somewhat less, suggesting less alignment with global markets outside the United States. These results imply that while cannabis stocks show some correlation with general market movements, they also maintain some degree of independence, most likely because of industry-specific variables and legislative changes.
These correlations remained relatively steady in the post-COVID-19 era. For example, the correlation with the Russell 3000 Index was 0.51, only slightly lower than before. Nevertheless, the correlation with the FTSE All World Ex U.S. Index rose somewhat to 0.45. This consistency suggests that, even with increasing volatility and uncertainty during this period, the pandemic did not fundamentally change the link between cannabis equities and more general equity markets.
Although cannabis equities exhibit only modest correlations with U.S. and global markets, their weak performance in Table 1 indicates that they offer little value as a diversification tool.
5.2. Analysis of Risk-Adjusted Returns
The analysis in Table 3 assesses cannabis stocks’ risk-adjusted returns compared to both the Russell 3000 Index and the FTSE All World Ex U.S. Index using Sharpe, Sortino, and Omega ratios. The chosen measurements enable investors to gain deeper insights into the risk and reward relationship of their investments.
Table 3.
Risk-adjusted performance based on monthly returns.
The results show that cannabis equities delivered persistently unfavorable risk-adjusted outcomes between January 2015 and December 2024. The equally weighted cannabis portfolio produced negative Sharpe and Sortino ratios across both the full and the 2020–2024 subperiod, with values deteriorating further in the later years. More importantly, the Omega ratios for cannabis stocks remained below one in both periods, indicating that losses outweighed gains across plausible thresholds and underscoring the asymmetry in the sector’s return distribution. In contrast, the Russell 3000 and the FTSE All World ex U.S. Index also posted negative Sharpe and Sortino ratios, yet both indices reported Omega ratios above one, suggesting a considerably stronger balance of upside relative to downside.
Furthermore, the study finds that the post-2020 environment accentuated the weaknesses of cannabis stocks, with Omega falling from 0.94 to 0.89 as regulatory setbacks, financing constraints, and sentiment reversals dampened positive payoffs while leaving downside risk intact. In addition, while the Sharpe and Sortino ratios for the Russell 3000 and the FTSE ex U.S. index deteriorated in the shorter period (January 2020 to December 2024), their Omega ratios improved, signaling return distributions characterized by frequent small gains alongside heightened volatility. This divergence highlights the limitations of variance-based measures when evaluating sectors with skewed return distributions and underscores the importance of considering asymmetric measures such as Omega.
These results imply that unconditional exposure to cannabis stocks has served to erode portfolio efficiency rather than improve it. The fact that Omega has remained stubbornly below one for a long-only portfolio with an allocation to cannabis, even when position sizes are small, suggests that any long position in the sector reduces gain–loss efficiency. By contrast, the Russell 3000 has provided a much more attractive gain–loss profile. In comparison, the FTSE ex-U.S. index offered only modest improvement over cannabis stocks. This reinforces the idea that broad U.S. equities are the best choice for a core allocation and that ex-U.S. diversification offers relatively weak downside protection.
This is true for all market participants but is even more starkly true for individual investors. Cannabis stocks have not provided positive odds; losers exceeded winners, and the returns did not adequately compensate for the risk taken. Exposure to US equities broadly provided a much better win–loss ratio even at times of heightened volatility. Market participants attracted to the narrative of growth may wish to consider staged entry, tight stop-losses, or diversified vehicles with risk control.
These findings also support a broader understanding of thematic investing. The poor performance of cannabis stocks highlights a sector that may never reach risk-adjusted efficiency due to the regulations and sentiment that define it, even as investor interest peaks.
We further incorporate the 12-month rolling Sharpe ratio to provide a time-varying perspective on the risk-adjusted performance of cannabis stocks. This approach allows us to trace performance cycles over time, capturing fluctuations around key events such as the COVID-19 market crash and major legalization announcements. By visualizing how Sharpe ratios evolved month by month, we assess whether cannabis stocks ever delivered periods of outperformance and how quickly those gains, if any, dissipated. Figure 1 presents the 12-month rolling Sharpe ratio for an equally weighted portfolio of cannabis stocks.
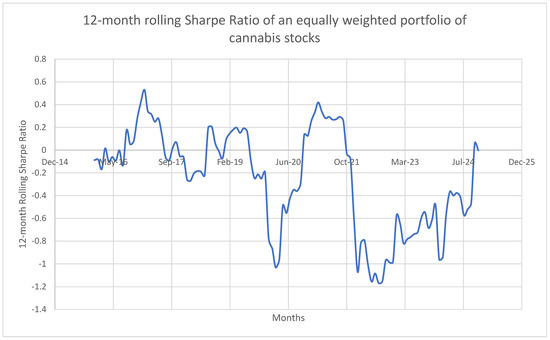
Figure 1.
This figure shows that cannabis stocks rarely sustained positive risk-adjusted returns. Brief spikes were followed by sharp declines, especially post-COVID-19, with prolonged periods of negative Sharpe ratios. Their volatility makes them unreliable for long-term portfolios. The data show consistent poor performance and heightened volatility, especially during market stress or regulatory uncertainty.
Given the uncertainty surrounding regulation and the rapidly evolving nature of the cannabis industry, cannabis stocks may exhibit non-normal return distributions characterized by skewness and fat tails. To address this, we compute the adjusted Sharpe ratio, which penalizes such deviations from normality.
As shown in Table 4, cannabis stocks continue to deliver negative adjusted Sharpe ratios over both the full sample (−0.11) and the post-COVID-19 period (−0.15). This reinforces the view that their poor risk-adjusted performance is not an artifact of assuming normality. However, when compared to the Russell 3000 (−0.17) and the FTSE All World ex-U.S. (−0.32), cannabis stocks appear less negative. Although cannabis shows less negative adjusted Sharpe ratios than the benchmarks, this single measure does not overturn the broader evidence of underperformance from the Sharpe, Sortino, Omega, alpha, and tail-risk analyses.
Table 4.
Adjusted Sharpe ratio based on monthly returns.
5.3. Empirical Analysis of the Multi-Factor Model
Table 5 shows the results using the Fama–French five-factor model reinforced with a momentum component, the net monthly alpha estimates for an evenly weighted portfolio of cannabis equities. Based on monthly returns from January 2015 to December 2024, these findings provide an important new perspective on whether cannabis companies yield returns beyond what can be justified by standard risk criteria.
Table 5.
Net Monthly Alpha of Equally Weighted Cannabis Portfolio.
Over both the full sample and the post-COVID-19 era, the results reveal consistently negative and statistically significant alphas. With a negative alpha of −2.82 percent every month from January 2015 to December 2024, the portfolio significantly underperformed the benchmark at the 5 percent level of significance. During the post-pandemic period (January 2020 to December 2024), the alpha decreased further to −4.19 percent, which is statistically significant at the 10 percent level. These negative alphas imply that cannabis equities routinely missed expectations even after accounting for market, size, value, profitability, investing characteristics, and momentum.
Analyzing the factor loadings offers yet another perspective. With coefficients of 1.63 and 1.73 across the two periods, the portfolio showed a substantial and statistically significant positive exposure to the market factor (Mkt-RF), suggesting that cannabis equities tend to move more aggressively than the wider market. Often linked with more risk and volatility, the positive and substantial SMB (Small Minus Big) loadings suggest a strong lean toward smaller companies.
In the post-COVID era, the portfolio had a notable negative exposure to the RMW (profitability) component and the momentum (MOM) factor. This implies that cannabis equities usually show weak momentum characteristics and are linked with low profitability—both of which help to explain their negative alpha. The non-statistically significant HML (value) and CMA (investment) components suggest that value and investment patterns hardly explain much of the performance variance in this portfolio.
All things considered, the consistent and notable negative alphas support the conclusion that, even with known asset pricing considerations, cannabis stocks have not given investors value. From an investing standpoint, their inclination to show low profitability, weak growth, and high susceptibility to market swings further reduces their attractiveness.
5.4. Empirical Analysis of Cannabis Stocks Versus Benchmark Indices Alpha
Table 6 presents an extended analysis of net monthly alphas through direct comparisons between cannabis stocks and the Russell 3000 Index as well as the FTSE All World Ex U.S. Index. Using the Fama–French multi-factor model with momentum, our analysis shows that cannabis stocks have fallen behind both U.S. and global equity markets throughout the extended period and particularly after COVID-19.
Table 6.
Net monthly alphas for Cannabis stocks and benchmark indexes based on Fama–French multi-factor plus momentum model.
From January 2015 to December 2024, cannabis stocks demonstrated a significant monthly negative alpha of −2.82 percent, signifying marked underperformance even after accounting for standard risk factors. The Russell 3000 Index and the FTSE All World Ex U.S. Index both showed negative alphas of −1.81 percent and −2.17 percent, respectively, which reached statistical significance at the 1 percent level. While the benchmark indices also performed poorly, cannabis stocks showed a larger negative alpha, indicating they were less able to generate excess returns.
From January 2020 to December 2024, cannabis stocks showed a monthly alpha of −4.19%, indicating they consistently lagged behind model forecasts in the post-COVID-19 period. The Russell 3000 Index and FTSE All World Ex U.S. Index showed negative alphas of −2.59% and −3.09%, respectively, while cannabis stocks performed even worse during this period. The global equity markets struggled after the pandemic, but cannabis stocks encountered even greater challenges.
The data presented in Table 6 shows undeniable proof that cannabis stocks produced no value for investors, both absolutely and when compared to broad market benchmarks. The stock performance suffered during normal market conditions and worsened when market uncertainty increased, which brought into question their strategic investment viability.
5.5. Empirical Analysis of Conditional Multi-Factor Model
Table 7 shows the net monthly alphas for an evenly weighted portfolio of cannabis companies based on the conditional Fama–French five-factor plus momentum model. This approach provides a more dynamic view of performance by considering shifting market circumstances and changing factor exposures over time.
Table 7.
Conditional Net Monthly Alphas for Equally Weighted Cannabis Portfolio.
The outcomes for cannabis stocks remain depressing, even after using this conditional approach. The alpha was −2.75 percent per month during the period from January 2015 to December 2024, and this was statistically significant at the 10 percent level. This indicates that, despite accounting for time-varying factor sensitivities, cannabis stocks frequently exhibited returns below those projected by the model.
From January 2020 to December 2024, the performance decline became more apparent during the post-COVID-19 period. The monthly alpha of the portfolio dropped even further to −4.62 percent during this period, also statistically significant at the 10 percent level. This implies that during the very erratic and unpredictable market environment after the pandemic, cannabis equities were especially unable to provide returns in accordance with risk-adjusted expectations.
The conditional model essentially validates what prior studies have found: cannabis equities consistently underperform, independent of market circumstances or model tweaks. Their lack of positive alpha, especially in light of changes in the financial and economic surroundings, supports the conclusion that they provide little value to investors looking for either absolute or risk-adjusted returns.
5.6. Analysis of Downside Risk
Table 8 evaluates the downside risk of cannabis stocks using the 95 percent Value-at-Risk (VaR) and Conditional Value at Risk (CVaR) or Expected Shortfall measurements. These measures offer investors a transparent view of possible financial losses during market turmoil periods. The study evaluates cannabis stocks against the Russell 3000 Index and the FTSE All World Ex U.S. Index through monthly return data spanning January 2015 to December 2024.
Table 8.
95% Value-at-Risk and Conditional Value at Risk for Equally Weighted Portfolio of Cannabis Stocks, Russell 3000, and FTSE All-World ex U.S. (Monthly Returns, Jan 2015–Dec 2024).
At the 95 percent confidence level, cannabis stocks exhibit a Value at Risk (VaR) of −21.52 percent, indicating that in the worst five percent of return outcomes, investors face losses of at least 21.52 percent. The Russell 3000 Index recorded a VaR of −7.50 percent while the FTSE All World Ex U.S. Index stood at −6.94 percent, both of which represent considerably lower risk figures when compared. The striking disparity serves to underscore the severe downside risks faced by investors in cannabis stocks.
The Conditional Value at Risk shows an even more serious financial scenario. The CVaR value for cannabis stocks stands at −26.07 percent, which demonstrates that average losses intensify beyond 26 percent whenever they surpass the VaR threshold. The Russell 3000 Index and the FTSE All World Ex U.S. Index show expected shortfalls of −9.78 percent and −9.69 percent, respectively. Investors face much higher potential losses during market downturns when they invest in cannabis stocks.
The combined risk metrics demonstrate that cannabis stocks yield lower returns and expose investors to substantially greater downside risks. Risk-averse investors or those worried about portfolio drawdowns during market stress should avoid cannabis stocks because they can result in dramatically higher potential losses and make these stocks very unattractive for diversified portfolios.
5.7. Discussion of Findings
In contrast to the well-documented performance of traditional sin stocks, our results do not align with conventional wisdom. Fabozzi et al. (2008) and Hong and Kacperczyk (2009) found that tobacco and alcohol companies earned excess returns due to exclusionary pressures (a “shunned stock premium”). Salaber (2007) found that sin stocks in Europe outperformed in more litigious environments, and Blitz and Fabozzi (2017) and Rezaeian and Racine (2024) more recently questioned whether the sin stock anomaly actually reflects unpriced risk versus true stigma. By contrast, the negative alphas in Table 5, Table 6 and Table 7 indicate that cannabis stocks did not earn such a premium. The difference appears to be structural. Unlike tobacco and alcohol, cannabis stocks suffer from fragmented and generally stigmatizing regulation (medical use only), exclusion from federally backed financial institutions, and poor profitability in aggregate.
Our results also contrast with short-term, event-driven studies. Chen et al. (2021) and Weisskopf (2020) found temporary price increases following cannabis legalization announcements. Turley et al. (2024) also showed that cannabis could outperform with federal legalization, and Papadamou et al. (2022) and Afik et al. (2022) found positive returns and liquidity to be driven by public sentiment and government regulation events. However, our longer investment horizon (January 2015–December 2024) and robustness tests that include conditional factor models (Table 7) and rolling Sharpe ratios (Figure 1) demonstrate that any such effects were temporary. Although Papadamou and Afik highlight attention- and policy-driven factors, our results in Table 5, Table 6 and Table 7 suggest that these phenomena quickly dissipate and are associated with persistent negative alphas in both unconditional and conditional factor models.
These results also stand in contrast to the resilience often associated with ESG-focused investments. Zerbib (2022) and Horn (2023) showed that firms with better ESG ratings had lower idiosyncratic risk, and Meehan and Corbet (2024) demonstrated that socially responsible investment portfolios are more resilient than sin stocks in the COVID-19 pandemic. By comparison, our results in Table 8 indicate that cannabis stocks carry extreme downside risks even during periods of market stress. These results suggest that cannabis does not have the same resilience as ESG-oriented assets and may instead exacerbate portfolio vulnerability during market downturns.
Table 2 shows that cannabis stocks have modest correlations with U.S. and global benchmarks, with coefficients around 0.5. Weisskopf (2020) interpreted such low correlations as diversification potential. However, with consistently negative alphas reported in Table 5 and Table 6 and generally unfavorable Omega ratios reported in Table 3, cannabis equities’ overall negative alpha in Table 5 and Table 7, respectively, underperform relative to factor benchmarks. Correlation is not enough to diversify if an asset class systematically destroys value. This difference in our framework’s broader focus on alphas versus typical diversification metrics underlies this contrast.
Taken together, these results suggest that cannabis equities behave differently than traditional sin stocks, which have frequently produced excess returns despite stigmatization. Instead, cannabis stocks reduce portfolio efficiency, increase downside risk, and do not provide meaningful diversification benefits. The implication for investors is that cannabis exposure may not only fail to act as a hedge, but it may instead work as a drag on overall performance. The implication for policymakers is that the lack of a stigma premium reveals challenges with attracting longer-term capital in the current regulatory environment.
Cannabis equities do not share characteristics of traditional sin stocks and should not be grouped with that asset class. They form a structurally disadvantaged segment of more broadly stigmatized assets that are characterized by persistent underperformance, high downside risk, and a general lack of robustness to regulatory and financial constraints.
6. Summary and Conclusions
This study offers a comprehensive examination of cannabis equities within the broader context of sin stock research. Drawing on ten years of data and employing a combination of risk-adjusted performance measures, multi-factor asset-pricing models, and downside risk metrics, we find that cannabis stocks consistently underperform both U.S. and global benchmarks. Their Sharpe, Sortino, and Omega ratios remain persistently negative, and even after controlling for systematic risk factors through the Fama–French five-factor model with momentum, cannabis equities continue to generate significantly negative alphas. These findings are reinforced by conditional model estimates and by evidence of extreme downside exposure, as VaR and CVaR are substantially higher for cannabis portfolios than for benchmark indices. Taken together, the results show that, unlike traditional sin stocks that often deliver a stigma premium, cannabis equities offer little compensation for their risk and instead expose investors to volatility and disproportionate losses.
While the evidence about the poor performance of cannabis stocks as a portfolio is strong, the paper has several caveats. First, our analysis is conducted solely on market-based return data and does not control for the fundamental characteristics of the underlying firms, such as profitability, leverage, or liquidity, that are also known to be explanatory for the poor performance of cannabis stocks. Second, our models do not control for investor sentiment, retail trading activity, or media attention, all of which are likely to be important behavioral drivers of the cannabis market given the degree of speculation and hype. Third, our model controls for conditional effects but does not explicitly model macroeconomic factors like inflation, interest rate changes, or credit market conditions, all of which may be interacting with policy uncertainty to affect valuations. Finally, our study is restricted to publicly traded cannabis companies in North America and to traditional financial risk–return metrics; it does not take a global, private-market, and ESG perspective of the industry. These caveats should be considered and our findings treated as robust for the scope of the applied model but indicative of an underlying more complex and multi-faceted reality that is best explored in future research.
In that spirit, future research could add firm-level fundamentals (profitability, leverage, liquidity, corporate governance, etc.) to disentangle whether underperformance is more related to structural or firm-specific factors. It could also include sentiment indicators (retail trading intensity, media attention, social media sentiment) to account for behavioral biases and hype cycles in the variation in cannabis returns. Future studies could expand the set of control variables to include macroeconomic factors (inflation, interest rate changes, credit spreads, etc.) to better understand the joint interactions between financial conditions and policy shifts on sector returns. Comparative analyses between different jurisdictions with different regulatory frameworks (Canada vs. United States vs. Europe) may also help to better understand the extent to which policy divergence is reflected in risk and return characteristics as could scenario analyses of a potential federal rescheduling in the United States. Finally, future research could look beyond the traditional set of financial risk–return characteristics and consider ESG factors, cross-border investment flows and institutional constraints on the cannabis sector as a new asset class.
The performance of cannabis stocks themselves, however, is notable and their alphas and implied underperformance demand action, both by portfolio managers and regulators. On the one hand, our results should make investors wary of the diversification benefits of the cannabis sector, and, if results are indicative of a broader set of securities (not just those analyzed in this paper), caution should be advised toward direct equity positions or other over-the-counter (OTC) vehicles for adding cannabis exposure to portfolios. While they do exhibit low correlations with both U.S. and international equity indices, this stand-alone risk has not translated into hedging characteristics or positive risk-adjusted returns for the sector as a whole. Cannabis portfolios appear to reduce portfolio efficiency and increase downside risk given their consistently low Omega ratios and the extremity of their Value at Risk and Conditional Value at Risk metrics. In that light, we counsel against long-only positions in cannabis equities in traditional portfolios. If some degree of exposure is desired, then it should be in instruments that are more heavily risk-managed, such as ETFs with built-in hedging strategies or stringent position limits. On the other hand, regulators and policymakers may find our results of particular interest: the pervasive negative alphas and low profitability, while not an intended policy outcome, could be indicative of the structural disadvantages and barriers faced by the cannabis industry and its enduring struggle to attract long-term and institutional investors due to its unfriendly financial and operating environment.
Overall, the evidence indicates that cannabis should not simply be grouped with traditional sin stocks; rather, it represents a distinct category of contentious assets whose persistent underperformance reflects structural and regulatory disadvantages unique to the industry.
Author Contributions
Conceptualization, D.K.M.; Methodology, D.K.M. and S.G.; Validation, D.K.M. and S.G.; Formal analysis, D.K.M.; Investigation, D.K.M. and S.G.; Data curation, D.K.M. and S.G.; Writing—original draft, D.K.M.; Writing—review & editing, D.K.M. and S.G.; Visualization, D.K.M. All authors have read and agreed to the published version of the manuscript.
Funding
This research received no external funding.
Data Availability Statement
The original contributions presented in this study are included in the article. Further inquiries can be directed to the corresponding author.
Conflicts of Interest
The authors declare no conflict of interest.
Note
| 1 | https://finance.yahoo.com/news/united-states-cannabis-market-report-122800110.html (accessed on 21 August 2025). |
References
- Afik, Zvika, Tehila R. Cohen, and Yaron Lahav. 2022. Getting high on cannabis stock returns: An event study. Finance Research Letters 46: 102226. [Google Scholar] [CrossRef]
- Alessandrini, Fabio, and Eric Jondeau. 2019. ESG Investing: From Sin Stocks to Smart Beta. Geneva: Swiss Finance Institute. [Google Scholar] [CrossRef]
- Blitz, David, and Frank J. Fabozzi. 2017. Sin Stocks Revisited: Resolving the Sin Stock Anomaly. Journal of Portfolio Management 44: 105–11. [Google Scholar]
- Blitz, David, and Laurens Swinkels. 2023. Does Excluding Sin Stocks Cost Performance? Journal of Sustainable Finance & Investment 13: 1693–710. [Google Scholar] [CrossRef]
- Carhart, Mark. 1997. On Persistence in Mutual Fund Performance. Journal of Finance 52: 57–82. [Google Scholar] [CrossRef]
- Carliner, Hannah, Qiana L. Brown, Aaron L. Sarvet, and Deborah S. Hasin. 2017. Cannabis Use, Attitudes, and Legal Status in the U.S.: A Review. Preventive Medicine 104: 13–23. [Google Scholar] [CrossRef]
- Chen, Feilong, Sungchul Choi, Chengbo Fu, and Joshua Nycholat. 2021. Too High to Get It Right: The Effect of Cannabis Legalization on the Performance of Cannabis-Related Stocks. Economic Analysis and Policy 72: 715–34. [Google Scholar] [CrossRef]
- Conti-Brown, Peter. 2018. The Fed Wants to Veto State Banking Authorities. But Is That Legal? Washington, DC: Brookings Institution. Available online: https://www.brookings.edu/articles/the-fed-wants-to-veto-state-banking-authorities-but-is-that-legal/ (accessed on 29 September 2025).
- Cox, Robert A. K., and Qiang Cheng. 2021. The Performance of U.S. Marijuana Stocks. Journal of Accounting and Finance 21: 42–49. [Google Scholar] [CrossRef]
- Fabozzi, Frank J., and Davinder Malhotra. 2025. Rolling in the Green? A Closer Look at Cannabis ETFs’ Market Munchies. Journal of Asset Management 26: 239–54. [Google Scholar] [CrossRef]
- Fabozzi, Frank J., Kwan-Chen Ma, and Becky J. Oliphant. 2008. Sin Stock Returns. Journal of Portfolio Management 35: 82–94. [Google Scholar] [CrossRef]
- Fama, Eugene, and Kenneth French. 2015. A Five-Factor Asset Pricing Model. Journal of Financial Economics 116: 1–22. [Google Scholar] [CrossRef]
- Ferson, Wayne E., and Rudi Schadt. 1996. Measuring Fund Strategy and Performance in Changing Economic Conditions. Journal of Finance 51: 425–62. [Google Scholar] [CrossRef]
- Goodwin, Barry K. 2024. Integration of the U.S. Cannabis Market. American Journal of Agricultural Economics 107: 440–64. [Google Scholar] [CrossRef]
- Hamdan, Mohammed. 2024. Wealth and Familiarity Bias: Sin Stocks Investment in Europe. Journal of Asset Management 25: 714–25. [Google Scholar] [CrossRef]
- Hong, Harrison, and Marcin Kacperczyk. 2009. The Price of Sin: The Effects of Social Norms on Markets. Journal of Financial Economics 93: 15–36. [Google Scholar] [CrossRef]
- Horn, Matthias. 2023. The Influence of ESG Ratings on Idiosyncratic Stock Risk: The Unrated, the Good, the Bad, and the Sinners. Schmalenbach Journal of Business Research 75: 415–42. [Google Scholar] [CrossRef]
- Humphrey, Jacquelyn E., and Darren T. Tan. 2013. Does It Really Hurt to Be Responsible? Journal of Business Ethics 122: 375–86. [Google Scholar] [CrossRef]
- Jensen, Michael C. 1968. The Performance of Mutual Funds in the Period 1945–1964. Journal of Finance 23: 389–416. [Google Scholar] [CrossRef]
- Keating, Con, and William F. Shadwick. 2002. A Universal Performance Measure. Journal of Performance Measurement 6: 59–84. [Google Scholar]
- Liston, Daniel P. 2016. Sin Stock Returns and Investor Sentiment. The Quarterly Review of Economics and Finance 59: 63–70. [Google Scholar] [CrossRef]
- Liston-Perez, Daniel, and Jorge P. Gutierrez. 2018. Dynamic Analysis of Sin Stocks and Investor Sentiment. International Journal of Managerial Finance 14: 558–73. [Google Scholar] [CrossRef]
- Meehan, David, and Shaen Corbet. 2024. Comparing the Resilience of Socially Responsible and Sin Investment during the COVID-19 Pandemic. Research in International Business and Finance 73: 102537. [Google Scholar] [CrossRef]
- Nurasiah, Isni, Nur Nugraha, Disman Disman, Rini D. Yuniarti, and Khairul A. Effendi. 2020. Analysis of Economic Growth, Oil Stocks, and Sin Stocks in the United States. International Journal of Energy Economics and Policy 10: 58–63. [Google Scholar] [CrossRef]
- Papadamou, Stephanos, Apostolos Koulis, Christos Kyriakopoulos, and Athanasios P. Fassas. 2022. Cannabis Stocks Returns: The Role of Liquidity and Investors’ Attention via Google Metrics. International Journal of Financial Studies 10: 7. [Google Scholar] [CrossRef]
- Parker, Karen A., Attilio Di Mattia, Fatima Shaik, Juan Carlos Cerón Ortega, and Robert Whittle. 2019. Risk Management within the Cannabis Industry: Building a Framework for the Cannabis Industry. Financial Management & Insurance International 28: 3–55. [Google Scholar] [CrossRef]
- Rezaeian, Amir, and Michel Racine. 2024. The Risk of SIN or Socially Irresponsible Stocks. Review of Quantitative Finance and Accounting 62: 755–98. [Google Scholar] [CrossRef]
- Sagbakken, Siri Tronslien, and Dan Zhang. 2022. European sin stocks. Journal of Asset Management 23: 1–18. [Google Scholar] [CrossRef]
- Salaber, Julie. 2007. The Determinants of Sin Stock Returns: Evidence on the European Market. Working Paper. Paris: Paris-Dauphine University, November. [Google Scholar]
- Sharpe, William F. 1966. Capital Asset Prices: A Theory of Market Equilibrium under Conditions of Risk. Journal of Finance 19: 425–42. [Google Scholar] [CrossRef]
- Sortino, Frank A., and Robert Van Der Meer. 1991. Downside Risk. Journal of Portfolio Management 17: 27–31. [Google Scholar] [CrossRef]
- Turley, Paige, Weishen Wang, and Frank Hefner. 2024. Stock Performance of the Cannabis Industry Compared to Other Sin Industries. The Journal of Beta Investment Strategies 15: 103–15. [Google Scholar] [CrossRef]
- Weisskopf, Jean-Philippe. 2020. Investing in Cannabis: Is the Grass Greener for Investors? Lausanne: EHL Hospitality Insights. Available online: https://hospitalityinsights.ehl.edu/investing-in-cannabis (accessed on 29 September 2025).
- Zerbib, Olivier David. 2022. A Sustainable Capital Asset Pricing Model (S-CAPM): Evidence from Environmental Integration and Sin Stock Exclusion. Review of Finance 26: 1345–88. [Google Scholar] [CrossRef]

Disclaimer/Publisher’s Note: The statements, opinions and data contained in all publications are solely those of the individual author(s) and contributor(s) and not of MDPI and/or the editor(s). MDPI and/or the editor(s) disclaim responsibility for any injury to people or property resulting from any ideas, methods, instructions or products referred to in the content. |
© 2025 by the authors. Licensee MDPI, Basel, Switzerland. This article is an open access article distributed under the terms and conditions of the Creative Commons Attribution (CC BY) license (https://creativecommons.org/licenses/by/4.0/).