1. Introduction
In the face of a rapidly changing market environment, companies face a variety of risks that can substantially affect their financial performance. Risk is defined as the likelihood of deviations from the organisation’s expected outcome, which can lead to both losses and gains. In the risk management process, it is important not only to measure the identified risks but also to identify the factors that affected them. Understanding and appropriately managing risk is critical to the financial and operational stability of any organisation (
Hull and Basu 2016). Risk-generating factors in any organisation can be classified into three main categories: macroeconomic factors, microeconomic factors and factors within an organisation. Macroeconomic factors are those that relate to general economic conditions in a country or region. These include exchange rate volatility, the level of interest rates, the level of inflation, fiscal and monetary policy and the general economic condition—all of which are very limited in the degree to which an organisation is affected. Changes in these factors can have a wide-ranging impact on entire sectors of the economy, and thus on the operations of individual companies (
Samuelson and Nordhaus 2009). Microeconomic factors relate to the specific market conditions in which a company operates. These include competition in the industry, changes in consumer preferences and changes in suppliers and the availability of raw materials—these typically relate to the various actors that surround the organisation. These factors have a direct impact on a company’s financial performance, market position and ability to respond to changes in the business environment (
Porter 1997). The greatest degree of influence any enterprise has is on internal factors. These include elements such as management, organisational structure, operational processes, organisational culture and human resources. Internal risk factors can arise from ineffective management, operational errors, staffing problems and inadequate control systems (
Hubbard 2020).
The purpose of this article is to examine the impact of two key global crises—the COVID-19 pandemic and the war in Ukraine—on the volatility of the financial performance of LPP SA, which operated internationally between 2013 and 2024. The volatility of selected financial parameters was analysed in the context of two anomalies that occurred in the downstream environment: the outbreak of the COVID-19 pandemic (Poland, March 2020) and the war in Ukraine (February 2022). In the apparel sector, especially for companies such as LPP SA, risk management has become a key element of business strategy. This analysis aims to understand how these crises have affected the financial stability of one of the largest apparel companies in Poland and Central and Eastern Europe.
The COVID-19 pandemic led to a sharp global economic contraction, with the IMF reporting a 3.5% decrease in global GDP in 2020. Consumer demand plummeted, supply chains were disrupted, and industries reliant on physical retail, such as apparel, faced substantial revenue losses (
IMF 2022). In contrast, the Ukraine war primarily affected energy prices and supply chains in Central and Eastern Europe, causing a regional economic downturn and increased uncertainty in sectors reliant on raw material imports (
Deng et al. 2022). These contrasting macroeconomic impacts provide a unique context for assessing the financial stability and strategic responses of firms like LPP SA.
The choice of LPP SA as a case study is motivated by its prominent role in the Central and Eastern European apparel market, its complex global supply chain and its diverse distribution channels, including both physical and e-commerce operations. These characteristics make LPP SA particularly susceptible to macroeconomic shocks, providing a valuable context for examining the effects of crises like the COVID-19 pandemic and the war in Ukraine. Furthermore, the apparel industry, being consumer-driven, is heavily affected by disruptions in demand and supply, making it a critical sector for studying the impacts of external economic shocks. The analysis of a single company, LPP SA, is justified by its role as a market leader in the CEE region, its complex supply chain structure, and its exposure to both the COVID-19 pandemic and the Ukraine war. These unique characteristics make LPP SA an ideal an example of adaptive crisis management case for understanding the effects of macroeconomic shocks on the apparel industry. While a broader analysis covering the entire sector would provide more generalised results, this case study allows for an in-depth examination of a market leader’s financial stability and strategic adaptability under crisis conditions. The insights from this analysis can serve as a reference for similar firms in the apparel industry facing comparable disruptions.
The choice of LPP SA as a case study allows for an in-depth exploration of crisis management and digital adaptation in a leading CEE firm, where economic and logistical conditions often differ markedly from those in Western economies. As an example of adaptive crisis management of emerging markets, LPP SA offers valuable insights into the apparel sector’s response to dual economic shocks, contributing to broader theories on corporate resilience and adaptive strategy. By analysing LPP SA’s strategic responses alongside industry benchmarks like the WIG and WIG-clothing indices, this study offers relevant, transferable insights that can aid similar firms in understanding and strengthening their crisis response frameworks.
To assess LPP SA as a proxy for the apparel sector, we conducted additional analyses using the Beta coefficient. By calculating Beta values relative to both the WIG index (covering the general market) and the WIG-clothing index (specifically for the apparel sector), we aimed to understand LPP SA’s responsiveness to broader market trends and sector-specific dynamics.
By examining these impacts, this article seeks to provide new insights into the effectiveness of LPP SA’s risk management strategies and their adaptability in the face of external economic shocks. The research gap that this article fills is due to the lack of comprehensive research on the impact of global crises on CEE apparel companies, especially in the context of two overlapping crises: the COVID-19 pandemic and the war in Ukraine.
Although there is a wealth of research on the impact of COVID-19 on financial markets and the apparel sector (e.g.,
He et al. 2020;
Zhang et al. 2020), there is a lack of detailed analysis that simultaneously considers the impact of the war in Ukraine on the sector’s financial performance. Furthermore, there is limited research focusing on risk management and financial volatility over the long term, encompassing both the pandemic and subsequent geopolitical events. This article aims to fill this gap by providing a detailed analysis of LPP SA’s financial volatility in response to these two crises and assessing the effectiveness of the company’s adaptation strategies. By doing so, the study can contribute to a better understanding of how global crises affect apparel companies in regions with specific economic and political conditions, such as Central and Eastern Europe. The study conducted is relevant in the context of increasing economic uncertainty and global disruptions that affect the financial stability of companies.
This study fills an important research gap by comparing the long-term impacts of the COVID-19 pandemic, which had a global effect on multiple sectors, with the more recent Ukraine war, which has had a localised but intense impact on specific regions and industries. By analysing these distinct crises, this research offers new insights into how firms can develop multi-dimensional risk management strategies to cope with different types of macroeconomic shocks.
2. Literature Review
The theoretical foundation for this study is based on the financial resilience framework, which emphasises the importance of maintaining operational stability during periods of economic disruption (
Hubbard 2020). Additionally, the concept of strategic flexibility, as defined by
Dunning (
1993), underlines the need for firms to rapidly adapt their resource allocation in response to changing external conditions. This study extends these theories by applying them to the apparel industry, where the effectiveness of supply chain diversification and digital transformation strategies is evaluated in the context of two distinct crises.
Research on the impact of global crises, such as the COVID-19 pandemic and the war in Ukraine, on corporate financial performance has gained prominence in recent years. The literature focuses on volatility analysis, risk management and corporate responses to external economic shocks. These analyses provide valuable insights into the financial stability of companies in the context of increasing global uncertainty. Financial risk management is crucial to ensure the stability of firms, especially in the context of global crises.
Knight (
1921) indicated that risk can be a source of both threats and opportunities, a view confirmed by many subsequent studies.
Risk-generating factors in any organisation can be classified into three main categories: macroeconomic, microeconomic, and organisational factors (
Hubbard 2020). However, alternative classifications exist depending on the industry and regulatory context (
Levine 2020;
Copeland 2014). Risk management categorisations can vary substantially depending on the context and the source. For example, financial regulatory authorities, such as the Basel Committee on Banking Supervision, use a categorisation based on credit, market and operational risk (
Basel Committee on Banking Supervision (BIS) 2019). In contrast, industry standards like ISO 31000 classify risks into strategic, operational, financial and compliance risks (
ISO (International Organization for Standardization) 2018). This study adopts a simplified categorisation framework focused on macroeconomic and microeconomic risks, which has been commonly used in academic research to analyse firm-level financial stability during economic crises (
Hubbard 2020;
Copeland 2014).
Research on the impact of the COVID-19 pandemic and the war in Ukraine on financial markets shows that both events had a substantial impact on the volatility of corporate financial performance (
He et al. 2020;
Deng et al. 2022). The COVID-19 pandemic caused global disruptions that substantially affected various sectors of the economy (
La Foresta and Dziadkiewicz 2020).
He et al. (
2020) analysed the impact of the pandemic on stock prices in China, finding that the apparel sector, like other consumer sectors, experienced substantial declines, reflecting increased financial volatility. Similar results were obtained by
Zhang et al. (
2020), who showed that the pandemic increased financial risk globally, which affected the stability of firms. COVID-19 caused a sharp increase in volatility in financial markets around the world, which was reflected in the share prices and financial ratios of many companies, including LPP SA.
Al-Awadhi et al. (
2020) and
Akhtaruzzaman et al. (
2021a,
2021b) analysed the impact of COVID-19 on stock market volatility worldwide. Their research shows that an increase in COVID-19 cases led to declines in stock market prices and an increase in volatility, particularly during the initial phase of the pandemic. This research highlights how markets reacted differently depending on the severity of the pandemic and the policies of countries in different parts of the world.
Brodeur et al. (
2021) examined how different levels of pandemic severity and the severity of governmental policies affected the volatility of financial markets. These studies reveal that markets in countries with higher COVID-19 incidence and more stringent governmental policies experienced higher volatility compared to others.
In contrast, the war in Ukraine, which also affected financial markets, had a more limited geographical and sectoral focus, which also affected corporate performance. The impact of the war in Ukraine on financial markets has been widely studied, with a focus on its impact on stock price volatility and destabilisation of emerging markets.
Deng et al. (
2022) found that the war in Ukraine had a substantial impact on share prices, particularly in the energy sector, due to sanctions imposed on Russia and uncertainty surrounding the continuity of commodity supplies.
Izzeldin et al. (
2023) and research published by the
International Monetary Fund (
2022) focus on the impact of the war in Ukraine on global financial markets. The results show that the conflict has caused substantial volatility in commodity and currency markets, especially in the energy sector. The war in Ukraine has also had a negative impact on the financial stability of companies in the region, which is particularly evident in the increased volatility in the financial performance of emerging market players.
Other studies, such as that by
Ferrara et al. (
2022), focused on macroeconomic risk. Ferrara et al. found that war contributed to increased volatility across Europe, affecting the financial performance of companies operating in the region. A review of the literature shows that volatility is a commonly used indicator of financial risk during crises, and its analysis can provide valuable information on the financial stability of companies in the face of global challenges. Risk management during crises has been the subject of many studies that emphasise the importance of advance preparation and operational flexibility.
Knight (
1921) introduced the concept of risk neutrality, which has been applied to modern crisis management models. In contrast,
Hull (
2022) and other contemporary work indicate that volatility analysis and the application of GARCH models can provide accurate tools for assessing financial risk in times of uncertainty. Research by
Karavias et al. (
2022) has shown that market responses to crises, such as COVID-19 and the war in Ukraine, can be strongly modulated by firms’ prior experience and risk management strategies. These studies suggest that companies that had previously invested in risk management strategies were better prepared for sudden changes in the market environment. The literature also provides evidence of the impact of macroeconomic factors, such as changes in interest rates, inflation or currency fluctuations, on the volatility of financial performance. Research by
Fama (
1970) and his later co-authored work indicates that financial markets react quickly to new information, which can lead to increased volatility, especially during periods of crises.
Sharif et al. (
2020) and
Liu et al. (
2022), on the other hand, analysed the long-term impact of the COVID-19 pandemic and compared it to other global crises, such as the war in Ukraine. The results suggest that, while both crises caused substantial disruption to the global economy, their impact on financial markets varied by sector and region. This research may provide valuable lessons for long-term risk management in the context of future crises that may occur in the global economy.
Based on the literature review, both the COVID-19 pandemic and the war in Ukraine had a substantial impact on the volatility of corporate financial performance. In the case of LPP SA, the analysis of these impacts can provide valuable lessons for risk management and adaptation strategies in the face of future crises. The literature review also shows that volatility is an effective indicator of financial risk, and its analysis can provide precise information on the financial stability of companies in times of economic uncertainty.
One of the first to identify risk as a source of both opportunities and threats was
Knight (
1921). This approach to risk is referred to as the neutral risk concept. One of the most commonly used ways to measure risk is through volatility analysis. Volatility, understood as a measure of the dispersion of performance around its mean, plays a key role in assessing investment and operational risk. Tools such as standard deviation or the coefficient of variation allow the degree of risk associated with a particular investment or business decision to be quantified (
Keller and Warrack 2004). Volatility analysis is widely used in various fields (
Wiśniewska 2008;
Sokołowska 2010a,
2010b,
2014,
2015). In finance, the volatility of stock, bond or commodity prices is a key indicator of investment risk. In operations management, volatility can refer to fluctuations in demand, production costs or on-time delivery and other financial parameters of an organisation.
In the risk management process, it is important not only to measure the risks identified, but also to identify the factors that were sources of risk (
Sokołowska 2016). Sources of risk are inherent in the functioning of both companies and financial markets. Risks can arise from a variety of factors, such as volatility in commodity prices, exchange rate fluctuations, changes in interest rates or political uncertainty. Understanding and appropriately managing risk is key to the financial and operational stability of any organisation (
Hull and Basu 2016). Risk-generating factors in any organisation can be classified into three main categories: macroeconomic factors, microeconomic factors and factors within an organisation. Macroeconomic factors are those that relate to general economic conditions in a country or region. These include exchange rate volatility, interest rates, inflation, fiscal and monetary policy and general economic conditions—all of which are very limited in the degree to which an organisation is affected. Changes in these factors can have a wide-ranging impact on entire sectors of the economy, and thus on the activities of individual companies (
Samuelson and Nordhaus 2009). Microeconomic factors relate to the specific market conditions in which a company operates. These include competition in the industry, changes in consumer preferences and changes in suppliers and the availability of raw materials––these typically relate to the various actors that surround the organisation. These factors have a direct impact on a company’s financial performance, market position and ability to respond to changes in the business environment (
Porter 1997), and the organisation has a substantially greater degree of influence over them. The greatest degree of influence that any enterprise has on internal factors relates to risks arising from the organisation of the enterprise itself. These include elements such as governance, organisational structure, operational processes, organisational culture and human resources. Internal risk factors can arise from ineffective management, operational errors, staffing problems and inadequate control systems.
This article estimates the impact of two factors from the macro-environment on the volatility of the financial performance of a clothing company in Poland, LPP SA, which is listed on the Warsaw Stock Exchange but has a reach across virtually all of Europe. The volatility of selected financial parameters was analysed in the context of two anomalies that occurred in the downstream environment: the outbreak of the COVID-19 pandemic (Poland, March 2020) and the war in Ukraine (February 2022).
2.1. Macro-Environmental Factors as a Source of Risk in Organisations—COVID-19 and the War in Ukraine
Macroeconomic factors are of key importance as a source of risk in business operations. Because some of the factors affecting an organisation are sometimes difficult to assign to a specific group, an extended PESTEL analysis of demographic, international and environmental factors is often used when analysing companies (
Johnson et al. 2020). The factors considered within this article undoubtedly belong to this group. These are the COVID-19 pandemic and the war in Ukraine—categorised as environmental and international factors. Factors from each of the groups presented can be a source of opportunities or threats for the organisation from the point of view of the organisation’s activities, so they can generate a variety of risks. Of the factors identified at the PESTEL analysis stage, some are primary in nature and others are secondary, resulting from linkages between factors in each group (
Scholes et al. 2002). Both the COVID-19 pandemic and the war in Ukraine are catalytic in nature, influencing subsequent groups of factors. In the case of the pandemic, this influence was on the following factors:
Political—the pandemic influenced government policy, including the introduction of lockdowns, travel restrictions and health and fiscal policies to support the economy and protect public health (
Hill and Jones 2007).
Economic—the pandemic has disrupted the global economy, affecting increased unemployment, falling demand, problems with supply chains and changes in monetary policy (
Mankiw et al. 2007).
Socio-cultural—as a result of the pandemic, consumer habits have changed, health awareness has increased and remote working has become more common. The pandemic affected lifestyles and social expectations (
Kotler and Keller 2006).
Technological—the accelerating adoption of digital technologies such as e-commerce, telemedicine and remote working tools is a clear result of the pandemic (
Porter 2008).
Ecological—the pandemic also had an impact on the environment, including a temporary reduction in pollution due to lockdowns and a decrease in industrial activity (
Grant 2016).
Legal—new regulations related to health, occupational safety and economic support policies have been introduced (
Johnson et al. 2008).
It should be recognised that the degree of influence of both factors has gradually increased over time since their initial appearance, which contributes to changes in the conditions in the environment of enterprises and influences the emergence of more and more new sources of risk, understood as a deviation from the expected state. Undoubtedly, changes in the environment are factors that alter the financial situation of companies operating in such conditions. The COVID-19 pandemic and the war in Ukraine demonstrate how complex and interrelated macroeconomic factors can be, affecting all aspects of companies’ operations. Understanding these linkages is key to effective risk management and strategic decision-making. In this context, measures of volatility become an invaluable tool to quantify the risks that have occurred in the past and thus better prepare for possible future challenges.
This study employs the coefficient of variation (CV) as the primary risk measure due to its ability to provide a standardised comparison of volatility across financial metrics. The CV has been used extensively in empirical studies to capture the impact of external shocks on firm performance, particularly in contexts requiring cross-variable comparison (
Newbold et al. 2013;
Beam 2006). The coefficient of variation (CV) is a widely used statistical measure to assess the relative dispersion of a dataset around its mean. Its ability to provide a unitless comparison of variability across different datasets makes it a preferred choice in financial risk analysis, particularly when dealing with metrics expressed in different units (
Newbold et al. 2013). The CV has been employed in various empirical studies to analyse volatility in financial performance, investment portfolios and operational efficiency. For instance,
Beam (
2006) applied the CV to analyse media industry volatility, demonstrating its robustness in comparing different financial parameters. Similarly,
McClave et al. (
2008) utilised the CV to study risk in manufacturing sectors, highlighting its utility in environments with fluctuating cost structures. In the context of crisis management, studies by
Montgomery et al. (
2015) and
Brealey et al. (
2014) employed the CV to capture the impact of external shocks on firm performance, emphasising its sensitivity to abrupt changes in market conditions. The CV is particularly advantageous in studies where comparability across different units of measurement is crucial, such as in the analysis of operational costs and revenue streams in multi-industry contexts (
Wild et al. 2007). However, it is not without limitations. One primary drawback is its dependence on the mean value—if the mean is close to zero, the CV can produce disproportionately high values, making interpretation difficult (
Levine 2020). Furthermore, the CV assumes a linear relationship between the standard deviation and the mean, which may not hold true for non-normal distributions (
Hubbard 2020). In addition to the CV, other risk measures such as standard deviation, GARCH models, and value-at-risk (VaR) are commonly used in financial risk analysis. Standard deviation, while straightforward, does not account for scale and is therefore less suitable for cross-comparisons between variables with different units. GARCH models, as proposed by
Hull (
2022), offer more sophisticated volatility estimates by incorporating time-varying aspects of risk. However, GARCH models require more complex data inputs and assumptions, making them less accessible for smaller datasets (
Karavias et al. 2022). Value-at-risk (VaR), as utilised by
Copeland et al. (
1991), provides a probabilistic measure of the maximum expected loss over a given time horizon. While effective for extreme risk scenarios, VaR is often criticised for ignoring potential losses beyond its threshold, thus underestimating tail risk (
Ross et al. 1999). Given these considerations, the CV was chosen in this study for its simplicity, ease of interpretation and ability to facilitate comparisons across different financial metrics, making it an appropriate tool for analysing the financial volatility of LPP SA in response to external economic shocks.
2.2. Research Methodology
This study adopts a single-company case study approach to analyse the financial stability and strategic responses of LPP SA during the COVID-19 pandemic and the Ukraine war. Case studies are particularly useful for detailed explorations of complex phenomena within specific contexts (
Yin 2018). Although this approach limits the generalisability of the findings to the entire apparel sector, LPP SA’s position as a market leader makes it a an example of adaptive crisis management case for understanding the broader impact of macroeconomic shocks on the industry. Future research should expand the scope to include multiple companies or the entire sector to validate these results. A review of the literature has shown that, during periods of global crises, such as the COVID-19 pandemic and the war in Ukraine, the volatility of corporate financial performance increases substantially, justifying the need for an in-depth analysis of this phenomenon. In the literature, particular attention has been given to the use of the coefficient of variation as a tool to compare the risk of different financial variables, which allows a precise assessment of the impact of external shocks on the financial stability of companies. For this reason, this study uses this coefficient to analyse the volatility of key financial parameters of LPP SA, in the context of two global crises that substantially affected the company’s operations. The literature review showed that volatility of key financial parameters, such as sales revenue, operating profit and net profit, is commonly used as an indicator to assess financial risk in times of crisis. Therefore, this study also focuses on these variables. In the literature, statistical tools such as the coefficient of variation are often used for risk analysis, which justifies its use in this study. Studies on the impact of crises on financial markets indicate the need for measures that allow for comparison of the volatility of different financial parameters, which is crucial in the analysis of the volatility of LPP SA’s financial performance. The literature indicates the relevance of a comparative analysis before and after the occurrence of a crisis in order to assess the impact of such events on the financial stability of companies. Therefore, this study uses an approach that assesses changes in the volatility of financial performance before and after key events such as the COVID-19 pandemic and the war in Ukraine.
2.3. Data Sources and Scope
The analysis covers LPP SA financial data from 2013 to 2024, with a focus on sales revenue, operating costs, operating profit and net profit. The financial data for LPP SA were obtained from publicly available sources, including the company’s quarterly financial statements and annual reports and the Warsaw Stock Exchange database. Additionally, data for sectoral and market indices were sourced from businessradar.pl and stooq.pl. These sources were chosen for their reliability and accessibility, ensuring comprehensive coverage of the company’s financial performance. This study focuses on a specific subset of data (Q1 2018 to Q1 2024) to capture the impact of two key global crises: the COVID-19 pandemic and the war in Ukraine. This time period was selected to include a sufficient pre-crisis period (Q1 2018 to Q4 2019), the duration of the COVID-19 pandemic (Q1 2020 to Q4 2021), and the period encompassing the war in Ukraine (Q1 2022 to Q1 2024). This segmentation allows for a detailed comparative analysis of the financial impacts before, during and after each macroeconomic shock. To separate the impacts, the analysis was conducted using non-overlapping time windows: Q1 2018 to Q4 2019 for pre-COVID-19, Q1 2020 to Q4 2021 for COVID-19, and Q1 2022 onwards for the Ukraine war. However, we acknowledge that residual effects from the pandemic may influence the post-COVID-19 analysis.
For the analysis of volatility, the coefficient of variation was applied, which allows the risk of different financial variables to be compared regardless of their units of measurement.
During the crises, LPP SA implemented several risk management strategies to mitigate the impact of external shocks:
Operational Adaptation: in response to the COVID-19 pandemic, LPP SA shifted its focus to online sales to compensate for losses in physical retail. This included substantial investments in digital infrastructure and expanding its e-commerce logistics capacity.
Cost Management: LPP SA renegotiated lease agreements for its retail spaces and postponed non-essential capital expenditures to manage liquidity risks. Staffing adjustments were made to reduce operational costs during the lockdowns.
Supply Chain Diversification: To address supply chain disruptions, LPP SA diversified its supplier base, reducing dependence on single-source suppliers and optimising inventory management to ensure a stable product flow.
Geographic Reallocation: During the Ukraine conflict, LPP SA made a strategic decision to withdraw from the Russian and Ukrainian markets and reallocate resources to safer regions, minimising exposure to geopolitical risks and sustaining its revenue base in more stable markets.
These strategies were aimed at enhancing LPP SA’s resilience and ensuring that it could maintain financial stability despite substantial external disruptions.
An analysis of the volatility of LPP SA’s financial results before and after these events was carried out, which allowed an assessment of their impact on the financial stability of the company. For the purposes of this study, the coefficient of variation was used to estimate changes in the level of risk in the analysed entity due to:
- -
relative dimension (scale-free)—the coefficient of variation is a relative measure, which allows the variability of different financial parameters to be compared regardless of their units of measurement (
McClave et al. 2008).
- -
comparability—the coefficient of variation makes it possible to compare the variability between different variables, regardless of their average values, which is useful for assessing the level of risk and changes in it (
Newbold et al. 2013).
- -
scalability—due to its design, the coefficient of variation can be used to analyse both small and large financial values, making it a versatile tool in volatility analysis. This allows for universal applicability in different economic contexts (
Levine 2020).
2.4. Statistical Methods and Rationale
The coefficient of variation is an extremely useful tool in risk analysis thanks to its unit independence, which makes it possible to compare a variety of parameters regardless of their units of measurement. The coefficient of variation is the ratio of the standard deviation σ to the mean μ (or its absolute value |μ|), which measures the relative dispersion of data points around the mean. It is expressed as a percentage and calculated using the formula:
where σ = standard deviation of the dataset and μ = mean of the dataset.
This metric provides a standardised way to compare the variability of data sets with different units or widely differing means. A higher CV indicates greater variability relative to the mean, while a lower CV suggests more consistency or less relative dispersion. The coefficient of variation is particularly useful for comparing the degree of variation between data sets in different contexts or scales.
The CV is particularly useful when comparing the relative variability of datasets with different units or scales, making it ideal for cross-comparative analysis of financial metrics (e.g., sales revenue, operating profit) across different time periods. It allows for the evaluation of risk by indicating the degree of volatility relative to the average value of the metric. A higher CV suggests greater relative volatility, while a lower CV indicates more stability.
The indicated characteristics of the coefficient of variation allow it to be effectively applied to both small and large entities, making it a versatile tool in different economic contexts. The determination of the coefficient of variation requires the determination of the range of data used to determine the coefficient of variation. For the purposes of this study, the quarterly data of the analysed entity from Q1 2018 to Q1 2024 were used. Each time, data from eight quarters (seven preceding quarters and the current quarter) were used to determine the coefficient of variation for a given point in time. Eight periods provide a sufficiently large sample to obtain results that reflect well the actual changes and behaviour of the parameters analysed. A larger number of periods reduces the impact of possible anomalies and provides more stable results (
Beam 2006). Eight periods, especially if they are quarterly data, allows for seasonal patterns in the data, which is crucial in financial analysis, where volatility can be seasonal (
Shumway et al. 2000). A larger number of observations increases the precision and statistical stability of the indicators determined, which is essential to accurately assess the risk and volatility of the parameter analysed; this is why two years of data were used (
Montgomery et al. 2015).
We calculated Beta values for LPP SA against the WIG index from 2013 to 2024 and the WIG-clothing index from 2017 to 2024 (the earliest available data for WIG-clothing). The Beta values were derived by assessing the sensitivity of LPP SA’s stock price movements relative to these indices, with a particular focus on analysing the impact during periods of economic volatility, such as the COVID-19 pandemic and the Ukraine conflict.
2.5. Analytical Framework
Financial parameters from the profit and loss account of the analysed entity were selected to analyse the variability of the development of selected indicators. The profit and loss account directly reflects the operating results of the enterprise, such as revenues, costs, profits and losses. By analysing these data, an accurate picture of the variability of key financial parameters can be obtained, which is essential for assessing the efficiency and financial stability of a company (
Palepu et al. 2020). Profit and loss account data are crucial for all stakeholders of an entity, such as investors, lenders and management. The volatility of these data can affect investment decisions, creditworthiness, management strategies and the entity’s risk management (
Wild et al. 2007). Considering the profit and loss account data of the studied entity, the following parameters were analysed: sales revenue, operating expenses, financial expenses, operating profit and net profit. The analysis of sales revenue volatility allows assessment of the stability and predictability of the company’s revenue streams. This is crucial for assessing operational risk, as revenues directly affect a company’s ability to cover costs and generate profits from its operations (
Penman 2013). The volatility of operating costs affects an entity’s profit margins and operational efficiency. Analysis of these costs enables the identification of risks associated with uncontrolled increases in expenses, which can affect a company’s operating profitability (
Weetman 2006). Operating profit reflects the efficiency of a company’s core business. Analysing its volatility makes it possible to assess the operational risk and efficiency of the entity’s management (
Brealey et al. 2014). Financial costs, such as interest on debt, affect a company’s ability to service its debt. Analysing the volatility of these costs is crucial for assessing the financial risk and financial stability of a company (
Damodaran 2012). Net profit is the ultimate indicator of a company’s profitability. Analysing its volatility is key to assessing overall financial risk, which can affect investors’ decisions and the ability to generate profits over the long term (
Ross et al. 1999). In addition to the financial data from the income statement, to assess changes in the level of risk in the analysed entity, an analysis of the volatility of the parameters proposed for Rappaport’s concept of corporate value management as generators of corporate value was also carried out: the dynamics of sales revenue and the operating profit margin––the ratio of operating profit to the value of sales revenue (
Rappaport 1999). Of the seven value generators proposed by Rappaport, only the variability of the generators that can be determined based on the income statement was examined. Using the metrics proposed by Rappaport means, in the context of risk analysis, taking into account the interests of owners, both present and future, which helps to make decisions that maximise the long-term value of the company, which is beneficial to all shareholders of the company (
Copeland et al. 1991). The analysis of the volatility of the selected value generators was extended to analysis of the volatility of the share prices of the analysed entity in order to determine the changes that occurred in the case of real decisions of investors operating on the Warsaw Stock Exchange in relation to the share prices of the analysed entity. The analysis of share price volatility may reflect investors’ perceptions of the entity. Higher volatility may suggest that investors have higher expectations of a company’s future financial performance, as well as higher volatility about its future value (
Bodie et al. 2014). High share price volatility often indicates strong investor reactions to new company news. This may indicate that investors are following the company closely and reacting quickly to changes in its business environment, which in turn may affect share valuations (
Fama 1970). An analysis of past share price volatility can provide valuable information about investors’ perceptions of an entity, especially in the context of the changes in the entity’s environment that occurred as a result of the two events analysed: the outbreak of the COVID-19 pandemic and the war in Ukraine. In order to be able to compare investors’ perceptions to other entities listed on the Warsaw Stock Exchange, an analysis of the volatility of the WIG-clothing sector index and the WIG overall market index was used.
The WIG index (Warszawski Indeks Giełdowy) is the main composite index of the Warsaw Stock Exchange (WSE), tracking the performance of all domestic and foreign companies listed on the WSE main market. It serves as a comprehensive indicator of the overall health and performance of the Polish stock market, representing multiple sectors, including finance, retail, manufacturing and services. The inclusion of the WIG index as a benchmark is crucial for understanding whether LPP SA’s financial performance was influenced by broader macroeconomic factors affecting the entire market or if the company’s results were driven by firm-specific factors. Furthermore, to provide a sector-specific perspective, the WIG-clothing sub-index was also included in the analysis. The WIG-clothing index consists of the top apparel and retail companies listed on the Warsaw Stock Exchange, making it an appropriate benchmark for assessing LPP SA’s performance within its industry context. By comparing LPP SA’s financial volatility and growth dynamics to both the general WIG index and the sector-specific WIG-clothing index, the study is able to identify deviations and trends that may not be apparent when only focusing on a single-company analysis. The choice of these indices allows for a multi-level comparison: the WIG index provides a view of LPP SA’s performance against the backdrop of broader market movements, while the WIG-clothing index enables a focused comparison within the apparel and retail sector. This approach ensures that LPP SA’s strategic responses are evaluated not only as firm-specific actions but also in relation to broader industry trends. Thus, although this study primarily focuses on one company, the use of these two indices offers a broader market perspective and partially addresses the concern about the generalisability of a single-company analysis.
If the volatility of a company’s share price is substantially higher than the volatility of the WIG-clothing, this may indicate a higher company-specific risk. Substantial deviations in volatility may indicate anomalies or extraordinary events, such as major management changes, acquisitions, financial performance or industry turmoil. The WIG-clothing index contains companies in the same industry, so a comparison can indicate how well a company is doing compared to its industry competitors. If the volatility of a company’s share price is lower than the volatility of the industry index, this may indicate a more stable financial and operational situation for that company. Comparing share price volatility with the volatility of the WIG index (which represents the market as a whole) can help in assessing how much share price volatility is related to overall market risk, bearing in mind that in the long term the level of risk tends to revert to the mean (
Pęksyk et al. 2012).
2.6. Analysis of Results of the Study
LPP SA is a Polish family-owned company that is one of the largest clothing manufacturers in Central and Eastern Europe listed on the Warsaw Stock Exchange. Founded in 1991, LPP SA manages five well-known brands: Reserved, Cropp, House, Mohito and Sinsay. The company has branches in Poland and in many other countries. LPP SA invests in modern technologies and the development of logistics, which enables it to effectively manage distribution of its products. The company is also involved in sustainable development and social responsibility activities, aiming to minimise the environmental impact of its operations. As part of its CSR strategy, LPP SA carries out projects supporting local communities and environmental initiatives. LPP SA is dynamically developing its presence in international markets, adapting its offerings to the diverse needs of its customers. The company places great emphasis on innovation and digitalisation, which allows it to meet the challenges of today’s fashion market. LPP SA’s e-commerce activities are becoming increasingly important in its sales strategy. The Reserved brand, as LPP SA’s flagship brand, is highly appreciated by consumers both in Poland and abroad. LPP SA employs thousands of employees who support the development of the company and the achievement of its business goals. The company focuses on high quality products and attention to detail, which translates into customer satisfaction. As part of its sustainability efforts, LPP SA is pursuing initiatives to reduce CO2 emissions and promote a closed-loop economy. The company aims to increase the proportion of eco-friendly materials in the production of clothing. LPP SA is involved in charitable activities through the LPP Foundation, which supports disadvantaged people and runs scholarship programmes. LPP SA’s net revenues in 2023 amounted to PLN 17.4 billion, and its net profit to PLN 1.6 billion, which demonstrates the company’s stable financial position in the market. In the case of the analysed entity, both analysed factors—anomalies in the downstream environment (the COVID-19 pandemic and the war in Ukraine—marked in green in the table) posed a major threat to maintaining the financial results achieved to date. In the case of the pandemic, the closure of physical shops as a result of lockdown had a direct impact on the decline in sales. For LPP SA, which had many physical locations, the reduction in business at these outlets led to a substantial reduction in revenue. Even when shops are closed, the company continues to incur fixed costs such as the rental of retail space, staff salaries (unless they have been dismissed or put on unpaid leave), infrastructure maintenance and other financial obligations. These costs can put a substantial strain on the company’s budget in the absence of sales revenue. The pandemic has affected global supply chains, causing delays in the delivery of raw materials and finished products. For an apparel company that depends on the timely delivery of goods, such disruptions lead to shortages in the product range, and thus further financial losses. Declining revenues with persistent fixed costs and supply disruptions can lead to liquidity problems. Faced with such challenges, LPP SA may have been forced to restructure its operations. In the case of the war in Ukraine, this factor also posed a threat, due to the fact that Ukraine and Russia were important markets for LPP SA. The war led to destabilisation of the economy, a decline in consumer demand and operational difficulties, which could directly affect sales in the region. LPP SA has completely withdrawn from both the Ukrainian and Russian markets as a result of the war.
Table 1 shows the determined variability of selected parameters from the income statement (sales revenue, operating costs, operating profit, financial costs, net profit), selected value generators (sales revenue dynamics, operating profit margin) and selected capital market parameters (LPP SA share price, WIG-clothing, WIG)—the table indicates the moment of occurrence in the environment of an anomaly that could affect the variability of the analysed financial parameters.
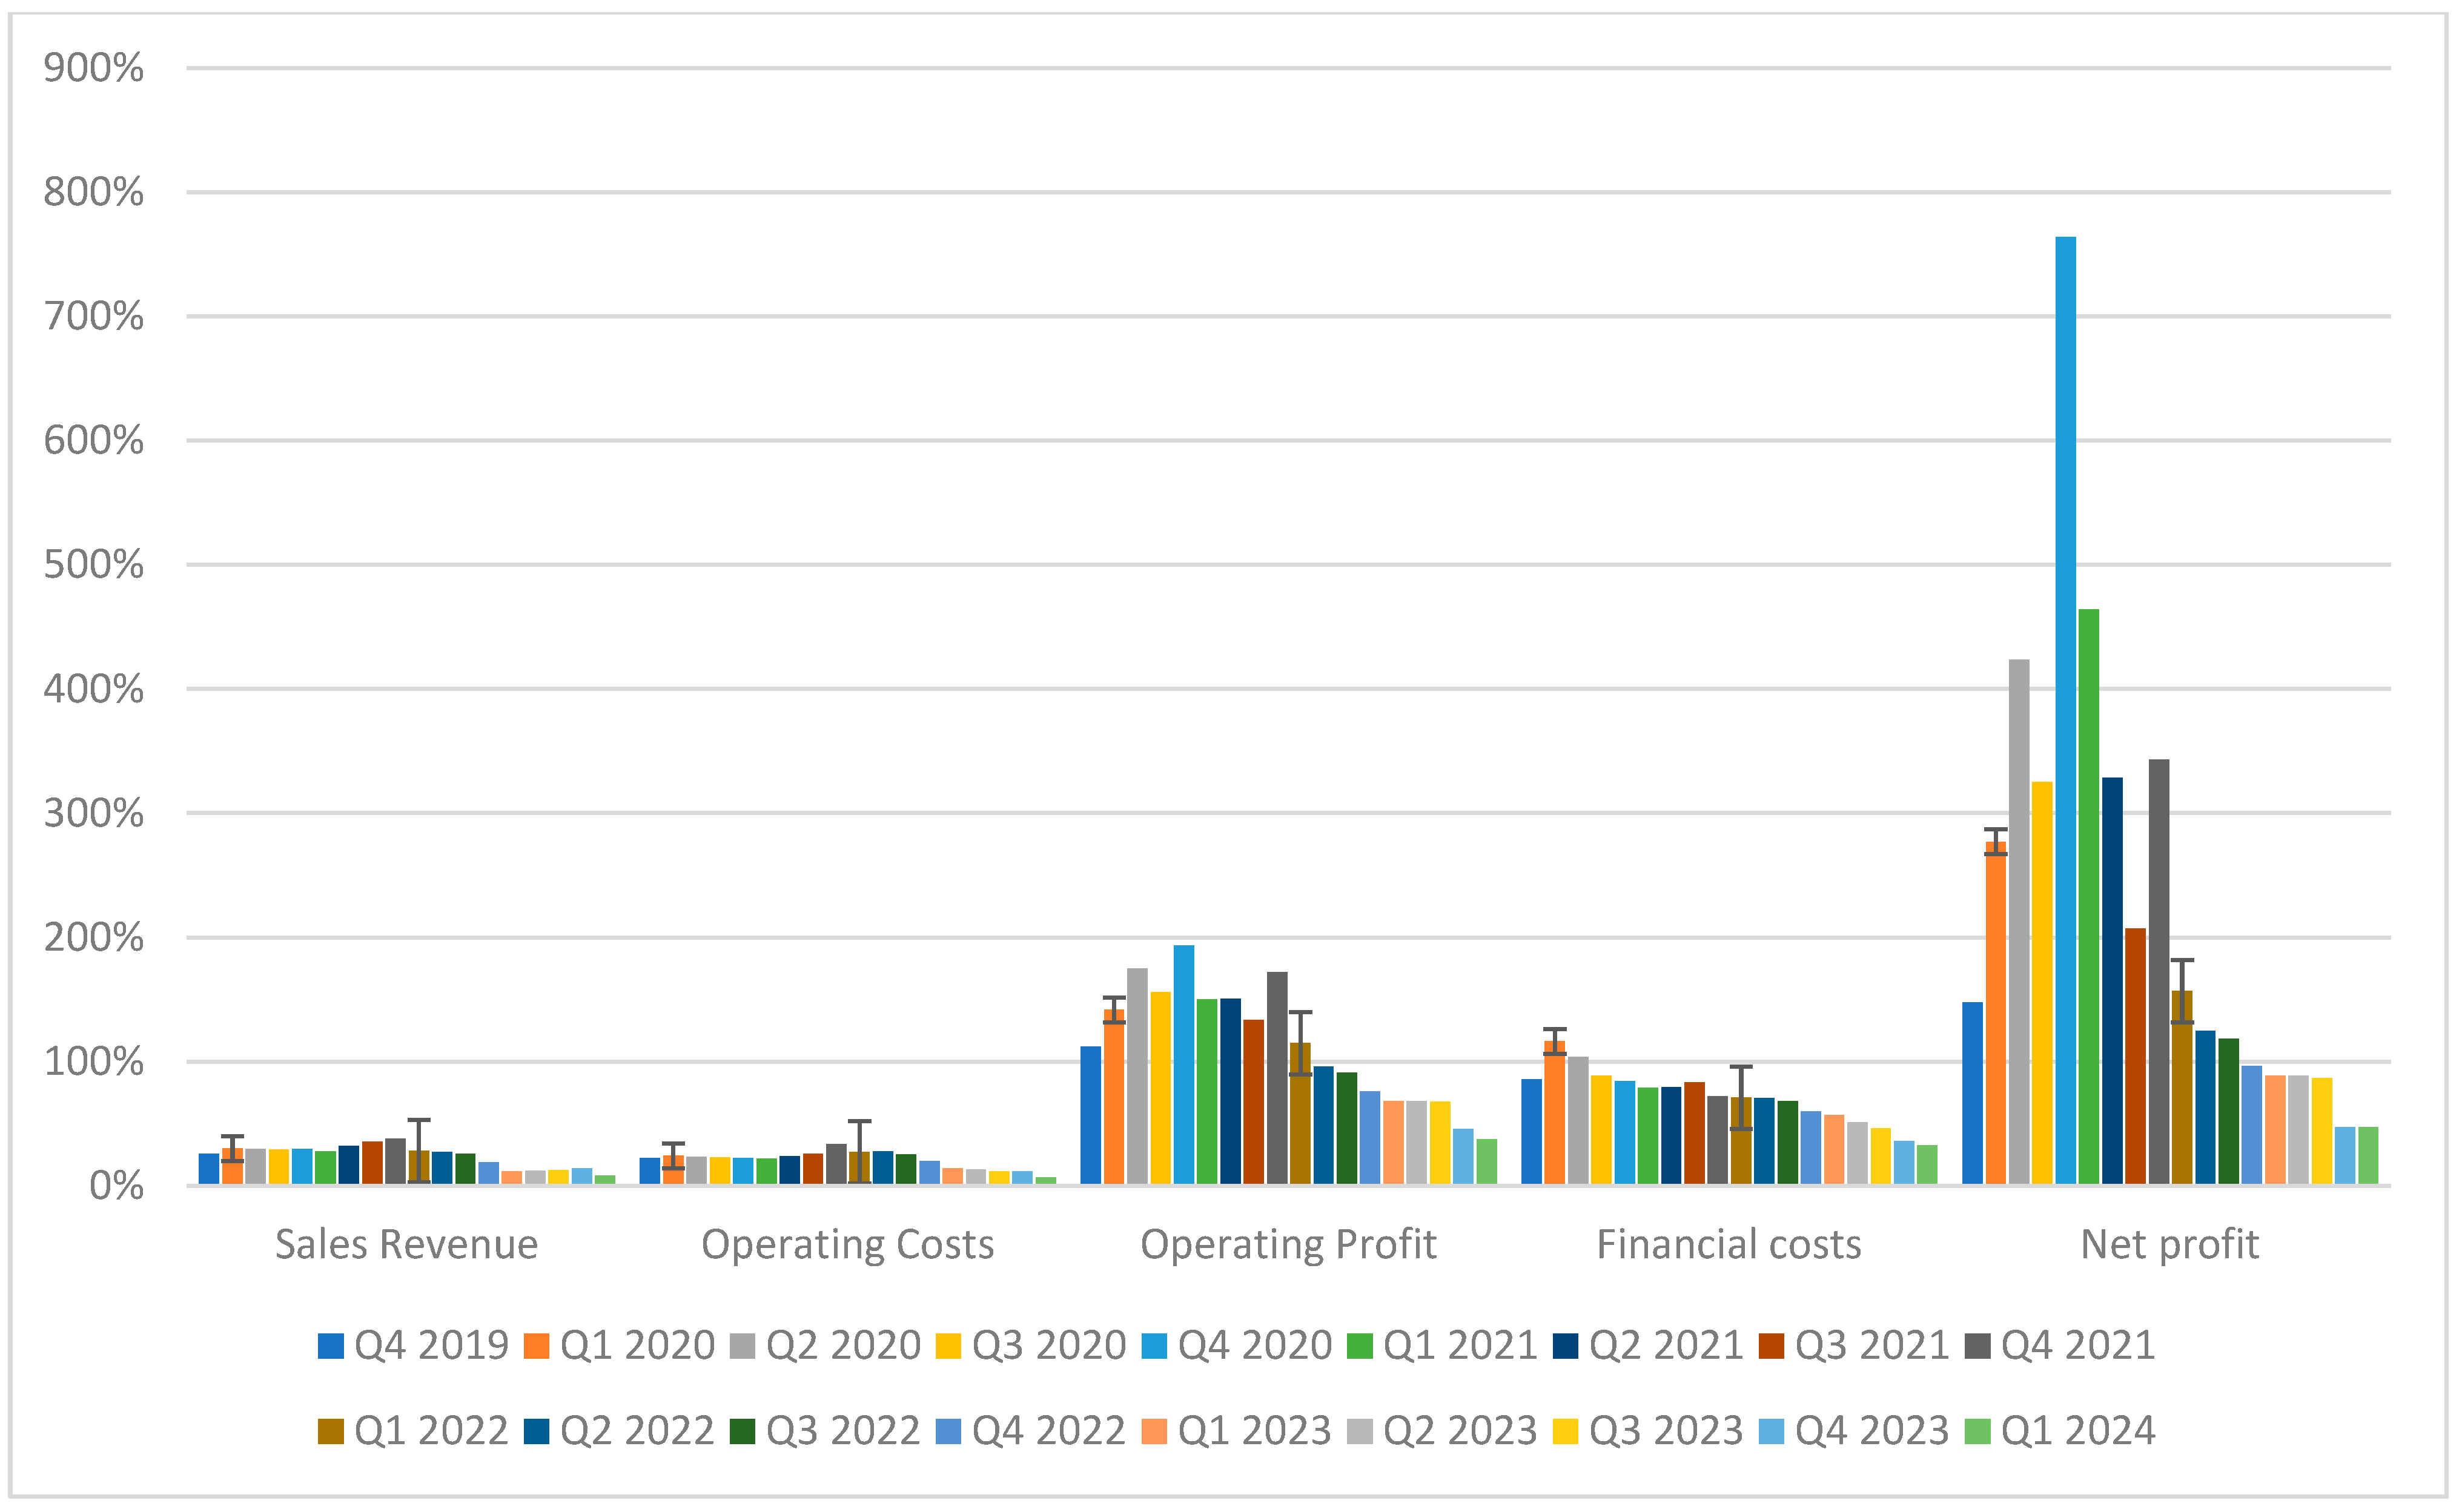
The figures presented visualise the extent and magnitude of change in the variability of the financial parameters selected for analysis. The variability of the financial parameters from the profit and loss account are shown in
Figure 1.
An increase in volatility due to the first anomaly (pandemic COVID-19) can be seen for all income statement parameters. However, it should be noted that the scale of volatility is highest for operating profit and net profit. It should be noted that the scale of volatility is gradually increasing after Q1 2020 for all parameters analysed—which may indicate that the anomaly was a catalyst for a further increase in volatility, resulting from the emergence of new factors in the environment further arising from the implementation of, for example, new legislation related to the pandemic or from deterioration of the economic situation. The magnitude of the impact of the second anomaly in the wider environment (the war in Ukraine) was substantially lower.
Figure 2 shows the variability of these two parameters in order to illustrate the magnitude of change in the variability of sales revenue and operating costs, which varied less than financial costs and operating and net profits.
The figure shows that the magnitude of change as a result of the first anomaly was substantially less for these two financial parameters (sales revenue operating costs) than for the other financial parameters analysed. But in the case of both sales revenue and operating costs, their volatility after the anomaly did not increase substantially, but rather remained at a similar level. The second anomaly no longer caused a substantial increase in the volatility of the two financial parameters analysed.
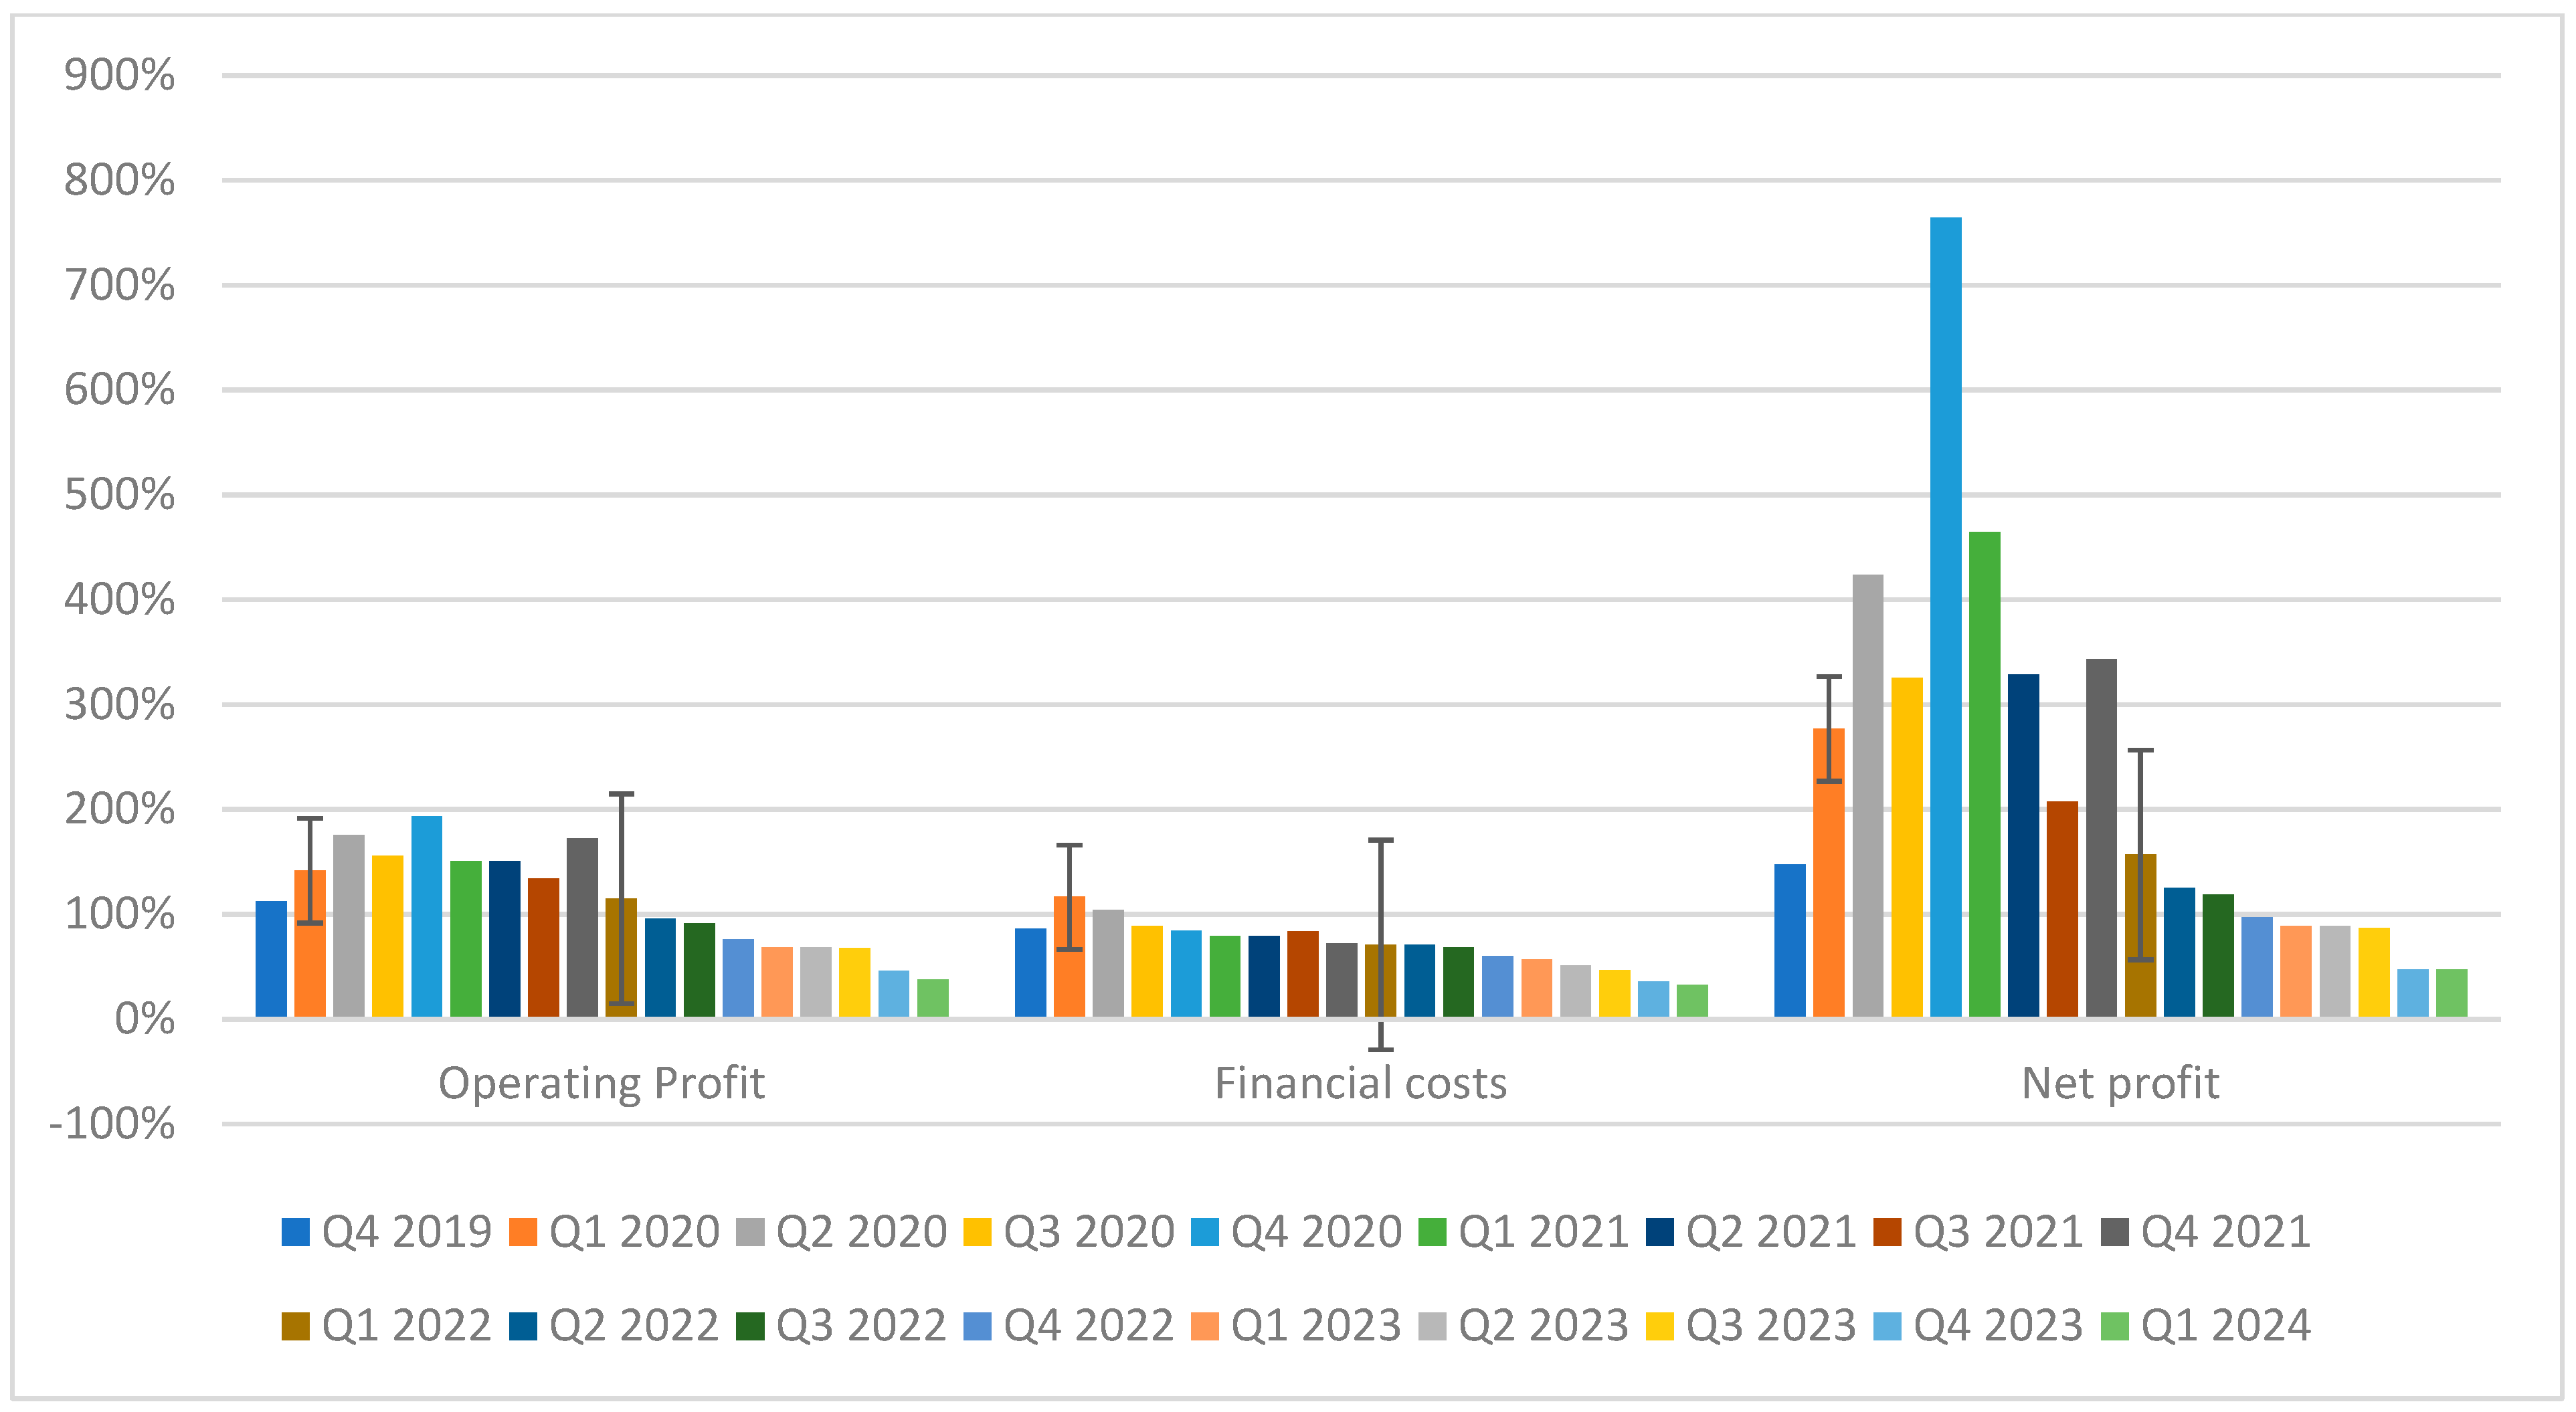
Figure 3 presents the magnitude of change in the coefficient of variation for operating profits, financial expenses and net profit of the entity under analysis.
In the case of the other three parameters from the profit and loss account (operating profit, financial costs, net profit), the scale of the increase in the coefficient of variation resulting from the appearance of anomalies was already greater, and the greatest in the case of net profit. Such a high variability at the level of net profit is due to the accumulation of all the changes that occur at the different levels of the income statement. Small changes at the level of sales revenue and operating expenses, if of a different nature, cause larger changes at the level of operating profit. If the next level of the income statement (financial activities, for which the financial costs are responsible) shows a similar scale of variability, this results in a very high variability at the level of the parameter that is practically the last in the income statement (net profit), and in it all the variability at the individual lower levels is cumulated.
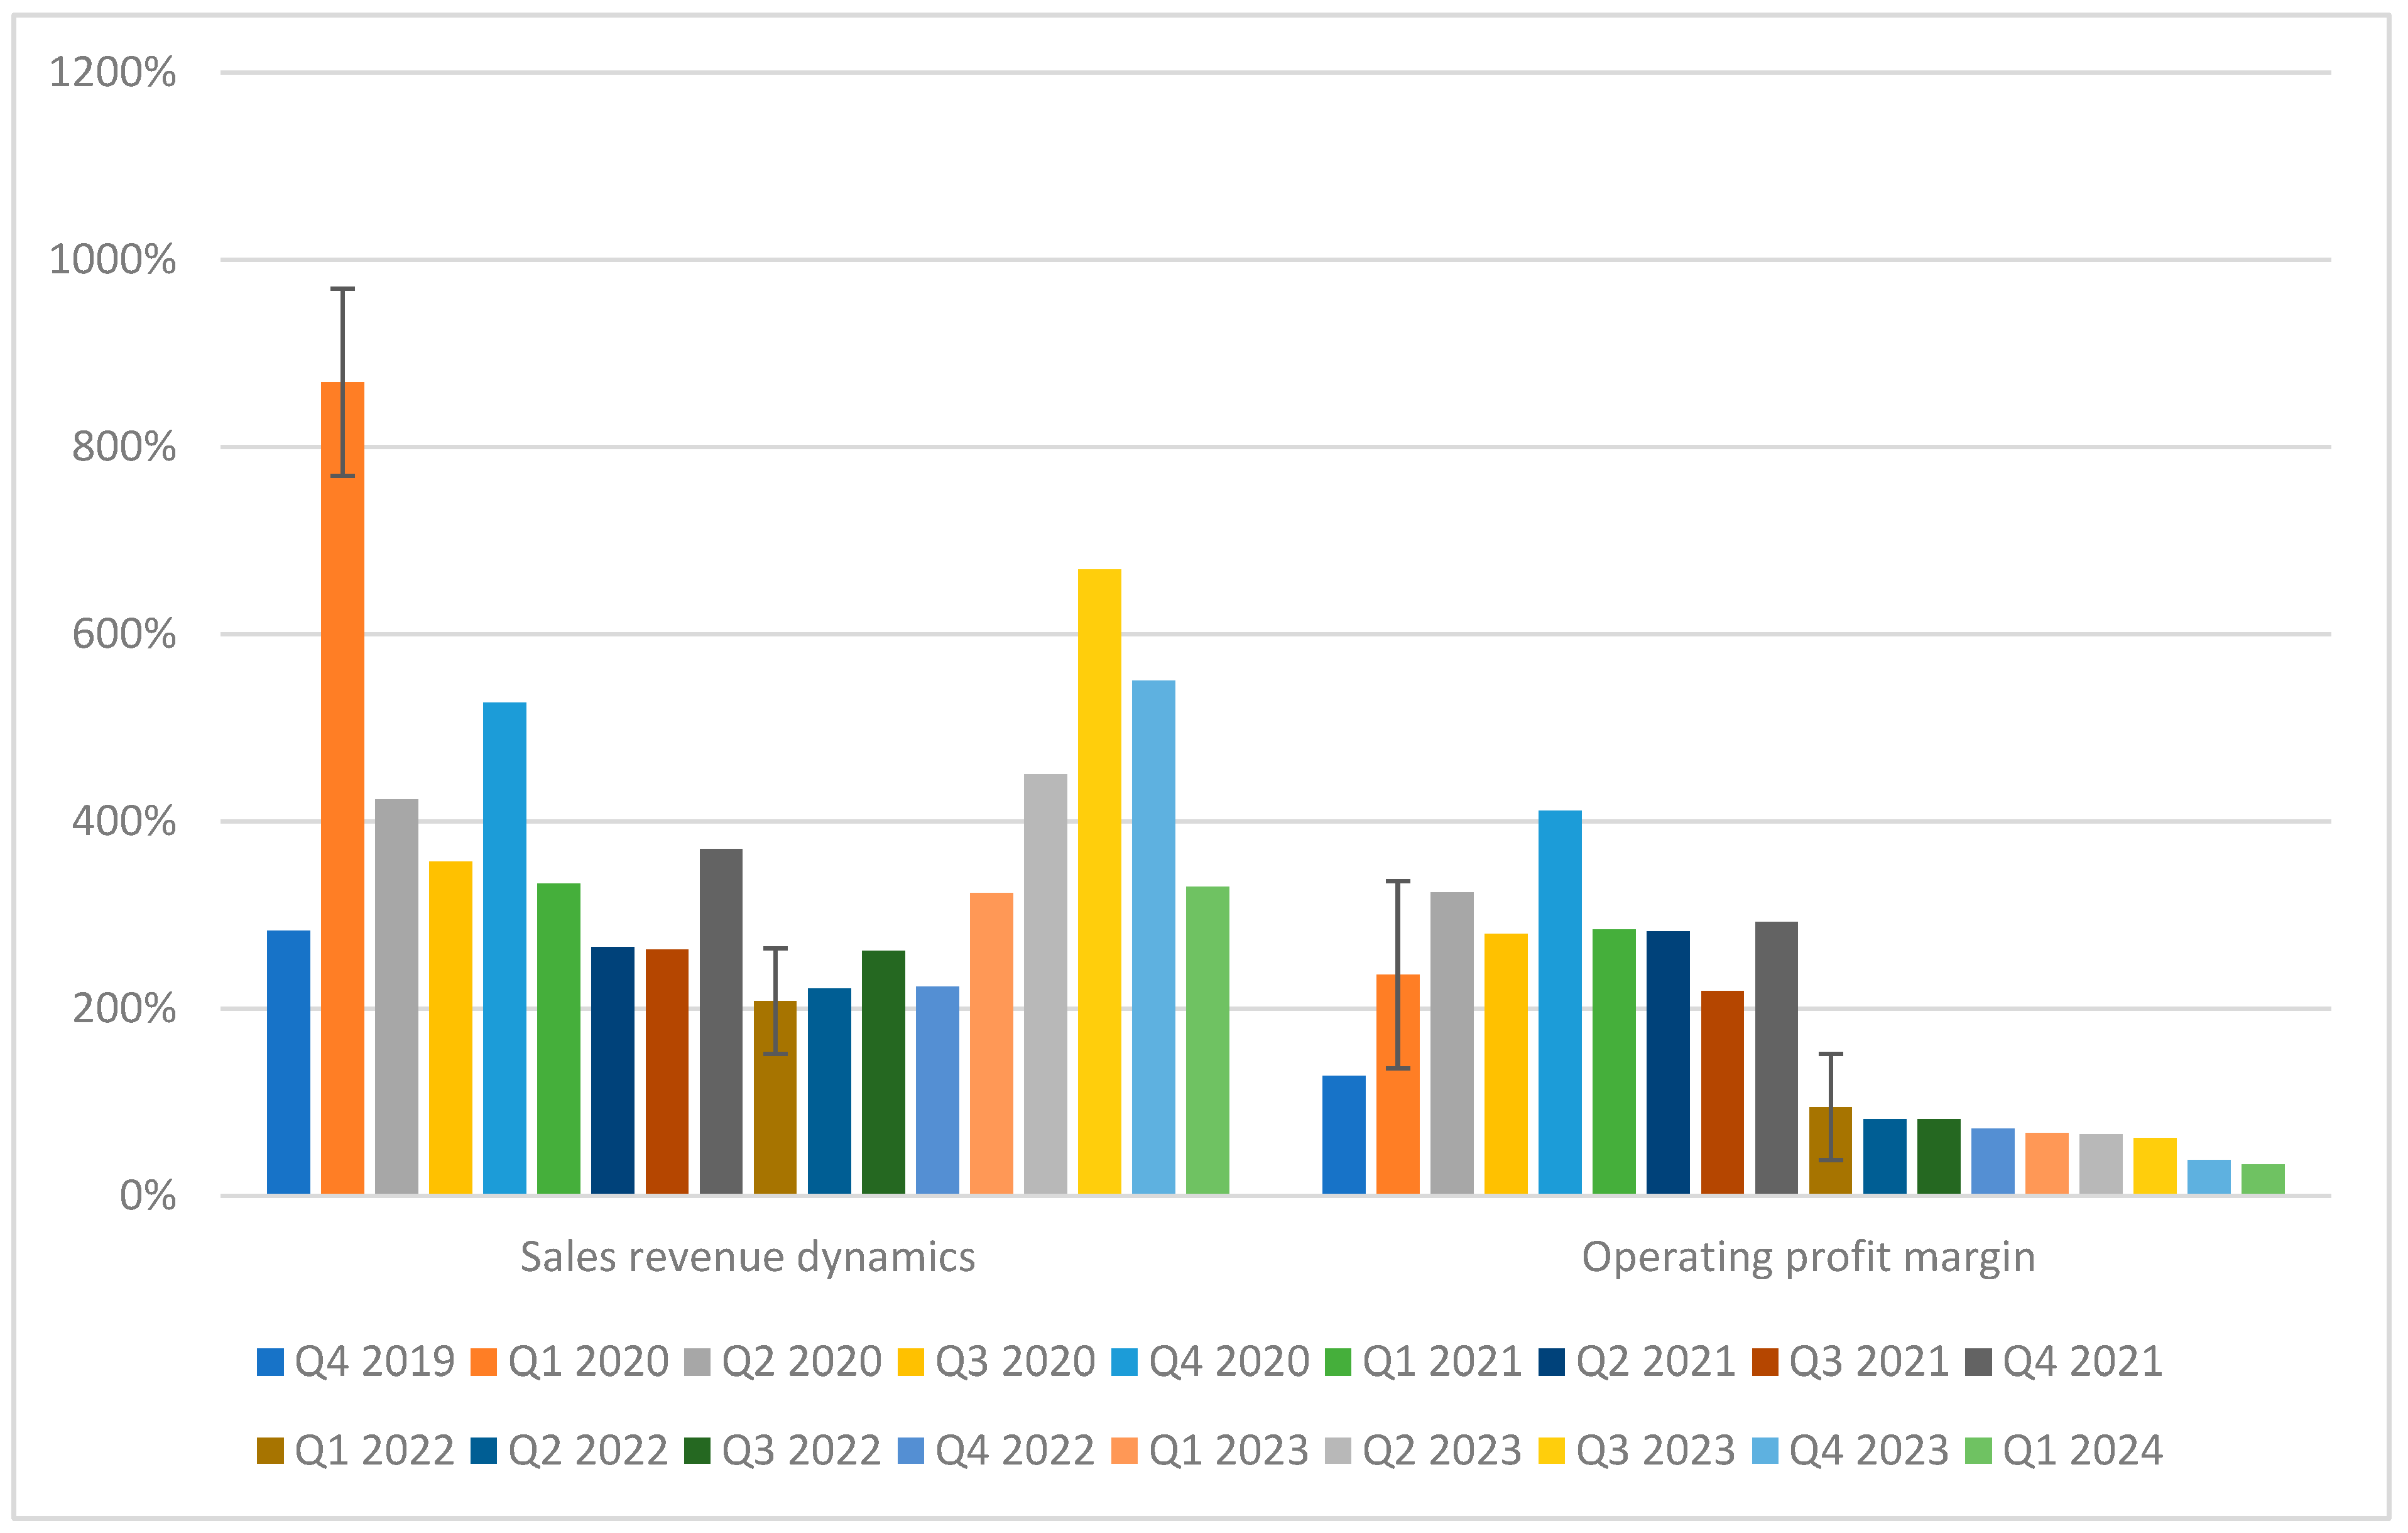
Figure 4 visualises the variability of the parameters that are important from the point of view of both company managers and investors—the variability of selected value generators of the analysed company.
Value generators are characterised by the highest volatility among the financial parameters analysed—this is particularly true of sales revenue dynamics. In the case of this parameter, the greatest volatility occurred at the time of the first anomaly (the COVID-19 pandemic)—in the case of LPP SA, this is due to the sharp decrease in sales revenue resulting from the lockdown introduced in connection with the pandemic. LPP SA substantially developed sales using the e-commerce channel in subsequent periods, which increased sales revenue while reducing the volatility of sales revenue dynamics. In subsequent quarters, the volatility was at a similar level. Despite a decrease in the scale of volatility, it was at a very high level. The emergence of the second analysed anomaly (the war in Ukraine) no longer caused a substantial change in the volatility of sales revenue dynamics. The volatility of the operating profit margin also increased when the first anomaly occurs and then gradually increased. The second anomaly no longer increased the volatility of the net profit margin.
Figure 5 illustrates the volatility of the stock market indices associated with the entity under analysis: share prices, WIG-clothing and WIG.
As was the case with the previous financial parameters, the appearance of the first anomaly increased the volatility of all analysed parameters. At the time of the appearance of the anomaly, the increase in volatility in the case of the share prices of the analysed entity is the smallest—in the case of WIG-clothing, the increase is substantially higher. However, over time, the volatility of the share price “caught up” with the volatility of the WIG-clothing, and, as of Q2 2021, they were at a similar level. Share volatility and WIG-clothing volatility simultaneously outperformed WIG volatility. In the case of WIG volatility, after increasing at the time of the anomaly, volatility remained at similar levels in subsequent periods. It should be noted that, as was the case with the previous financial parameters, also in the case of the stock market parameters, the second anomaly (war in Ukraine) no longer caused such substantial changes in volatility as the first anomaly.
During the COVID-19 pandemic, the coefficient of variation for operating profit increased by 30.80%, indicating heightened volatility and financial instability. In contrast, during the Ukraine conflict, the coefficient of variation decreased by 54.36%, reflecting substantial stabilisation, likely due to strategic adaptations such as supply chain diversification and market reallocation.
2.7. Beta Analysis for LPP SA
Our analysis reveals that LPP SA’s Beta relative to the WIG-clothing index remained close to 1 for most of the period from 2017 to 2024, indicating high alignment with the apparel sector’s overall performance. This consistency suggests that LPP SA’s stock movements are reflective of sectoral trends, validating its use as a proxy for the apparel industry. Additionally, the Beta values relative to the WIG index, particularly during the COVID-19 pandemic (Beta > 1.5) and subsequent geopolitical events, highlight LPP SA’s heightened sensitivity to market-wide volatility, further supporting its representativeness in times of economic disruption in
Figure 6.
To validate LPP SA’s role as a market proxy for the Central and Eastern European apparel sector, we calculated the Beta coefficients relative to both the WIG and WIG-clothing indices for three key economic periods: pre-COVID-19 (2013-Q4 2019), COVID-19 (Q1 2020—Q4 2021) and the Ukraine war (Q1 2022 onwards). The Beta coefficient is a measure of systematic risk, capturing how much LPP SA’s stock price movements correlate with those of the broader market indices in
Table 2.
The segmented Beta analysis allows for a nuanced understanding of how LPP SA’s risk sensitivity evolved across three key periods: the pre-COVID-19 period, the pandemic and the Ukraine war. This segmentation highlights LPP SA’s varying responses to different external shocks and their relative alignment with broader market and sectoral trends.
Pre-COVID-19 Period (2013-Q4 2019): During stable economic conditions, LPP SA’s Beta values relative to the WIG-clothing index (~0.83) and the WIG index (~1.23) reflect a moderate alignment with sectoral and market movements, indicating a relatively balanced risk profile. This suggests that, under normal conditions, LPP SA’s financial performance is consistent with the overall industry trends. LPP SA’s Beta values were relatively lower compared to later periods, indicating moderate sensitivity to market fluctuations under stable economic conditions.
COVID-19 Period (Q1 2020—Q4 2021): The onset of the pandemic resulted in a sharp increase in Beta values (WIG-clothing: ~0.93, WIG: ~1.27), reflecting heightened sensitivity to market volatility. This rise aligns with the significant disruptions in supply chains, consumer behaviour and operational structures that affected the apparel sector broadly. LPP SA’s performance during this period mirrored the challenges faced by the industry, validating its alignment with sectoral trends. During the pandemic, LPP SA’s Beta values increased, reflecting heightened sensitivity to market volatility as consumer and investor behaviour shifted significantly.
Ukraine War Period (Q1 2022 onwards): During the Ukraine war, Beta values spiked further (WIG-clothing: ~1.08, WIG: ~1.66), underscoring the intensified risk sensitivity caused by geopolitical instability. However, the less pronounced impact on some financial metrics, such as operating profit and revenue, indicates that LPP SA’s adaptive strategies—developed during the pandemic—helped mitigate some of the volatility associated with this second crisis. The Beta values reached their highest during the Ukraine war, suggesting that geopolitical instability had a substantial impact on LPP SA’s stock performance, further underscoring its sensitivity to broader economic and geopolitical risks.
These findings support the selection of LPP SA as an example of adaptive crisis management case for the apparel sector in Central and Eastern Europe, particularly during periods of market stress. The significant changes in LPP SA’s Beta coefficients align with broader market trends, illustrating that LPP SA’s stock performance mirrors sector-wide and market-wide reactions to external shocks. This alignment further underscores the appropriateness of LPP SA as a proxy for examining the impact of macroeconomic disruptions on the apparel industry. The analysis of LPP SA’s financial performance showed that both crises under study had a substantial impact on the volatility of the company’s key financial parameters. The COVID-19 pandemic caused a sharp increase in volatility, particularly for operating profit and net profit. This volatility was driven by restrictions on stationary operations and disruptions to global supply chains, which affected sales revenue and operating costs. The war in Ukraine also affected volatility, but the effect was less substantial compared to the pandemic. In particular, it was noted that the impact of the war on the volatility of sales revenue and operating costs was less, which may be due to the earlier adaptation measures taken by LPP SA. The COVID-19 pandemic had a strong impact on LPP SA’s operations, causing substantial changes in the volatility of financial results. As a result of lockdowns and restrictions on stationary retail, the company has had to adapt quickly, increasing its focus on online sales. Research indicates that the apparel sector, including LPP SA, experienced substantial losses due to physical shop closures and delays in raw material deliveries, which increased the company’s financial volatility. Net and operating profits showed the greatest volatility as a direct result of the need to rapidly restructure operations. The war in Ukraine affected the operations of LPP SA by destabilising the markets in which the company was active, particularly in Russia and Ukraine. The conflict necessitated a withdrawal from these markets, which reduced sales revenues in the region, but at the same time did not cause volatility as extreme as the pandemic. There was less volatility in operating costs and operating profit, which may reflect the effectiveness of previous crisis management measures. Despite the challenges, the company was able to maintain financial stability, suggesting that previous experience from the pandemic may have helped to better prepare for future crises. A comparison of the impact of the COVID-19 pandemic and the war in Ukraine on the volatility of LPP SA’s financial performance indicates that the pandemic had a much greater destabilising effect on financial performance. This is due to the broad scope and global nature of the pandemic, which disrupted most aspects of the business. In contrast, the war in Ukraine, while also impacting performance, was more limited in scope, enabling LPP SA to better manage risk. The results of the study highlight that LPP SA, despite its stable market position, is vulnerable to external crisis factors. The COVID-19 pandemic, as the first global crisis, had the most disruptive impact on the volatility of the company’s financial performance, especially in the short term. In the case of the war in Ukraine, although it had an impact on the company’s operations, the financial volatility was lower, which may be due to earlier adaptation measures and the specifics of the conflict. The literature suggests that these crises may provide valuable case studies for other companies in risk management. The findings of this study may also suggest that global crises require differentiated adaptation strategies, depending on the nature and extent of the crisis.
3. Discussion
The contrasting impacts of the COVID-19 pandemic and the Ukraine war on operating profit volatility suggest that, while the pandemic caused a spike in financial risk, LPP SA’s strategies during the Ukraine conflict were more effective in stabilising operations. This resulted in a substantial reduction in operating profit volatility, demonstrating the importance of proactive risk management. The results of the study highlight that LPP SA, despite its stable market position, is vulnerable to external crisis factors. The COVID-19 pandemic had the greatest impact on the volatility of the company’s financial performance, due to its global reach and long-term effects on the economy. The war in Ukraine, although it also affected LPP SA’s operations, had less impact on the variability of results, which may indicate the effectiveness of the adaptation measures taken by the company. The literature indicates that companies need to be prepared for a variety of crises, which may require different risk management strategies. The findings of this study can serve as a basis for developing better risk management strategies in times of economic uncertainty.
The Beta analysis demonstrates that LPP SA’s performance is closely correlated with sectoral movements in the apparel industry, particularly when compared to the WIG-clothing index. This finding reinforces the validity of using LPP SA as a case study, as it reflects broader trends within the sector. The observed spikes in Beta values during periods of market turmoil, such as the COVID-19 pandemic and the Ukraine conflict, further illustrate LPP SA’s sensitivity to macroeconomic shocks, aligning with typical industry responses.
However, it is important to point out the limitations of a smaller study and also the directions of further research that will guide companies for better operational and strategic management in the face of crises. The study is based on LPP SA financial data for the period 2013–2024. Using a longer time horizon could provide a more complete picture of the impact of crises on the volatility of financial performance. The geographical context of the study should also be highlighted. The analysis focuses on the impact of global crises on a single company operating in Central and Eastern Europe. The results may not be fully representative of companies operating in other regions with different levels of exposure to these crises. The study is also characterised by methodological limitations. The use of the coefficient of variation as the main measure of risk may not reflect all aspects of financial volatility. Alternative methods of analysis, such as GARCH models, could provide more sophisticated results. In addition, the study does not include a cross-sector comparison: it focuses on the clothing sector and does not include a comparison with other sectors that could show different responses to crises.
Further lines of research should therefore take into account:
Extending the time span: Research should cover a longer period to better understand the long-term effects of crises and the potential reversion to the mean in financial performance volatility.
Comparative analysis across sectors: Future research could compare the impact of crises on different sectors of the economy to identify more general patterns and sectors most exposed to volatility.
Use of advanced volatility analysis models: The introduction of more advanced analytical tools, such as GARCH models, could provide deeper insights into the dynamics of volatility in response to crises.
Consideration of internal factors: Research could also consider the impact of internal risk management strategies on the volatility of financial performance to better understand how companies can counter external risks.
Impact of macroeconomic policies: Analysing how different government policies and macroeconomic interventions affect the variability of firm performance could provide valuable information for policy makers and entrepreneurs.
Further research taking into account these constraints and directions could provide a more comprehensive picture of the impact of global crises on the volatility of corporate financial performance, as well as helping to develop more effective risk management strategies.
The findings of this study support the resilience theory by
Hubbard (
2020), demonstrating that firms with diversified supply chains and flexible resource allocation are better able to maintain stability during geopolitical crises. The contrasting impact of the COVID-19 pandemic and the Ukraine war illustrates the need for strategic flexibility, as emphasised by
Dunning (
1993), suggesting that firms should adopt a multi-pronged approach to risk management that includes both digital transformation and geographic reallocation.
The focus on LPP SA provides a detailed understanding of how a market leader in the CEE apparel industry navigated the challenges posed by the COVID-19 pandemic and the Ukraine war. However, the strategies and responses observed may not be fully representative of the entire sector. Future studies should therefore incorporate a broader set of firms to explore whether the trends identified in this case study hold across different companies and regions.


