The Cost of Borrowing as a Limiting Factor of Non-Life Insurance Development: The Italian Case


Abstract
1. Introduction
Sample, Scope and Relevance
2. Materials and Methods
2.1. Literature Review
2.2. The Economic Model
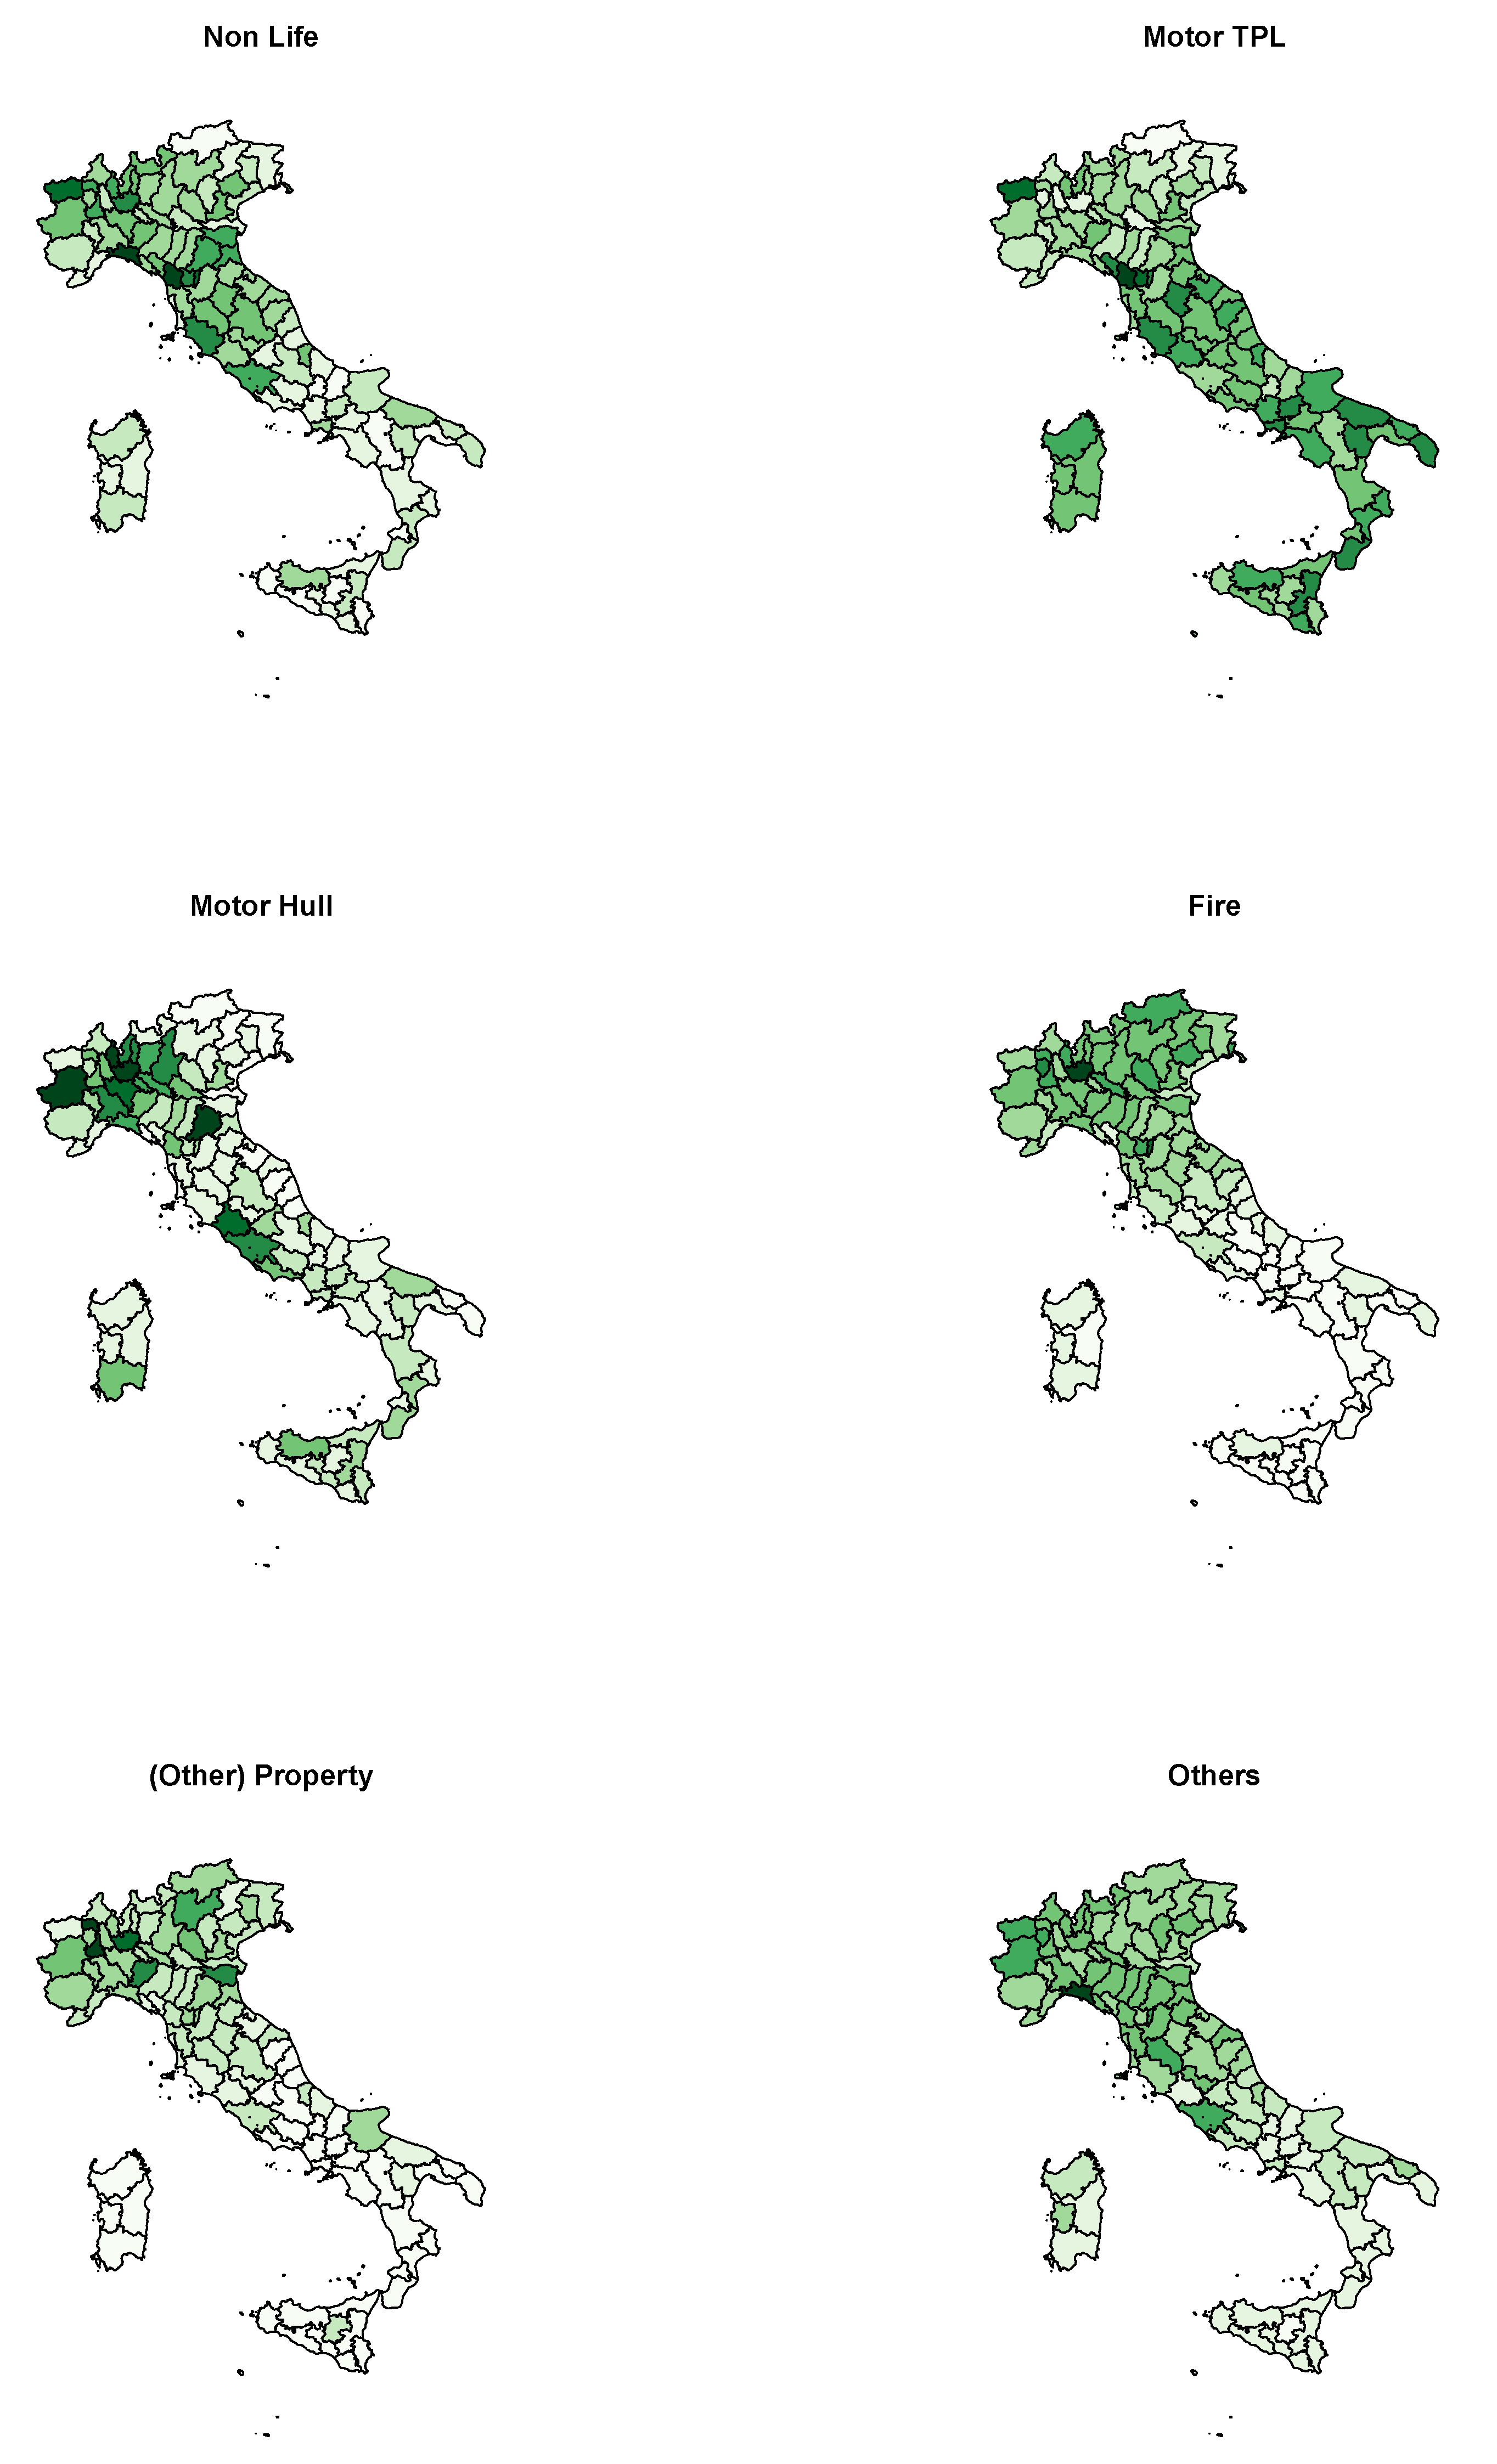
2.3. The Data
2.4. The Empirical Model
2.5. Diagnostic Tests
Spatial Permutation Test
3. Results
4. Conclusions
Supplementary Materials
Funding
Data Availability Statement
Acknowledgments
Conflicts of Interest
Abbreviations
| (M)TPL | (Motor) Third Party Liability Insurance |
| GDP | Gross domestic product |
| GWP | Gross written premiums |
| ISVAP | Public institute for insurance supervision (1982–2012) |
| IVASS | Public institute for insurance supervision (2012–today) |
| CPI | Consumer price index |
| OLS | Ordinary least squares (estimator) |
| FGLS | Feasible generalized least squares (estimator) |
| RE | Random effects (estimator) |
| FE | Fixed effects |
| HC | Heteroskedasticity-consistent (standard errors) |
| AR(1) | Autoregressive model (of order 1) |
| BE | Between (estimator) |
| LM | Lagrange Multiplier (test) |
| LR | Likelihood Ratio (test) |
| SAR | Spatially autoregressive (model) |
| SEM | Spatial error model |
Appendix A. Robustness Checks
Appendix A.1. Random vs. Fixed vs. Between

| RE | RE.Mreg | RE.reg | FE | BE | |
|---|---|---|---|---|---|
| RIRS | −3.43 *** | −1.89 *** | −1.56 ** | −1.27 * | −10.95 *** |
| (0.59) | (0.54) | (0.54) | (0.49) | (2.76) | |
| RGDP | 0.64 *** | 0.35 *** | 0.30 *** | 0.01 | 0.87 *** |
| (0.04) | (0.04) | (0.04) | (0.04) | (0.11) | |
| POPD | 0.05 ** | 0.04 * | 0.07 *** | −1.61 *** | 0.03 |
| (0.02) | (0.02) | (0.02) | (0.13) | (0.02) | |
| AGRI | −0.01 *** | −0.00 | −0.00 | 0.00 | −0.00 |
| (0.00) | (0.00) | (0.00) | (0.00) | (0.00) | |
| FAM | −0.27 *** | −0.03 | −0.01 | −0.04 | −0.58 ** |
| (0.07) | (0.07) | (0.07) | (0.06) | (0.19) | |
| s_idios | 0.04 | 0.04 | 0.04 | ||
| s_id | 0.11 | 0.10 | 0.09 | ||
| 0.75 | 0.80 | 0.81 | 0.81 | 0.92 | |
| Adj. | 0.74 | 0.79 | 0.81 | 0.78 | 0.91 |
| Num. obs. | 824 | 824 | 824 | 824 | 103 |
| RE | RE.Mreg | RE.reg | FE | BE | |
|---|---|---|---|---|---|
| RIRS | −5.42 *** | −2.42 ** | −1.81 * | −1.06 | −19.11 *** |
| RGDP | 0.75 *** | 0.18 ** | −0.14 * | 1.36 *** | |
| POPD | 0.11 *** | 0.07 ** | 0.16 *** | −0.58 ** | |
| AGRI | −0.01 *** | −0.00 | −0.00 | ||
| FAM | −0.55 *** | −0.07 | −0.04 | −0.02 | −1.13 *** |
| s_idios | |||||
| s_id | |||||
| Adj. | |||||
| Num. obs. | 824 | 824 | 824 | 824 | 103 |
Appendix A.2. Serial and Spatial Correlation
| NonLife | NonMTPL | MTPL | MH | Fire | Property | Other | |
|---|---|---|---|---|---|---|---|
| RIRS | −1.31 ** | −1.87 ** | −1.03 | −0.29 | −2.28 * | −3.88 ** | |
| RGDP | 0.13 *** | 0.23 *** | 0.36 * | 0.61 *** | 0.59 ** | 1.13 *** | |
| POPD | 0.05 * | 0.06 * | 0.03 * | 0.18 *** | 0.07 * | ||
| AGRI | −0.00 | −0.00 * | −0.00 | −0.00 | −0.01 * | −0.00 | −0.00 |
| FAM | −0.06 | −0.08 | −0.04 | −0.32 | −0.02 | −0.35 | −0.14 |
| AR(1) | |||||||
| s_idios | |||||||
| s_id | |||||||
| Adj. | |||||||
| Num. obs. | 824 | 824 | 824 | 515 | 515 | 515 | 515 |
| NonLife | NonMTPL | MTPL | MH | Fire | Property | Other | |
|---|---|---|---|---|---|---|---|
| RIRS | −1.36 ** | −1.87 ** | −1.01 | −0.66 | −2.29 * | −3.87 ** | |
| RGDP | 0.14 *** | 0.23 *** | 0.34 * | 0.60 *** | 0.57 ** | 1.14 *** | |
| POPD | 0.05 * | 0.06 * | 0.03 * | 0.17 *** | 0.07 * | 0.09 * | |
| AGRI | −0.00 | −0.00 * | −0.00 | −0.00 | −0.01 * | −0.00 | −0.00 |
| FAM | −0.05 | −0.07 | −0.05 | −0.20 | −0.01 | −0.27 | −0.13 |
| AR(1) | |||||||
| SEM | −0.08 | −0.03 | −0.03 | −0.03 | |||
| s_idios | |||||||
| s_id | |||||||
| Adj. | |||||||
| Num. obs. | 824 | 824 | 824 | 515 | 515 | 515 | 515 |
| 1 | The analysis can be extended to the setting where the insured is risk-averse and/or the insurer holds some market power, which will justify a markup factor with , without substantial alterations in the results. |
| 2 | See the robustness checks in the Appendix A for an explicit estimation of AR(1) error correlation in the context of the RE model. |
| 3 | A direct test for panel unit roots is infeasible because the time dimension of the present study is too short. |
| 4 | We thank an anonymous reviewer for raising this point. |
| 5 | The RE-AR(1) estimator is, in principle (i.e., when the model is well specified), the efficient alternative to our main specification RE with HC errors; but see the caveats in Calzolari and Magazzini (2012). |
References
- Arellano, Manuel. 1987. Computing robust standard errors for within estimators. Oxford Bulletin of Economics and Statistics 49: 431–34. [Google Scholar] [CrossRef]
- Arena, Marco. 2008. Does insurance market activity promote economic growth? a cross-country study for industrialized and developing countries. The Journal of Risk and Insurance 75: 921–46. [Google Scholar] [CrossRef]
- Arrow, Kenneth J. 1978. Uncertainty and the welfare economics of medical care. In Uncertainty in Economics. Amsterdam: Elsevier, pp. 345–75. [Google Scholar]
- Baltagi, Badi H. 2005. Econometric Analysis of Panel Data, 3rd ed. Chichester: Wiley. [Google Scholar]
- Baltagi, Badi H., and Qi Li. 1995. Testing ar(1) against ma(1) disturbances in an error component model. Journal of Econometrics 68: 133–51. [Google Scholar] [CrossRef]
- Baltagi, Badi H., Seuck Heun Song, Byoung Cheol Jung, and Won Koh. 2007. Testing for serial correlation, spatial autocorrelation and random effects using panel data. Journal of Econometrics 140: 5–51. [Google Scholar] [CrossRef]
- Beenstock, Michael, Gerry Dickinson, and Sajay Khajuria. 1988. The relationship between property-liability insurance premiums and income: An international analysis. The Journal of Risk and Insurance 55: 259–72. [Google Scholar] [CrossRef]
- Calzolari, Giorgio, and Laura Magazzini. 2012. Autocorrelation and masked heterogeneity in panel data models estimated by maximum likelihood. Empirical Economics 43: 145–52. [Google Scholar] [CrossRef]
- Capuano, Giuseppe. 2003. Le Dinamiche Creditizie a Livello Provinciale. Technical Report. Roma: Istituto Guglielmo Tagliacarne. [Google Scholar]
- Coakley, Jerry, Ana-Maria Fuertes, and Ron Smith. 2006. Unobserved heterogeneity in panel time series models. Computational Statistics and Data Analysis 50: 2361–80. [Google Scholar] [CrossRef]
- Cummins, J. David, and J. Francois Outreville. 1987. An international analysis of underwriting cycles in property-liability insurance. The Journal of Risk and Insurance 54: 246–62. [Google Scholar] [CrossRef]
- Eggertsson, Gauti B., and Michael Woodford. 2003. The zero bound on interest rates and optimal monetary policy. Brookings Papers on Economic Activity 1: 212–27. [Google Scholar] [CrossRef]
- Elhorst, J. Paul. 2010. Spatial panel data models. In Handbook of Applied Spatial Analysis. Edited by Manfred Fischer and Arthur Getis. Chapter C.2. Berlin: Springer, pp. 377–405. [Google Scholar]
- Esho, Neil, Anatoly Kirievsky, Damian Ward, and Ralf Zurbruegg. 2004. Law and the determinants of property-casualty insurance. The Journal of Risk and Insurance 71: 265–83. [Google Scholar] [CrossRef]
- Falciglia, Antonio. 1980. The demand for non-life insurance: A consumption-oriented model. The Geneva Papers on Risk and Insurance 17: 45–53. [Google Scholar] [CrossRef]
- Guiso, Luigi, Paola Sapienza, and Luigi Zingales. 2004. Does local financial development matter? The Quarterly Journal of Economics 119: 929–69. [Google Scholar] [CrossRef]
- MacMinn, Richard, and James Garven. 2000. On corporate insurance. In Handbook of Insurance. Edited by G. Dionne. Chapter 16. Bosaton, Dordrecht and London: Kluwer, pp. 541–64. [Google Scholar]
- Millo, Giovanni. 2014. Maximum likelihood estimation of spatially and serially correlated panels with random effects. Computational Statistics & Data Analysis 71: 914–33. [Google Scholar]
- Millo, Giovanni. 2017. A simple randomization test for spatial correlation in the presence of common factors and serial correlation. Regional Science and Urban Economics 66: 28–38. [Google Scholar] [CrossRef]
- Millo, Giovanni, and Gaetano Carmeci. 2011. Non-life insurance consumption in italy: A sub-regional panel data analysis. Journal of Geographical Systems 13: 273–98. [Google Scholar] [CrossRef]
- Millo, Giovanni, and Gaetano Carmeci. 2015. A subregional panel data analysis of life insurance consumption in italy. Journal of Risk and Insurance 82: 317–40. [Google Scholar] [CrossRef]
- Millo, Giovanni, and Pietro Millossovich. 2015. Local Finance and the Demand for Property-Casualty Insurance. Technical Report. Trieste: Assicurazioni Generali. [Google Scholar]
- Mossin, Jan. 1968. Aspects of rational insurance purchasing. Journal of Political Economy 79: 553–68. [Google Scholar] [CrossRef]
- Pesaran, M. Hashem. 2004. General Diagnostic Tests for Cross Section Dependence in Panels. Working Paper 1229. Trieste: CESifo. [Google Scholar]
- Pratt, John W. 1964. Risk aversion in the small and in the large. Econometrica 32: 122–36. [Google Scholar] [CrossRef]
- Skogh, Goran. 1989. The transaction cost theory of insurance: Contract impediments and costs. The Journal of Risk and Insurance 56: 726–32. [Google Scholar] [CrossRef]
- Swamy, Paravastu Aananta Venkata Bhattandha, and Swarnjit S. Arora. 1972. The exact finite sample properties of the estimators of coefficients in the error components regression models. Econometrica 40: 261–75. [Google Scholar] [CrossRef]
- Sweeney, George H., and T. Randolph Beard. 1992. The comparative statics of self-protection. The Journal of Risk and Insurance 59: 301–9. [Google Scholar] [CrossRef]
- Szpiro, George G. 1985. Optimal insurance coverage. The Journal of Risk and Insurance 52: 704–10. [Google Scholar] [CrossRef]
- Wooldridge, Jeffrey M. 2010. Econometric Analysis of Cross-Section and Panel Data. Cambridge: MIT Press. [Google Scholar]
- Zingales, Luigi. 2003. The weak links. Federal Reserve of S. Louis Review 7: 47–52. [Google Scholar]
| Description | Source | Sample | |
|---|---|---|---|
| RGDP | Real Gross Domestic Product per capita | Tagliacarne Inst. | 1998–2007 |
| POP | Total population | Istat | 1998–2007 |
| POPD | Population density per square km | Istat | 1998–2007 |
| RIRS | Real short-term interest rate on borrowing | Tagliacarne Inst. | 1998–2005 |
| AGRI | Share of value added, agricultural sector | Tagliacarne Inst. | 1998–2007 |
| FAM | Average number of family members | Istat | 1998–2007 |
| GWP | Gross written premiums (Non-Life) | ISVAP Yearbook | 1998–2007 |
| Gross written premiums (MTPL) | ISVAP Yearbook | 1998–2007 | |
| Gross written premiums (Other lines) | ISVAP Crime Survey | 1998–2002 |
| N-W | N-E | Center | South | Islands | |
|---|---|---|---|---|---|
| RGDP | 20,475.58 | 21,815.82 | 18,354.19 | 12,677.81 | 12,368.46 |
| POPD | 301.84 | 250.97 | 204.35 | 270.67 | 149.61 |
| RIRS | 4.47 | 4.43 | 4.60 | 6.01 | 5.76 |
| AGRI | 3.07 | 3.38 | 3.01 | 5.36 | 5.84 |
| FAM | 2.39 | 2.48 | 2.58 | 2.85 | 2.79 |
| RIRS | Non-Mt | MTPL | MH | Fire | Prop | Oth | |
|---|---|---|---|---|---|---|---|
| RIRS | 1.00 | −0.81 | −0.75 | −0.69 | −0.76 | −0.70 | −0.77 |
| Non-Motor | −0.81 | 1.00 | 0.77 | 0.77 | 0.93 | 0.90 | 0.96 |
| MTPL | −0.75 | 0.77 | 1.00 | 0.55 | 0.72 | 0.62 | 0.78 |
| Motor Hull | −0.69 | 0.77 | 0.55 | 1.00 | 0.66 | 0.68 | 0.62 |
| Fire | −0.76 | 0.93 | 0.72 | 0.66 | 1.00 | 0.89 | 0.85 |
| Property | −0.70 | 0.90 | 0.62 | 0.68 | 0.89 | 1.00 | 0.79 |
| Other | −0.77 | 0.96 | 0.78 | 0.62 | 0.85 | 0.79 | 1.00 |
| NonLife | NonMTPL | MTPL | MH | Fire | Property | Other | |
|---|---|---|---|---|---|---|---|
| RIRS | −1.89 ** | −2.42 ** | −1.44 | −0.03 | −2.67 * | 2.05 | −5.40 ** |
| (0.66) | (0.90) | (0.86) | (2.04) | (1.28) | (1.63) | (1.82) | |
| RGDP | 0.35 *** | 0.18 * | 0.39 *** | 0.31 | 0.67 *** | 0.76 *** | 1.13 *** |
| (0.07) | (0.09) | (0.07) | (0.17) | (0.16) | (0.23) | (0.18) | |
| POPD | 0.04 * | 0.07 * | 0.02 | 0.19 *** | 0.07 * | 0.10 * | 0.02 |
| (0.02) | (0.03) | (0.01) | (0.04) | (0.03) | (0.05) | (0.03) | |
| AGRI | −0.00 | −0.00 | −0.00 | 0.00 | −0.00 | 0.00 | 0.00 |
| (0.00) | (0.00) | (0.00) | (0.00) | (0.00) | (0.01) | (0.01) | |
| FAM | −0.03 | −0.07 | −0.01 | −0.69 | 0.01 | −0.66 | −0.05 |
| (0.08) | (0.10) | (0.10) | (0.48) | (0.24) | (0.48) | (0.33) | |
| BG test | 0.00 | 0.00 | 0.00 | 0.00 | 0.00 | 0.00 | 0.26 |
| RW test | 0.00 | 0.91 | 0.00 | 0.00 | 0.79 | 0.00 | 0.09 |
| s_idios | 0.04 | 0.06 | 0.05 | 0.09 | 0.06 | 0.10 | 0.10 |
| s_id | 0.10 | 0.15 | 0.10 | 0.27 | 0.21 | 0.28 | 0.19 |
| 0.80 | 0.66 | 0.78 | 0.26 | 0.71 | 0.60 | 0.68 | |
| Adj. | 0.79 | 0.66 | 0.78 | 0.24 | 0.70 | 0.59 | 0.67 |
| Num. obs. | 824 | 824 | 824 | 515 | 515 | 515 | 515 |
Disclaimer/Publisher’s Note: The statements, opinions and data contained in all publications are solely those of the individual author(s) and contributor(s) and not of MDPI and/or the editor(s). MDPI and/or the editor(s) disclaim responsibility for any injury to people or property resulting from any ideas, methods, instructions or products referred to in the content. |
© 2024 by the author. Licensee MDPI, Basel, Switzerland. This article is an open access article distributed under the terms and conditions of the Creative Commons Attribution (CC BY) license (https://creativecommons.org/licenses/by/4.0/).
Share and Cite
Millo, G. The Cost of Borrowing as a Limiting Factor of Non-Life Insurance Development: The Italian Case. Risks 2024, 12, 189. https://doi.org/10.3390/risks12120189
Millo G. The Cost of Borrowing as a Limiting Factor of Non-Life Insurance Development: The Italian Case. Risks. 2024; 12(12):189. https://doi.org/10.3390/risks12120189
Chicago/Turabian StyleMillo, Giovanni. 2024. "The Cost of Borrowing as a Limiting Factor of Non-Life Insurance Development: The Italian Case" Risks 12, no. 12: 189. https://doi.org/10.3390/risks12120189
APA StyleMillo, G. (2024). The Cost of Borrowing as a Limiting Factor of Non-Life Insurance Development: The Italian Case. Risks, 12(12), 189. https://doi.org/10.3390/risks12120189