


Perceived Risks of Autonomous Vehicles


John von Neumann Faculty of Informatics, Óbuda University, 1034 Budapest, Hungary
Risks 2023, 11(2), 26; https://doi.org/10.3390/risks11020026
Submission received: 24 November 2022
/
Revised: 5 January 2023
/
Accepted: 17 January 2023
/
Published: 21 January 2023
(This article belongs to the Special Issue New Advance of Risk Management Models)
Abstract
Whilst self-driving cars are not vehicles of the future, but technology that is already available, their acceptance and implementation is heavily limited. People consider them as technology that has a lot of risk—be it technological, IT related, or even ethical. The aim of the present paper is to enrich the existing body of literature of risk perception—and in line with this technology adaption—regarding autonomous vehicles and how they are influenced by demographic and exogenous cultural variables. Whilst the effect of cultural variables on risk perception has already been explored by several researchers, the present paper shall be considered an expansion of those works, striving to address a particular segment of risk perception—the specifics of cultural influence on risk perception regarding autonomous vehicles. Whilst risk perception is of a multifaceted nature, the current paper does not aim to provide a comprehensive understanding of the complex phenomenon under scrutiny, but intends to highlight the potentiality of cultural influences besides the often-explored individual variables when it comes to risk perception and the consequent decisions and indicates that the cultural dimensions of Geert Hofstede use to create a better understanding of perceived risks related to self-driving cars.
1. Introduction
Autonomous vehicles are considered a disruptive innovation, and are forecasted to transform the transportation industry (GOS 2019). Lanctot (2017) has predicted a 7 trillion USD-sized market by 2050; however, the forecasts seem to be overestimated. The technology acceptance seems to be stalled and varies from country to country. On the basis of an analysis of the 2014 Eurobarometer data, Hudson et al. (2019) have found that in most EU countries people still feel “uncomfortable” about autonomous vehicles. The worst attitude has been measured in Cyprus, where 77% of the population was against travelling in an autonomous vehicle. Some other countries such as China and Japan, however, regard the technology as a sensible advancement (Continental 2022; Liu et al. 2022; Fujiwara et al. 2022).
The era of self-driving cars has already arrived in the United States. The NHTSA (National Highway Traffic Safety Administration) has already updated its regulations to fit autonomous vehicles (Scribner 2021). What is more, legislations have been formulated that force car manufacturers to upgrade the autonomy level of their cars (D’Agostino et al. 2020). Whilst the technology itself is globally available, different countries respond to the situation differently when it comes to the legislative background (Hansson 2020).
Whilst self-driving cars are already available on the market, their acceptance and implementation are heavily limited, since people consider them as technology that have a lot of risk—be it technological, IT related or even ethical (Madarász and Szikora 2020). According to Potoglou et al. (2020), people in Germany, India, Japan, Sweden, the UK and the US have different perceptions of and attitudes related to autonomous vehicles, which is not only reflected in the prospective buyer’s (lack of) willingness to pay the price premium but also in how only very specific market segments are interested in the technology itself. On the one hand, these variations are owing to individual differences, such as demographic variables and individual inclinations influenced by personality, social background and past experiences. These factors are clearly identifiable in micro variations in the above cited international research results and shall be the focal point of in-depth market analysis for producers. On the other hand, there are clear patterns that are visible when comparing different countries’ respondents and their attitudes with each other. The question to be examined is whether self-driving cars, as a modern combination of hardware and software, are the very source of the attitudes towards this disruptive technology, or it is rather the national culture, which the individuals are embedded and becomes the root cause of the lack of readiness.
Current article introduces research that has been undertaken to increase the knowledge related to perceived risks of self-driving cars and how they are influenced by demographic and exogenous cultural variables. Whilst the effect of cultural variables on risk perception has already been explored by several researchers, the present paper shall be considered an expansion of those works, striving to address a particular segment of risk perception: the specifics of cultural influence on risk perception regarding autonomous vehicles. In line with this aim, the paper will present relevant international literature connected to risk and its perception, specifically highlighting the existing body of literature on the relation of risk perception and cultural variables. After a structured summary of the international findings, quantitative research and its results are presented that support the hypotheses of cultural variables having significant influence on risk perception in the chosen specific domain of autonomous vehicles.
2. Literature Review
In order to understand how public opinion and people’s risk perceptions are affected by exogenous and demographic variables, it is imperative to define risk and its implications first. In general terms, risk is a result of a perceived uncertainty. In cases where there is a perceived dissonance between reality and possibility, risk is the perceived possibility of certain actions leading to particular outcomes that have specific effects on the individual. Whenever individuals do not possess the necessary information or are not able/willing to process them when making their decisions, they are taking risks, allowing the outcomes to deviate from the expected/desired state of affairs. Many social scientists claim that risk is a social construct, which is only partially based on the (f)actual representation of real hazards (Renn 1998), hence it cannot be determined through objective probabilities of harm or technical risk estimates. Whilst it has long been proven (Covello 1983; Slovic 1987) that respondents having sufficient information of a given situation or technology that assesses the risks fairly accurately when ordering them on a Likert scale from the most serious to the least serious one, they still tend to overemphasise the risk of events that have really low probability and catastrophic results, compared to everyday/routine tasks that may occur often, but have a less large-scale effect on the functioning of the systems.
Whilst the above findings imply that an individual’s perceptions of various risks can be different, it also clearly highlights the need for understanding in where those differences lie and how they are created. What are the antecedents of the risk perception in a given situation or in our current case related to a certain technological improvement, the autonomous vehicles. Uncovering the variables behind the individual risk assessment can enable producers of the hardware (the car and its sensory and intelligent systems) as well as the software to adapt to the potential buyers/users and create solutions that improve the perception of their products and services. Nonetheless, it is true that risk cannot ever be negated, only decreased to an acceptable level, where the possibilities of the negative effects an occurrence can have on the individual are overshadowed by the potential gain the individual believes to gain from trusting the situation/agent. Even in case of risk perceptions related to technological improvements within organisations, the role of interpersonal relations is of paramount importance (Bencsik et al. 2022), highlighting that whilst individual decisions are influenced by individual risk perception and through it by individual factors, every situation shall be analysed from a holistic perspective, paying attention to all (if possible) important factors that might affect the individual’s perceived levels of risk.
In line with this, risk is an inherent part of our everyday live. However, different individuals have very different attitudes towards risk and risky situations. The notion of risk aversion refers to individuals who consciously try to decrease the unknown in every situation or tendentiously select the less risky alternatives over the riskier ones when making their decisions. These choices are stable, even if the riskier alternatives promise a higher expected outcome. However, risk aversion, or its antonym, risk friendliness, is not a black and white phenomenon. There is a limit to how much information can be processed and how much energy and effort can be dedicated to situations demanding decisions. Hence, some decisions become pre-programmed (turned into routinely executable tasks that do not necessitate too much conscious deliberation), whilst others are accepted based on trust.
Hence, trust is a fiduciary relation, where the trustor takes risks in believing that the trustee will act in his/her own best interest. Accordingly, the relationship can be easily described with the theory of the principal and the agent (Lazányi 2018) and can also be modelled as a situation with a certain amount of control and hence a certain amount of risk. In this regard, risk means giving (a certain amount of) control over to the trustee by trusting that he/she will not betray the expectations of the trustor. This later definition is especially important when it comes to the risk-taking behaviour of people indicated in their attitudes towards autonomous vehicles.
NHTSA data (Campbell et al. 2018) indicate that 94% percent of critical traffic accidents are due to human error, hence, the riskiest agent in the equation of traffic is the human. In accordance with this, intelligent systems are able to make less risky, “optimal” decisions whilst obtaining multiple times more information about any/every situation through the advanced sensory systems and analysing available data in real time. Whilst self-driving cars have been created with safety in mind, with vehicles decreasing the average level of risk in traffic situations by always heeding the speed limit, and people keeping a safe distance from the lead vehicle or other entities of the traffic and striving to protect lives and assets (Takács et al. 2018), the perception regarding this feature is not clearly positive either. Even when it comes to the protection of lives, ethical dilemmas arise regarding whose life is of higher importance/value, such as who to save in a situation where there can be no perfect solutions, yet again increasing the perceived level of risk by the potential user.
The same risk and perceived uncertainty arises in regard to other potential benefits of autonomous vehicles, be it the more environmental-friendly solutions that reduce the environmental impact of traffic, or emission or traffic noise (Wang et al. 2019; Kopelias et al. 2020). Whilst the aim of novel technologies is clearly to protect the environment by decreasing the harmful effects on the natural environment, the pursuit is not necessarily realised by the greater public (Szikora and Madarász 2017; Nordhoff et al. 2018). What is more, technologies used for creating autonomous vehicles are also regarded as full of environmental risks. De Souza et al. (2018) have for example highlighted that whilst electronic vehicles have the lowest level of emissions among all technologies compared on a distance of 1 km in average, lithium-ion batteries have the highest level of human toxicity of all technologies. Hence, even when it comes to its environmental effects, some regard autonomous technologies as more risky, whilst some others as less.
In order to understand the above mentioned differences and the underlying risk perception of potential users, several models have been developed in the past few years, including the Theory of Reasoned Action (TRA) (Burnkrant and Page 1988; Niranjan and de Haan 2018), the Technology Acceptance Model (Davis 1989; Baccarella et al. 2020), the Theory of Planned Behavior (TPB) (Ajzen 1985; Haustein and Jensen 2018; Kaye et al. 2020), the Unified Theory of Acceptance and Use of Technology (UTAUT) (Venkatesh et al. 2003; Nordhoff et al. 2016; Venkatesh 2022). Many have explored multiple variables that potentially influence the perceived level of risk and its consequence; the acceptance of automated vehicles among which demographic variables, past experiences, domain specific knowledge, performance and effort expectancy have been addressed often in regard.
Gender has always been a prominent factor influencing risk perception, since females are generally more anxious, are more susceptible to risk and as a consequence are more risk averse (Maxfield et al. 2010). The Innovation Diffusion Theory (IDT) proposed by Rogers et al. (2014) suggested that five attributes are: (1) relative advantage; (2) compatibility; (3) complexity; (4) trialability; and (5) observability and are likely to influence the technology readiness of the individuals. However, Dutta and Omolayole (2016) have provided data to support the gendered aspect of all five of the factors. Hulse et al. (2018) have also found that men are more likely to have a positive attitude towards automated vehicles and are less concerned about the potential related risks. Rice and Winter (2019) even argue on the basis of three different case studies that gender is more important than age when it comes to differences in technology acceptance. They also elaborated that the difference is mainly stemming from the higher level of fear related to the unknown, the perceived level of complexity of autonomous vehicles.
Risk perception is not only gendered as highlighted in the previous paragraph, but the gender differences themselves are also contextual since they are influenced by the cultural expectations the individual is embedded into (Anania et al. 2018) In line with this, attitudinal and behavioural differences between males and females reflect their cultural values and norms and further segregate them when it comes to everyday roles and actions, the same as in their relation with risk. Whilst cultural variables supposedly influence both genders equally (Hofstede 2005), it is not to be debated that they can still influence people belonging to different genders differently (Watkins et al. 1998; Stedham and Yamamura 2004; Moghaddam 2010; Le 2021).
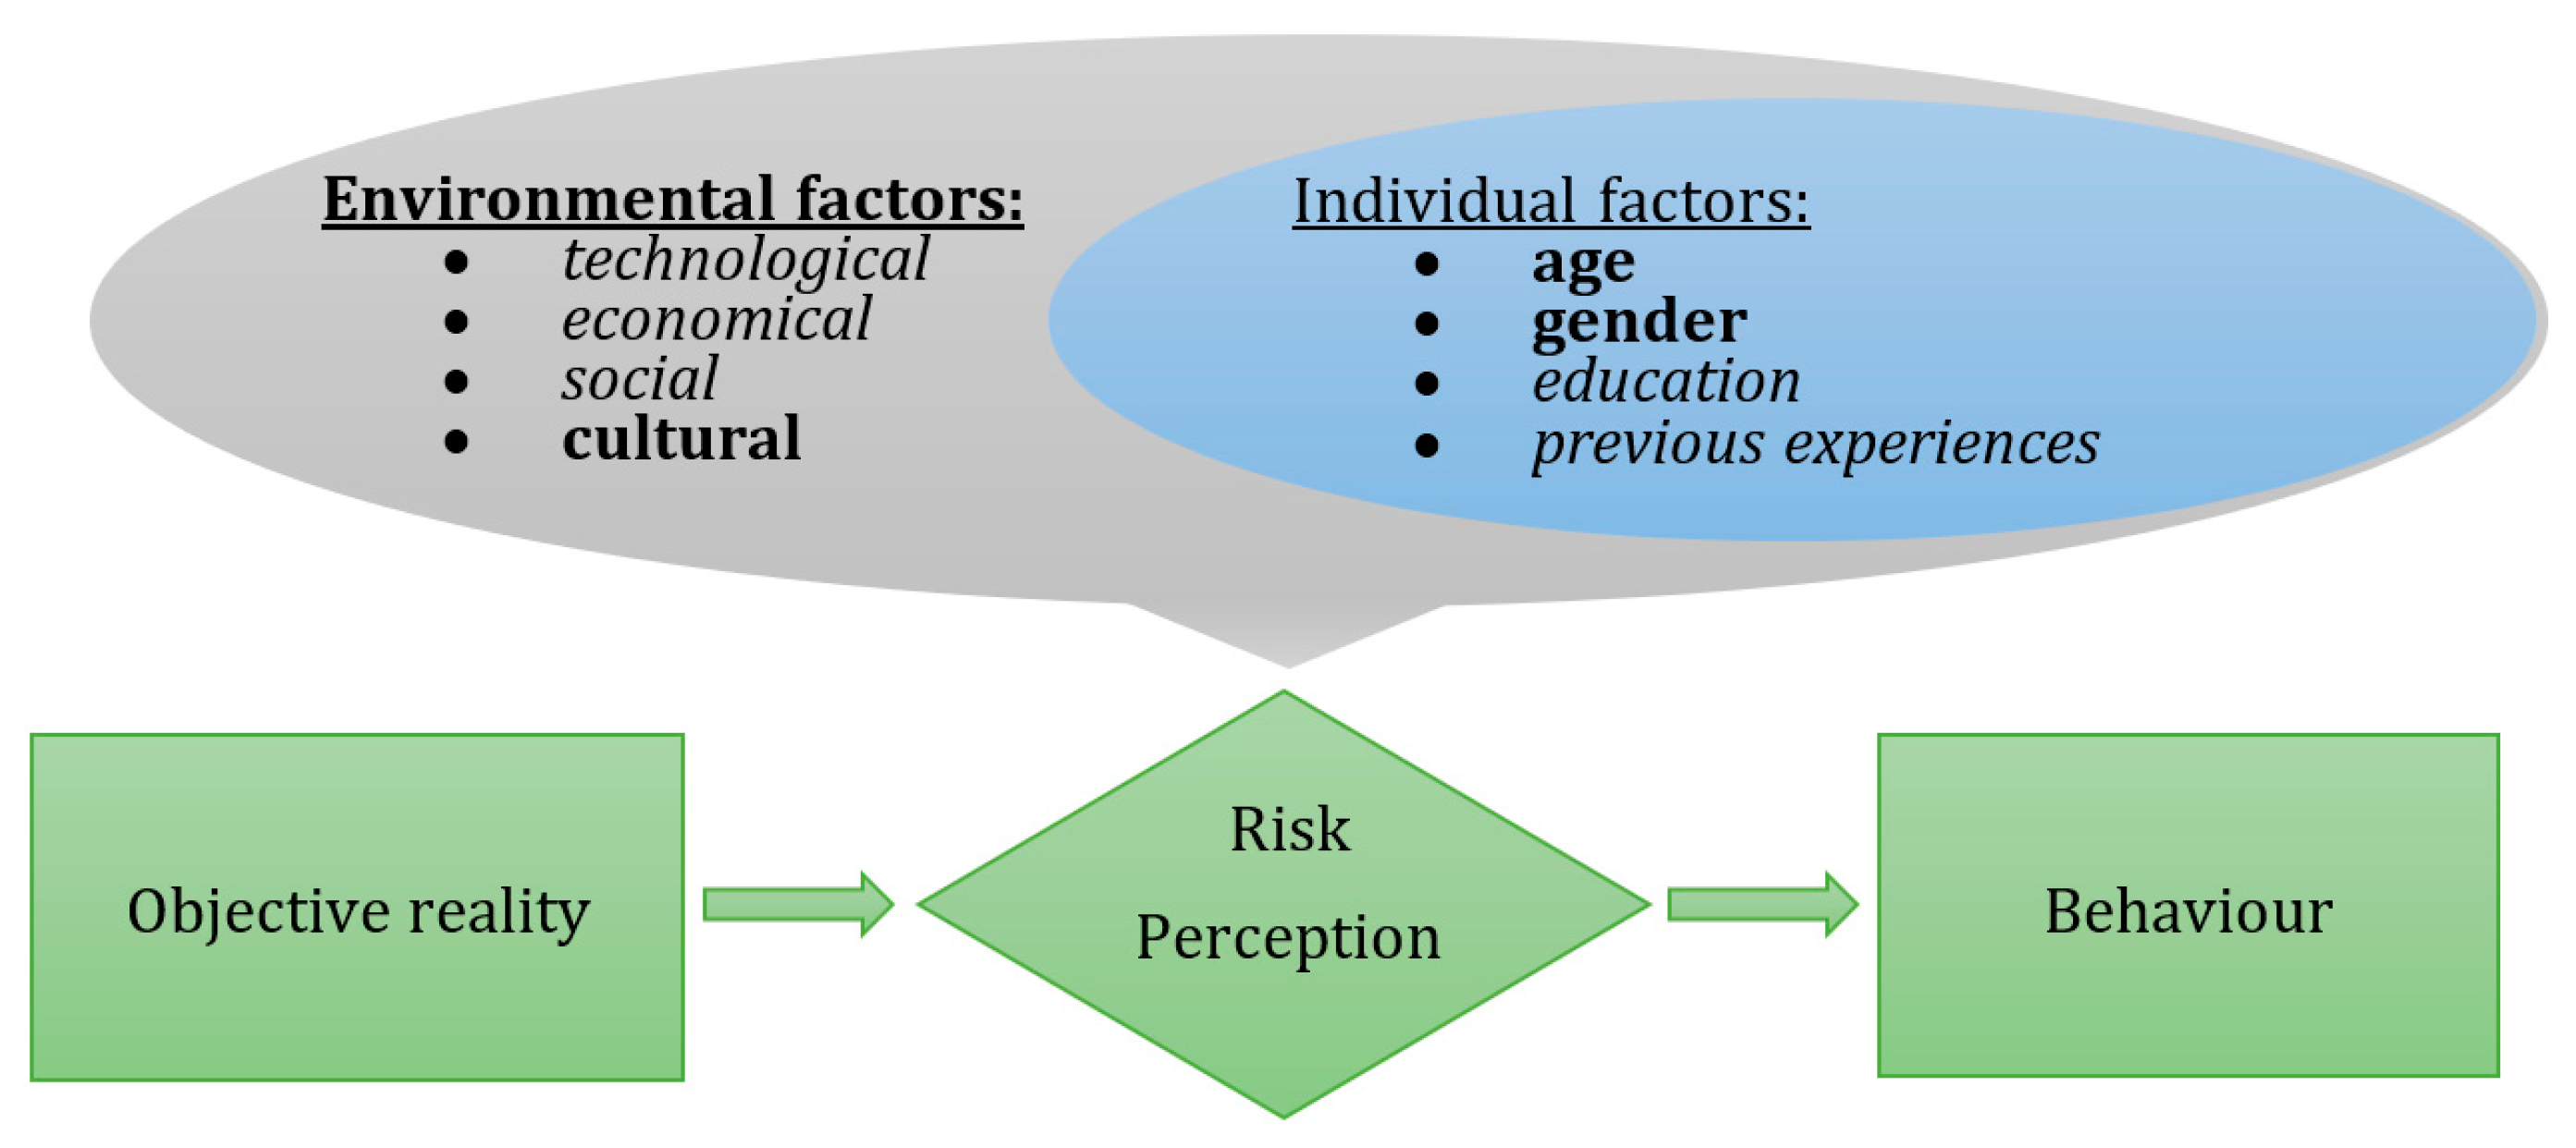
Accepting the multifaceted nature of technology readiness and the complex and intricate nature of risk perception, the current study endeavours to look into environmental and individual factors as potential determinants in the acceptance of self-driving cars, whilst keeping in mind that the factors explored in the paper might not enable a complete understanding of the internal logic of decisions made by potential users or of the extent of perceived risks related to autonomous vehicles. The following simple figure highlights the variables influencing individual perceptions to be explored in the current study, namely the demographic factors, age and gender, as well as the situational factor, culture.
3. Research Questions and Hypothesis
In order to understand how individuals perceive the levels of risks and make their choices in regard to autonomous vehicles, various hypotheses have been created in line with the model presented on Figure 1.
The main research question explored through the paper is: What influences the individual risk perceptions and through them the choices when it comes to self-driving cars? Since the question is rather general, the research has been designed to focus on demographic (age, gender) and cultural variables, hence the following hypotheses are explored:
Hypothesis 1 (H1).
The risk perceptions of males and females are different when it comes to autonomous vehicles.
Whilst much of the international literature indicates that males are much more open to technological developments (Gallivan 2004; Dutta and Omolayole 2016), in the case of autonomous vehicles it is not about the technology itself, but the extreme lack of control when it comes to stage six autonomy; hence, trust is a multifaceted phenomenon, where the relevant knowledge might not be a sufficient explanatory factor. Dudziak et al. (2021) have clearly highlighted how Polish ladies have different attitudes towards self-driving vehicles compared to their male counterparts. Cveticanin and Ninkov (2021) have arrived at the same conclusions with a Serbian sample.
Hypothesis 2 (H2).
The individual choices related to autonomous vehicles—in line with the perceived levels of risks—vary with age.
In line with the relevant literature, elderly people are much less trusting when it comes to technology in general (Wildavsky and Dake 1990) and autonomous systems, or self-driving cars specifically (Wang and Zhao 2019; Jing et al. 2020), and this paper suggests a change in patterns even within a certain age group, namely generation Z, which is less likely to be impacted by generational influences and more by the personal experience “maturity“ of the individuals. In line with this, Andrei et al. (2022), after analyzing Romanian data, have also arrived at the conclusion that older people need more information regarding self-driving technology and its positive effects to raise their awareness and acceptance.
Hypothesis 3 (H3).
The risk perception of autonomous vehicles is affected by cultural factors.
Whilst it is explored in many settings how the cultural embeddedness is of utmost importance when it comes to individual choices, the international literature on exploring decisions related to autonomous vehicles from a cultural point of view is scarce. Whilst Weber and Hsee (1998) argue that the perception of the risk is culturally influenced and not the attitude towards the perceived risk, Moody et al. (2020) suggest that the country level differences are due to the different levels of infrastructures, motorisation and technology. Papadimitriou et al. (2022) have also found that the perception of autonomous vehicles, through the ethical issues complete autonomy might raise, is not only influenced by demographic and socioeconomic factors, but also by cultural variables. Hence, current research aims to contribute to the existing body of literature regarding how cultural factors might affect individual risk perception.
4. Research Methodology and Sample
In order to be able to define the set of adequate questions, two focus group interviews with researchers, proponents and opponents of self-driving vehicles have been conducted in Hungarian and in the English language, the aim of which was to have an insight into potential influencing factors. The topics raised by the respondents were mostly in line with the relevant international literature and their findings when it came to the fears, but the respondents did not list the whole variety of potential positive side effects, such as the opportunity for economic carpooling and sharing or reducing the occurrence of parking issues (Salum et al. 2022).
As a result, there are positive influencing factors, beliefs such as ‘Self-driving cars will postively affect emission’, ‘Self-driving cars will positively affect the society’ and ‘Self-driving cars will reduce the occurrence of accidents’, as well as negative factors related to autonomous cars, fears such as ‘Hackers tamper with the car’, ‘The self-driving system breaks down’, ‘The car decides differently from how I would like it to’, ‘Control cannot be regained’, ‘The security of personal data cannot be provided’. In addition, general technology related fear has also been added as a potential influencing variable in line with the ‘joy of driving’ as a potential loss, since both focus groups have indicated their relevance in connection with attitudes towards self-driving cars.
As a final result, an English language questionnaire containing 20 single, multiple choice and scaling questions (measured on five-point Likert scales) has been created and validated by the members of the focus groups. The questionnaire did not target any cultural aspects, but has focused on the risk perceptions, fears and hopes of the respondents related to autonomous vehicles.
In order to be able to respond to the third hypothesis and explore its validity, Geert Hofstede’s (2011) publicly available cultural-dimensional measures were used as an addition to the information obtained through the questionnaire. In line with the selected databases providing cultural variables, the ‘Power distance’, ‘Individualism’, ‘Masculinity’, ‘Uncertainty avoidance’, ‘Long Term Orientation’ and ‘Indulgence’ dimensions of the respective national cultures have been explored. The variables are provided by the selected source on a 0–100 scale, where 0 represents the lowest and 100 the highest potential value, indicating either a complete lack of or an extreme prevalence of the explored cultural factor in the given country’s national culture.
Whilst this solution also has its weakness, since the data provided on the webpage (www.hofstede-insights.com/country-comparison/, accessed on 18 October 2022) are the results of longitudinal research, therefore representing an average value over time, the advantage of this solution is that it provides a quantifiable and validated approach regarding the relevant national culture, hence it enables the assessment of the potential cultural effects. The decision has been made to facilitate the analysis of a diverse nationality sample with smaller subsamples of different nationalities in an efficient way, since exploring the individual’s own perceptions of their home country’s national cultures would have been heavily affected (biased) by their experience of being an international student abroad (Lazányi et al. 2017).
The questionnaire was disseminated online (with the help of Google Forms) among students studying at Óbuda University on English-speaking programs at two faculties (Keleti Faculty of Business and Management and John von Neumann Faculty of Informatics). The initial sampling shall be considered targeted, since all students studying at the two faculties have received the call for participation via their online student administration systems (Neptun). When designing the research, the idea was to target students from the same age group, GenZ, and with similar general understanding (the students being enrolled into technical management and computer science engineering programs, where autonomous vehicles are not part of the core curriculum, but technological developments are often addressed via the study materials). However, since the number of foreign respondents were insufficient in the first 2 weeks, international students were requested to disseminate the questionnaire among their peers from Gen Z; hence, the sampling ended up as a snowball approach. Within a timeframe of 5 weeks, from 5 September 2022 to 9 October 2022, 493 responses have been collected. (13 responses had to be excluded owing to the responses coming from students not belonging to the targeted age group). Unfortunately, from the valid responses two countries (Kyrgyzstan and Mongolia) and the representative students had to be removed, since they had no Hofstede indicators, which was necessary to evaluate the cultural effects influencing the students’ individual decisions.
In line with the initial idea, a representative international sample was not the purpose of the research, and it also could not have been created, hence a measure—the inclusion of the cultural dimension scores from Hofstede’s country-comparison platform—with the help of which an unbalanced and varied sample could be explored was introduced as already explained above.
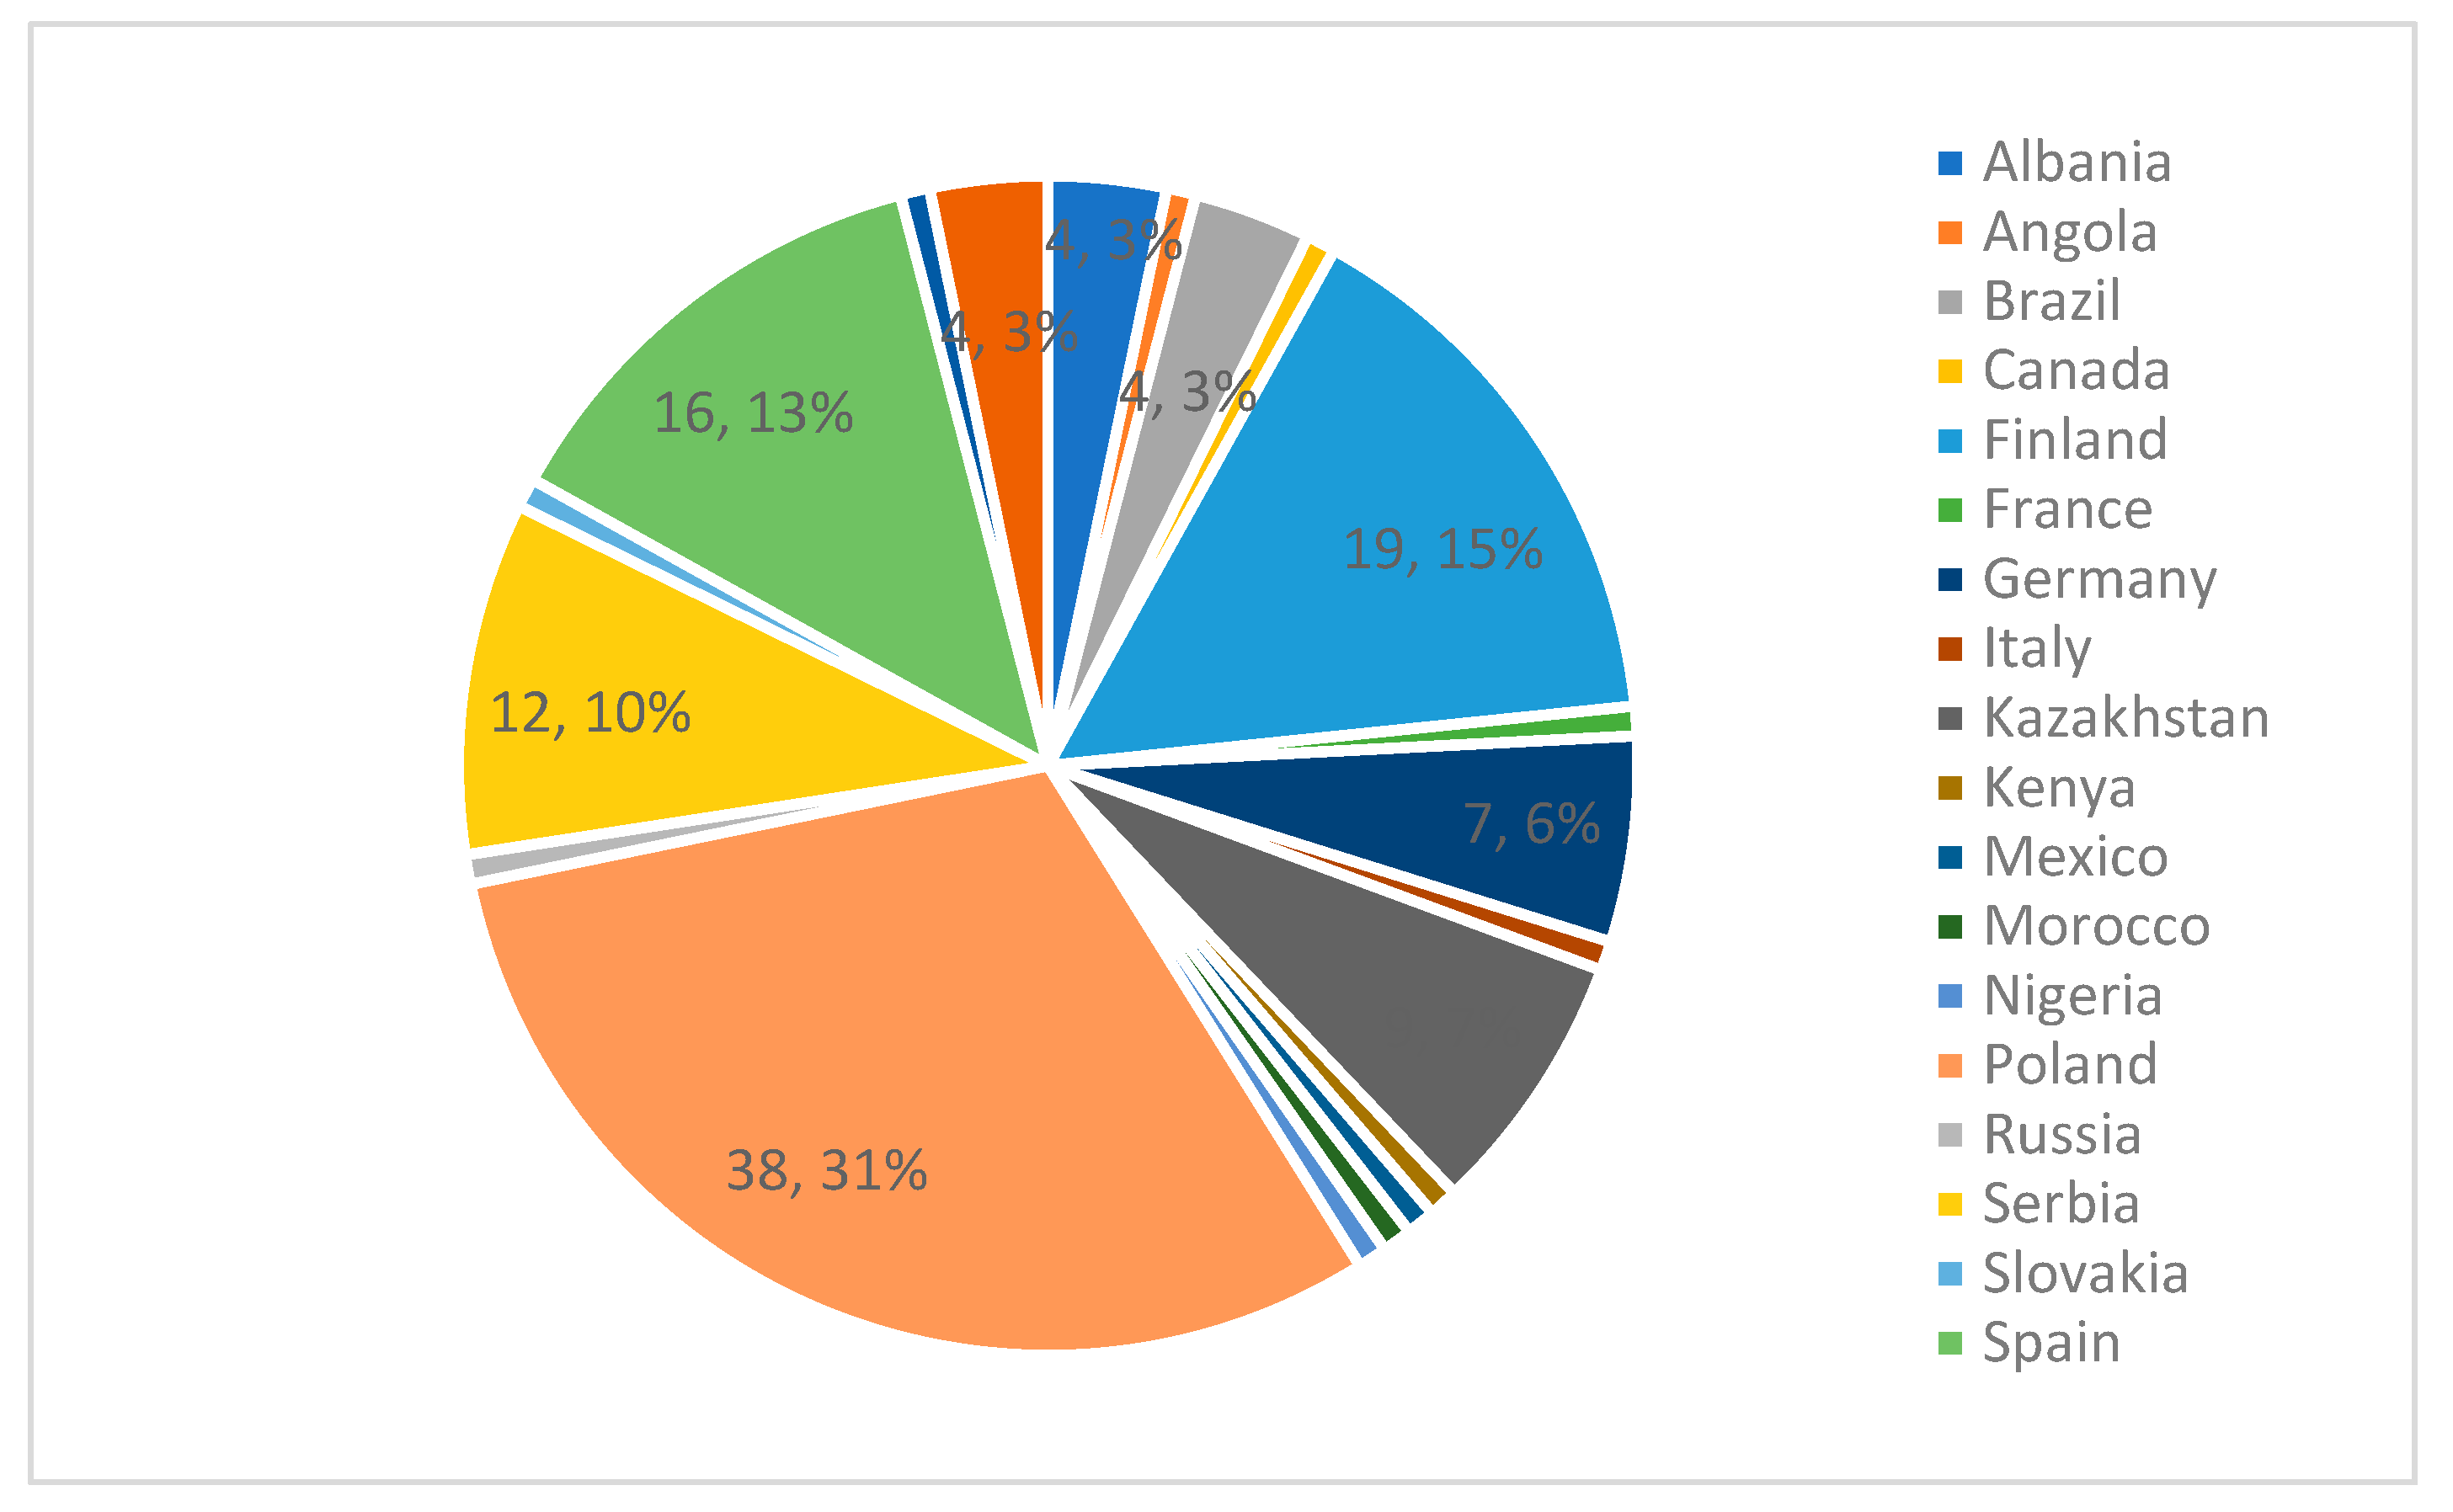
After omitting the not-relevant or not-analyzable data from the collected responses, the sample contained 467 responses. More than 2/3 of the respondents (74%) were from Hungary. The remaining 26%’s distribution by countries of origin is displayed in Figure 2. Only countries with responses higher than 1% are indicated with a number of respondents and percentages (N; %), but all represented countries’ (N = 20) names are displayed on the graph. As it is easily visible, the majority of foreign respondents were from Poland (31%), followed by Finland (15%), Spain (13%) and Serbia (10%).
Whilst it is not critical to separate Hungarian vs. non-Hungarian respondents, when it comes to research on cultural variables’ effect on risk perception, the effect of certain demographic variables, such as age or education, could only be explored on the Hungarian subsample separately, since other nationalities unfortunately did not have a sufficient number of respondents to have a relevant statistical analysis of these variables; furthermore, treating the whole sample as a homogenous set would have gone against the purpose of the research, that being the exploration of cultural influences.
As indicated in Table 1. below, the Hungarian and non-Hungarian sample was comparable when it came to the age of the respondents, since the Hungarian population’s age was 22.2 (Std. Dev. 2.257) and the non-Hungarian respondents had an average age of 22.67 (Std. Dev. 2.698), where the higher standard deviation can be explained by the smaller number of respondents in the subsample.
The disparity between the two subsets occurred regarding the reported gender of the respondents. Respondents were requested to either identify themselves as males or females or could indicate their preference as “I prefer not to identify with either”.
Whilst in the Hungarian sample only 35% of the respondents were female, in the non-Hungarian subgroup 56% of the respondents were female. This is a significant difference; hence, the most important analysis was to test the differences between both genders in the Hungarian sample (in the non-Hungarian sample, because of the potential effect of multiple nationalities, and in the small sample size for certain countries such a comparison could not lead to trustworthy data. Here it is important to note that four respondents preferred not to identify themselves with either gender; hence, in later gender-based comparisons they will be excluded from the analysis).
5. Research Results
In the following chapter, research results are organised in line with the logical model displayed in Figure 1 to look into the hypotheses listed previously. Whilst gender as a variable will be explored independently, as well as through the lens of cultural dimensions, age as a variable could only be explored to a more limited extent, owing to the buildup of the sample.
5.1. Differences Caused by Gender and Age Influences
Exploring the data obtained through the research, there was no significant difference in the ages of the male and female respondents, so the two samples were considered comparable from this regard. Table 2 highlights only the factors that indicate significant differences based on the respondent’s gender.
On the basis of the t-test results, males perceive autonomous vehicles as less risky, have on average a lower level of fear, in general and regarding specific fearful instances as well. Since they regard the autonomous technology as less fearful, they are more open about it being introduced on the streets and are more eager to try it. What is more, they even perceive the positive externalities of the autonomous vehicles as more relevant. Whilst the extent to which the male respondents have perceived the risks related to self-driving cars differ for every related statement, the tendency is clearly visible.
In line with this result, the age as an influencing variable has been tested for both genders as well as for the whole Hungarian subset. Age as a scale variable and the perceptions of the respondents measured on a Likert scale were analysed with the help of the Pearson correlation. The age of the Hungarian respondents in general did not correlate with any of the explored variables; however, there were some slight correlations when the age as a mediating variable was explored separately for the two genders, as indicated in Table 3.
Interestingly, the perceived levels of risk decreased the older the female respondents got, albeit only slightly, whilst the male respondents were more aware of potential risks, becoming more security conscious when it came to the statement “The security of personal data cannot be provided”, yet the relation here was also weak. Whilst the research has targeted people from Gen Z, hence the age difference of the respondents being not extreme, the slight difference might underline the importance of information in regard to the perceived level of risk, as also indicated in the international literature. (Hypothetically, the older the respondents were, the more time they had to look into this novel technology and its implications.) The more the respondents knew about the technology and its effects, the more trustworthy they deemed it to be (in case of female respondents), or the more they could realise the consequent security risks (in case of male respondents).
5.2. Differences Caused by Cultural Influences
In order to explore the effects of such cultural influences, additional variables stemming from Geert Hofstede’s research (2011) have been added to the list of variables explored through the question in the online questionnaire. Owing to the overrepresentation of Hungarian respondents and the segmented nature of non-Hungarians in the sample, a normal distribution of the variables could not be expected.
These variables had only very weak or no correlation with the attitudes of the respondents as indicated in Table 4, where only variables with significant correlations are indicated for easier understanding. Whilst some of the correlations were significant at a level of p < 0.01, cultural variables seem not to have a strong- or even medium-strength effect on the risk perceptions of the respondents.
As indicated by Table 4, different cultural variables have various effects on the perceived relevance of different risks. Whilst all in all the correlations were rather weak, the perceived risk of novel technology (such as “Hackers tamper with the car” and “The self-driving system breaks down) and fear for various professionals losing their jobs (“People (in various professions, such as chauffeurs) will lose their jobs”) shows results that seem to be indicative of an existing relation. The highest (negative) correlation (Correl.: −0.222; Sig. 0.000)) was measured between “individualism” and fear for various professionals losing their jobs (“People (in various professions, such as chauffeurs) will lose their jobs”). The more of a collectivistic culture the individual was embedded into, the more concern they showed for others.
Whilst it has already been proven previously that females perceive the risks related to autonomous vehicles more intensely, the dataset has been divided by gender into two subsets and the correlation of the cultural variables with those describing the respondents’ perceptions have been calculated separately. Table 5 and Table 6 will only display correlations that were significant.
When exploring the relations of cultural dimensions and the male respondents’ risk perceptions (indicated in Table 4), the correlations were stronger than on the whole sample, underlining the importance of exploring the effects of gender as a mediating variable when it comes to cultural influences.
“Masculinity” as a cultural variable was negatively correlated (Correl.: −0.227; Sig.: 0.000) with fear for various professionals losing their jobs (“People (in various professions, such as chauffeurs) will lose their jobs”), since “masculinity”, by definition is less about empathy and more about competition. What is more, the cultural dimension’s results were in line with the social gender aspect of male respondents regarding new technologies as less risky, which is in line with traditional gender stereotypes as well.
Interestingly, male respondents were able to relate to people losing their jobs as a potential negative side effect of the new technology more in cultures with bigger power distances (Correl.: 0.329; Sig.: 0.000). Whilst on the one hand there does not seem to be a close relation between the two variables, if we regard that the majority of the sample consists of students, who are studying and only a part of them are working to contribute to/sustain themselves, they seem to be able to empathise more with the employees losing their jobs.
In more individualistic cultures, male respondents were less concerned about some professionals losing their jobs, or the potential hazards of the technology (“Hackers tamper with the car” Correl.: −0.172; Sig.: 0.000; “The self-driving system breaks down” Correl.: −0.210; Sig.: 0.004; “The car decides different from how I would like it to” Correl.: −0.133; Sig.: 0.028; “Control cannot be regained” Correl.: −0.129; Sig: 0.032; “The security of personal data cannot be provided” Correl.: −0.152; Sig.: 0.012) and also were less afraid of the novelty of self-driving technology (“Fear from the new technology” Correl.: −0.294; Sig.: 0.000).
In the case of the female respondents, in line with the data displayed in Table 6, the correlations were also weak. However, interestingly the “power distance” as a cultural perspective was negatively correlated with the intensity of several risks’ perceived level, such as “The self-driving system breaks down” Correl.: −0.169; Sig.: 0.020; “The car decides different from how I would like it to” Correl.: 0.211; Sig.: 0.004 and “Fear from the new technology” Correl.: −0.147; Sig.: 0.044—whilst positively with potential positive outcomes such as “Self-driving cars will positively affect the society” (Correl.: 0.143; Sig.: 0.050) and “Self-driving cars will reduce the occurrence of accidents” (Correl.: 0.154; Sig.: 0.034).
“Individualism” and “masculinity” on the other hand had a reverse effect on the perceptions of female respondents. The more individualistic the culture was the less respondents considered the positive effects of autonomous technologies (“Self-driving cars will positively affect the society” Correl.: −0.148; Sig.: 0.042; “Self-driving cars will reduce the occurrence of accidents” Correl.: −0.177; Sig.: 0.0155). The more masculine a culture was, the less female respondents were interested in how “Self-driving cars will reduce the occurrence of accidents” Correl.: −0.239; Sig.: 0.001).
In the case of the explored subsample, “long term orientation” did not corelate with any of the measured variables.
To sum the culture-related results up, we can state that whilst cultural variables do not significantly correlate with attitudinal variables on the whole sample, if we consider their effects by gender, the correlations are much stronger. In line with this, culture as a variable might not be an independent influencing factor, but it shall be considered as a mitigating/shifting factor when it comes to the effects of gender on perceptions and decision making; or the other way around, gender might be an important change factor when it comes to evaluating the effects of cultural dimensions. In order to explore the relation of these variables, a hierarchical regression model shall be created in the later phases of the research, which, on the basis of the current unbalanced sample, unfortunately could not successfully be created.
6. Discussion
Whilst the aim of the paper was to explore how individuals perceive risks and make decisions in regard to autonomous vehicles, various hypotheses have been tested concerning the potential influencing variables recommended by the relevant international literature. The differences in (risk) perception based on gender, age and national culture have been explored in order to test three basic hypotheses: one, the choices of males and females are different; two, the choices vary with age; and three, the choices are affected by cultural factors.
The data presented in the current study also support that male respondents (of the same age and nationality) had on average a lower level of fear, in general and regarding specific risks related to the introduction of self-driving cars as well. In line with their lower levels of risk, they even perceived the positive externalities of the autonomous vehicles as more relevant.
These findings are in line with the findings of the relevant international literature. According to the study of Maxfield et al. (2010), females are generally more anxious and are, as a consequence, more susceptible to risk; hence, they try to make choices they perceive as less risky. Much of the international literature indicate that females are less likely to accept new technology, mainly due to their higher level of fear related to the unknown, stemming from the perceived level of complexity (Dutta and Omolayole 2016; Hulse et al. 2018; Rice and Winter 2019). In line with this, Dutta and Omolayole (2016) indicate that males are much more open to technological developments. Dudziak et al. (2021), in accordance with Cveticanin and Ninkov (2021), have also arrived at the same conclusion that male and female attitudes regarding self-driving cars are significantly different. Hence, the hypothesis that risk aversion has a gendered perspective can be verified not only on the basis of current research data but is also supported by the relevant international literature.
Even though the very focus of the research presented in the current paper was Generation Z, even within this age group there were slight differences to be identified, especially when the male and female respondents were explored separately. In line with the data presented in the current paper, Andrei et al. (2022) have also arrived at the conclusion that older people need different treatment when it comes to raising their awareness and acceptance to positively influence their attitudes towards autonomous vehicles. This difference, that older people are much less trusting when it comes to new technology in general (Wang and Zhao 2019; Jing et al. 2020), is also supported by the international literature; there have only been a few papers exploring the perceived level of risk or the technology acceptance of young people (Lazányi 2018; Huang et al. 2022), and the number of those of other age groups is also limited (Szikora and Madarász 2018). In line with this, even though age as a variable has been proven to be important, the within-generation differences have yet to be further explored and additional research is needed to accept our hypothesis.
What is more, the effect of gender in connection to age as an influencing variable was also highlighted by the research results. Hence the relation of age, especially age differences within a certain age group, and risk perception have yet to be explored in depth.
Data presented in the current paper highlight the importance of various cultural dimensions (Hofstede 2011) when it comes to risk perception and individual choices. Whilst the variables indicating the cultural dimensions had only very weak or no correlation with the attitudes of the respondents in general (the highest correlation found between the value of collectivism and concern for others), interesting patterns could be identified when we have explored the effects for different genders separately. For example, the data of female respondents highlighted that the bigger the power distance in their national culture was, the less they perceived the risk of autonomous vehicles and the more the potential benefits connected to them.
The international literature on exploring decisions related to autonomous vehicles from a cultural point of view is scarce, despite the cultural embeddedness of risk perception and decision-making being widely discussed. However, the few available sources also support the notion that risk perception and decision making are culturally embedded. For example, Anania et al. (2018) findings suggest that risk perception is not only gendered, but the gender differences themselves are also contextual since they are influenced by the cultural expectations the individual is embedded into. On the other hand, according to Moody et al. (2020), country level differences exist because of different levels of infrastructures, motorisation and technology, and are thus owing to economic factors. In accordance with this, whilst the researched cultural variables showed a weak correlation with factors exploring the respondents’ perceptions regarding self-driving cars, further research is needed to clarify whether socio-cultural or economic factors, or both, lie in the background of international differences.
In conclusion, whilst the current article has introduced quantitative research that has been undertaken to increase the knowledge related to perceived risks of self-driving cars and how they are influenced by demographic and exogenous cultural variables, it has also managed to reflect on three hypotheses that have proved to be at least in part to be valid in the light of the research results, with the results underlining the multifaceted nature of risk (perception). Whilst the effect of cultural variables on risk perception has already been explored by several researchers, the present paper shall be considered an expansion of those works.
Whilst the sample was far from representative, especially when it came to the international respondents and their relative ratio in the sample, differences were clearly underlined by the results presented in the paper. In line with this, the necessity to look into the cultural aspect of risk perception through a gendered perspective has proven to be relevant in the exploration of technology acceptance in general and especially perceptions regarding autonomous vehicles.
Accordingly, the practical application of the current article is twofold. On the one hand, in order to increase the acceptance of self-driving technology, producers have to take a transnational or a better multi-domestic approach instead of their current global strategy. On the other hand, in light of current results it seems to be inevitable for national governments to adapt their legislative backgrounds to the specifics of their cultures to support the spread of autonomous technologies. These two efforts, especially if combined, can lead to faster market development and accordingly better access to the positive economic, societal/societal and environmental externalities of self-driving vehicles.
7. Limitations of the Study and Future Ideas
Whilst the research was able to respond to the research question and reflect on the validity of the three hypotheses regarding influencing variables, the research has multiple limitations. The first and most important limitation is the imbalanced nature of the sample, which is not only reflected in the lack of normality of cultural variables, but also in how certain demographic variables (gender and age) could not be explored on the whole sample but only on its specific subset.
In line with this, current research shall be expanded to include more respondents, possibly from more countries, to have a more diverse cultural picture, but also in order to be able to formulate a model where the relation of the variables can also be explored; a more balanced sample is also necessary. In its current state the sample size and especially the unbalanced nature of the sample (too few non-Hungarians with especially small respective subsets) does not support the creation of a more complex model yet. In the further phase of the research, however, the creation of a SEM model is inevitable.
Funding
This research received no external funding.
Data Availability Statement
The data presented in this study are available on request from the corresponding author.
Conflicts of Interest
The author declares no conflict of interest.
References
- Ajzen, Icek. 1985. From intentions to actions: A theory of planned behavior. In Action Control. Edited by Julius Kuhl and Jürgen Beckmann. Heidelberg: Springer, pp. 11–39. [Google Scholar]
- Anania, Emily C., Stephen Rice, Scott R. Winter, Mattie. N. Milner, Nathan. W. Walters, and Matthew Pierce. 2018. Why people are not willing to let their children ride in driverless school buses: A gender and nationality comparison. Social Sciences 7: 34. [Google Scholar] [CrossRef]
- Andrei, Liliana, Mihaela Hermina Negulescu, and Oana Luca. 2022. Premises for the Future Deployment of Automated and Connected Transport in Romania Considering Citizens’ Perceptions and Attitudes towards Automated Vehicles. Energies 15: 1698. [Google Scholar] [CrossRef]
- Baccarella, Christian V., Timm F. Wagner, Christian W. Scheiner, Lukas Maier, and Kai-Ingo Voigt. 2020. Investigating consumer acceptance of autonomous technologies: The case of self-driving automobiles. European Journal of Innovation Management 24: 1210–32. [Google Scholar] [CrossRef]
- Bencsik, Andrea, Dávid Máté Hargitai, and Anastasia Kulachinskaya. 2022. Trust in and Risk of Technology in Organizational Digitalization. Risks 10: 90. [Google Scholar] [CrossRef]
- Burnkrant, Robert E., and Thomas J. Page, Jr. 1988. The structure and antecedents of the normative and attitudinal components of Fishbein’s theory of reasoned action. Journal of Experimental Social Psychology 24: 66–87. [Google Scholar] [CrossRef]
- Campbell, John L., James L. Brown, Justin S. Graving, Christian M. Richard, Monica G. Lichty, L. Paige Bacon, Justin F. Morgan, Hong Li, Diane N. Williams, and Thomas Sanquist. 2018. Human Factors Design Guidance for Level 2 and Level 3 Automated Driving Concepts. Report No. DOT HS 812 555. Washington, DC: National Highway Traffic Safety Administration, August. [Google Scholar]
- Continental. 2022. The 2018 Continental Mobility Study 2022. Available online: https://www.continental.com/en/press/studies-publications/continental-mobility-studies/mobility-study-2022/ (accessed on 18 October 2022).
- Covello, Vincent T. 1983. The perception of technological risks: A literature review. Technological Forecasting and Social Change 23: 285–97. [Google Scholar] [CrossRef]
- Cveticanin, Livija, and Ivona Ninkov. 2021. Pro and contra for self-driving car: Public opinion in Serbia. Paper presented at the ICONST EST’21, Budva, Montenegro, 8–10 September 2021. [Google Scholar]
- D’Agostino, Mollie, Kelly Fleming, Kristin White, Marc Scribner, and Baruch Feigenbaum. 2020. Policy and Regulation of Automated Vehicles: Spotlight on US Federal and States. Road Vehicle Automation 8: 22–39. [Google Scholar]
- Davis, Fred D. 1989. Perceived usefulness, perceived ease of use, and user acceptance of information technology. MIS Quarterly 13: 319–40. [Google Scholar] [CrossRef]
- De Souza, Lidiane La Picirelli, Electo Eduardo Silva Lora, José Carlos Escobar Palacio, Mateus Henrique Rocha, Maria Luiza Grillo Renó, and Osvaldó José Venturini. 2018. Comparative environmental life cycle assessment of conventional vehicles with different fuel options, plug-in hybrid and electric vehicles for a sustainable transportation system in Brazil. Journal of Cleaner Production 203: 444–68. [Google Scholar] [CrossRef]
- Dudziak, Agnieszka, Monika Stoma, Andrzej Kuranc, and Jacek Caban. 2021. Assessment of Social Acceptance for Autonomous Vehicles in Southeastern Poland. Energies 14: 5778. [Google Scholar] [CrossRef]
- Dutta, Sameer, and Olu Omolayole. 2016. Are there differences between men and women in information technology innovation adoption behaviors: A theoretical study. Journal of Business Diversity 16: 106–14. [Google Scholar]
- Fujiwara, Akimasa, Makoto Chikaraishi, Diana Khan, Atsufumi Ogawa, Yoshihiro Suda, Toshikazu Yamasaki, Takaharu Nishino, and Shutaro Namba. 2022. Autonomous Bus Pilot Project Testing and Demonstration using Light Rail Transit Track. International Journal of Intelligent Transportation Systems Research 20: 359–78. [Google Scholar] [CrossRef]
- Gallivan, Michael J. 2004. Examining IT professionals’ adaptation to technological change: The influence of gender and personal attributes. ACM SIGMIS Database: The DATABASE for Advances in Information Systems 35: 28–49. [Google Scholar] [CrossRef]
- GOS. 2019. The Future of Mobility: A Time of Unprecedented Change in the Transport System; London: Government Office for Science. Available online: https://www.gov.uk/government/publications/future-of-mobility (accessed on 18 October 2022).
- Hansson, Lisa. 2020. Regulatory governance in emerging technologies: The case of autonomous vehicles in Sweden and Norway. Research in Transportation Economics 83: 100967. [Google Scholar] [CrossRef]
- Haustein, Sonja, and Anders Fjendbo Jensen. 2018. Factors of electric vehicle adoption: A comparison of conventional and electric car users based on an extended theory of planned behavior. International Journal of Sustainable Transportation 12: 484–96. [Google Scholar] [CrossRef]
- Hofstede, Geert. 2005. Hofstede. GJ Cultures and Organizations: Software of the Mind, Revised and Expanded, 2nd ed. New York: McGrow-Hill. [Google Scholar]
- Hofstede, Geert. 2011. Dimensionalizing cultures: The Hofstede model in context. Online Readings in Psychology and Culture 2. Available online: https://scholarworks.gvsu.edu/orpc/vol2/iss1/8/ (accessed on 18 October 2022).
- Huang, Qihao, Guanyu Mao, Yelu Liu, Ya Wang, Xiaojun Luo, and Jifang Wang. 2022. A Deep Dive into the China’s Gen Z: How They Use and What They Expect for Their Cars. In International Conference on Human-Computer Interaction. Cham: Springer, pp. 167–83. [Google Scholar]
- Hudson, John, Marta Orviska, and Jan Hunady. 2019. People’s attitudes to autonomous vehicles. Transportation Research Part A: Policy and Practice 121: 164–76. [Google Scholar] [CrossRef]
- Hulse, Lynn M., Hui Xie, and Edwin R. Galea. 2018. Perceptions of autonomous vehicles: Relationships with road users, risk, gender and age. Safety Science 102: 1–13. [Google Scholar] [CrossRef]
- Jing, Peng, Gang Xu, Yuexia Chen, Yuji Shi, and Fengping Zhan. 2020. The determinants behind the acceptance of autonomous vehicles: A systematic review. Sustainability 12: 1719. [Google Scholar] [CrossRef]
- Kaye, Sherrie-Anne, Ioni Lewis, Lisa Buckley, and Andry Rakotonirainy. 2020. Assessing the feasibility of the theory of planned behaviour in predicting drivers’ intentions to operate conditional and full automated vehicles. Transportation Research Part F: Traffic Psychology and Behaviour 74: 173–83. [Google Scholar] [CrossRef]
- Kopelias, Pantelis, Elissavet Demiridi, Konstantinos Vogiatzis, Alexandros Skabardonis, and Vassiliki Zafiropoulou. 2020. Connected & autonomous vehicles–Environmental impacts—A review. Science of the Total Environment 712: 135237. [Google Scholar]
- Lanctot, Roger. 2017. Accelerating the future: The economic impact of the emerging passenger economy. Autonomous Vehicle Service. Strategy Analytics. Available online: https://newsroom.intel.com/newsroom/wp-content/uploads/sites/11/2017/05/passenger-economy.pdf (accessed on 18 October 2022).
- Lazányi, Kornélia. 2018. Are we Ready for Self-Driving Cars-a Case of Principal-Agent Theory. Paper presented at the 2018 IEEE 12th International Symposium on Applied Computational Intelligence and Informatics (SACI), Timisoara, Romania, 17–19 May 2018; pp. 251–254. [Google Scholar]
- Lazányi, Kornélia, Péter Holicza, and Ksenia Baimakova. 2017. Different Cultures Different People. In Exploring the Influence of Personal Values and Cultures in the Workplace. Hershey: IGI Global, pp. 183–200. [Google Scholar]
- Le, Truc H. 2021. Cross-cultural gender differences in cruising risk perceptions: A study of young adults. Journal of Hospitality and Tourism Management 49: 296–303. [Google Scholar] [CrossRef]
- Liu, Peng, Manquing Du, Zhigang Xu, and Yueying Chu. 2022. People with more misconceptions about automated vehicles might be more positive toward them. Transportation Research Part F: Traffic Psychology and Behaviour 87: 264–78. [Google Scholar] [CrossRef]
- Madarász, Nikolett, and Péter Szikora. 2020. Az önvezető autók–a jövő már a jelen? Taylor 12: 78–87. [Google Scholar]
- Maxfield, Sylvia, Mary Shapiro, Vipin Gupta, and Susan Hass. 2010. Gender and risk: Women, risk taking and risk aversion. Gender in Management: An International Journal 25: 586–604. [Google Scholar] [CrossRef]
- Moghaddam, Golnessa Galyani. 2010. Information technology and gender gap: Toward a global view. The Electronic Library 28: 722–33. [Google Scholar] [CrossRef]
- Moody, Joanna, Nathaniel Bailey, and Jinhua Zhao. 2020. Public perceptions of autonomous vehicle safety: An international comparison. Safety Science 121: 634–50. [Google Scholar] [CrossRef]
- Niranjan, Arulanandam Jude, and Geert de Haan. 2018. Public Opinion About Self-Driving Vehicles in the Netherlands. Paper presented at the 36th European Conference on Cognitive Ergonomics, Utrecht, The Netherlands, 5–7 September 2018. [Google Scholar]
- Nordhoff, Sina, Bart van Arem, and Riender Happee. 2016. Conceptual model to explain, predict, and improve user acceptance of driverless podlike vehicles. Transportation Research Record 2602: 60–67. [Google Scholar] [CrossRef]
- Nordhoff, Sina, Joost de Winter, Miltos Kyriakidis, Bart van Arem, and Riender Happee. 2018. Acceptance of driverless vehicles: Results from a large cross-national questionnaire study. Journal of Advanced Transportation 2018: 5382192. [Google Scholar] [CrossRef]
- Papadimitriou, Eleonpra, Haneen Farah, Geerten van de Kaa, Filippo Sntoni de Sio, Marjan Hagenzieker, and Pieter van Gelder. 2022. Towards common ethical and safe ‘behaviour’standards for automated vehicles. Accident Analysis & Prevention 174: 106724. [Google Scholar]
- Potoglou, Dimitris, Colin Whittle, Ioannis Tsouros, and Lorraine Whitmarsh. 2020. Consumer intentions for alternative fuelled and autonomous vehicles: A segmentation analysis across six countries. Transportation Research Part D: Transport and Environment 79: 102243. [Google Scholar] [CrossRef]
- Renn, Ortwin. 1998. The role of risk perception for risk management. Reliability Engineering & System Safety 59: 49–62. [Google Scholar]
- Rice, Stephen, and Scott R. Winter. 2019. Do gender and age affect willingness to ride in driverless vehicles: If so, then why? Technology in Society 58: 101145. [Google Scholar] [CrossRef]
- Rogers, Everett M., Arvind Singhal, and Margaret M. Quinlan. 2014. Diffusion of innovations. In An Integrated Approach to Communication Theory and Research. London: Routledge, pp. 432–48. [Google Scholar]
- Salum, Jimoku Hinda, Boniphace Kutela, Angela E. Kitali, and Emmanuel Kidando. 2022. Stated preference analysis of automated vehicles among California residents using probabilistic inferences. Transportation Research Record 2676: 302–11. [Google Scholar] [CrossRef]
- Scribner, Marc. 2021. Challenges and Opportunities for Federal Automated Vehicle Policy. Reason Foundation Policy Brief. Available online: https://reason.org/wp-content/uploads/challenges-opportunities-federal-automated-vehicle-policy.pdf (accessed on 18 October 2022).
- Slovic, Paul. 1987. Perception of risk. Science 236: 280–85. [Google Scholar] [CrossRef] [PubMed]
- Stedham, Yvonne E., and Jeanne H. Yamamura. 2004. Measuring national culture: Does gender matter? Women in Management Review 19: 233–43. [Google Scholar] [CrossRef]
- Szikora, Péter, and Nikolett Madarász. 2017. Self-driving cars—The human side. Paper presented at the 2017 IEEE 14th International Scientific Conference on Informatics, Poprad, Slovak Republic, 14–16 November 2017; pp. 383–87. [Google Scholar]
- Szikora, Péter, and Nikolett Madarász. 2018. Y generáció félelmei az önvezető autóktól= Y generation’s fears from self-driving cars. Közép-Európai Közlemények 11: 79–87. [Google Scholar]
- Takács, Árpád, Imre Rudas, Dominik Bösl, and Tamás Haidegger. 2018. Highly automated vehicles and self-driving cars [industry tutorial]. IEEE Robotics and Automation Magazine 25: 106–12. [Google Scholar] [CrossRef]
- Venkatesh, Viswanath. 2022. Adoption and use of AI tools: A research agenda grounded in UTAUT. Annals of Operations Research 308: 641–52. [Google Scholar] [CrossRef]
- Venkatesh, Viswanath, Michael G. Morris, Gordon B. Davis, and Fred D. Davis. 2003. User acceptance of information technology: Toward a unified view. MIS Quarterly 27: 425–78. [Google Scholar] [CrossRef]
- Wang, Shenhao, and Jinhua Zhao. 2019. Risk preference and adoption of autonomous vehicles. Transportation Research Part A: Policy and Practice 126: 215–29. [Google Scholar] [CrossRef]
- Wang, Ziran, Guoyuan Wu, and Matthew J. Barth. 2019. Cooperative eco-driving at signalized intersections in a partially connected and automated vehicle environment. IEEE Transactions on Intelligent Transportation Systems 21: 2029–38. [Google Scholar] [CrossRef]
- Watkins, David, Adebowale Akande, James Fleming, Maznah Ismail, Kent Lefner, Murari Regmi, Sue Watson, Jiayuan Yu, John Adair, Christopher Cheng, and et al. 1998. Cultural dimensions, gender, and the nature of self-concept: A fourteen-country study. International Journal of Psychology 33: 17–31. [Google Scholar]
- Weber, Elke U., and Christopher Hsee. 1998. Cross-cultural differences in risk perception, but cross-cultural similarities in attitudes towards perceived risk. Management Science 44: 1205–17. [Google Scholar] [CrossRef]
- Wildavsky, Aaron, and Karl Dake. 1990. Theories of risk perception: Who fears what and why? Daedalus 119: 41–60. [Google Scholar]
Figure 1.
Factors affecting individual behaviour through perception.

Figure 2.
Distribution of non-Hungarian respondents by country.


Table 1.
Distribution of the sample by gender and nationality.
| Hungarian | Non-Hungarian | Total | |||
|---|---|---|---|---|---|
| N | % | N | % | ||
| Male | 221 | 64% | 53 | 43% | 274 |
| Female | 121 | 35% | 68 | 56% | 189 |
| Prefer not to identify | 3 | 1% | 1 | 1% | 4 |
| Total | 345 | 122 | 467 | ||
| Average age | 22.20 | 22.67 | 22.323 | ||
Table 2.
Significant differences between male and female respondents in the Hungarian sample.
| Levene’s Test for Equality of Variances | t-Test for Equality of Means | Sig. (2-Tailed) | Mean Diff. | ||||
|---|---|---|---|---|---|---|---|
| F | Sig. | t | df | ||||
| I would support the initialisation of self-driving cars | * | 8.206 | 0.004 | 5.093 | 340 | 0.000 | 0.758 |
| I would love to buy a self-driving car later on | * | 4.509 | 0.034 | 4.115 | 340 | 0.000 | 0.632 |
| I would love to try a self-driving car | ** | 1.172 | 0.280 | 3.279 | 242.377 | 0.001 | 0.516 |
| Self-driving cars will positively affect emission | * | 18.408 | 0.000 | 2.598 | 340 | 0.010 | 0.359 |
| Self-driving cars will positively affect the society | * | 4.427 | 0.036 | 4.242 | 340 | 0.000 | 0.604 |
| Self-driving cars will reduce the occurrence of accidents | * | 6.491 | 0.011 | 5.606 | 340 | 0.000 | 0.792 |
| Which of the previous 6 options would You be comfortable with? | * | 16.035 | 0.000 | 3.894 | 340 | 0.000 | 0.658 |
| I would be afraid of self-driving cars in my environment | ** | 0.179 | 0.672 | −5.155 | 252.051 | 0.000 | −0.808 |
| Hackers tamper with the car | ** | 1.790 | 0.182 | −2.752 | 259.514 | 0.006 | −0.432 |
| The self-driving system breaks down | * | 31.586 | 0.000 | −6.155 | 340 | 0.000 | −0.788 |
| The car decides different from how I would like it to | * | 19.213 | 0.000 | −3.856 | 340 | 0.000 | −0.526 |
| Fear from the new technology | ** | 0.598 | 0.440 | −6.962 | 259.523 | 0.000 | −0.926 |
| People (in various professions, such as chauffeurs) will lose their jobs | ** | 0.781 | 0.378 | −5.320 | 252.856 | 0.000 | −0.826 |
| Control cannot be regained | * | 16.743 | 0.000 | −4.502 | 340 | 0.000 | −0.661 |
| The security of personal data cannot be provided | ** | 0.009 | 0.924 | −2.195 | 253.655 | 0.029 | −0.323 |
* Equal variances assumed; ** Equal variances not assumed.
Table 3.
The relationship of age and perceptions by gender in the Hungarian sample.
| The Car Decides Different from How I Would Like It to | Fear from the New Technology | The Security of Personal Data Cannot Be Provided | ||
|---|---|---|---|---|
| Male respondents Hungarian subsample N = 221 | Pearson Corr. | 0.019 | −0.039 | 0.132 * |
| Sig. (2-tailed) | 0.781 | 0.569 | 0.050 | |
| Female respondents Hungarian subsample N = 121 | Pearson Corr. | −0.181 * | −0.225 * | −0.190 * |
| Sig. (2-tailed) | 0.047 | 0.013 | 0.037 |
* Equal variances assumed.
Table 4.
The significant relations of cultural dimensions and perceptions within the international sample.
Table 4.
The significant relations of cultural dimensions and perceptions within the international sample.
| I Would Love to Buy a Self-driving Car Later on | Hackers Tamper with the Car | The Self-Driving System Breaks Down | Fear from the New Technology | People (in Various Professions, such as Chauffeurs) Will Lose Their Jobs | Control Cannot Be Regained | The Security of Personal Data Cannot Be Provided | ||
|---|---|---|---|---|---|---|---|---|
| Power distance | Corr. | 0.112 * | 0.209 ** | 0.119 * | ||||
| Sig. | 0.015 | 0.000 | 0.010 | |||||
| Individualism | Corr. | −0.092 * | −0.130 ** | −0.222 ** | −0.094 * | |||
| Sig. | 0.047 | 0.005 | 0.000 | 0.041 | ||||
| Masculinity | Corr. | −0.091 * | −0.151 ** | −0.196 ** | ||||
| Sig. | 0.048 | 0.001 | 0.000 | |||||
| Uncertainty avoidance | Corr. | 0.142 ** | ||||||
| Sig. | 0.002 | |||||||
| Long Term Orientation | Corr. | −0.103 * | −0.121 ** | −0.128 ** | ||||
| Sig. | 0.026 | 0.009 | 0.006 |
* Equal variances assumed; ** Equal variances not assumed.
Table 5.
The significant relations of cultural dimensions and perceptions of male respondents in the sample.
Table 5.
The significant relations of cultural dimensions and perceptions of male respondents in the sample.
| Male Respondents (N = 274) | Power Distance | Individualism | Masculinity | Uncertainty Avoidance | Long Term Orientation | Indulgence |
|---|---|---|---|---|---|---|
| I would be afraid of self-driving cars in my environment | −0.184 ** | −0.208 ** | −0.221 ** | 0.138 * | ||
| 0.002 | 0.001 | 0.000 | 0.022 | |||
| Fear from the new technology | 0.235 ** | −0.318 ** | −0.294 ** | −0.191 ** | ||
| 0.000 | 0.000 | 0.000 | 0.002 | |||
| Hackers tamper with the car | 0.204 ** | −0.172 ** | ||||
| 0.001 | 0.004 | |||||
| The self-driving system breaks down | 0.186 ** | −0.210 ** | −0.162 ** | −0.137 * | 0.124 * | |
| 0.002 | 0.000 | 0.007 | 0.024 | 0.041 | ||
| The car decides different from how I would like it to | 0.165 ** | −0.133 * | 0.193 ** | |||
| 0.006 | 0.028 | 0.001 | ||||
| Control cannot be regained | 0.146 * | −0.129 * | 0.125 * | |||
| 0.016 | 0.032 | 0.038 | ||||
| The security of personal data cannot be provided | 0.215 ** | −0.152 * | ||||
| 0.000 | 0.012 | |||||
| People (in various professions, such as chauffeurs) will lose their jobs | 0.329 ** | −0.319 ** | −0.227 ** | 0.086 | −0.188 ** | |
| 0.000 | 0.000 | 0.000 | 0.155 | 0.002 |
* Equal variances assumed; ** Equal variances not assumed.
Table 6.
The significant relations of cultural dimensions and perceptions of female respondents in the sample.
Table 6.
The significant relations of cultural dimensions and perceptions of female respondents in the sample.
| Female Respondents (N = 189) | Power Distance | Individualism | Masculinity | Uncertinaty Avoidance | Indulgence |
|---|---|---|---|---|---|
| I would support the initialisation of self-driving cars | 0.197 ** | −0.205 ** | −0.189 ** | ||
| 0.007 | 0.005 | 0.009 | |||
| I would be afraid of self-driving cars in my environment | 0.184 * | ||||
| 0.011 | |||||
| I would love to buy a self-driving car later on | 0.206 ** | −0.259 ** | −0.253 ** | ||
| 0.005 | 0.000 | 0.000 | |||
| Self-driving cars will positively affect the society | 0.143 * | −0.148 * | |||
| 0.050 | 0.042 | ||||
| Self-driving cars will reduce the occurrence of accidents | 0.154 * | −0.177 * | −0.239 ** | ||
| 0.034 | 0.015 | 0.001 | |||
| The self-driving system breaks down | −0.169 * | 0.203 ** | 0.148 * | ||
| 0.020 | 0.005 | 0.042 | |||
| The car decides different from how I would like it to | −0.211 ** | 0.245 ** | 0.300 ** | ||
| 0.004 | 0.001 | 0.000 | |||
| Fear from the new technology | −0.147 * | −0.143 * | |||
| 0.044 | 0.050 | ||||
| Control cannot be regained | 0.170 * | 0.166 * | |||
| 0.019 | 0.022 | ||||
| I lose the joy of driving | 0.167 * | 0.280 ** | −0.144 * | ||
| 0.022 | 0.000 | 0.048 |
* Equal variances assumed; ** Equal variances not assumed.
Disclaimer/Publisher’s Note: The statements, opinions and data contained in all publications are solely those of the individual author(s) and contributor(s) and not of MDPI and/or the editor(s). MDPI and/or the editor(s) disclaim responsibility for any injury to people or property resulting from any ideas, methods, instructions or products referred to in the content. |
© 2023 by the author. Licensee MDPI, Basel, Switzerland. This article is an open access article distributed under the terms and conditions of the Creative Commons Attribution (CC BY) license (https://creativecommons.org/licenses/by/4.0/).
Share and Cite
MDPI and ACS Style
Lazányi, K. Perceived Risks of Autonomous Vehicles. Risks 2023, 11, 26. https://doi.org/10.3390/risks11020026
AMA Style
Lazányi K. Perceived Risks of Autonomous Vehicles. Risks. 2023; 11(2):26. https://doi.org/10.3390/risks11020026
Chicago/Turabian StyleLazányi, Kornélia. 2023. "Perceived Risks of Autonomous Vehicles" Risks 11, no. 2: 26. https://doi.org/10.3390/risks11020026
APA StyleLazányi, K. (2023). Perceived Risks of Autonomous Vehicles. Risks, 11(2), 26. https://doi.org/10.3390/risks11020026
Note that from the first issue of 2016, this journal uses article numbers instead of page numbers. See further details here.