Abstract
Currently, energy consumption has increased exponentially. Using fossil fuels to produce energy generates high shares of carbon dioxide emissions and greenhouse gases. Moreover, financial authorities at the global and European levels have recognized that climate change poses new risks for individual financial institutions and financial stability. The analysis contributes to the literature in two critical ways. First, the research attempts to develop a map of the transition risk of the EU. In detail, it defines an indicator that will identify the transition risk the EU bears. Second, it analyzes any relationships between the CO2 emissions, economic growth, and the renewable energy of each European country from 1995 to 2020, highlighting the short and long-run relationships. The methodology used is the ARDL. The results show the long-run relationship between GDP, renewable energy consumption, and CO2 emissions is evident. Indeed, economic growth may increase environmental pollution in Europe, while an increase in using renewable energy may reduce CO2 emissions. Therefore, this implies the trade-off between economic development and CO2 emissions. Furthermore, the results indicate the difference in the short-run relationship across countries. However, the results demonstrate that the choice of the European Union to increase the use of renewable energies is more than fair.
Keywords:
CO2 emissions; transition risks; economic growth; renewable energy; climate change; Europe 1. Introduction
In the modern era, energy consumption has increased exponentially. Using fossil fuels to produce energy generates high shares of carbon dioxide emissions and greenhouse gases. Moreover, financial authorities at the global and European levels have recognized that climate change poses new risks for individual financial institutions and financial stability (European Banking Authority 2021a, 2021b, 2022; European Central Bank 2020, 2021). As for Europe, the Green Deal (European Commission 2019) defines the goal of transforming Europe into the first neutral continent from a climate point of view by 2050. The Commission’s strategy implements the United Nation’s 2030 Agenda and sustainable development goals. So, two main risk drivers emerge as physical and transition risks. The former represents the physical impact on the economy of global warming, which may characterize some geographic locations with higher risks than others. Instead, transition risks are the expression of the risk induced by the transition to a low-carbon economy, which may lead to some activities being phased out. Our attention is mainly focused on European transition risks. Many policies have been introduced to reduce greenhouse gases (GHGs) and carbon emissions, such as adopting renewable energies, action plans, and energy efficiency and taxation. Depending on the ability of companies to implement policies, the technologies needed to assess these objectives become an additional driver of this type of risk as they can change the way companies (but not only) are affected by climate change. The GHG emission decreased by 31% between the 1990s and 2020, improving the EU’s 2020 goal by 11 percentage points. This result was achieved through emissions cuts from 2008 to 2020. This phenomenon is the consequence of the fossil fuel price effects and European policy measures; the decline in 2020 is undoubtedly due to the COVID-19 pandemic. By 2030, EU greenhouse gas emissions should continue to decline. However, the 2030 target has not yet been aligned with the state’s ambitions.
Furthermore, implementing more impactful policies and measures will be essential to achieving the new goal. Another instrument to describe the impact of greenhouse gas emissions is the total environmental taxes expressed in millions of euros. The source is Eurostat, annually, by economic activity from 2008 to 2019 and by EU27 geo-localization. At the level of the 27 EU Member States, the environmental tax increased by 35.53% (Figure 1).
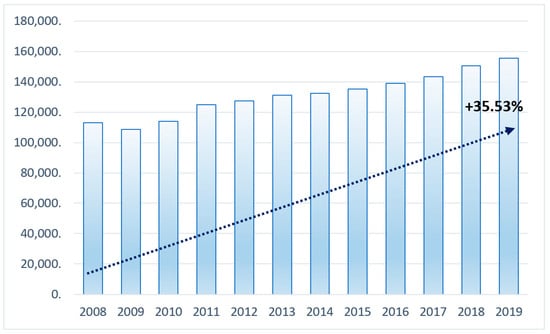
Figure 1.
Total environmental taxes for all activities in EU 27, 2008–2019 (color online only). Notes: “EU27 refers to the geopolitical entity. It comprises 27 countries: Belgium, Czech Republic, Bulgaria, Germany, Denmark, Estonia, Greece, Ireland, Spain, Croatia, Italy, France, Cyprus, Latvia, Luxembourg, Hungary, Lithuania, Malta, Romania, Slovenia, Slovakia, Netherlands, Austria, Poland, Portugal, Finland, Sweden, as of 1 February 2020. (UK left the EU on 31 February 2020)” (Cit. Directive 2009/28/EC (European Parliament 2008)). Source: Data processing provided by Eurostat.
It is worth noting, however, that several transition processes require taxpayers to contribute to the public budget and have tax implications (European Environment Agency 2019, 2021); and failure to transition to sustainability would also incur costs of “inaction” (Sanderson and O’Neill 2020; Guo et al. 2021).
Numerous studies have investigated the nexus between carbon oxide emissions and economic growth. Many works used different econometric methods to test the force of the Environmental Kuznets Curve (EKC) hypothesis for a single country and a group of countries. Many studies investigated the relationship between carbon emissions by providing mixed results regarding the validity of the theory. For example, some analyses support the validity of the EKC hypothesis (Adebola Solarin et al. 2017; Al-Mulali et al. 2022; Ferreira et al. 2022; Htike et al. 2021; Salazar-Núñez et al. 2022; Salahodjaev et al. 2022). In contrast, others show that the relationship between GDP and greenhouse gas emissions is non-inverted U-shaped, implying that the evidence of the methodology hypothesis is not valid (Boukhelkhal 2022; Dogan and Turkekul 2016).
Another critical perspective that attracts much attention is energy, because it is the primary source of environmental pollution, but it is essential for production and, consequently, for economic growth. The sources of renewable energies such as wind energy, solar energy, hydroelectric energy, ocean energy, geothermal energy, biomass, and biofuels are fossil fuels alternatives and help to reduce carbon emissions, diversify energy supplies and reduce dependence on volatile and unreliable markets for fossil fuels, especially oil and gas. EU legislation promoting renewable energy has evolved significantly over the past fifteen years. In 2009, European leaders set a target of a twenty percent share of energy use from renewable sources by 2020. In 2018, a target of a thirty-two percent share of renewable energy use was agreed upon by 2030. In July 2021, the EU proposed increasing the target to 40% by 2030 due to its new climate ambitions. Also, the EU plans to accelerate the clean energy transaction to reduce its dependence on Russian fossil fuels by 2030 due to the energy crisis caused by the conflict between Russia and Ukraine. The updated renewable energy policy framework for 2030 and post-2030 is under discussion.
For this reason, many researchers have pointed attention to the role of renewable energy in reducing energy-induced carbon dioxide emissions. For example, Apergis and Danuletiu (2014) examined the long-run connections between green energy and economic growth. They applied a methodology of Canning and Pedroni (2008) tested on 80 countries of the Asia, OECD, Latin America and Africa. As a result, they show the existence of two different and opposite direction causality between the use of renewable energy consumption and GDP in the long run belonging to all regions. Cho et al. (2015), using a dataset of OECD and non-OECD countries, investigated the long-run causal relationship from 1990 to 2010 between renewable energy and indicated that renewable energy is crucial only for the economic growth of non-OECD countries. Cherni and Jouini (2017) analyze the connections between CO2 emissions, renewable energy, and GDP in Tunisia. The authors used the ARDL model, showing how the long-term GDP, CO2, and energy are stable.
The study contributes to the extant literature in two critical ways. First, our analysis attempts to develop a map of the transition risk of the European Union. In detail, our study defines an indicator that will allow us to identify the transition risk borne by the EU. Second, our study analyzes any relationships between the carbon oxide emissions of each European country, the economic growth, and the renewable energy percentage used.
2. Data and Methodology
2.1. Descriptive Scenario
This analysis needs to recuperate data on the European financial system to estimate climate-related transition risk adequately. To this scope, we retrieve annual carbon dioxide emission data (CO2) used on the Eurostat for 2008–2020 for each European Union country. In addition, we used the World Development Indicators data for economic growth and the percentage of renewable energy. Figure 2 and Figure 3 show a decreasing trend of CO2. In 2020, the emissions dropped approximately 10%.
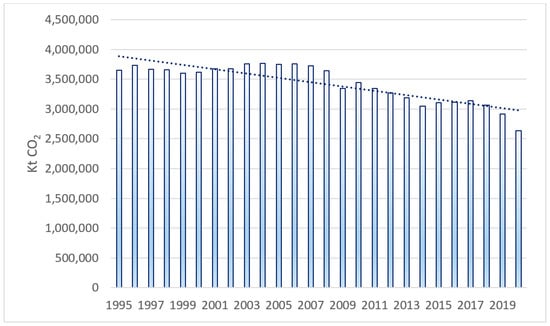
Figure 2.
Carbon dioxide emissions in the EU27, 1995–2020 (color online only). Notes: “EU27 refers to the geopolitical entity. It comprises 27 countries: Belgium, Czech Republic, Bulgaria, Germany, Denmark, Estonia, Greece, Ireland, Spain, Croatia, Italy, France, Cyprus, Latvia, Luxembourg, Hungary, Lithuania, Malta, Romania, Slovenia, Slovakia, Netherlands, Austria, Poland, Portugal, Finland, Sweden, as of 1 February 2020. (UK left the EU on 31 February 2020)” (Cit. Directive 2009/28/EC (European Parliament 2008)). Source: Data processing provided by Eurostat.
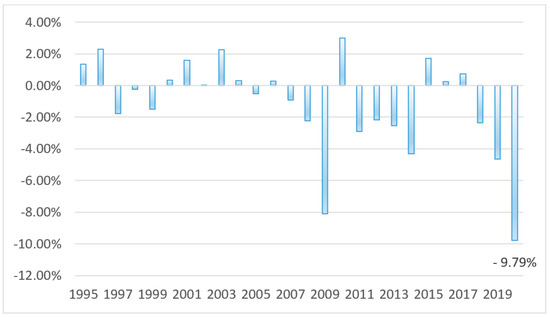
Figure 3.
Variation percentage of the carbon dioxide emissions in EU27, 1995–2020 (color online only). Notes: “EU27 refers to the geopolitical entity. It comprises 27 countries: Belgium, Czech Republic, Bulgaria, Germany, Denmark, Estonia, Greece, Ireland, Spain, Croatia, Italy, France, Cyprus, Latvia, Luxembourg, Hungary, Lithuania, Malta, Romania, Slovenia, Slovakia, Netherlands, Austria, Poland, Portugal, Finland, Sweden, as of 1 February 2020. (UK left the EU on 31 February 2020)” (Cit. Directive 2009/28/EC (European Parliament 2008)). Source: Data processing provided by Eurostat.
In December 2018, the revised directive of the renewable energy (Directive (EU) 2018/2001 came into force, encouraging the use of clean energy through:
- Greater diffusion of renewable sources in the electricity sector;
- Renewable energy sources expected to increase by 1.3% annually in the heating, cooling and ventilation systems;
- The decarbonization and diversification of the transport sector through the introduction of:
- ○
- A percentage of renewable energies equal to 14% of the total energy consumption in the sector’s transport by 2030;
- ○
- A 1% share of biogas and advanced biofuels by 2025, reaching 3.5% in 2030 (double counting);
- ○
- The use of palm oil and other food-based biofuels that increase CO2 emissions will be phased out by 2030 through a certification system and a cap on first-generation biofuels in the road and rail transport;
- Strengthening the EU sustainability criteria for bioenergy;
- Ensuring that the EU-wide binding target is achieved on time and cost-effectively.
This route is highlighted in Figure 4, in which, in 2020, the total renewable energy percentage exceeded 22%.
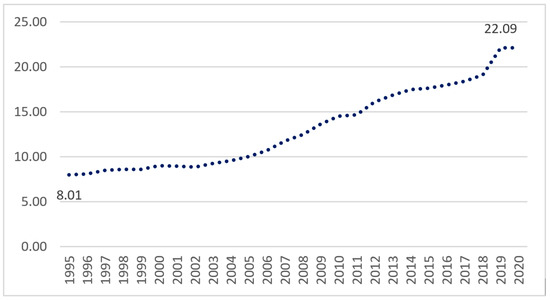
Figure 4.
Percentage of renewable energy used in the EU27, 1995–2020 (color online only). Notes: “EU27 refers to the geopolitical entity. It comprises 27 countries: Belgium, Czech Republic, Bulgaria, Germany, Denmark, Estonia, Greece, Ireland, Spain, Croatia, Italy, France, Cyprus, Latvia, Luxembourg, Hungary, Lithuania, Malta, Romania, Slovenia, Slovakia, Netherlands, Austria, Poland, Portugal, Finland, Sweden, as of 1 February 2020. (UK left the EU on 31 February 2020)” (Cit. Directive 2009/28/EC (European Parliament 2008)). Source: Data processing provided by World Development Indicators.
From the descriptive statistics table (Table 1) emerges strange data: no renewable energy (RE) was used. The justification derives from the fact that Malta did not use renewable energy from 1995 to 2001 or used a percentage negligible. In addition, the distribution of CO2 is highly skewed. Therefore, we use the natural logarithm of CO2 to mitigate this problem.

Table 1.
Descriptive statistics of the variables.
GDP is the indicator par excellence for measuring economic activity (Figure 5).
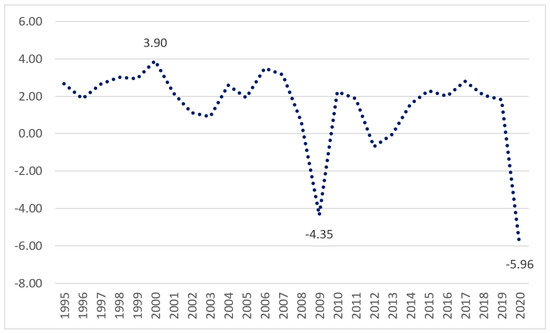
Figure 5.
GDP annual percentage of the EU27, 1995–2020 (color online only). Notes: “EU27 refers to the geopolitical entity. It comprises 27 countries: Belgium, Czech Republic, Bulgaria, Germany, Denmark, Estonia, Greece, Ireland, Spain, Croatia, Italy, France, Cyprus, Latvia, Luxembourg, Hungary, Lithuania, Malta, Romania, Slovenia, Slovakia, Netherlands, Austria, Poland, Portugal, Finland, Sweden, as of 1 February 2020. (UK left the EU on 31 February 2020)” (Cit. Directive 2009/28/EC (European Parliament 2008)). Source: Data processing provided by World Development Indicators.
From 2000 to 2018, annual GDP growth in the EU was quite volatile. In the years between 2001 and 2007, the economy followed a growing trend with an annual rate of +1% and +3%. Subsequently, a deep financial crisis hit Europe hard, from 2008 to 2013, with a drop in GDP of more than 4% in 2009 and falling again slightly in 2012. In the following years, there was a recovery with average rates of around 2% between 2014 and 2018. A similar pattern was observed across the European countries, but not all experienced fluctuations of the same intensity. In particular, countries such as Spain, Greece, Croatia, Portugal, and Cyprus have recorded several consecutive years of degrowth rates.
Using green energy means reducing the use of fossil fuels, diversifying energy supplies, and consequently reducing greenhouse gas emissions. Although the latter still represents the primary energy source exploited in Europe, renewable sources rapidly expand, and the energy sector’s decarbonization seems ever closer. As a result, Europe is living up to its commitments (Figure 6). The EU leaders are currently discussing increasing the contribution of renewables to 27% by 2030.
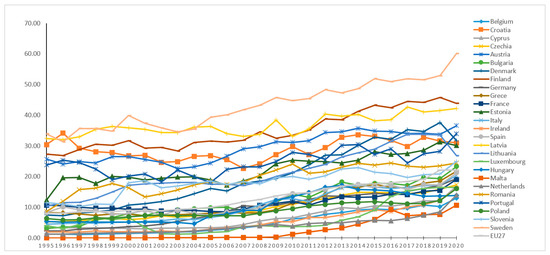
Figure 6.
Renewable energy consumption (% of total final energy consumption), 1995–2020 (color online only). Notes: “EU27 refers to the geopolitical entity. It comprises 27 countries: Belgium, Czech Republic, Bulgaria, Germany, Denmark, Estonia, Greece, Ireland, Spain, Croatia, Italy, France, Cyprus, Latvia, Luxembourg, Hungary, Lithuania, Malta, Romania, Slovenia, Slovakia, Netherlands, Austria, Poland, Portugal, Finland, Sweden, as of 1 February 2020. (UK left the EU on 31 February 2020)” Source: Data processing provided by World Development Indicators.
The data collected illustrate the European countries’ situation in terms of energy use from renewable sources. Sweden, with 60.12% of its energy from renewable sources, is the greenest country in Europe, which is followed by Finland (43.80%) and Latvia (42.13%). While these Member States have achieved their 2030 renewable targets well ahead of schedule, others, such as Belgium (13%) and Hungary (13.85%), are still far from the finish line (but they are recovering many percentage points in recent years).
2.2. Model Presentation
The start of the analysis is to define an indicator that will allow us to determine the transition risks supported by the European countries. The European Union has implemented the taxonomy to define sustainability criteria relating to four different dimensions (economic, social, environmental, and governance). Given the variables considered in the analysis, we determined the transition risk index by carrying out a ratio between the individual country’s total carbon dioxide emissions and the European Union’s total emissions to see the individual’s position. This allows individual institutions to work to identify specific policies that are more stringent than others if their goal of climate neutrality (Green Deal) is further away.
where is the transition risk for each country “” at the time “” from 1995 to 2020 and is the carbon dioxide emissions in kt for each country “” at time “” from 1995 to 2020.
Data shown in Figure 7. Germany presents the highest transition risk of the European Union over the examined period.
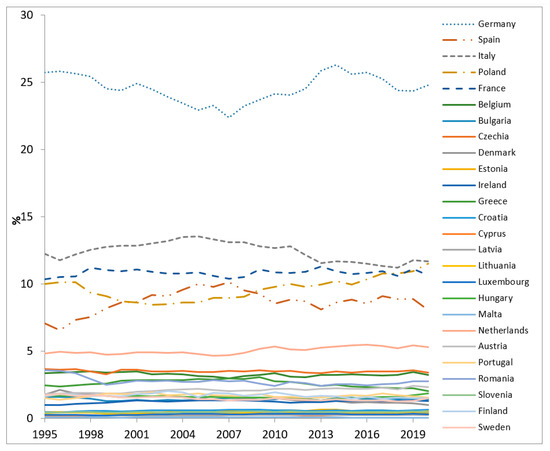
Figure 7.
Transition risk of the European Union countries, 1995–2020 (color online only). Source: Data processing provided by Eurostat.
Four countries, including Germany, France, Italy, and Poland, are the countries that on average are responsible for the majority of the carbon dioxide emissions (out of the total European emissions) and thus constitute the major transition risk. Even Germany exceeds 24% on average of the total emissions of Europe. Germany’s policy will again be influenced by the European Union reforms, which are expected to be largely decided by the end of 2023. Remember that Germany would become greenhouse gas neutral by 2045, aiming to achieve an emissions reduction of at least 65% by 2030 compared to the 1990 level and 88% by 2040.
The analysis’s next step is the use of the Autoregressive Distributed Lag Model (ARDL) to study the connections between the variables carbon dioxide emissions, GDP, and renewable energy as a share of total final energy consumption. The methodology introduced by (Pesaran 2008) and successively implemented (Pesaran et al. 2001) has various advantages over the cointegration analysis of (Engle and Granger 1987; Johansen and Juselius 1990). Unlike other methodologies, this methodology does not require integrating the variables in the same order. However, it considers the variables that are ordering one or zero integrated. Furthermore, this approach is suitable for a little sample size. Finally, the estimate must be based on many observations to render Johansen’s cointegration method reliable.
In ARDL methodology, the dependent variable is explained from its past and the other independent variables.
The generalized ARDL model is specified as:
where is the dependent variable (logarithm of the carbon dioxide ), is a k × 1 vector that is allowed to be purely I(0) or I(1) or cointegrated; is the coefficient of the dependent variable’s lagged called scalars (GDP growth rate and the share of the renewable energy consumption); are k × 1 coefficient vectors; is the unit-specific fixed effects; ; ; are optimal lag orders; and is the error term.
The re-parameterized ARDL error correction model is specified as follows:
With the following notes:
- , group-specific speed of adjustment coefficient (expected that );
- vector of long-run relationships;
- , the error correction term that represents the long-run information model;
- , are the short-run dynamic coefficients.
Subsequently, the analysis was carried out through various steps:
Step (1) analyzes the characteristics of each variable in the econometric representation, as shown in Table 1.
Step (2) checks the multicollinearity issue: Table 2 shows no high correlations among our regressors; thus, the multicollinearity problem would not be a concern.

Table 2.
Correlation matrix among variables.
Step (3) performs unit root tests based on Im, Pesaran, and Shin (IPS) (Pesaran 2008) to see the stationarity of the data for all the variables (carbon dioxide emissions, economic growth, and renewable energy). Examining the order of integration of all variables is essential for the correctness of the analysis. The results show that LogCO2 and RE are not stationary at a level, and GDP is stationary at a level for IPS. However, all variables are stationary at the first difference with the trend and one lag. Therefore, the panel ARDL (1,0,0) can be applied.
Step (4) determines the optimal lag for the model by using the unrestricted model and an information criterion, deciding the lags for each unit/group per variable, and then choosing the most common lag for each variable to represent the lags for the model.
Step (5) performs the Hausman test, which is used to test the null hypothesis of homogeneity based on the comparison between the Pooled Mean Group (PMG) estimators (Pesaran et al. 1999), the Mean Group (MG) (Pesaran and Smith 1995), and the Dynamic Fixed Effect (Weinhold 1999). The criteria for rejecting the null hypothesis are made if the probability value is lower than 0.05. When performing the Hausman test, the null hypothesis is:
- MG vs. PMG.
H0:
The PMG estimator is more efficient than MG ones.
Decision: If the p-value exceeds 0.05, the null hypothesis (H0) cannot be rejected. Alternatively, the PMG estimator is preferred.
- MG vs. DFE.
H0:
The DFE estimator is more efficient than MG ones.
Decision: If the p-value exceeds 0.05, the null hypothesis (H0) cannot be rejected. Alternatively, the DFE estimator is preferred.
- DFE vs. PMG
H0:
The PMG estimator is more efficient than DFE ones.
Decision: If the p-value exceeds 0.05, the null hypothesis (H0) cannot be rejected. Alternatively, the PMG estimator is preferred.
We observed the statistical significance of the long-run coefficients and the size of group-specific error adjustment and short-run coefficients. MG and DFE (Dynamic Fixed Effect) estimations are very similar, but PMG assumes both pooling and averaging while allowing error variances, intercepts, and short-run coefficients to differ freely. The long-run coefficients are the same, generating consistent estimates of the mean of short-run coefficients by taking the simple average of individual unit coefficients. Table 3 shows that the PMG and DFE methods are preferred to the MG.

Table 3.
Result of the Hausman test.
However, Pesaran and Smith (1995) state that the Dynamic Fixed Effect can provide misleading results and inconsistent estimates when slopes are heterogeneous. The PMG is, therefore, more performing than the DFE because the first method identifies different short-term coefficients between countries. Consequently, our outcomes focus on the results derived from the PMG.
Step (6) estimates the model with PMG estimators from the outcome of the Hausman test.
3. Results and Discussion
The results of the ARDL model estimating with PMG, MG, and DFE are reported in Table 4.

Table 4.
Results of the ARDL model using a full sample with Pooled Mean Group.
The estimators allow for knowing the long and short-run effects. The error correction term (ECT) value is negative and significant in all three estimators; therefore, the long-run relationship exists. Accordingly, economic growth and the percentage of renewable energy used in the long run affect carbon oxide emissions significantly. The relationship between LogCO2 and GDP is positive and statically significant at 1%. Therefore, it implies that increased economic growth generates increased environmental pollution across countries. Instead, the relationship between the percentage of renewable energy and carbon dioxide is negative; thus, an increase in the use of renewable energy generates and decreases environmental pollution. Table 5 shows the short-run relationship that is different for each country.

Table 5.
Results of the ARDL model with Pooled Mean Group for each individual country.
The error correction term (ECT) results In short-run dynamic adjustment results. It follows that cointegration among the variables in the panel is statistically significant since the coefficient of ECT is statistically significant. Cointegration is observed at a 1% significance level over the long run; any equilibrium deviation is adjusted to the speed by 25% in the short run. In addition, the expected sign of the error term indicates that if there is a deviation from the long-run relationship, the relationship will return to equilibrium in the next period.
More specifically, Estonia, Luxembourg, Netherlands, Poland, Slovenia, and Sweden show the absence of joint causality of the variables in the short-run, as the error correction term is not statistically significant and there is a total absence of significant statistics of all variables. On the other hand, Belgium, Denmark, France, Croatia, Italy, Cyprus, Hungary, Romania, and EU27 instead highlight the statistical non-significance variables (economic growth and the percentage of renewable energy used). Still, if one looks at the error correction term (ECT), it is significant. Therefore, the joint causality of the variables can be deduced; i.e., all variables together affect carbon emissions in the long run because this shows long-run cointegration.
On the other hand, again, Bulgaria, Germany, Greece, Latvia, Lithuania, Malta, and Austria show that there is not long-run cointegration because the error correction term is not statistically significant. In particular, in Germany, there is still a positive relationship between GDP growth rate and carbon emissions, so the increase in the GDP generates an increase in pollution. For Bulgaria, Greece, Latvia, and Austria, the only negative relationship is short term between carbon emissions and the use of sustainable energy. The same relationship exists for the Czech Republic, Ireland, Spain, and Portugal, with the error correction term (ECT) being negative and statistically significant. Only Finland presents the statistically significant (at 1%) for all variables; thus, the increase in economic growth and percentage of clean energies generate an increase and decrease in carbon emissions both in the short and long-run period. As highlighted in Figure 6, Finland is second only to Sweden for the use of renewable energy. In 2020, it used 43.80% of the sustainable energy consumption.
The European Parliament demanded in September 2022 that the renewables target be raised to 45%, which was a goal endorsed by the Commission under its REPowerEU plan (European Union 2022). By 2030, 45% of power generation, industry, buildings, and transportation should be powered by renewables to reduce energy imports from Russia, according to a report presented in May 2022. In December 2022, European Parliament (MEPs) also demanded that permits for renewable energy power plants be issued faster, including solar panels and windmills. In addition to wind power, MEPs are considering boosting the use of solar energy and renewable hydrogen. A major portion of EU funding goes toward hydrogen and offshore renewable energy infrastructure; natural gas infrastructure projects are being phased out in favor of these latest.
4. Conclusions and Policy Implications
This study first investigated the transition risks borne by 26 European countries from 1995 to 2020. Then, we examined the effects of economic growth and renewable energy consumption on carbon dioxide emissions. The outcomes show a large difference in transition risks among these country members. More specifically, countries with the highest transition risk ratio are Germany, France, Italy, and Poland, while those with the least risk ratio include Cyprus, Latvia, Lithuania, and Luxembourg. The ARDL model results also show the long-run connection between GDP growth rate, renewable energy consumption, and carbon dioxide emissions. Indeed, economic growth tends to increase environmental pollution in Europe, while an increase in using renewable energy seems to reduce CO2 emissions. In the short term, economic growth may have a more dominant influence on CO2 emissions, leading to increased environmental pollution. However, in the long term, the positive impact of increased use of renewable energy might become more significant, contributing to a reduction in CO2 emissions. The reason is that implementing renewable energy within the industrial fabric generates high costs in the short run. However, it could lead to greater efficiency and productivity in the long run, thus enhancing wealth and sustainability while lowering emissions. Therefore, this implies the trade-off between economic development and CO2 emission. Alternatively, the authorities should consider environmental factors when developing the annual economic growth target.
Furthermore, the results indicate the difference in the short-run relationship between countries. For countries such as Belgium, Denmark, France, Croatia, Italy, Cyprus, Hungary, and Romania, there is a short-run relationship but no significant effects of economic growth and the percentage of renewable energy on CO2 emission. Rather, this again confirms the long-run cointegration in these nations. All this could depend on the morphology of the mix of energy resources used. Take Belgium, France and Hungary into consideration. We can say that half (up to 77% in the case of France) of the energy used in countries is produced through nuclear energy (which is not a renewable energy). This means that the use of renewable energy can certainly impact carbon emissions. Still, it will have this long-term effect, for example, due to ongoing redevelopment toward safer forms of energy. In Denmark, for example, renewable energy has not impacted carbon emissions in a short time because 80% of the electricity produced in the country comes from renewable sources. So, the reduction in emissions will depend on other variables. If we also want to consider Cyprus, the non-significance in the short term depends on at least two factors: infrastructural and technological constraints and dependence on fossil fuels. The infrastructure for renewable energy production and consumption is not well-established or the technology adoption is limited, so the immediate impact on emissions is subdued. It takes time for renewable energy projects to be developed and integrated into the energy system. In addition, Cyprus is still heavily dependent on fossil fuels for its energy needs, and the short-term effects of incorporating renewable energy could be mitigated. The transition from fossil fuels to renewable energy often involves a gradual process, and during the initial stages, the reduction in fossil fuel use may not be substantial.
Furthermore, in the short term, other variables not considered certainly impact emissions, such as energy efficiency at an industrial and domestic level, reducing energy consumption per unit of production or activity. Another factor could be mobility, i.e., changing travel habits and adopting zero-emission vehicles. Last but not least, various policies and taxes (incentives and taxes) for reducing emissions could have a considerable impact in the short term.
Mixed short-run relationships between economic growth, renewable energy consumption, and CO2 emission are found among Bulgaria, Germany, Greece, Latvia, Lithuania, Malta, and Austria. Nonetheless, there is no evidence of their short-run relationship in Estonia, Luxembourg, Netherlands, Poland, Slovenia, and Sweden.
Our findings provide several important policy implications for different groups of countries. To encourage the view of the European Union on CO2 emission reduction by at least 55% by 2030 toward becoming climate-neutral regions by 2050, individual country members, regardless of countries with the highest or the lowest transition risk ratio, should achieve the following:
- Have the same vision toward zero emissions and take their actions consistently both in the short term and long term. Although there is no evidence of the association between economic growth, sustainable energy consumption, and greenhouse gas emissions in several countries in the short run, the long-run relationship exists. Stop making excuses; the time for action is now. They should promote the creation of green jobs and keep the EU’s track record of CO2 emission reduction. Furthermore, country members should commit to developing and implementing an ambitious and cost-effective target plan to gradually reduce energy imports from Russia, the United Arab Emirates, and others.
- For a group of countries showing the short-run relationship between the share of consumption of renewable energy and CO2 emissions, the authorities should further continue speeding up alternative energy programs to reduce CO2 emissions while growing their economies. For example, they should immediately implement renewables in power generation, industry, buildings, and transportation (i.e., electric cars).
- To build more renewable energy power plants (e.g., solar panels and windmills), the authorities should encourage more banks to participate in green credit programs, especially Net-Zero Banking Alliance.
- Given the importance of climate change and sustainability, it is necessary and urgent to create a data platform functional to the world of sustainability with integrated, transparent, automatically collected data (currently lacking and poorly evident).
Author Contributions
Conceptualization, E.D.F.; methodology, E.D.F.; software, E.D.F.; validation, E.D.F.; formal analysis, E.D.F.; investigation, E.D.F.; resources, E.D.F.; data curation, E.D.F.; writing—original draft preparation, E.D.F.; writing—review and editing, E.D.F. and T.L.; visualization, E.D.F. and T.L.; supervision, E.A. All authors have read and agreed to the published version of the manuscript.
Funding
This research received no external funding.
Data Availability Statement
Data available in a publicly accessible repository: Eurostat, World Development Indicators.
Conflicts of Interest
The authors declare no conflict of interest.
References
- Adebola Solarin, Sakiru, Usama Al-Mulali, and Ilhan Ozturk. 2017. Validating the Environmental Kuznets Curve Hypothesis in India and China: The Role of Hydroelectricity Consumption. Renewable and Sustainable Energy Reviews 80: 1578–87. [Google Scholar] [CrossRef]
- Al-Mulali, Usama, Hassan F. Gholipour, and Sakiru Adebola Solarin. 2022. Investigating the Environmental Kuznets Curve (EKC) Hypothesis: Does Government Effectiveness Matter? Evidence from 170 Countries. Environment, Development and Sustainability 24: 12740–55. [Google Scholar] [CrossRef]
- Apergis, Nicholas, and Dan Constantin Danuletiu. 2014. Renewable Energy and Economic Growth: Evidence from the Sign of Panel Long-Run Causality. International Journal of Energy Economics and Policy 4: 578–87. [Google Scholar]
- Boukhelkhal, Abdelaziz. 2022. Energy Use, Economic Growth and CO2 Emissions in Africa: Does the Environmental Kuznets Curve Hypothesis Exist? New Evidence from Heterogeneous Panel under Cross-Sectional Dependence. Environment, Development and Sustainability 24: 13083–110. [Google Scholar] [CrossRef]
- Canning, David, and Peter Pedroni. 2008. Infrastructure, long-run economic growth and causality tests for cointegrated panels. The Manchester School 76: 504–27. [Google Scholar] [CrossRef]
- Cherni, Abdelbaki, and Sana Essaber Jouini. 2017. An ARDL Approach to the CO2 Emissions, Renewable Energy and Economic Growth Nexus: Tunisian Evidence. International Journal of Hydrogen Energy 42: 29056–66. [Google Scholar] [CrossRef]
- Cho, Sangmin, Eunnyeong Heo, and Jihyo Kim. 2015. Causal Relationship between Renewable Energy Consumption and Economic Growth: Comparison between Developed and Less-Developed Countries. Geosystem Engineering 18: 284–91. [Google Scholar] [CrossRef]
- Dogan, Eyup, and Berna Turkekul. 2016. CO2 Emissions, Real Output, Energy Consumption, Trade, Urbanization and Financial Development: Testing the EKC Hypothesis for the USA. Environmental Science and Pollution Research 23: 1203–13. [Google Scholar] [CrossRef] [PubMed]
- Engle, Robert F., and C.W.J. Granger. 1987. Co-integration and Error Correction: Representation, Estimation, and Testing. Econometrica 55: 251–76. Available online: https://www.jstor.org/stable/1913236 (accessed on 22 January 2023). [CrossRef]
- European Banking Authority. 2021a. Eba Report on Management and Supervision of Esg Risks for Credit Institutions and Investment Firms Eba/Rep/2021/18 Eba Report on Management and Supervision of Esg Risks for Credit Institutions and Investment Firms 2; Paris: European Banking Authority.
- European Banking Authority. 2021b. On Management and Supervision of ESG Rısks for Credit Instutıons and Investment Firms; Paris: European Banking Authority, p. 166.
- European Banking Authority. 2022. Final Draft Implementing Technical Standards on Prudential Disclosures on ESG Risks in Accordance with Article 449a CRR. Available online: https://www.fbcmich.org/resources/fsc (accessed on 20 June 2022).
- European Central Bank. 2020. Guide on Climate-Related and Environmental Risks Risk Management and Disclosure. European Central Bank. no. November: 1–54. Available online: https://www.bankingsupervision.europa.eu/press/pr/date/2020/html/ssm.pr201127~5642b6e68d.en.html (accessed on 20 June 2022).
- European Central Bank. 2021. Climate-Related Risk and Financial Stability. ECB/ESRB Project Team on Climate Risk Monitoring. no. July: 111. Available online: https://www.ecb.europa.eu/pub/pdf/other/ecb.climateriskfinancialstability202107~87822fae81.en.pdf (accessed on 20 June 2022).
- European Commission. 2019. The European Green Deal-Communication from the Commission to the European Parliament, the European Council, the Council, the European Economic and Social Committee and the Committee of the Regions; Brussels: European Commission.
- European Environment Agency. 2019. The Sustainability Transition in Europe in an Age of Demographic and Technological Change; Copenhage: European Environment Agency.
- European Environment Agency. 2021. The Role of (Environmental) Taxation in Supporting Sustainability Transitions; Copenhage: European Environment Agency. [CrossRef]
- European Parliament. 2008. Directive 2009/28/EC of the European Parliament and of the Council of 23 April 2009. Promotion of the Use of Energy from Renewable Sources and Amending and Subsequently Repealing Directives 2001/77/EC and 2003/30/EC; Strasbourg: European Parliament, vol. 1.
- European Union. 2022. REPower the EU by Engaging with Energy Partners in a Changing World. May. Maastricht: European Union. [Google Scholar] [CrossRef]
- Ferreira, Ernesto, José Alberto Fuinhas, and Victor Moutinho. 2022. An Investigation of the Environmental Kuznets Relationship in BRICS Countries at a Sectoral Economic Level. Energy Systems 13: 1031–54. [Google Scholar] [CrossRef]
- Guo, Jessie, Daniel Kubli, and Patrick Saner. 2021. The Economics of Climate Change: No Action Not an Option. Swiss Re Institute. no. April: 34. Available online: https://www.swissre.com/institute/research/topics-and-risk-dialogues/climate-and-natural-catastrophe-risk/expertise-publication-economics-of-climate-change.html (accessed on 27 June 2022).
- Htike, Myo Myo, Anil Shrestha, and Makoto Kakinaka. 2021. Investigating Whether the Environmental Kuznets Curve Hypothesis Holds for Sectoral CO2 Emissions: Evidence from Developed and Developing Countries. Environment, Development and Sustainability 24: 12712–39. [Google Scholar] [CrossRef] [PubMed]
- Johansen, Soren, and Katarina Juselius. 1990. Maximum Likelihood Estimation and Inference on Cointegration-with Applications to the Demand for Money. Oxford Bulletin of Economics and Statistics 52: 169–210. [Google Scholar] [CrossRef]
- Pesaran, M. Hashem, and Ron Smith. 1995. Estimating Long-Run Relationships from Dynamic Heterogeneous Panels. Journal of Econometrics 68: 79–113. [Google Scholar] [CrossRef]
- Pesaran, M. Hashem, Yongcheol Shin, and Richard J. Smith. 2001. Bounds Testing Approaches to the Analysis of Level Relationships. Journal of Applied Econometrics 16: 289–326. [Google Scholar] [CrossRef]
- Pesaran, M. Hashem, Yongcheol Shin, and Ron P. Smith. 1999. Pooled Mean Group Estimation of Dynamic Heterogeneous Panels. Journal of the American Statistical Association 94: 621–34. [Google Scholar] [CrossRef]
- Pesaran, M. Hashem. 2008. An Autoregressive Distributed-Lag Modelling Approach to Cointegration Analysis. In Econometrics and Economic Theory in the 20th Century: The Ragnar Frisch Centennial Symposium. Cambridge: Cambridge University Press, pp. 371–413. [Google Scholar] [CrossRef]
- Salahodjaev, Raufhon, Kongratbay Sharipov, Nizomiddin Rakhmanov, and Dilshod Khabirov. 2022. Tourism, Renewable Energy and CO2 Emissions: Evidence from Europe and Central Asia. Environment, Development and Sustainability 24: 13282–93. [Google Scholar] [CrossRef]
- Salazar-Núñez, Héctor F., Francisco Venegas-Martínez, and José Antonio Lozano-Díez. 2022. Assessing the Interdependence among Renewable and Non-Renewable Energies, Economic Growth, and CO2 Emissions in Mexico. Environment, Development and Sustainability 24: 12850–66. [Google Scholar] [CrossRef]
- Sanderson, Benjamin M., and Brian C. O’Neill. 2020. Assessing the Costs of Historical Inaction on Climate Change. Scientific Reports 10: 9173. [Google Scholar] [CrossRef] [PubMed]
- Weinhold, Diana. 1999. A Dynamic Fixed Effects Model for Heterogeneous Panel Data. London: London School of Economics. Mimeo. [Google Scholar]
Disclaimer/Publisher’s Note: The statements, opinions and data contained in all publications are solely those of the individual author(s) and contributor(s) and not of MDPI and/or the editor(s). MDPI and/or the editor(s) disclaim responsibility for any injury to people or property resulting from any ideas, methods, instructions or products referred to in the content. |
© 2023 by the authors. Licensee MDPI, Basel, Switzerland. This article is an open access article distributed under the terms and conditions of the Creative Commons Attribution (CC BY) license (https://creativecommons.org/licenses/by/4.0/).