
Temporal Clustering of the Causes of Death for Mortality Modelling


Abstract
:1. Introduction
- The addition of a clustering approach of the causes of death that allows for temporality. This gap is essential because it would enable actuaries to incorporate causes of death features in their judgment for future mortality experience.
- Applying the causes of death features in a developing country setting to expand mortality modeling literature in such jurisdictions.
1.1. Clustering
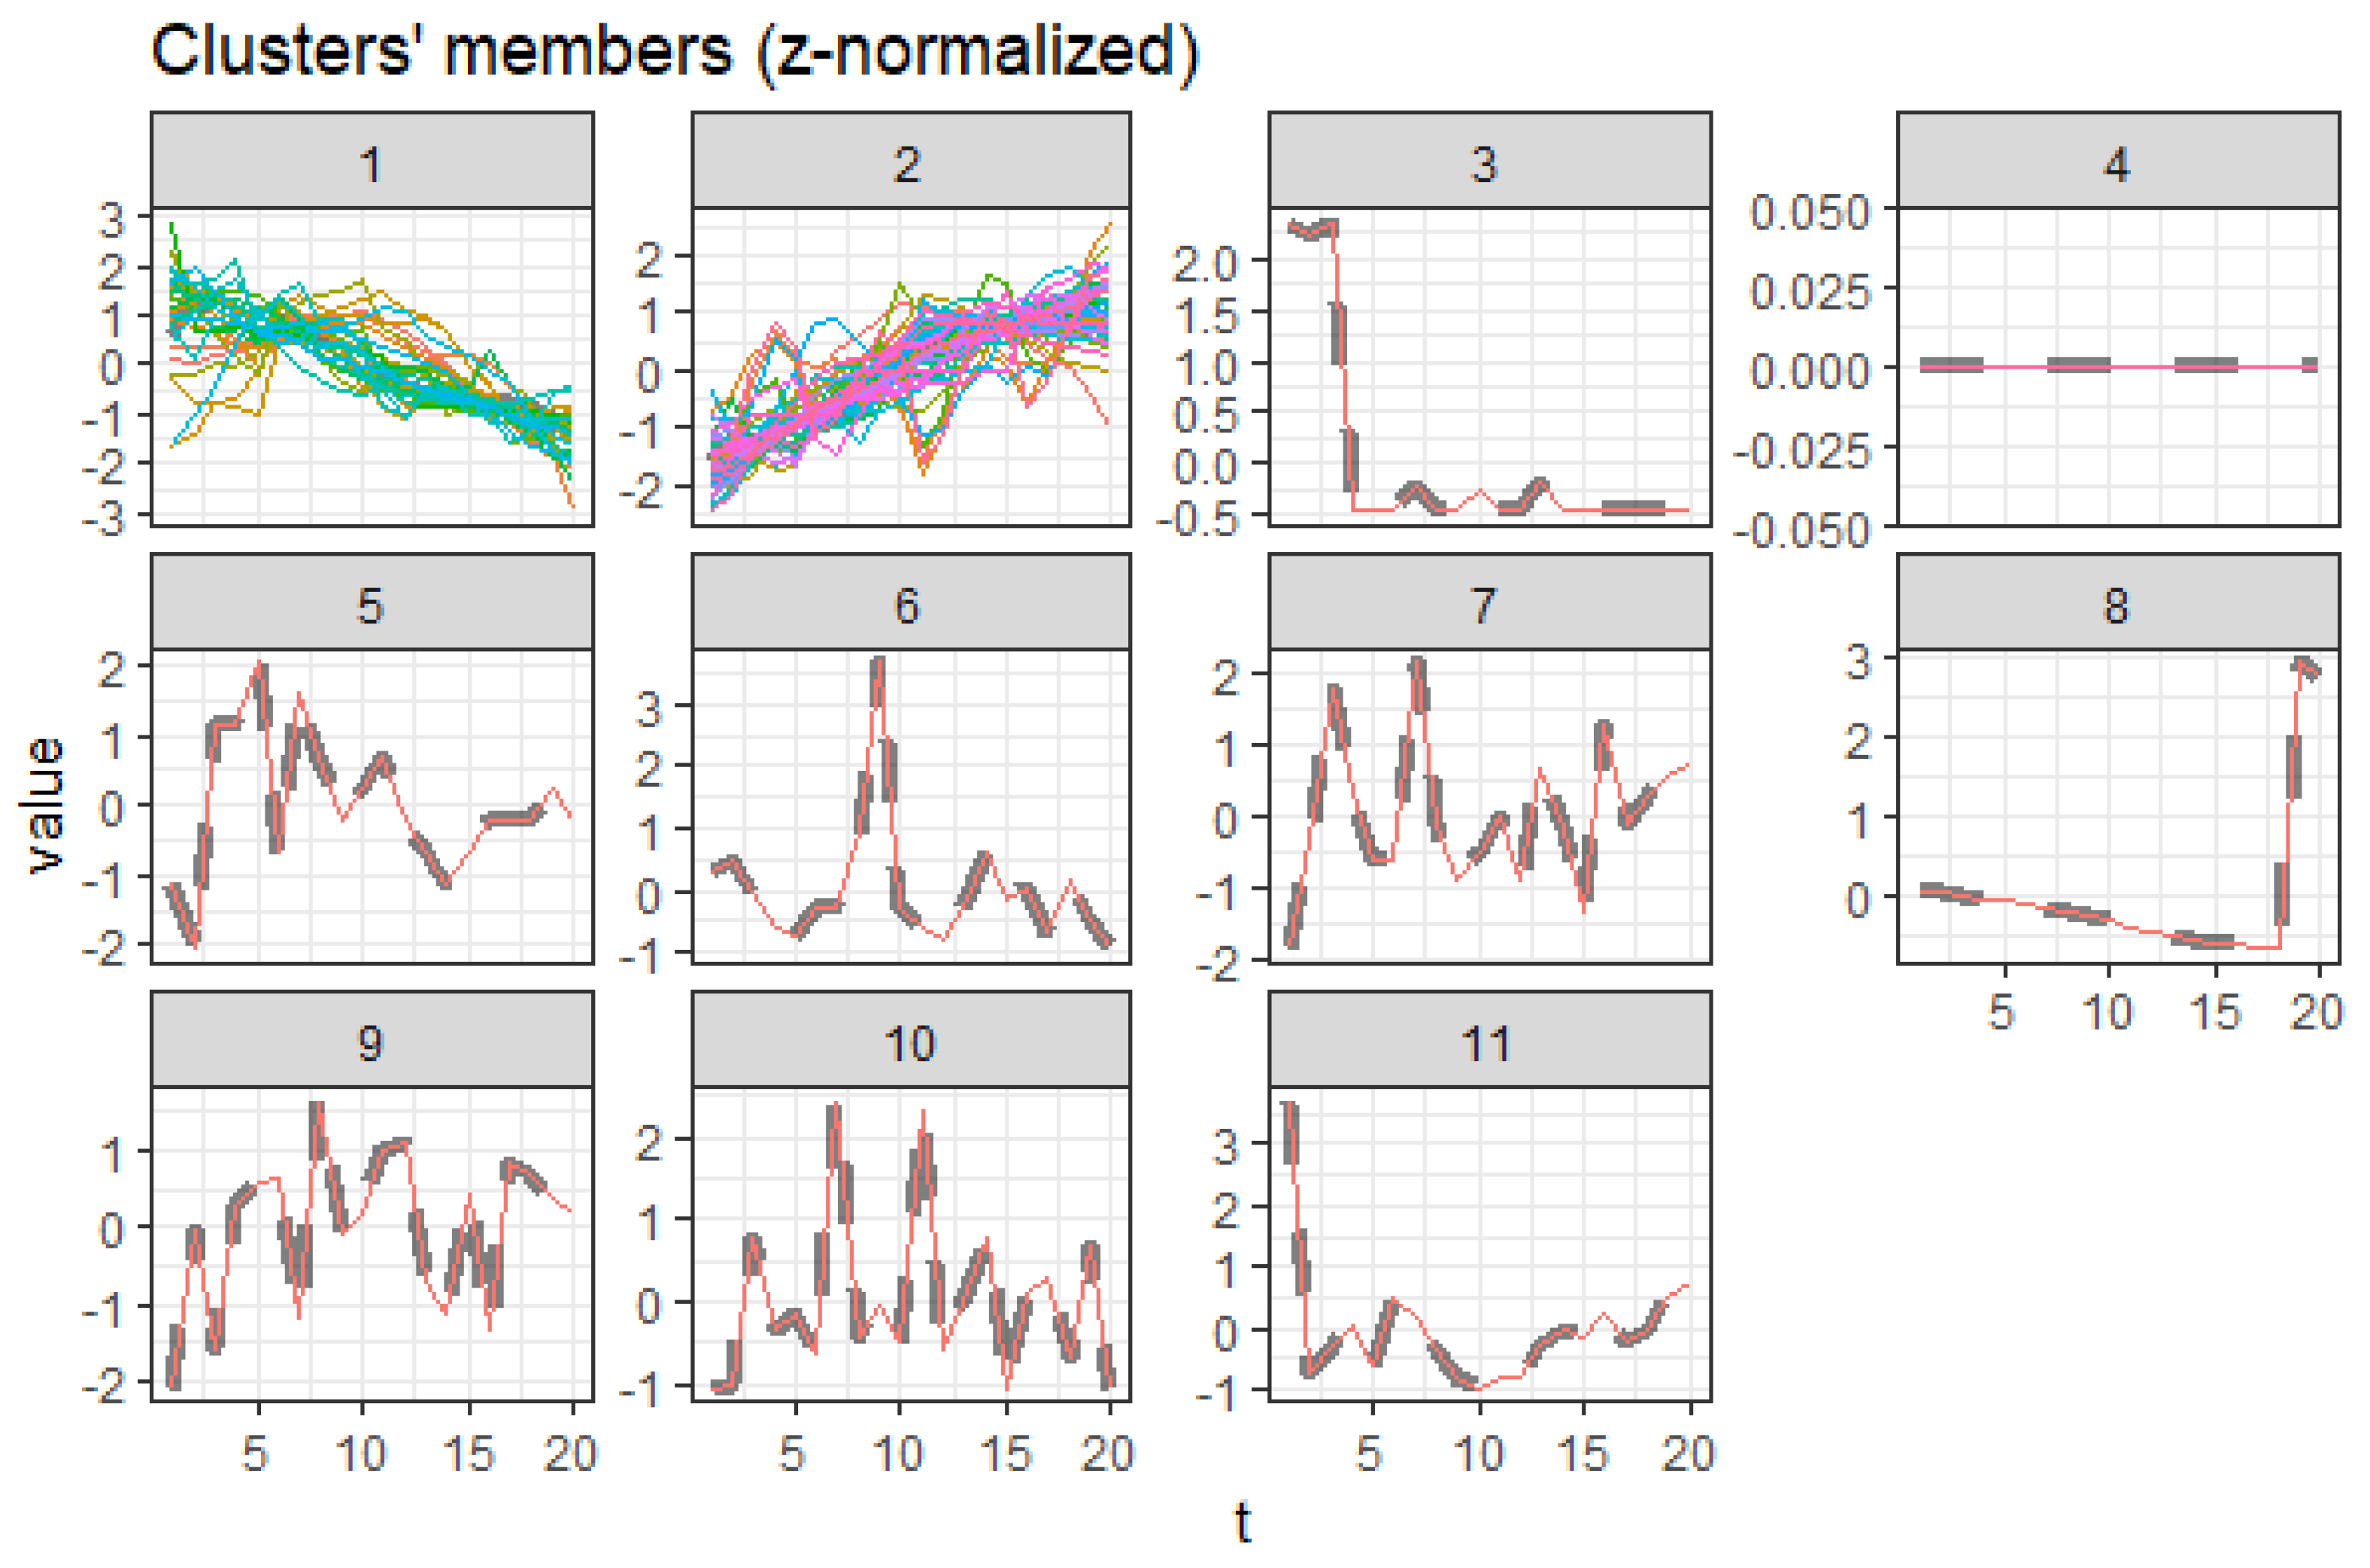
1.2. DTW Barycenter Averaging—DBA
2. Materials and Methods
2.1. Data Source
2.2. Notations
2.3. Clustering Tendency
2.4. Hierarchical Agglomerative Clustering
| Algorithm 1 Hierarchical Agglomerative Clustering Algorithm |
|
2.5. Distance Measures
2.6. Stepwise Procedure for DTW Barycenter Averaging (DBA)
2.7. Cluster Validity
2.8. Cluster Elimination Approach
3. Results and Discussions
3.1. Cluster Tendency
3.2. Optimal Clusters
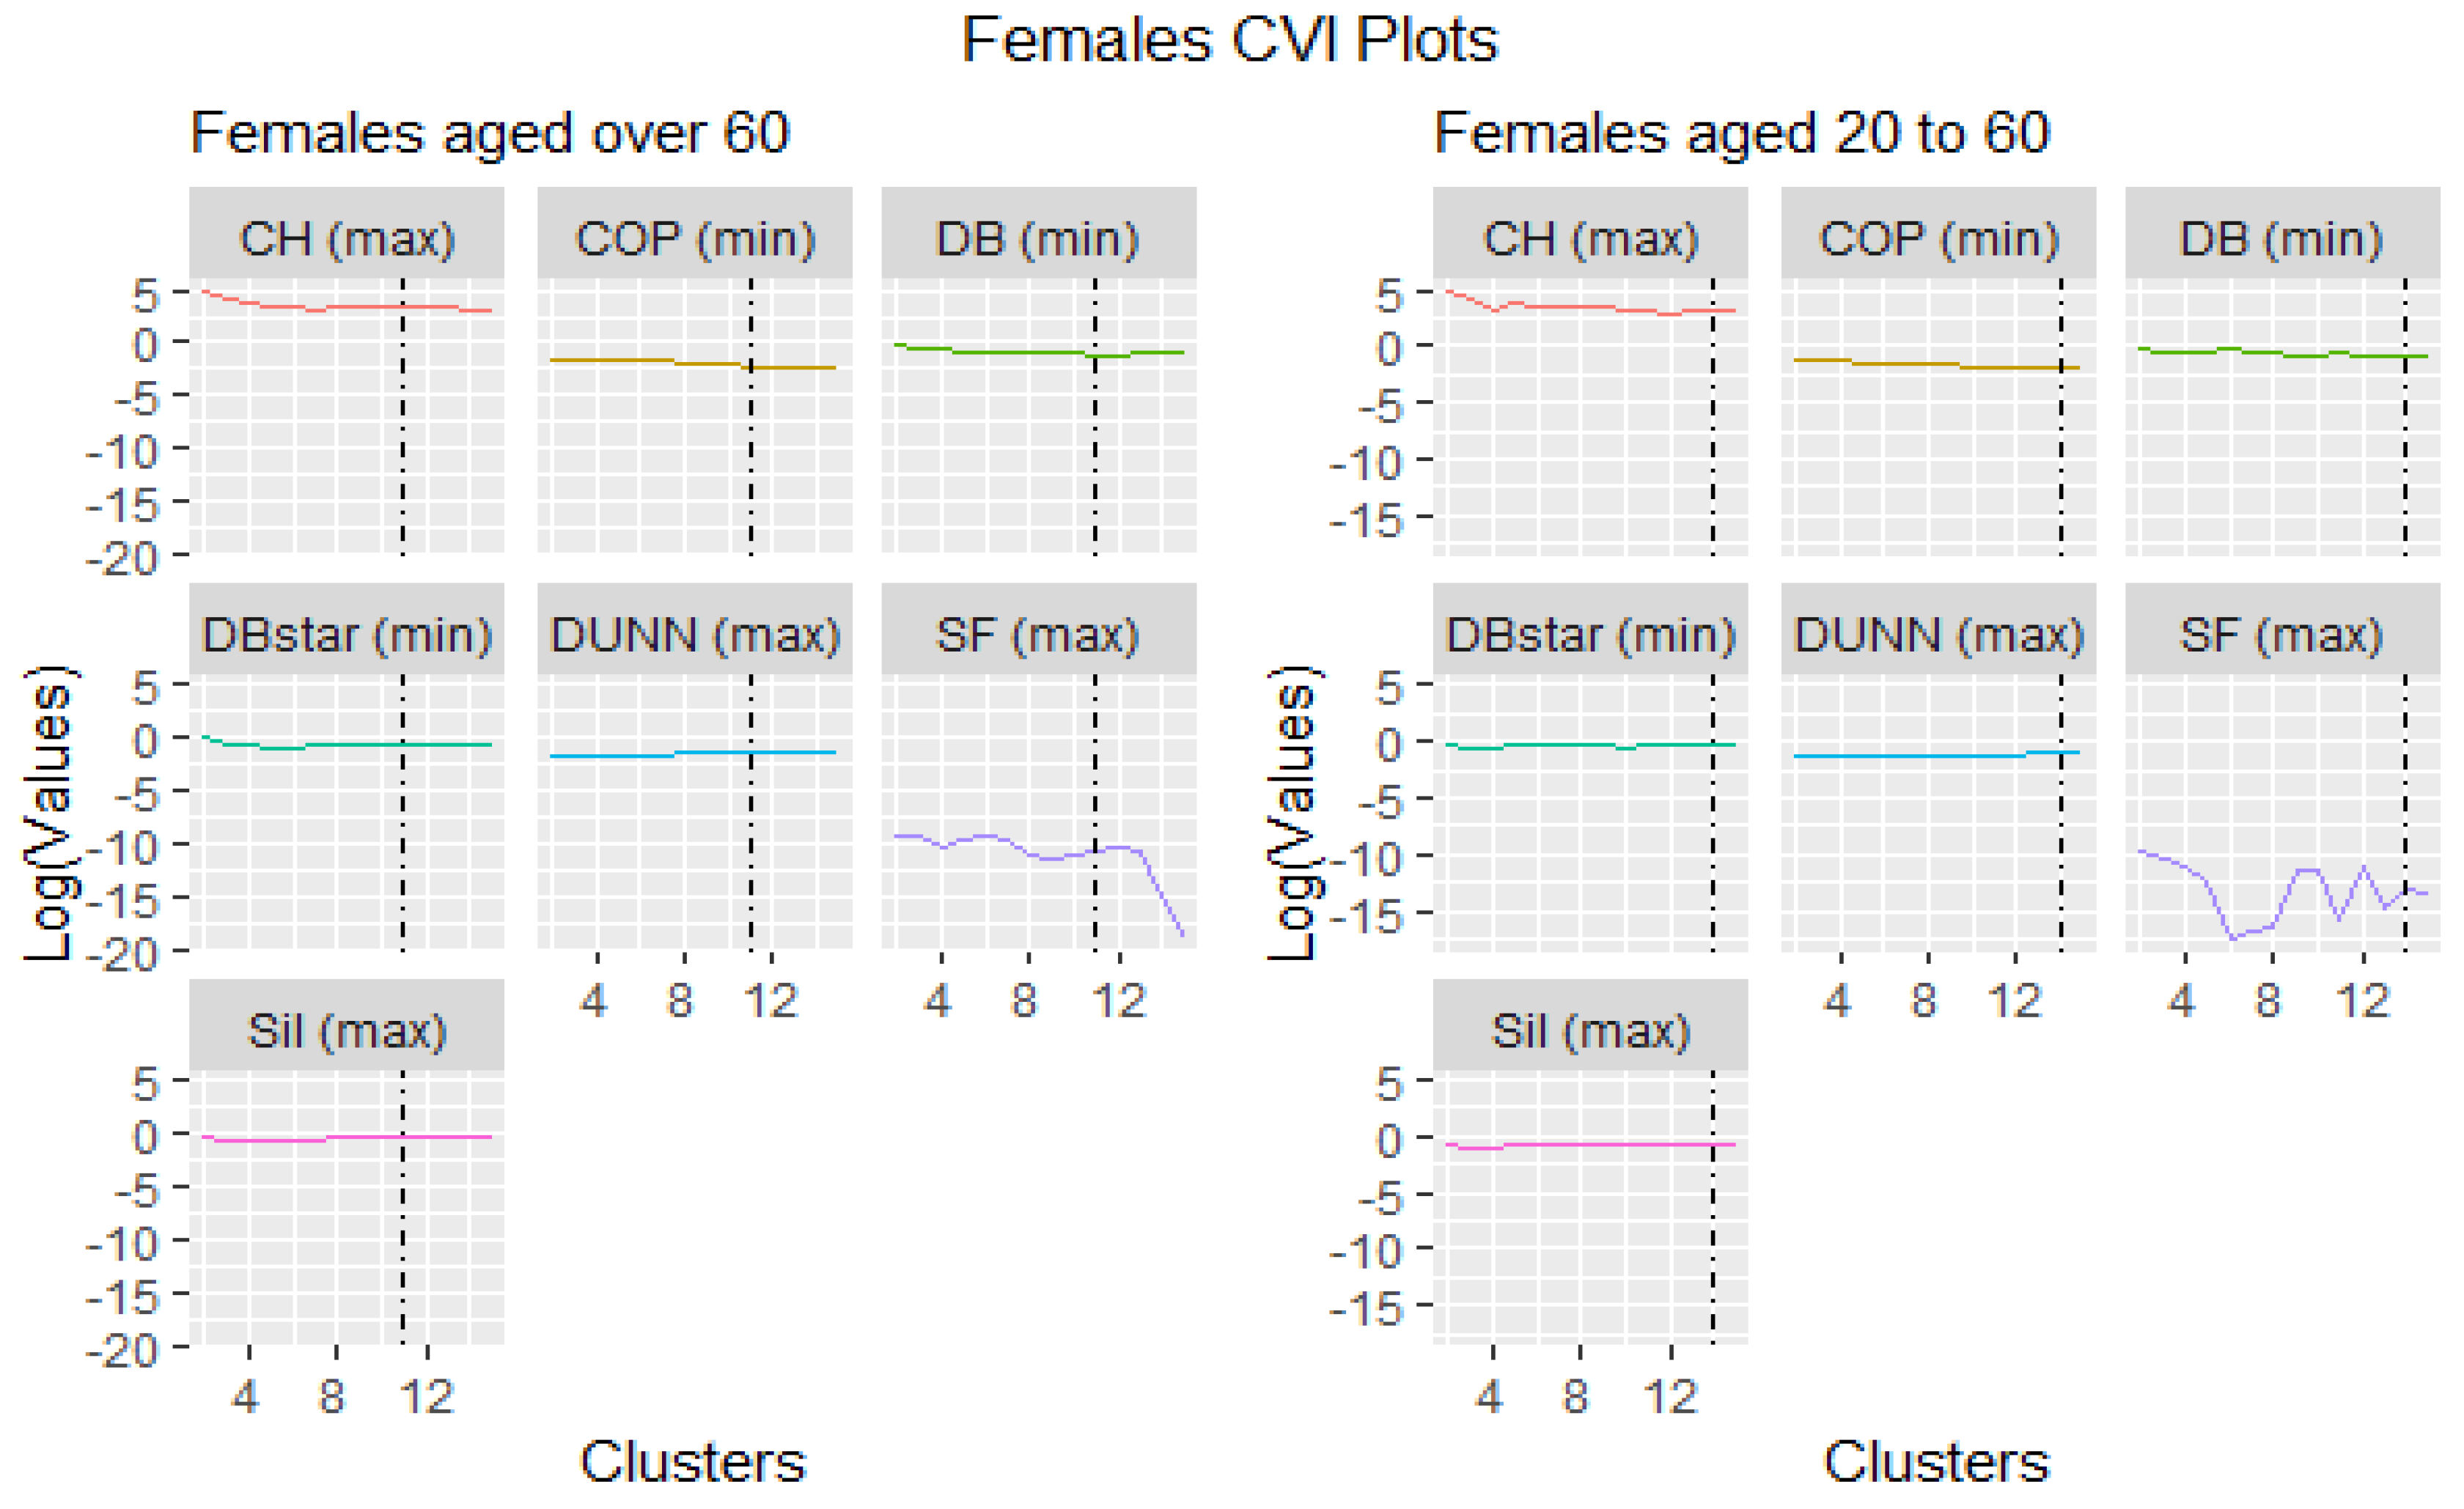
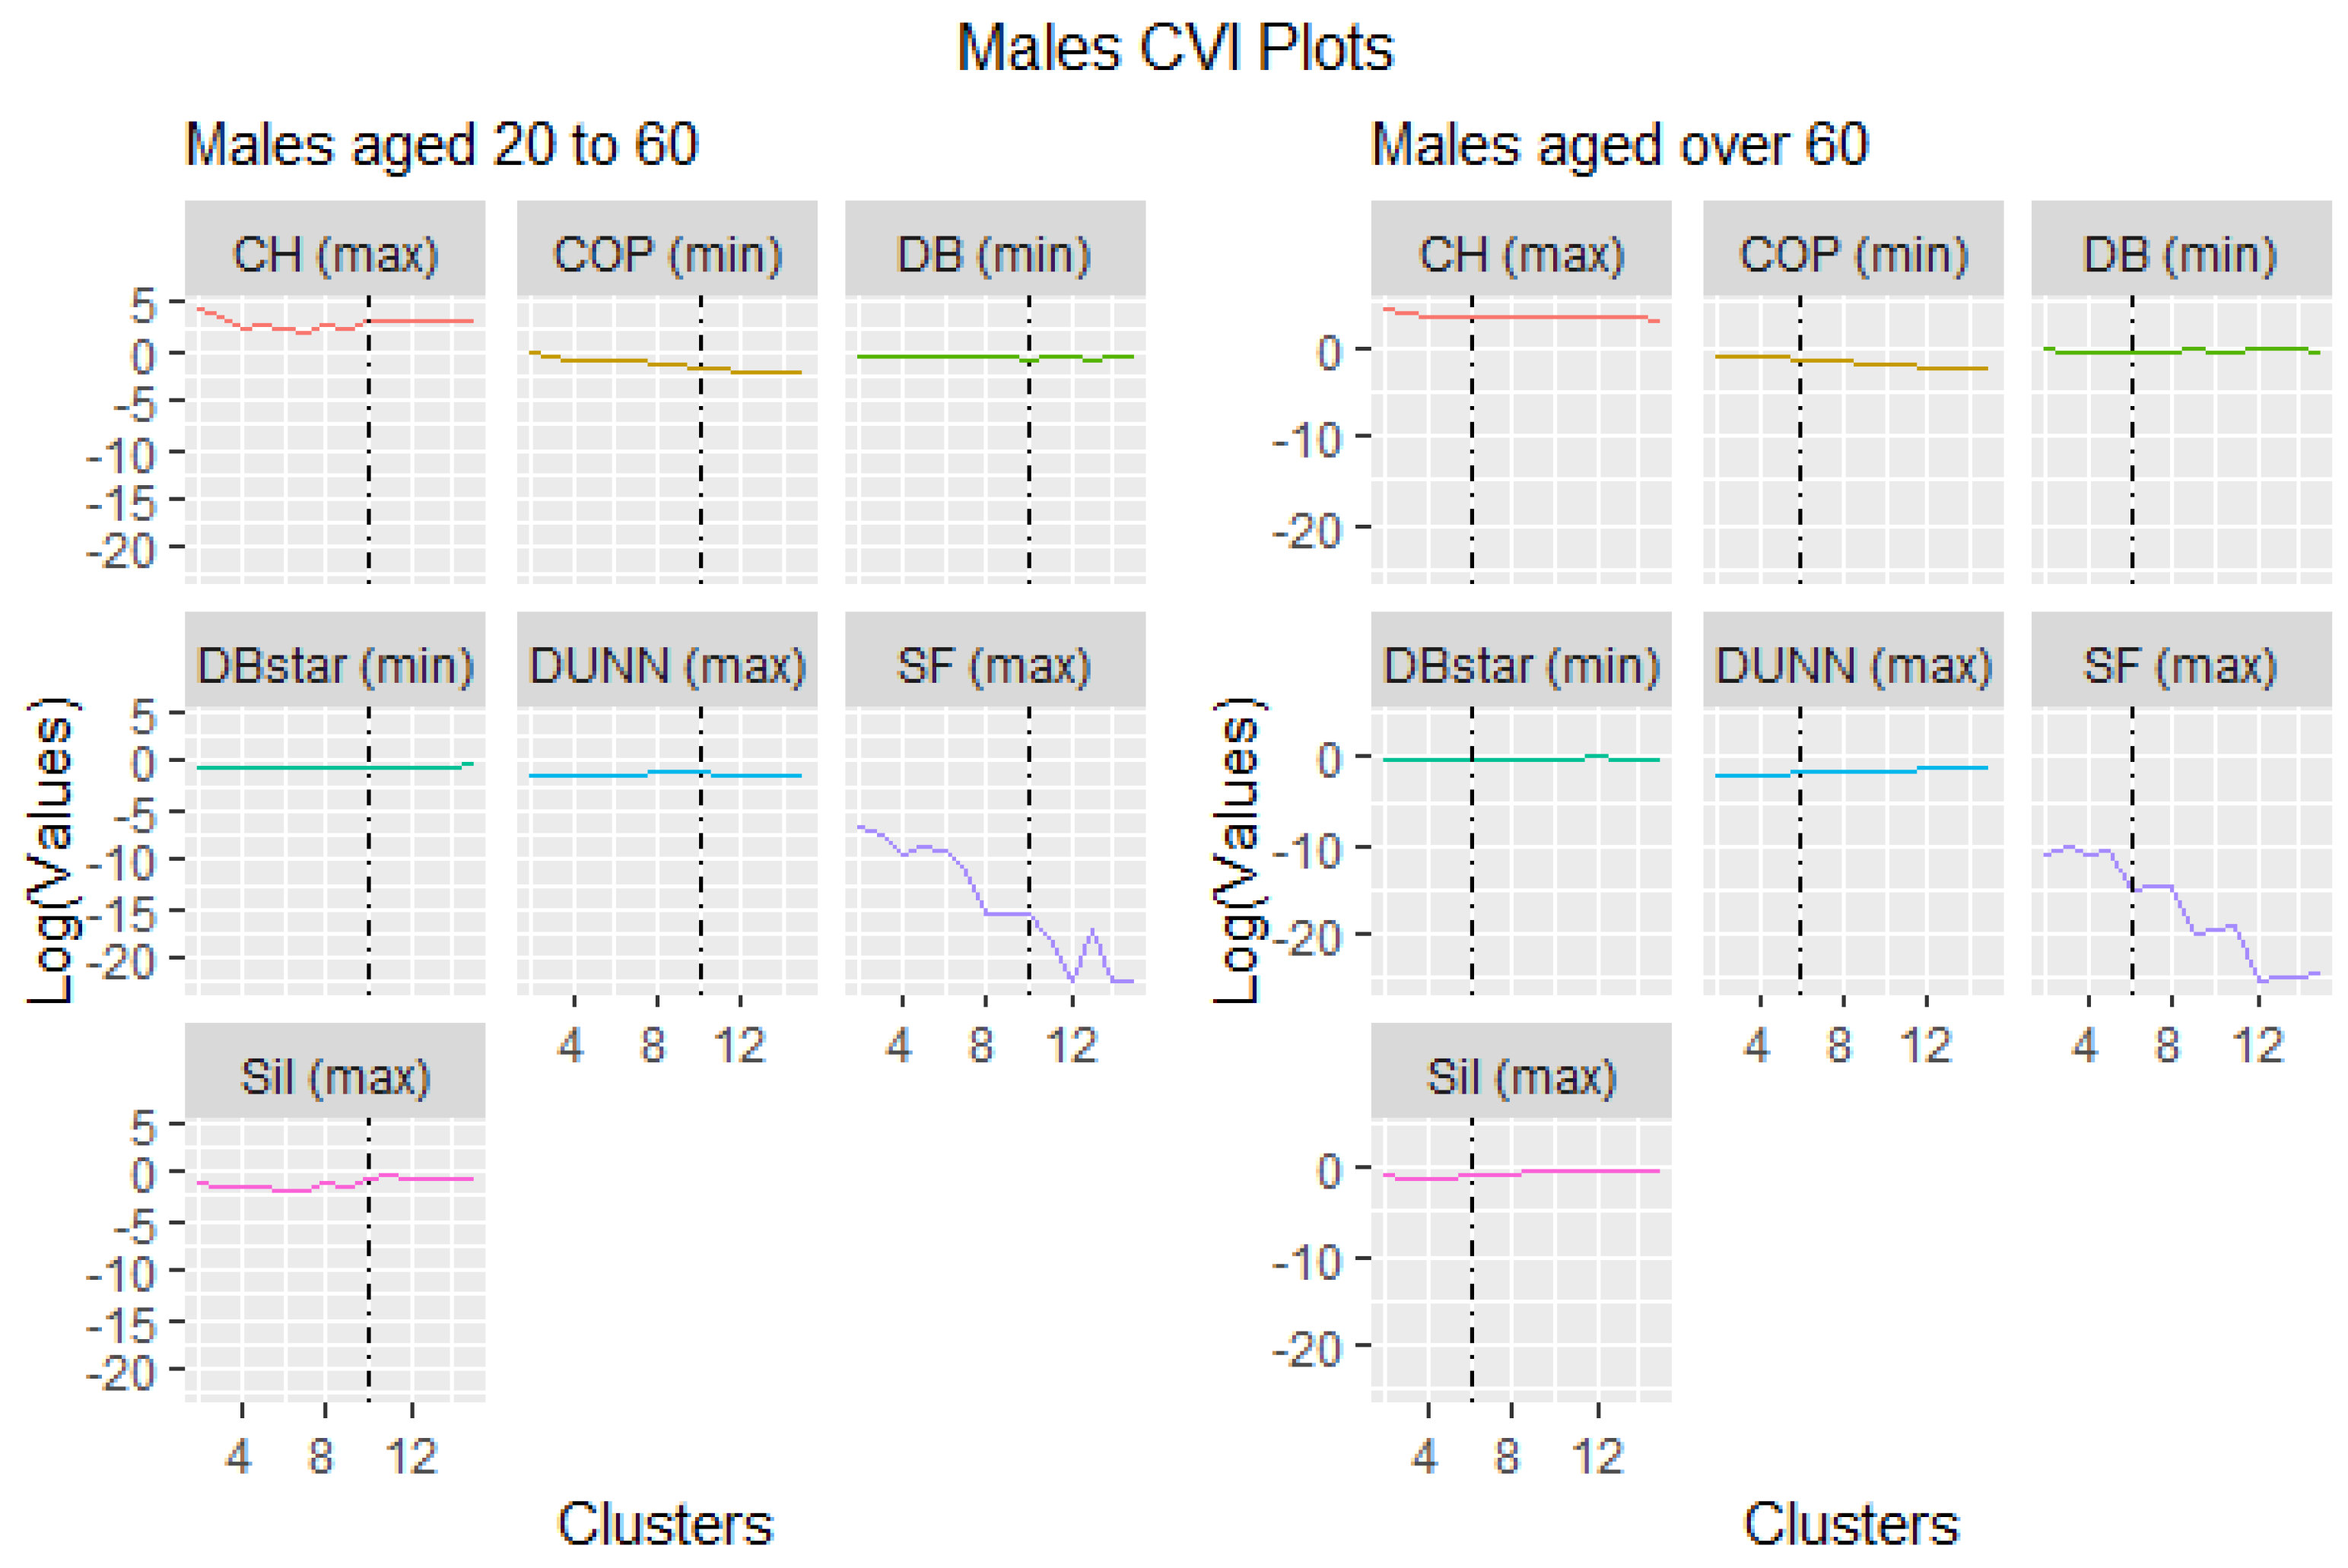
3.3. Cluster Validity Indices
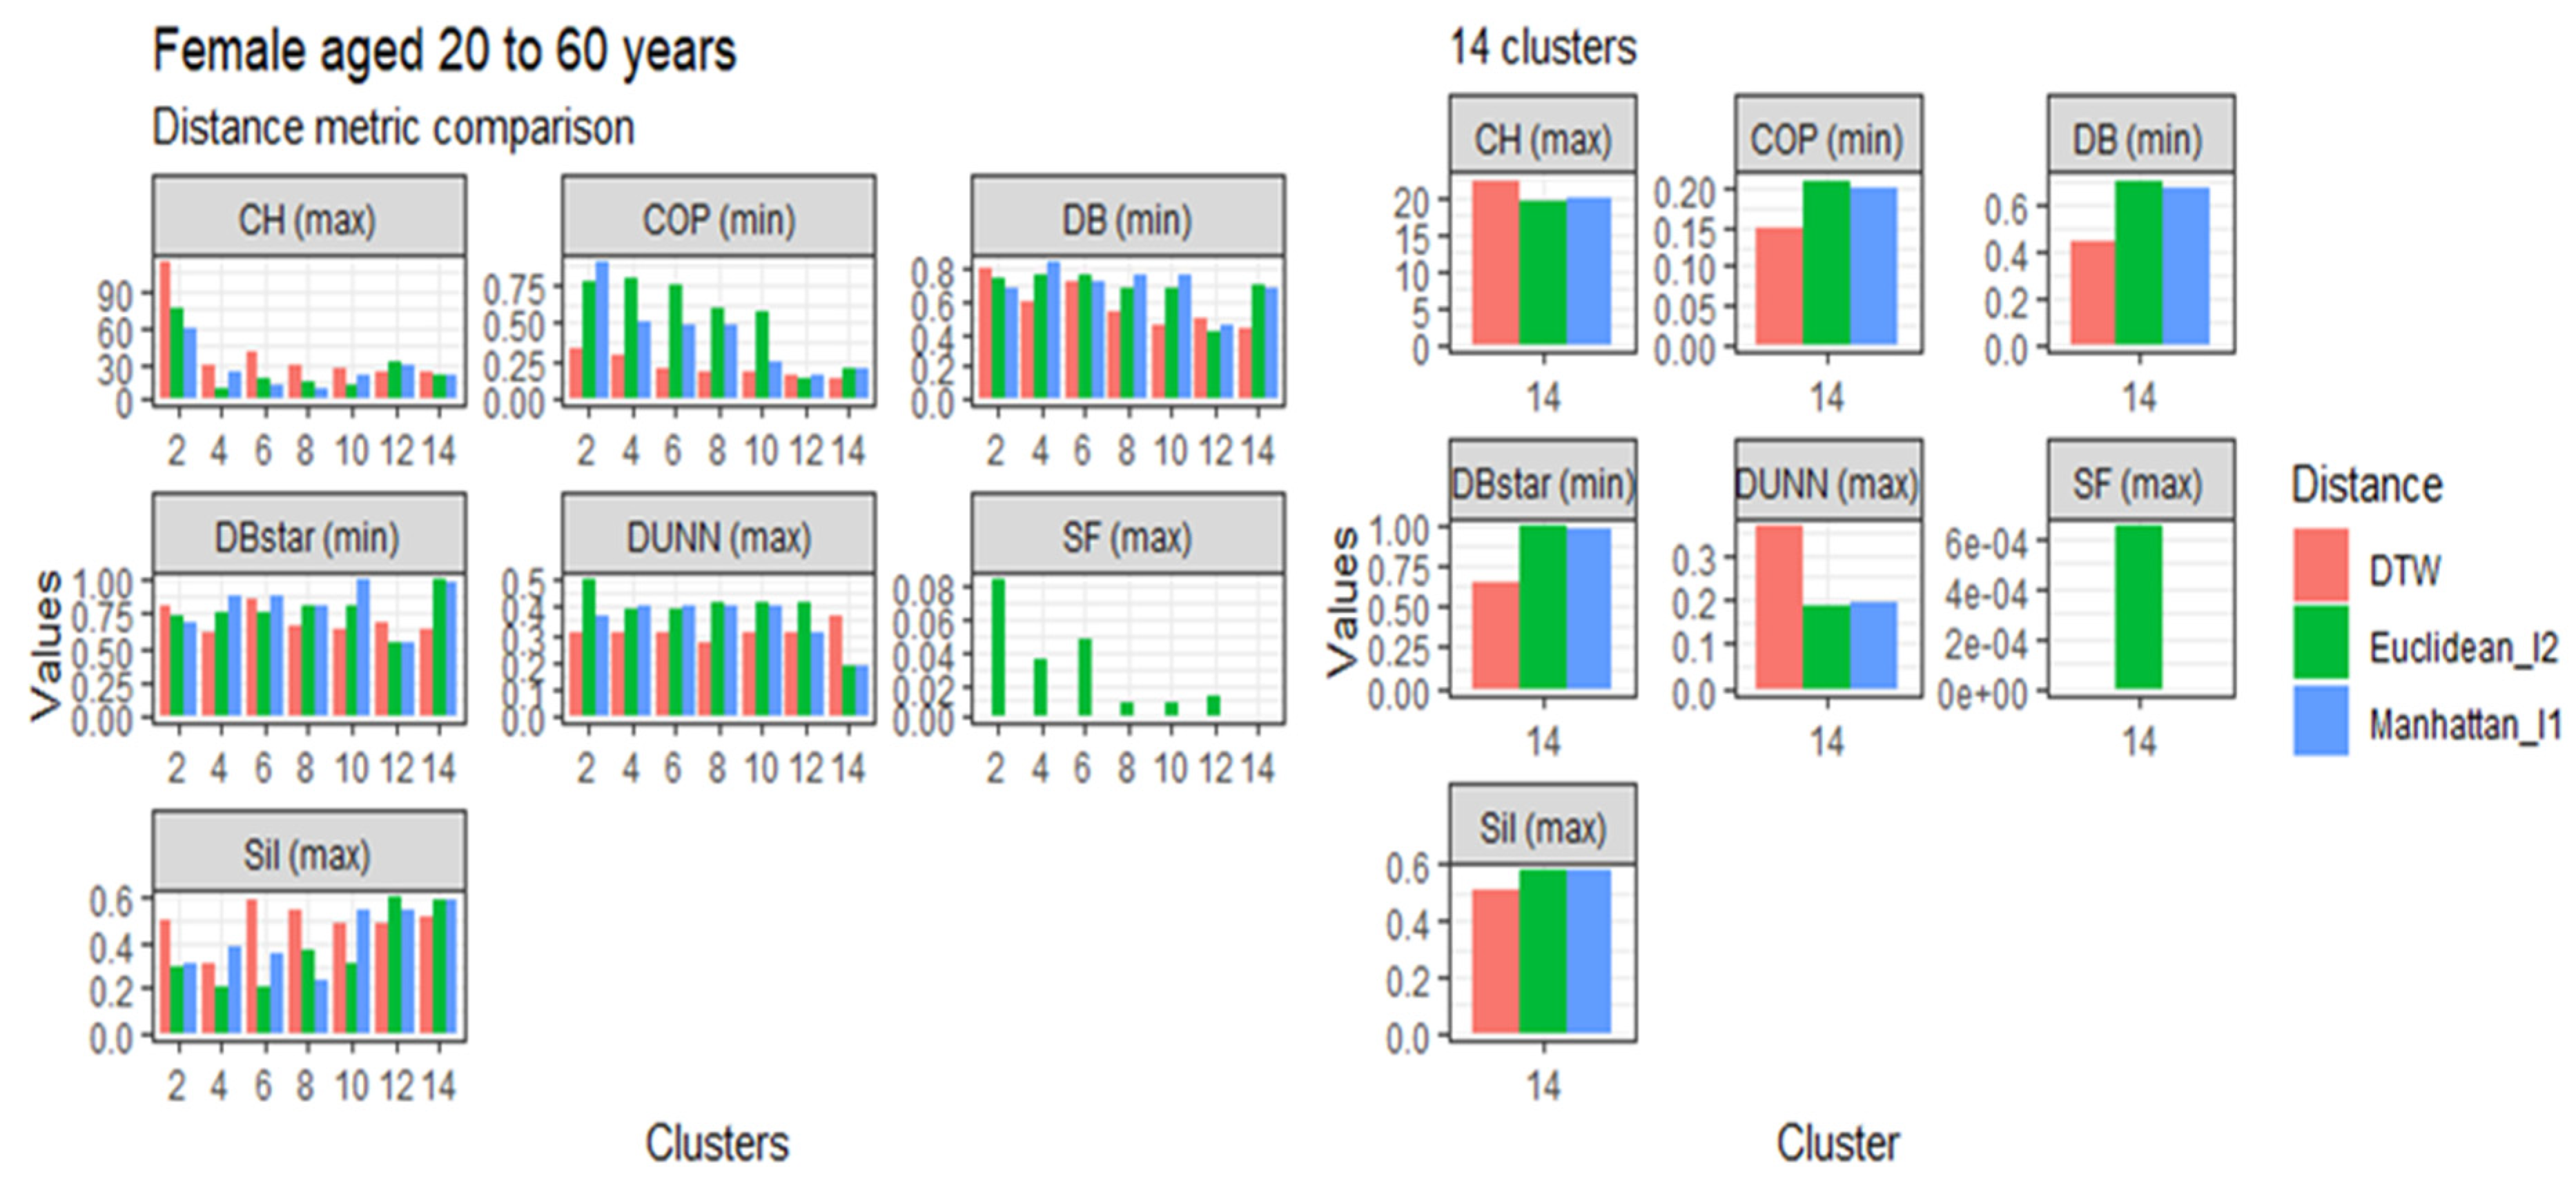
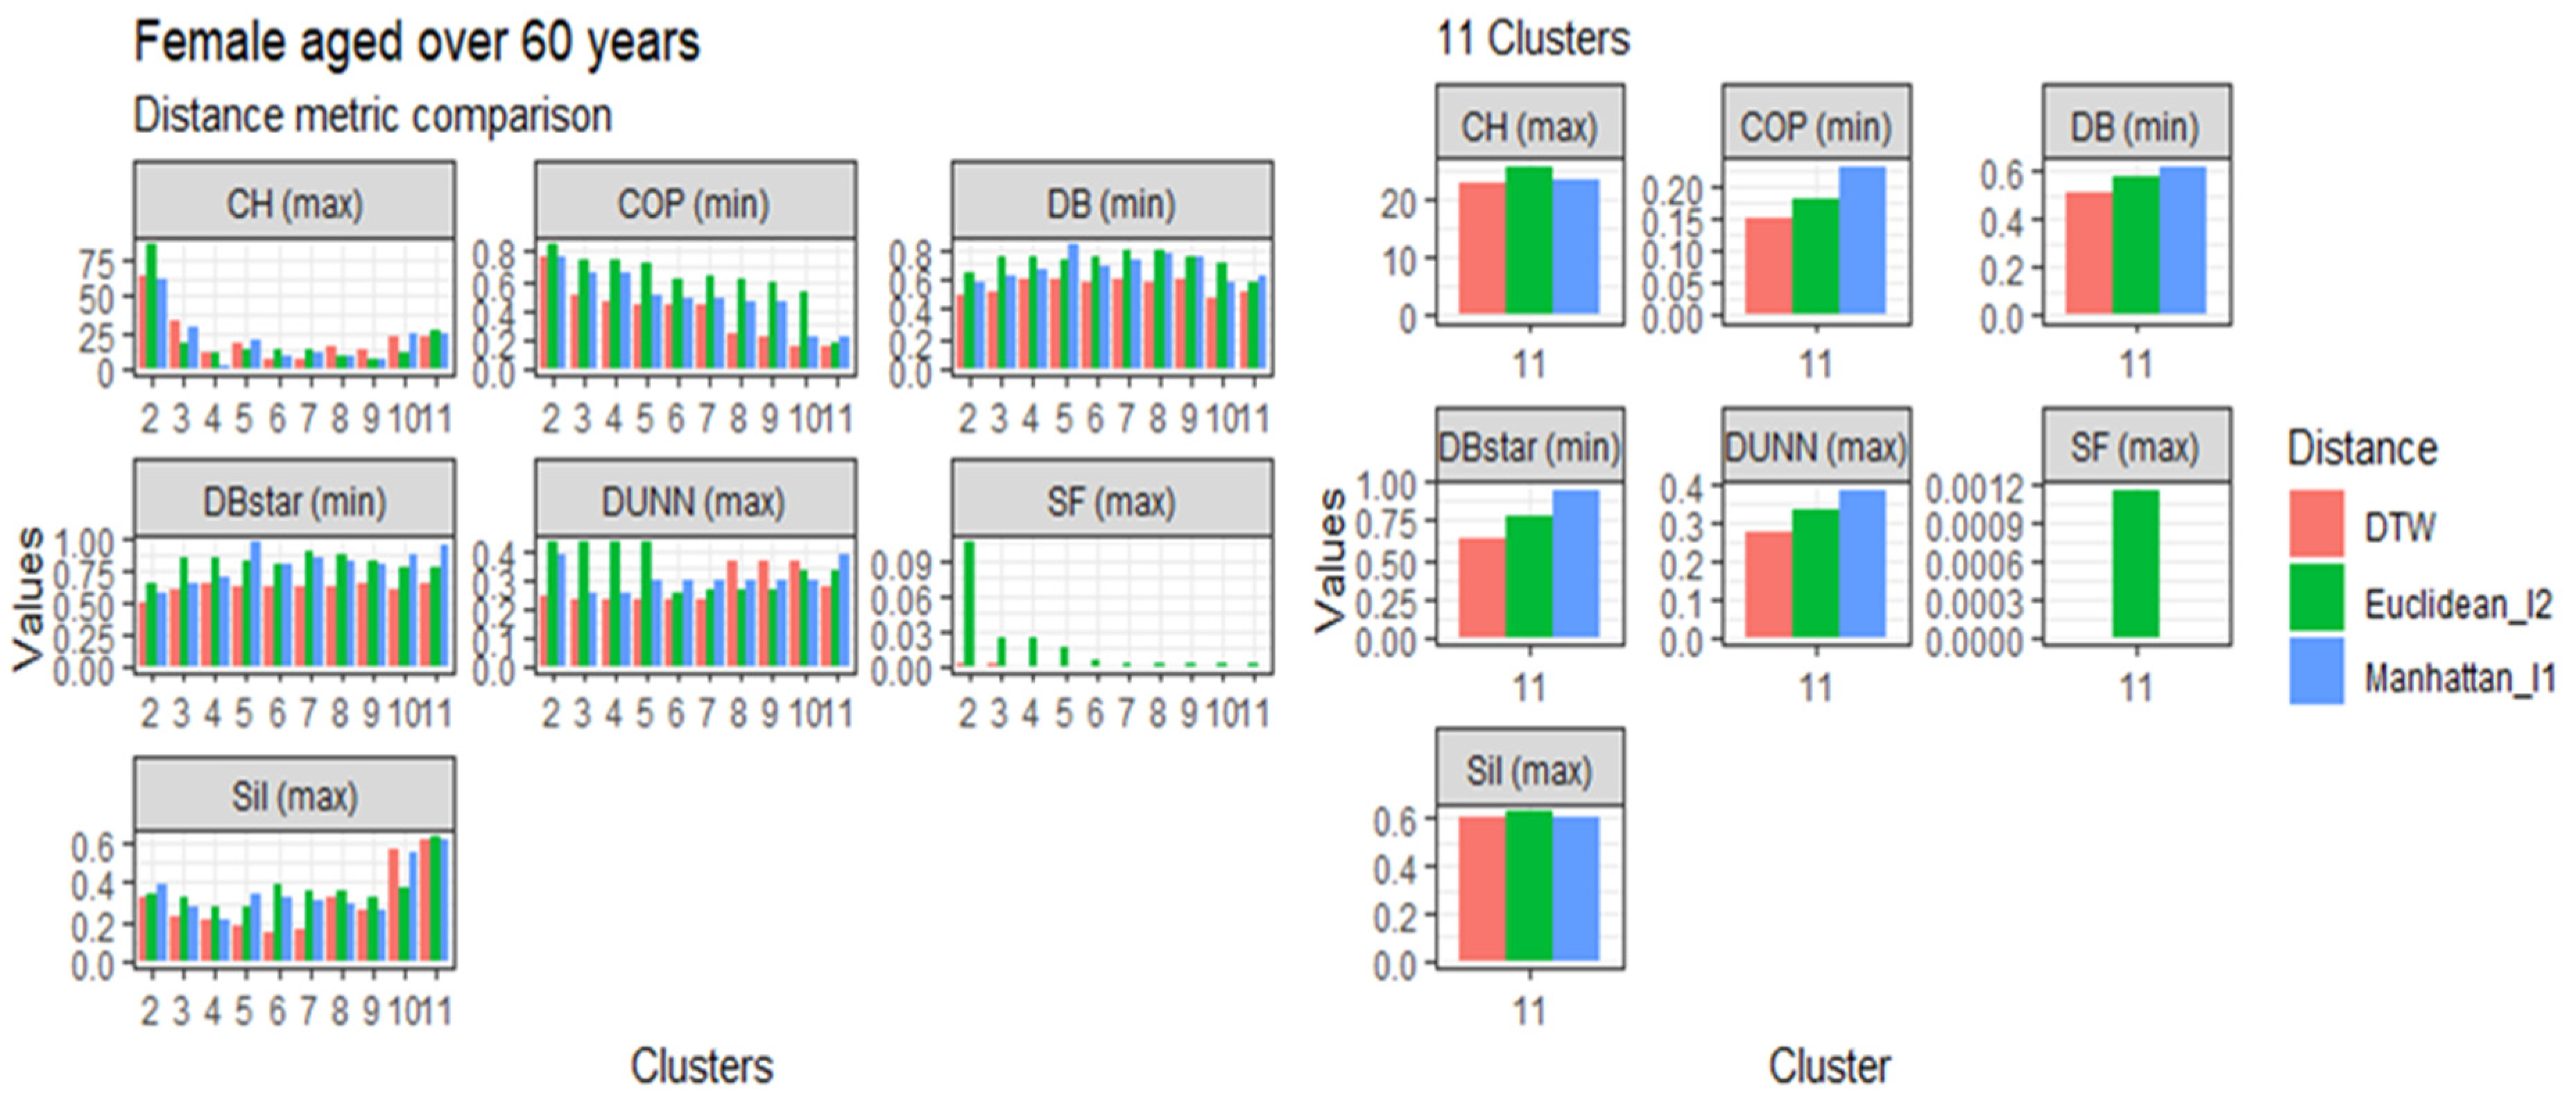
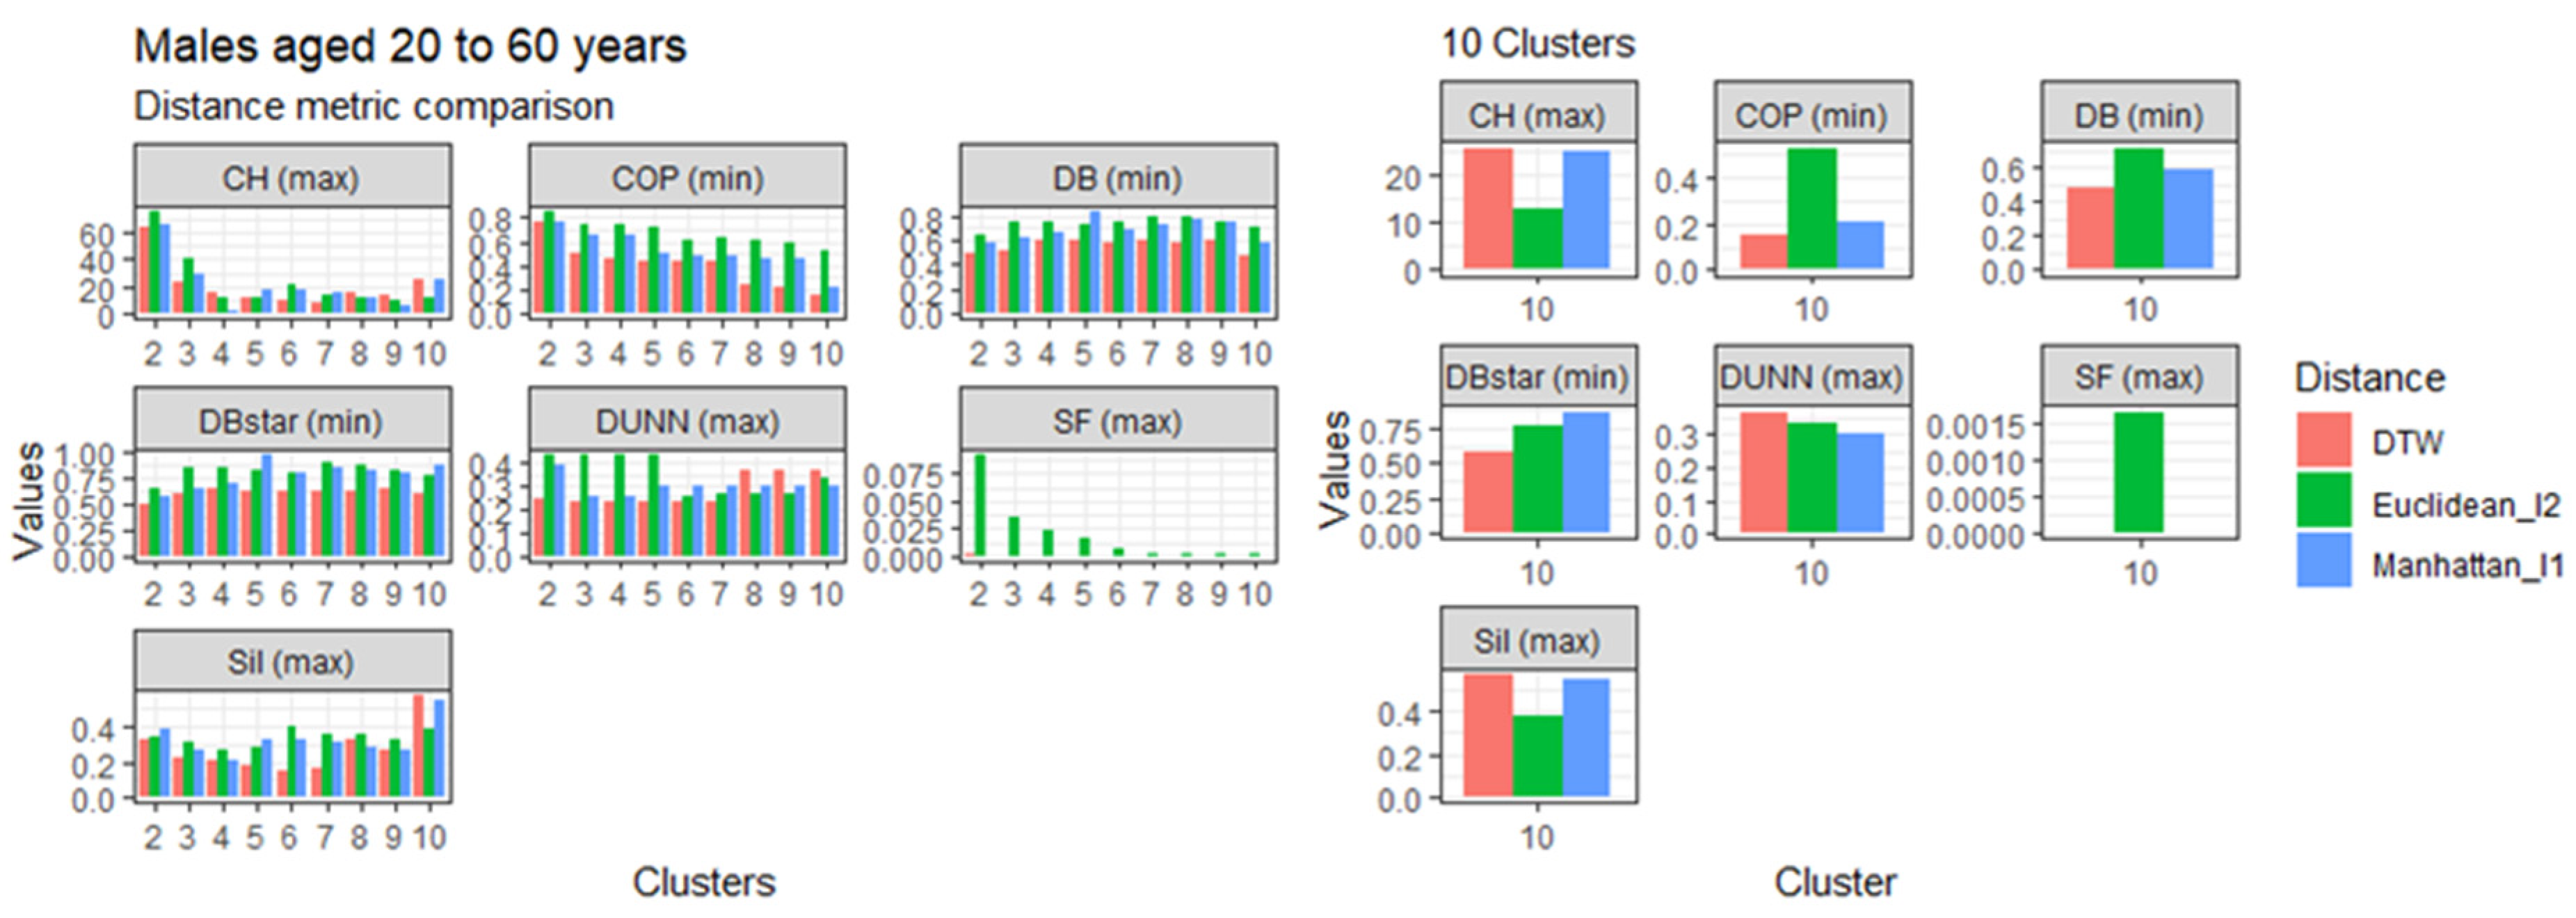
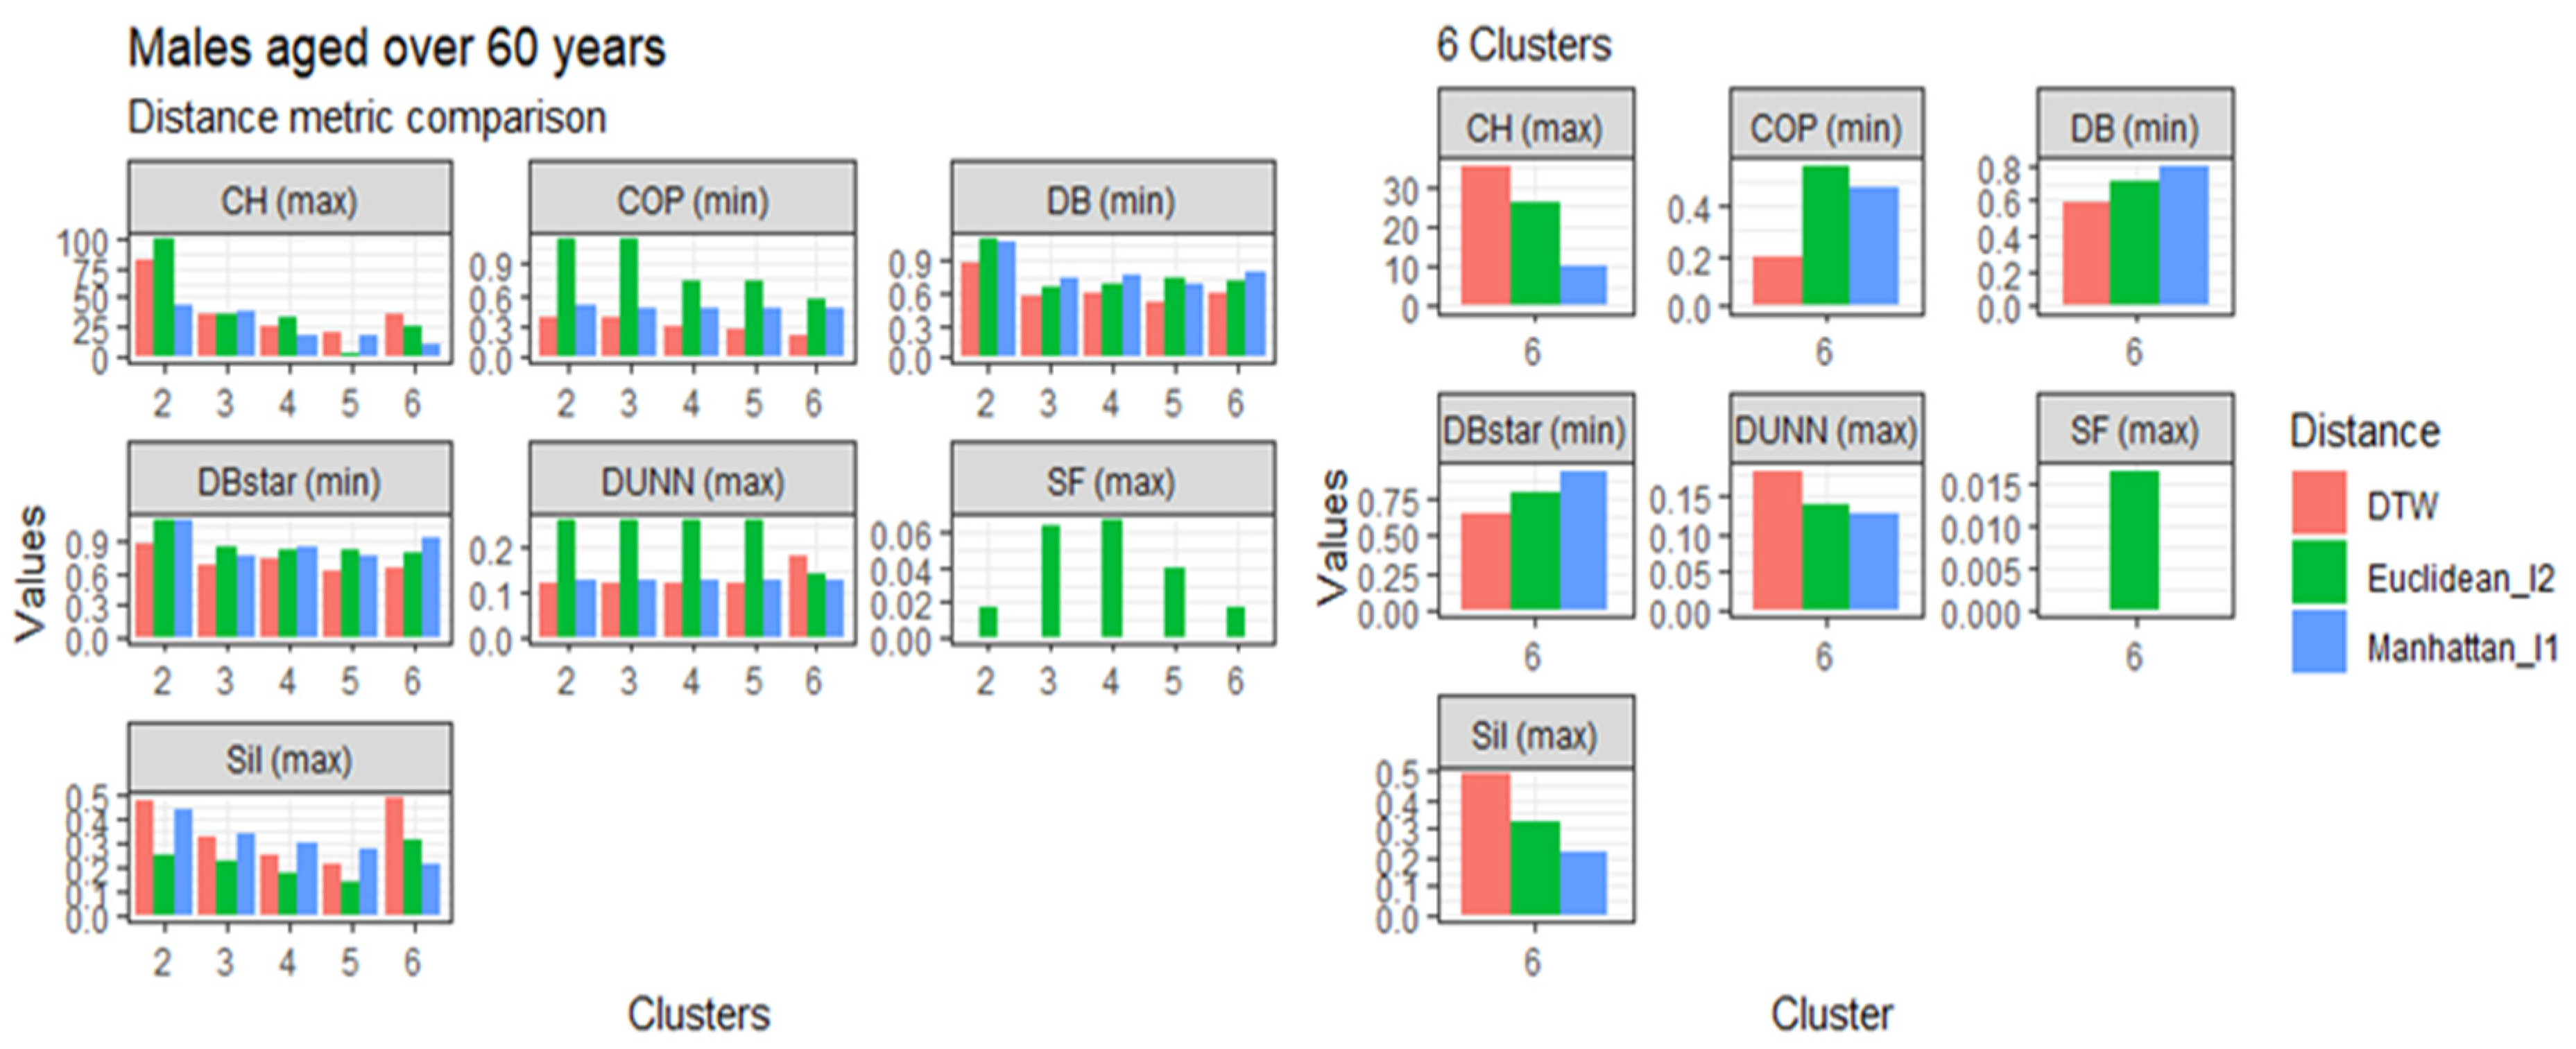
3.4. Comparison of the Dynamic Time Warping—DBA with the Euclidean (l1 Norm) and the Manhattan (l2 Norm) Distance Metrics
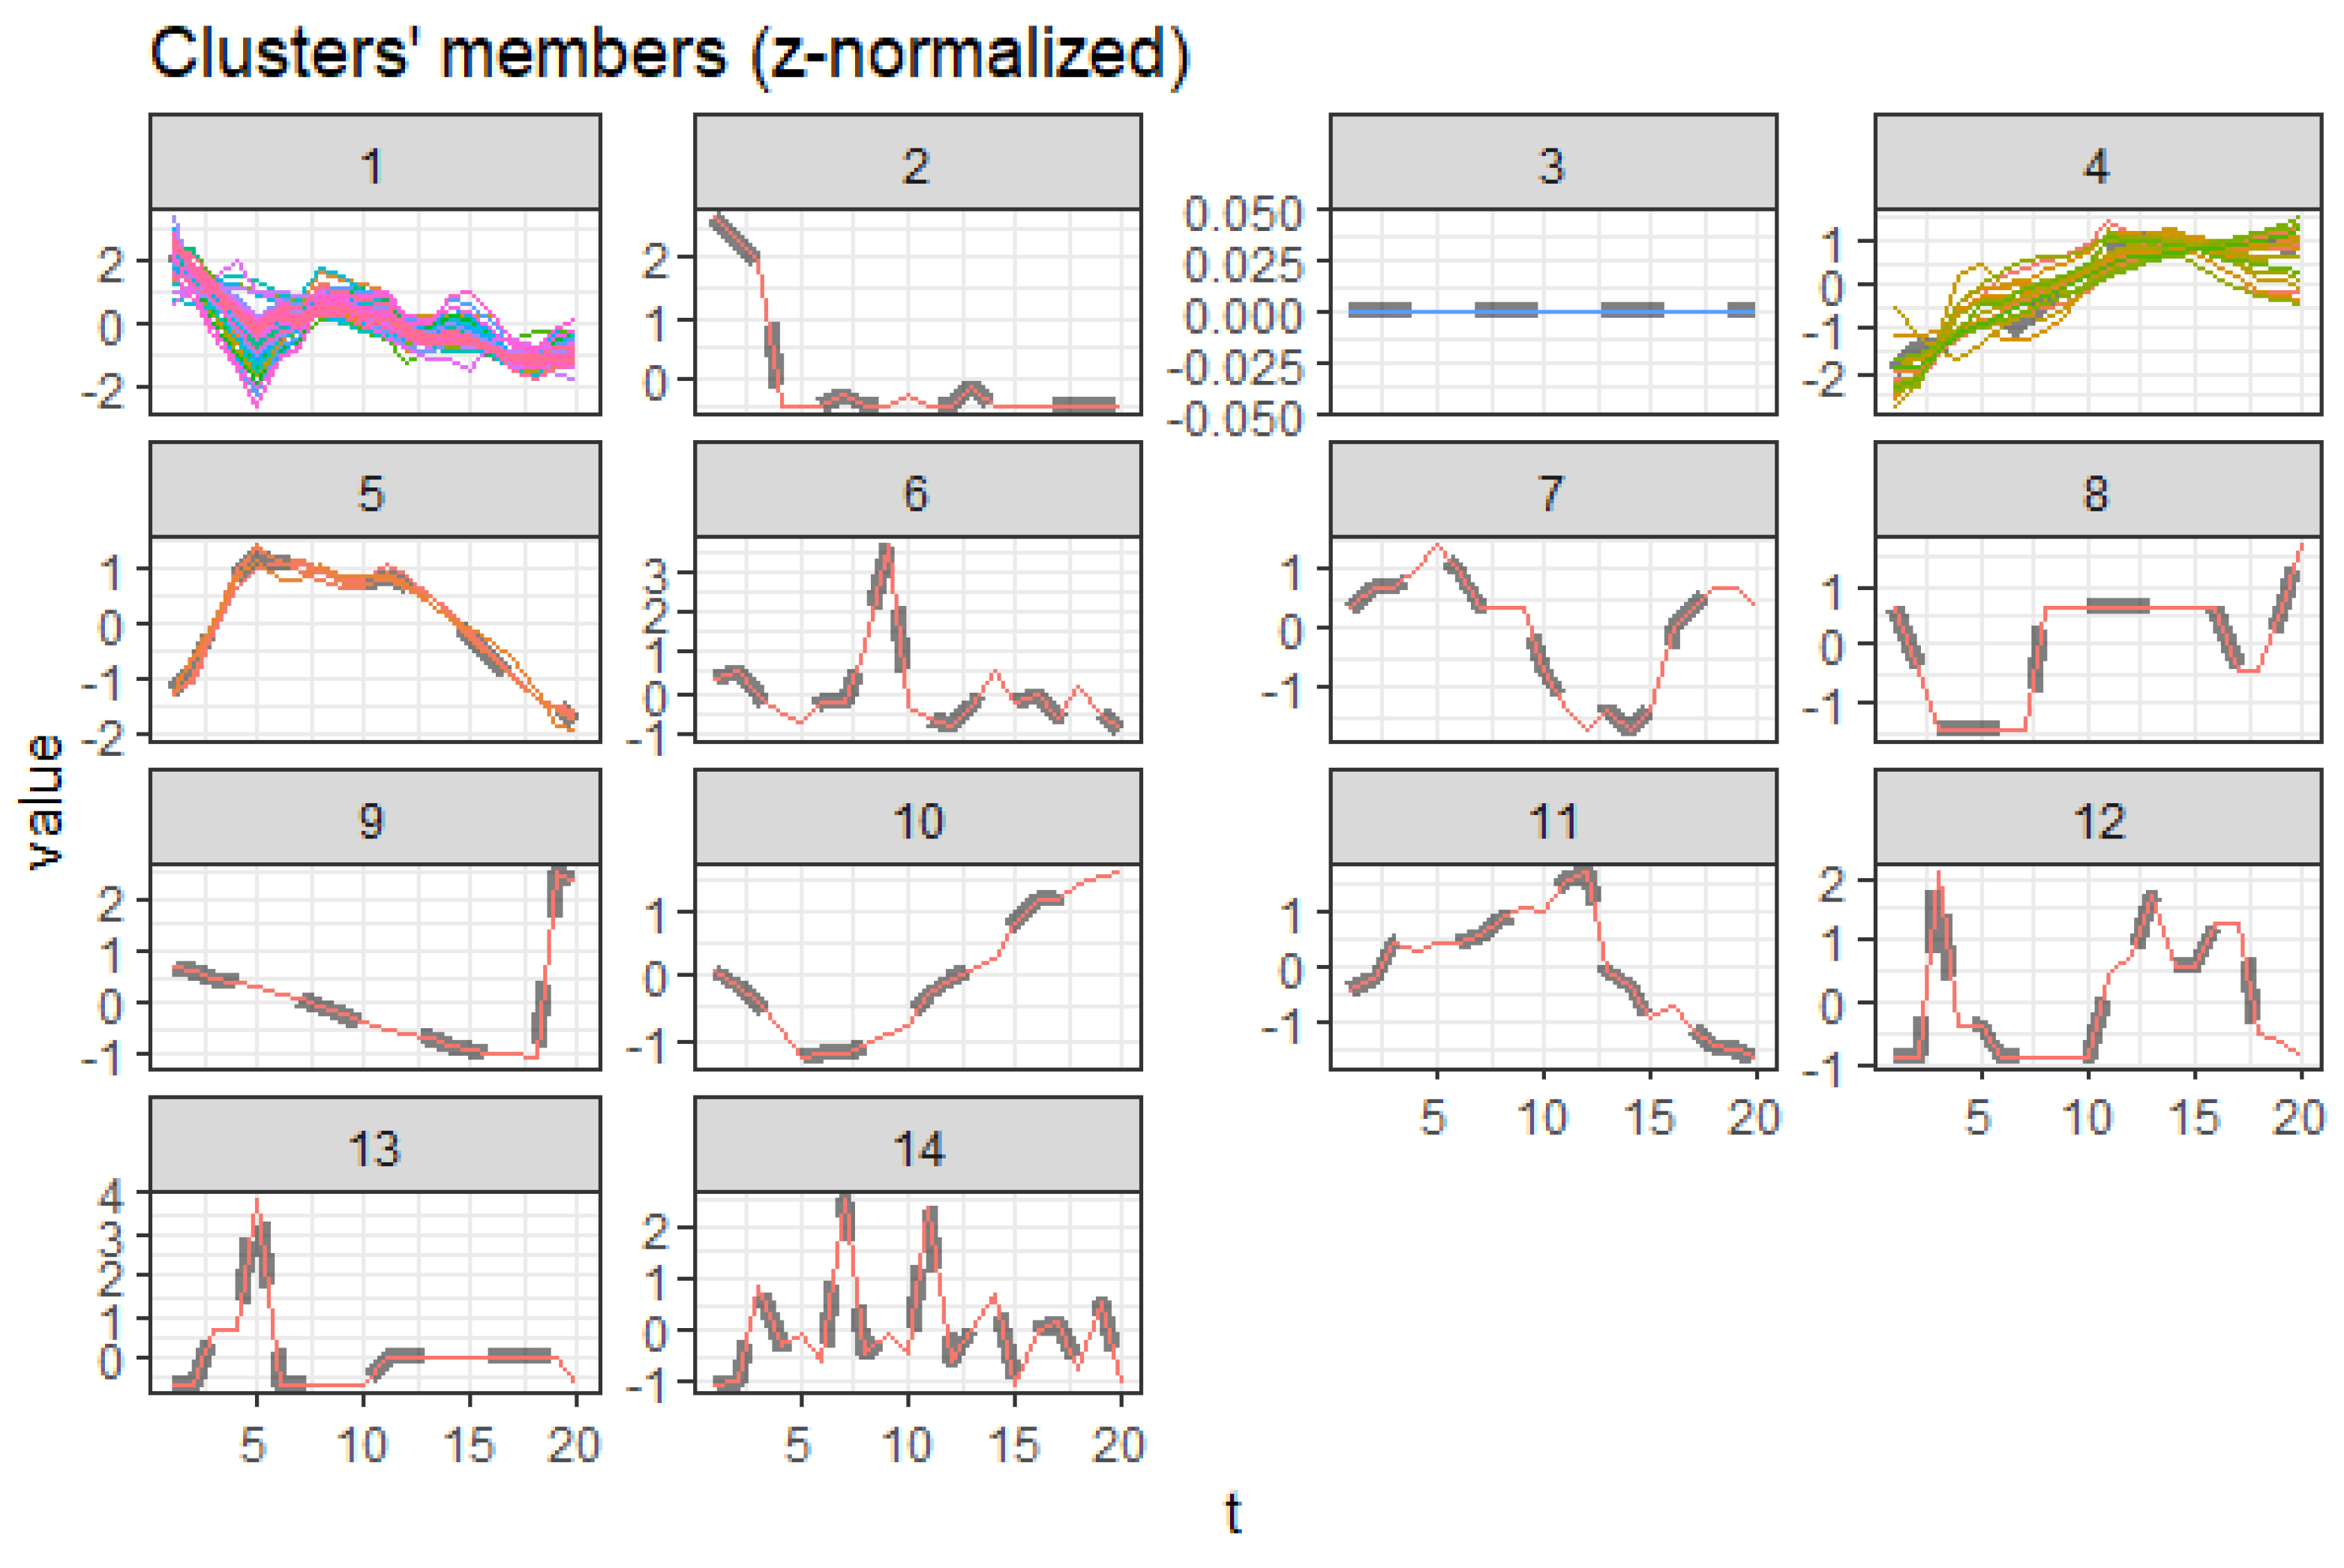
3.5. Centroid Cluster Extraction Results
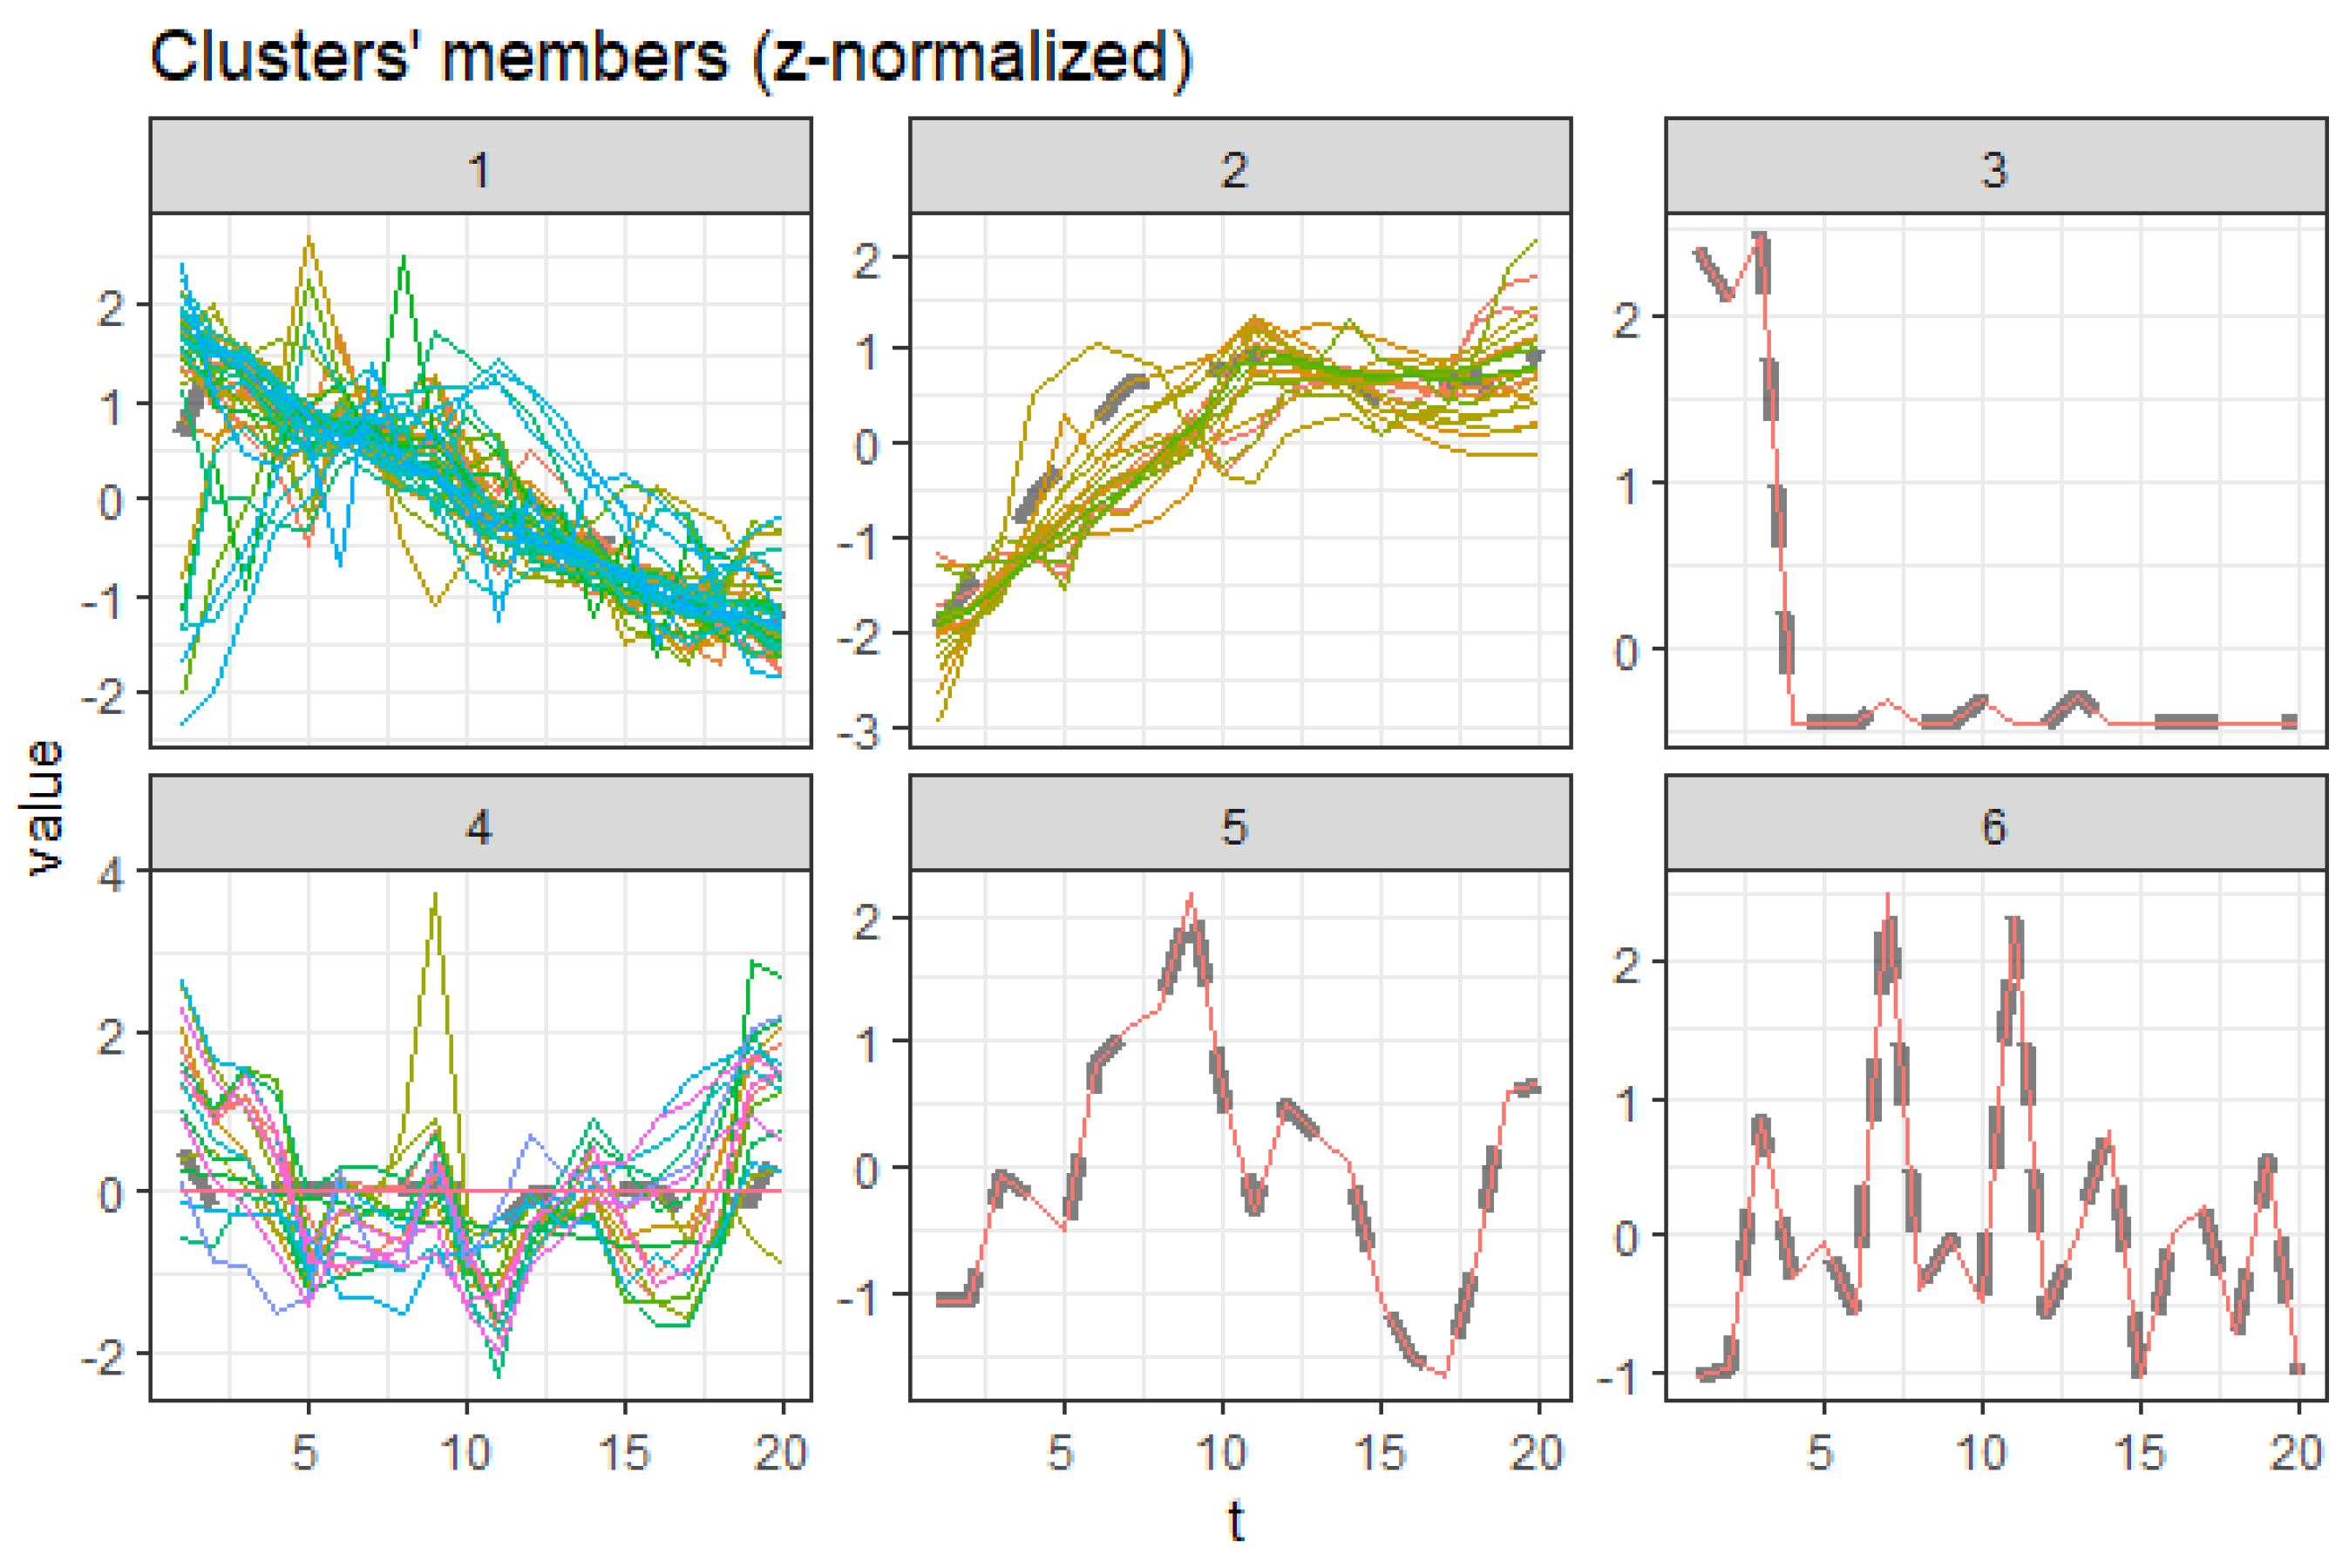
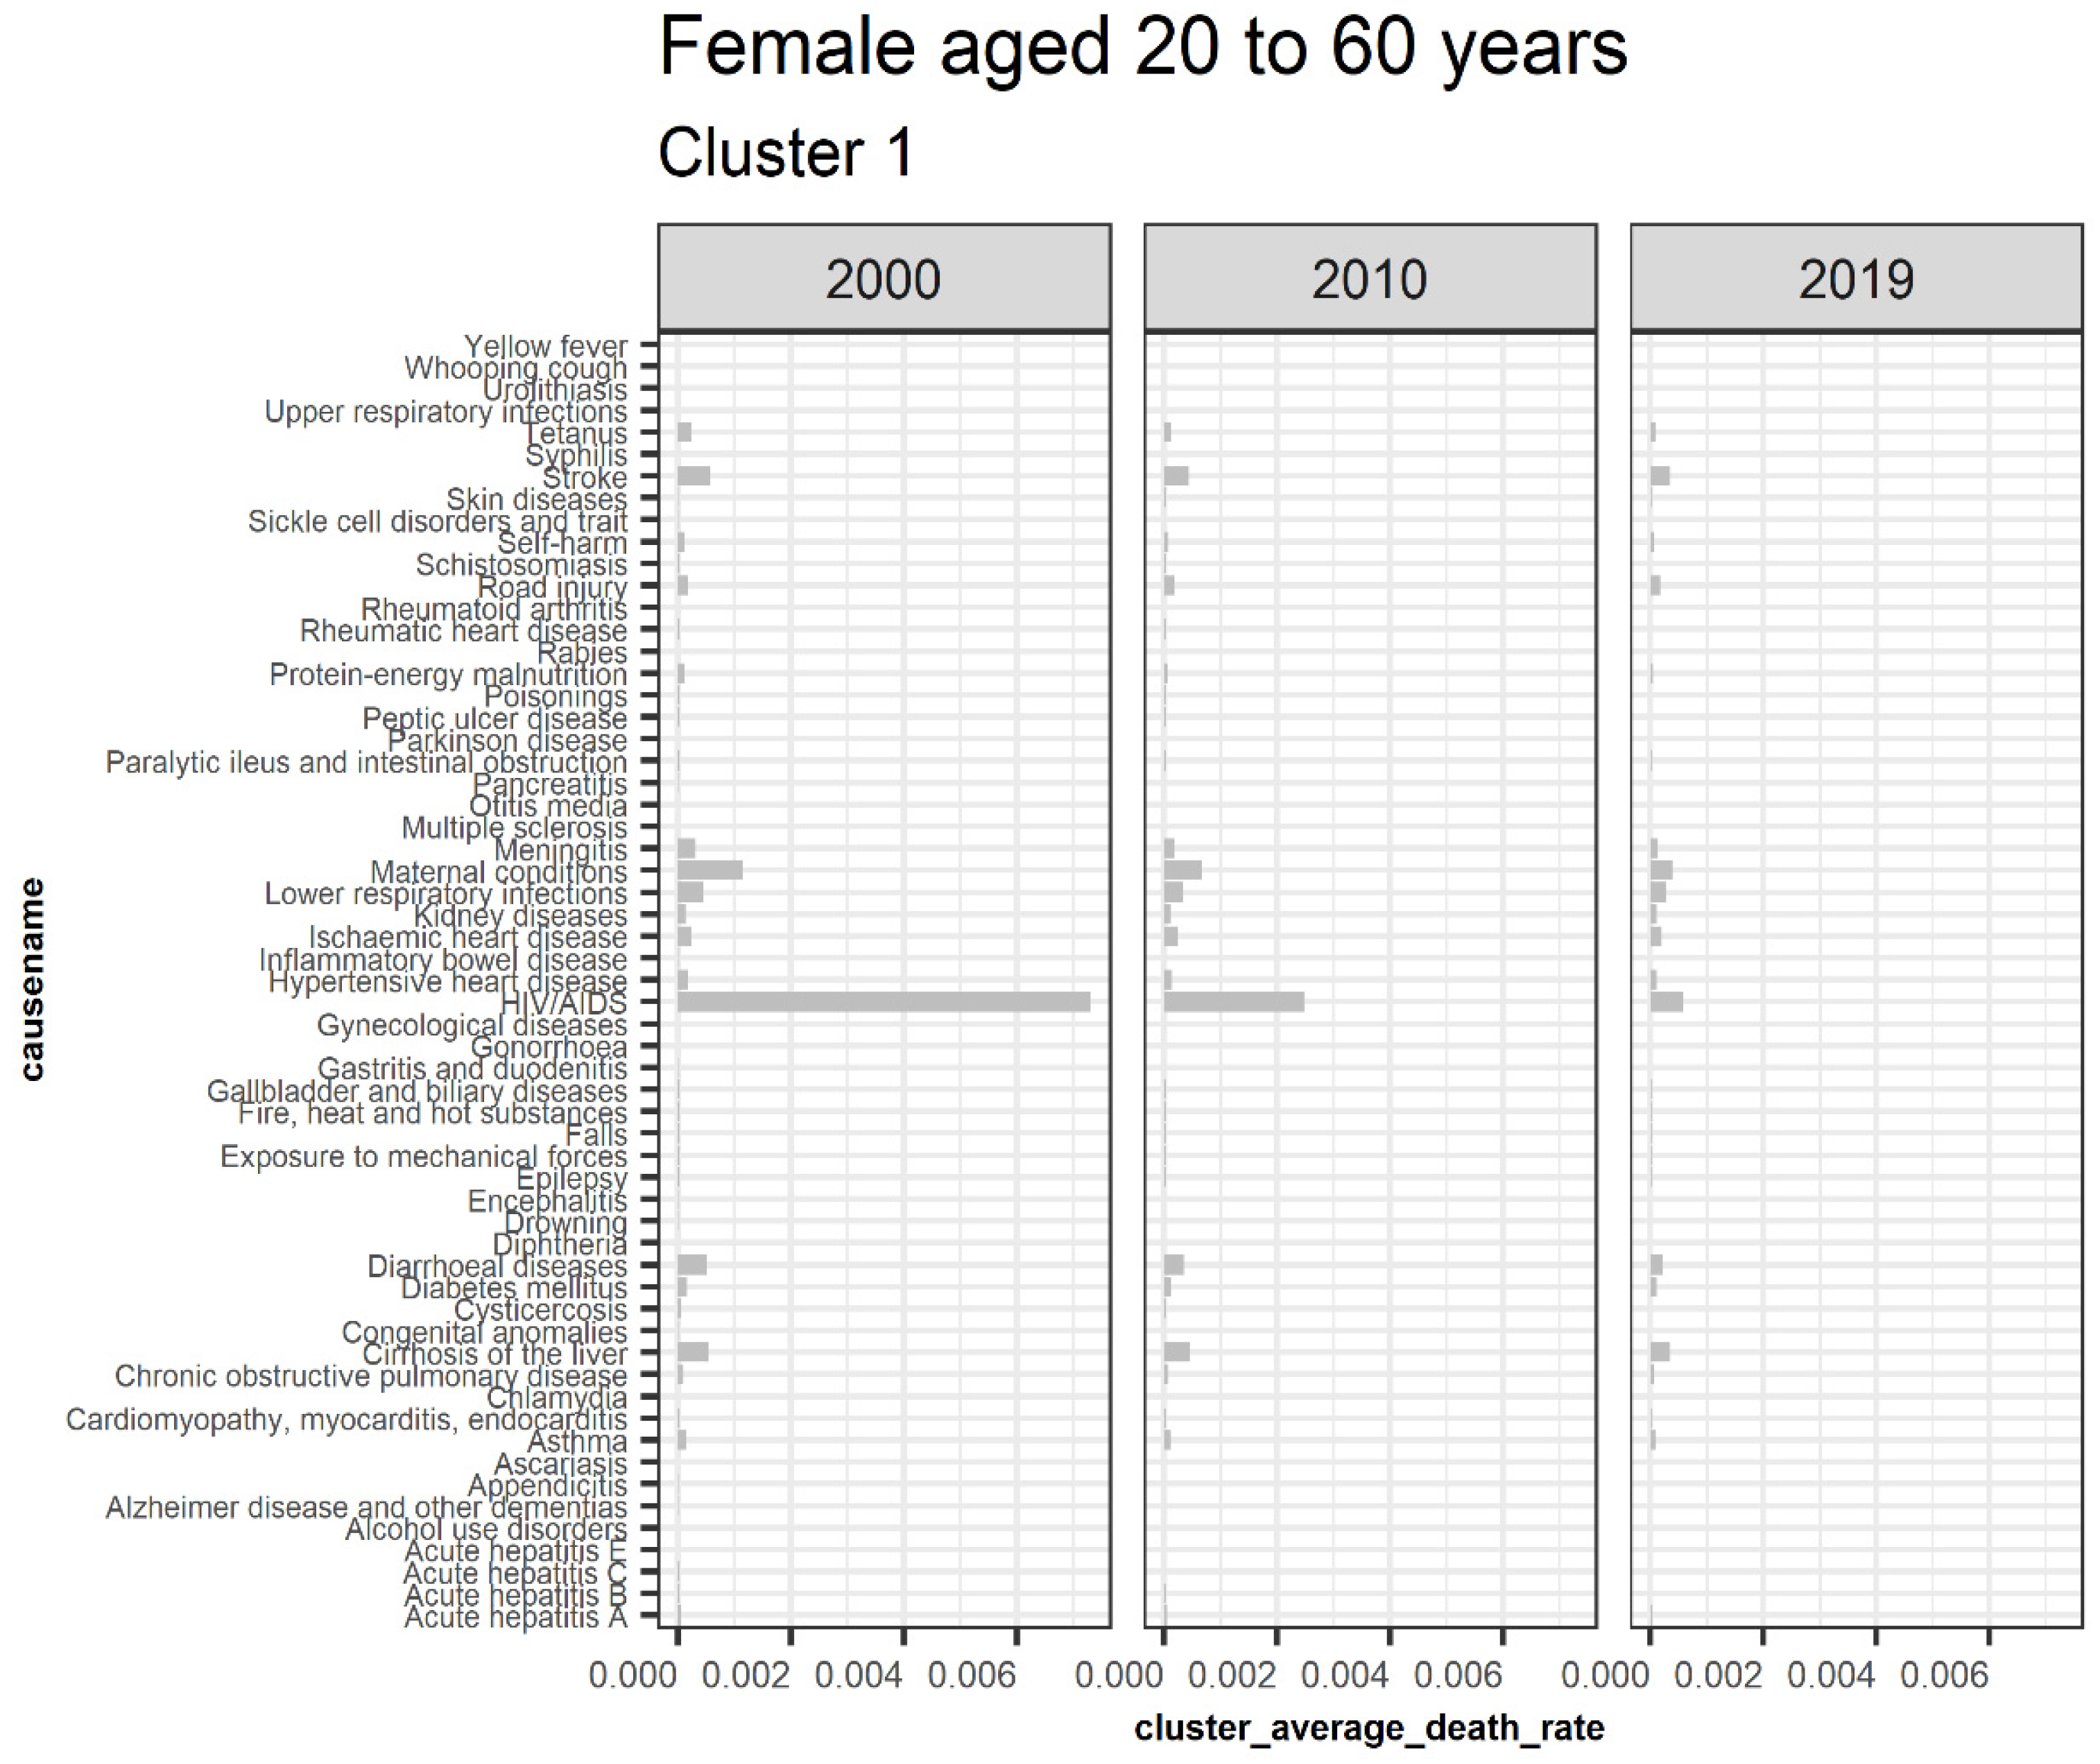
3.5.1. Females Aged 20 to 60
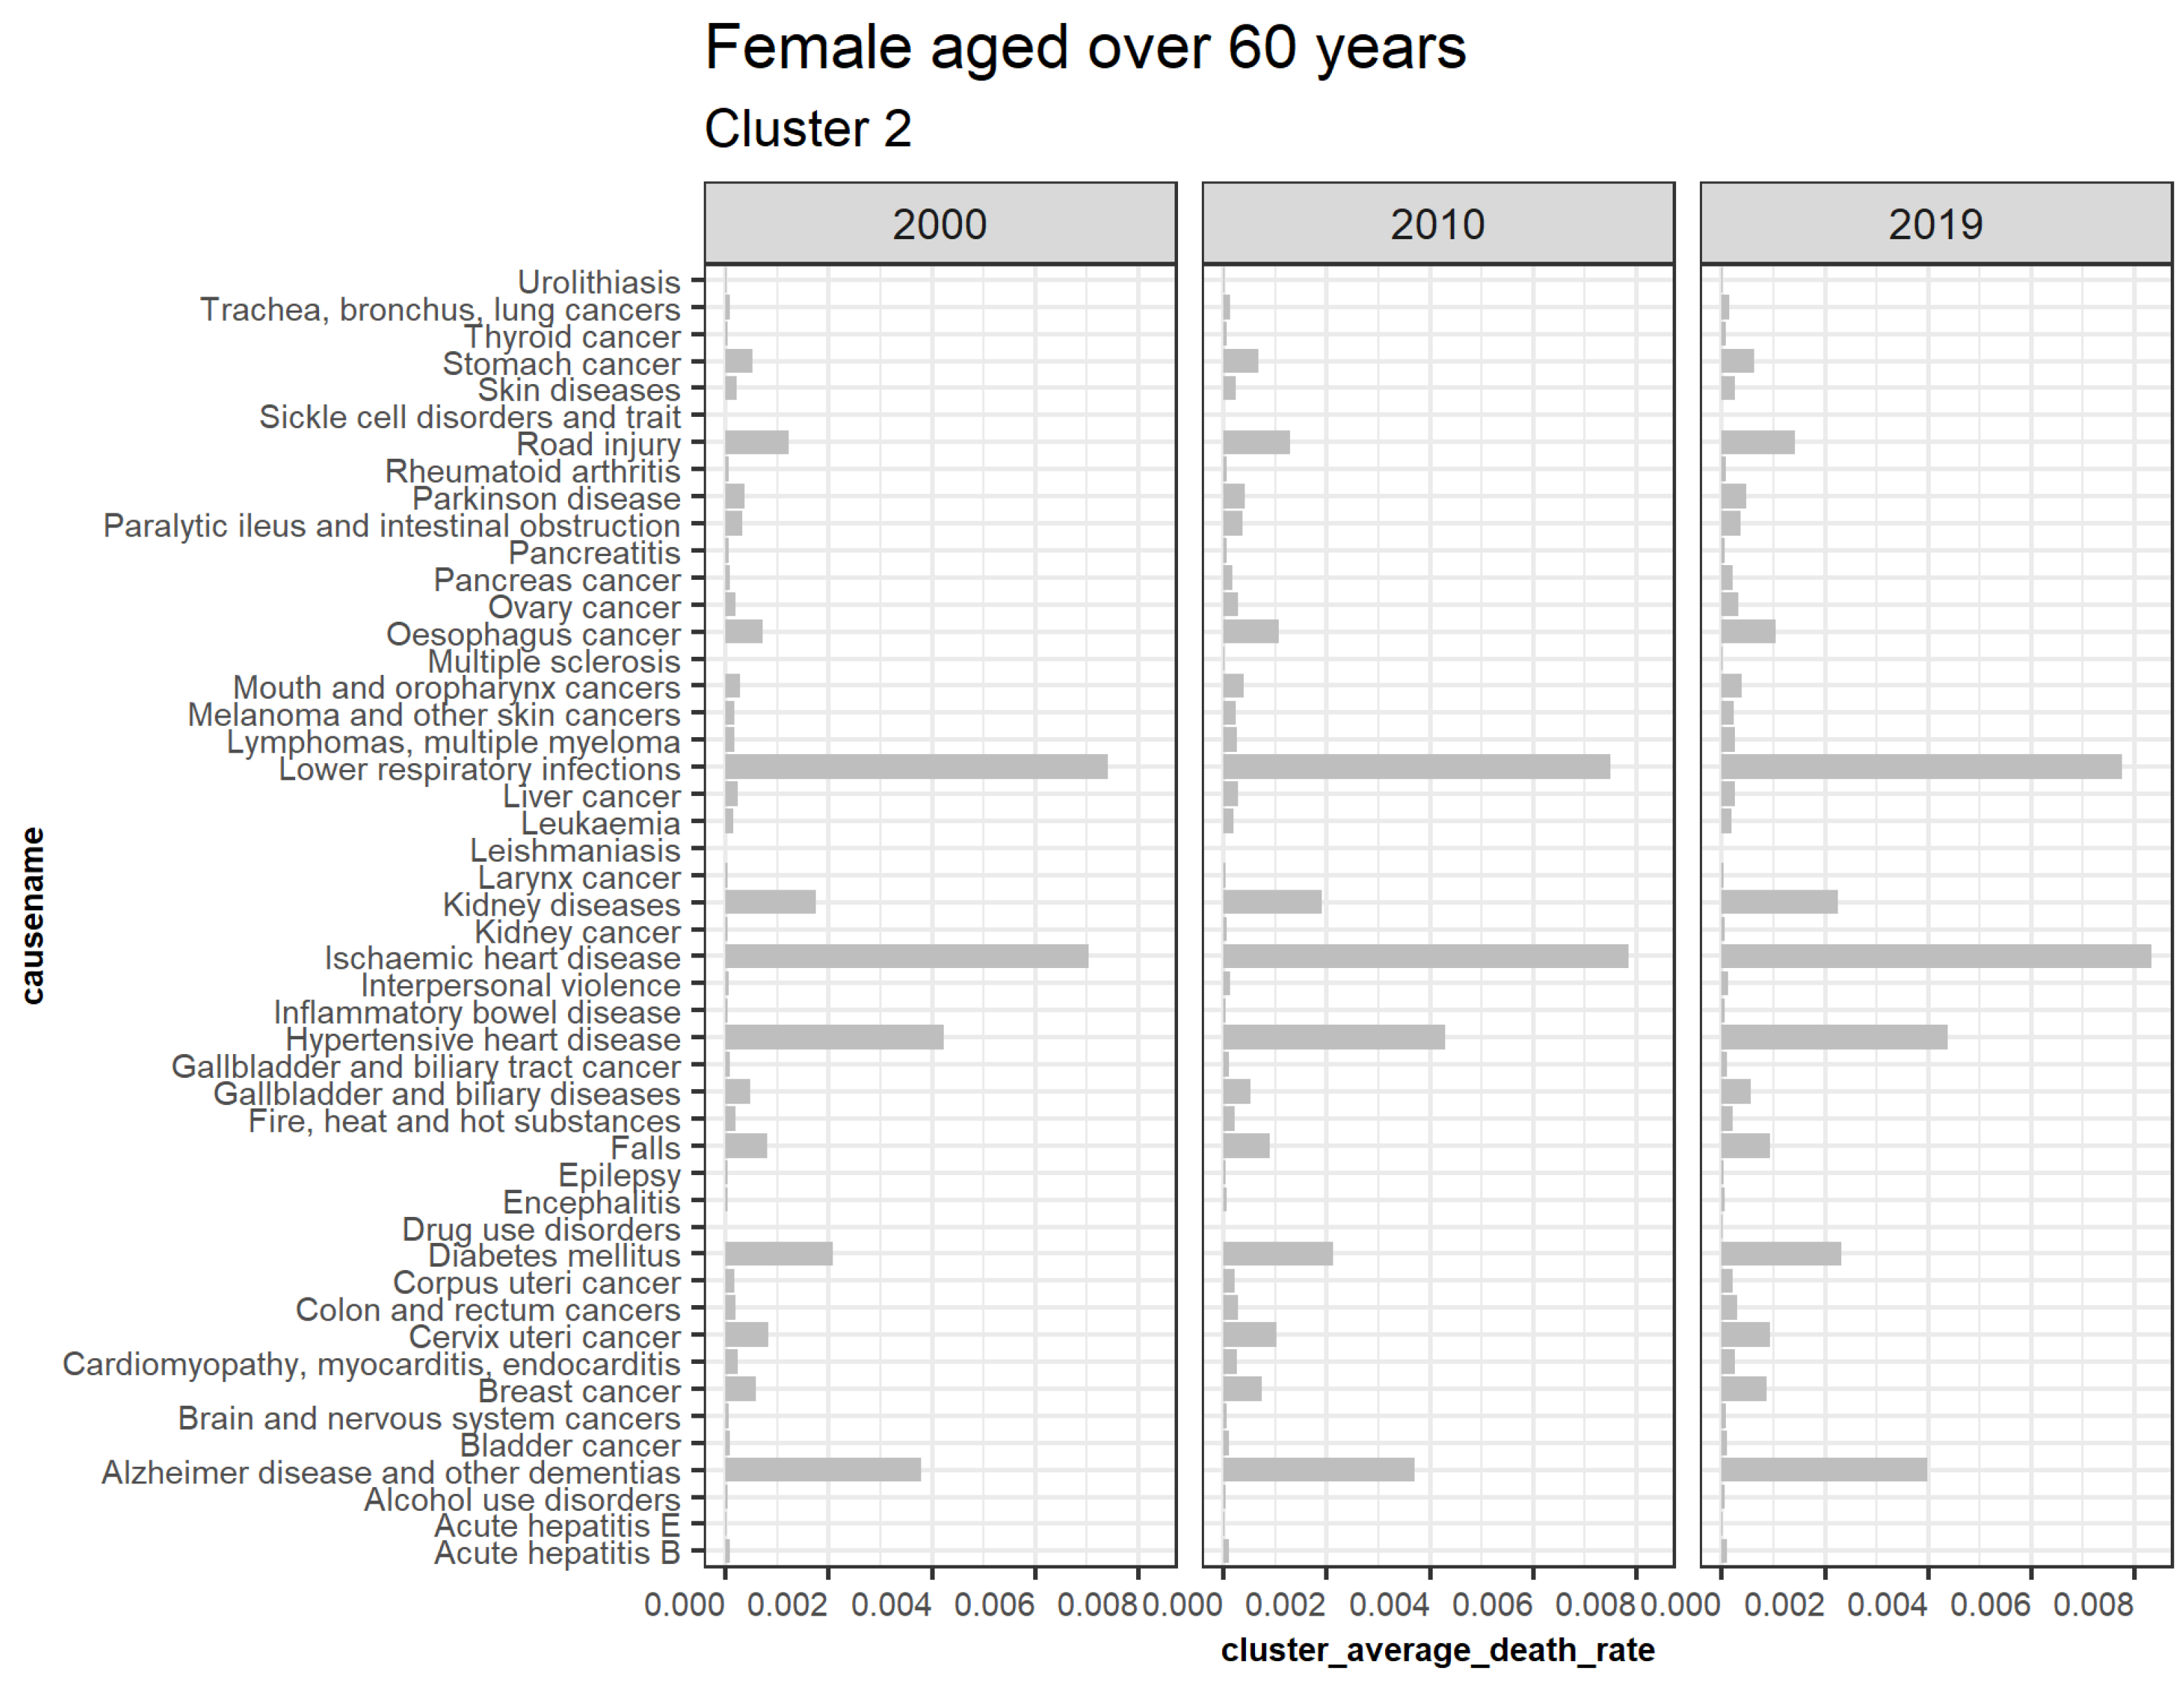
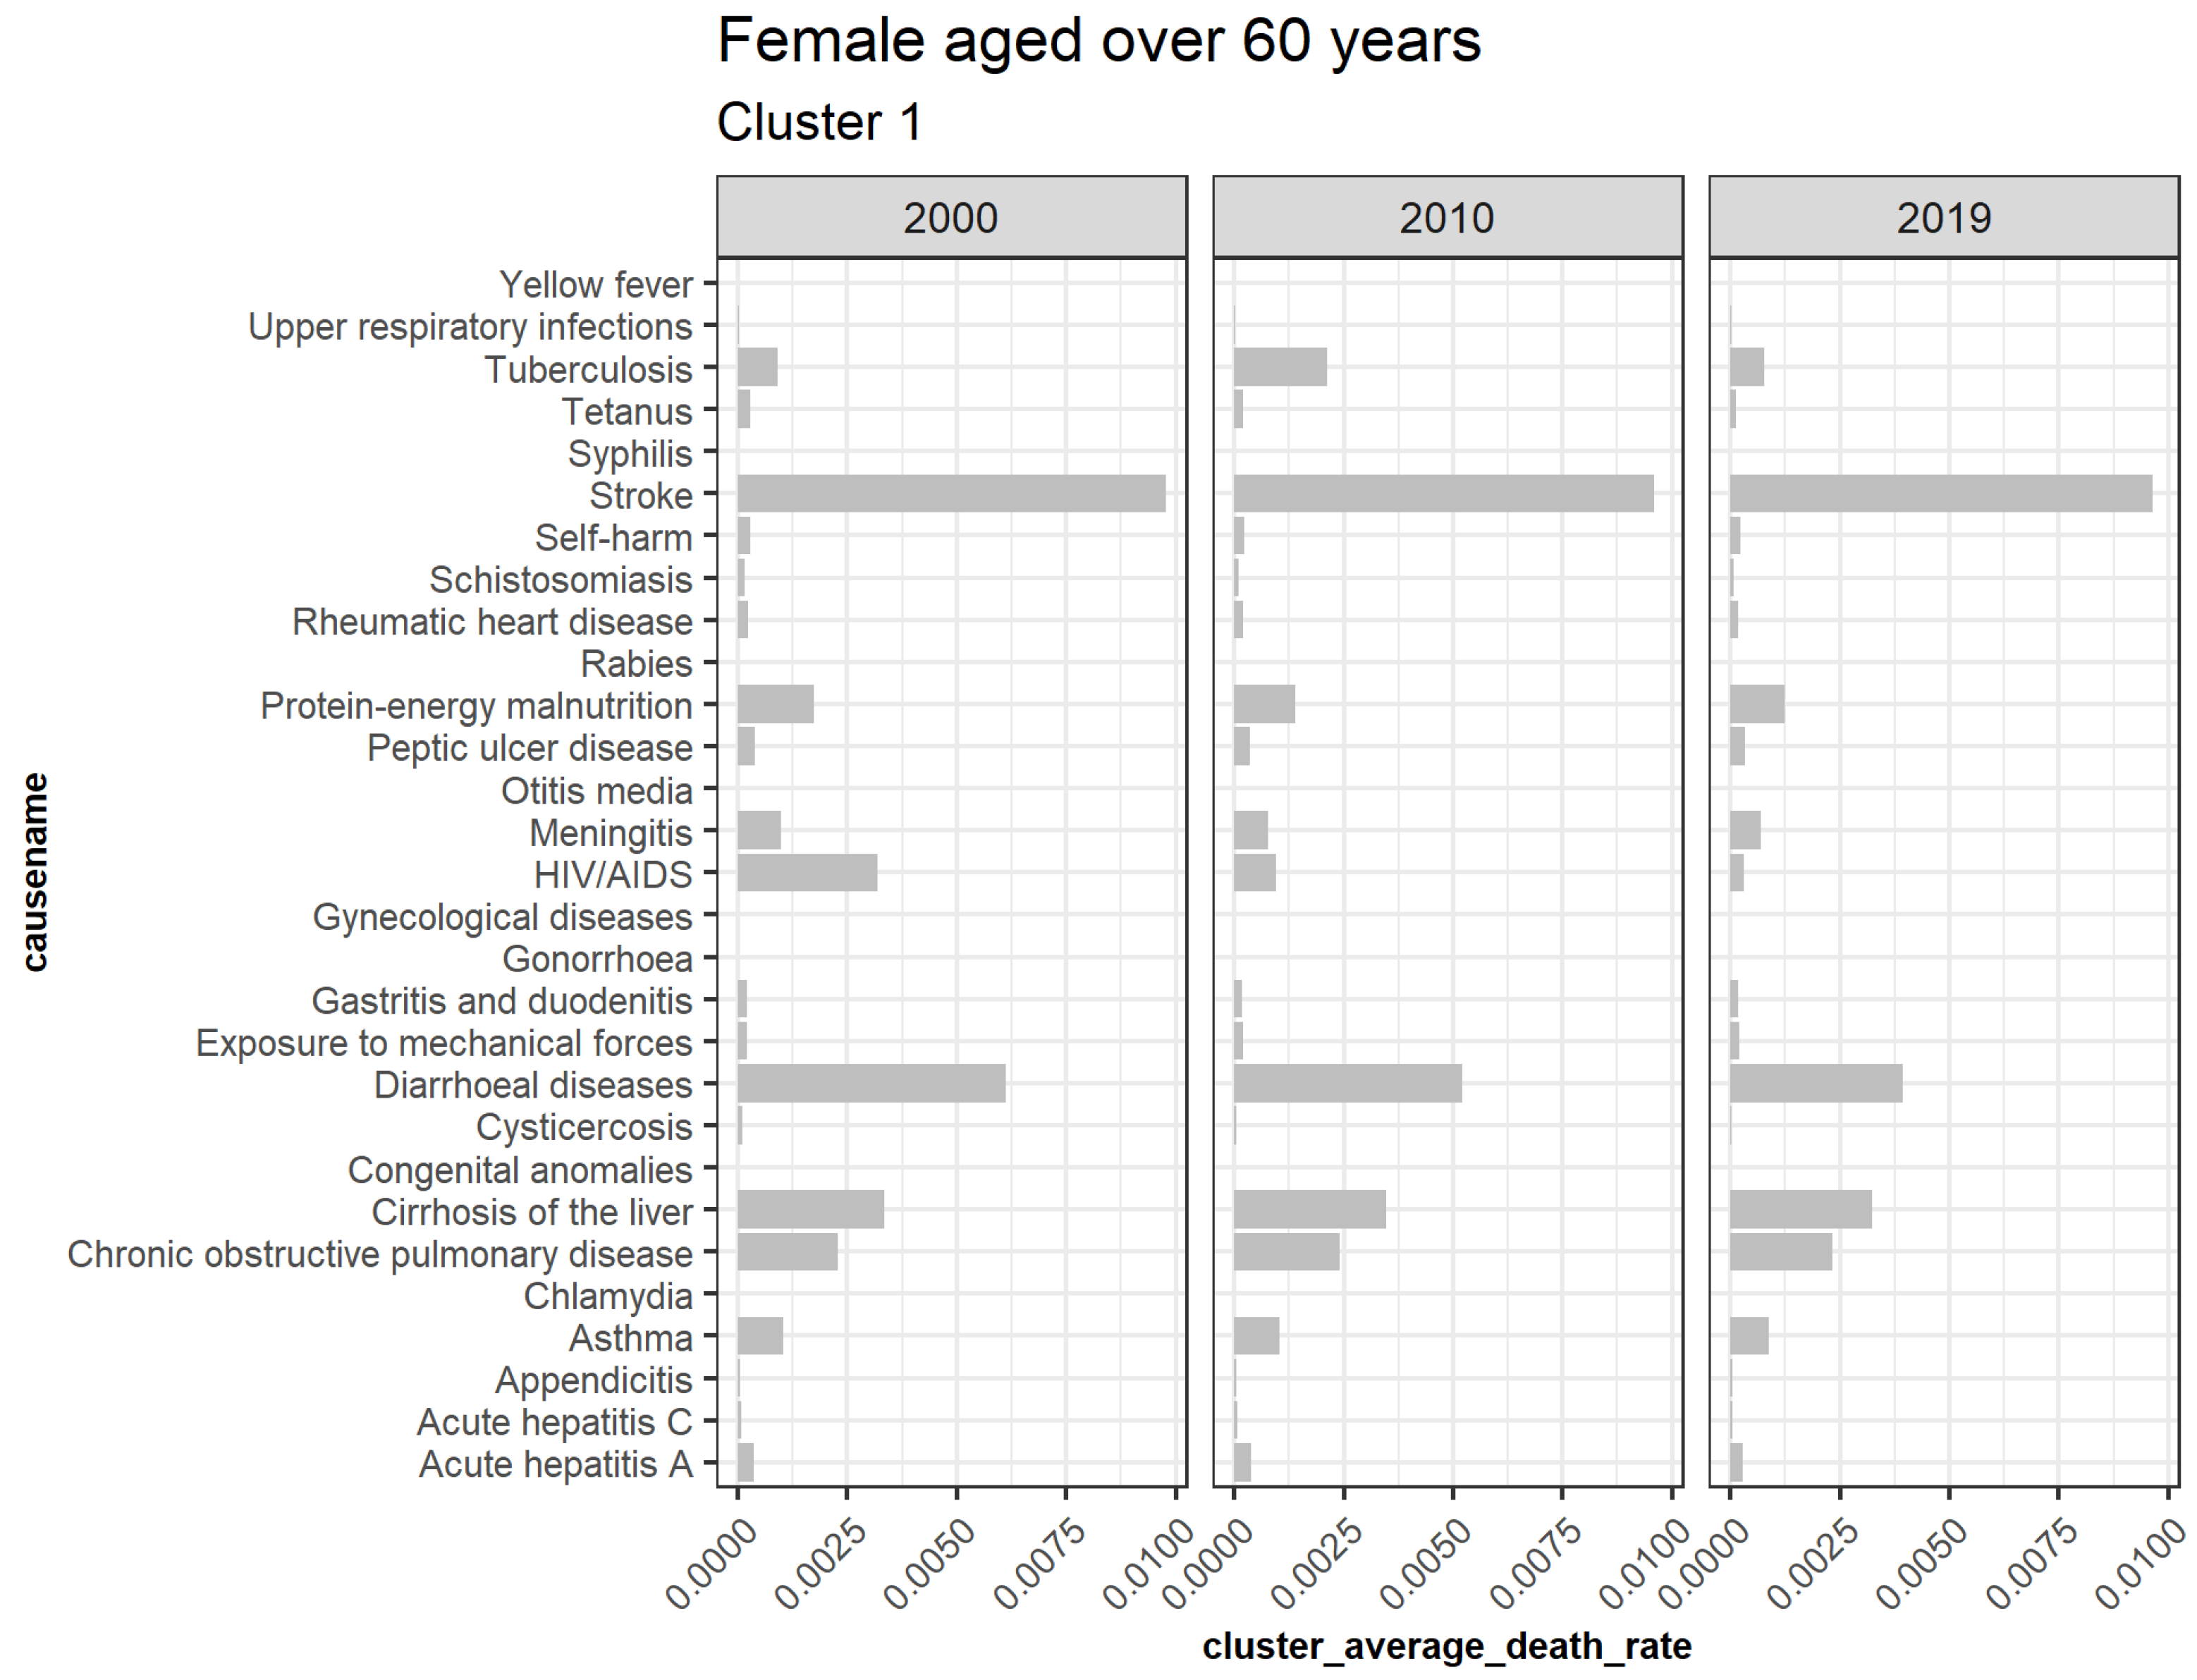
3.5.2. Females Aged over 60
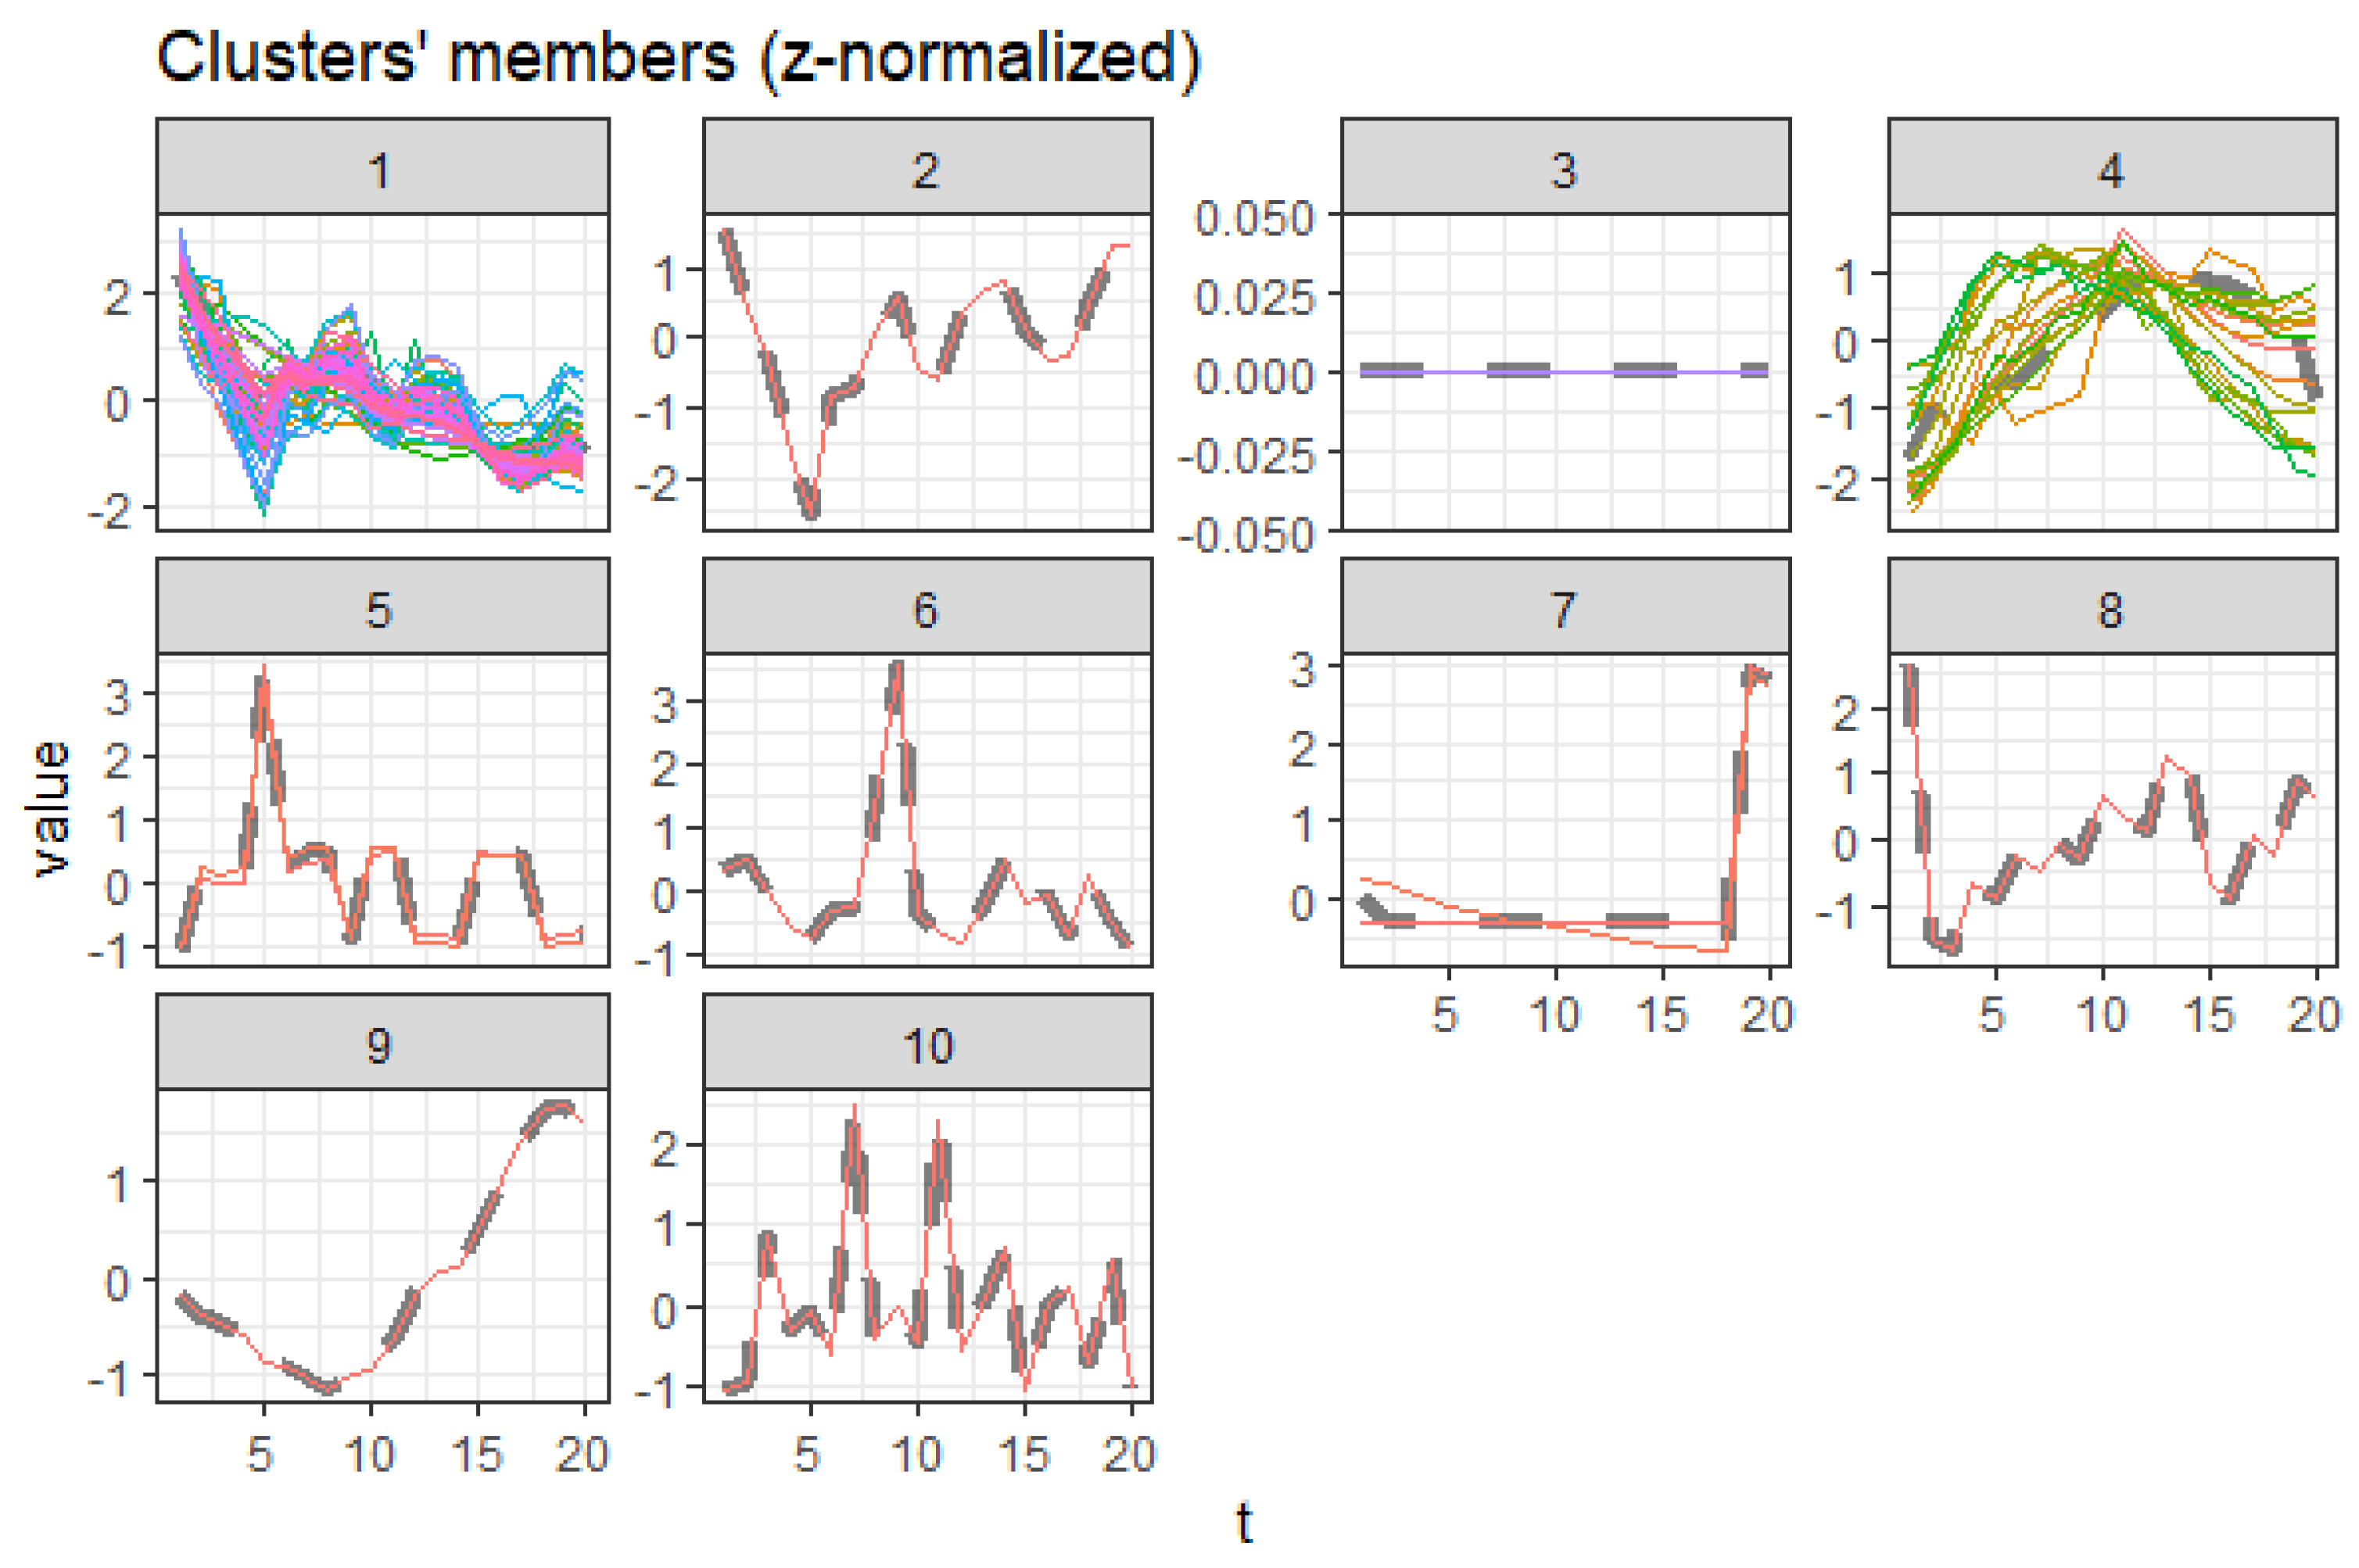
3.5.3. Males Aged 20 to 60
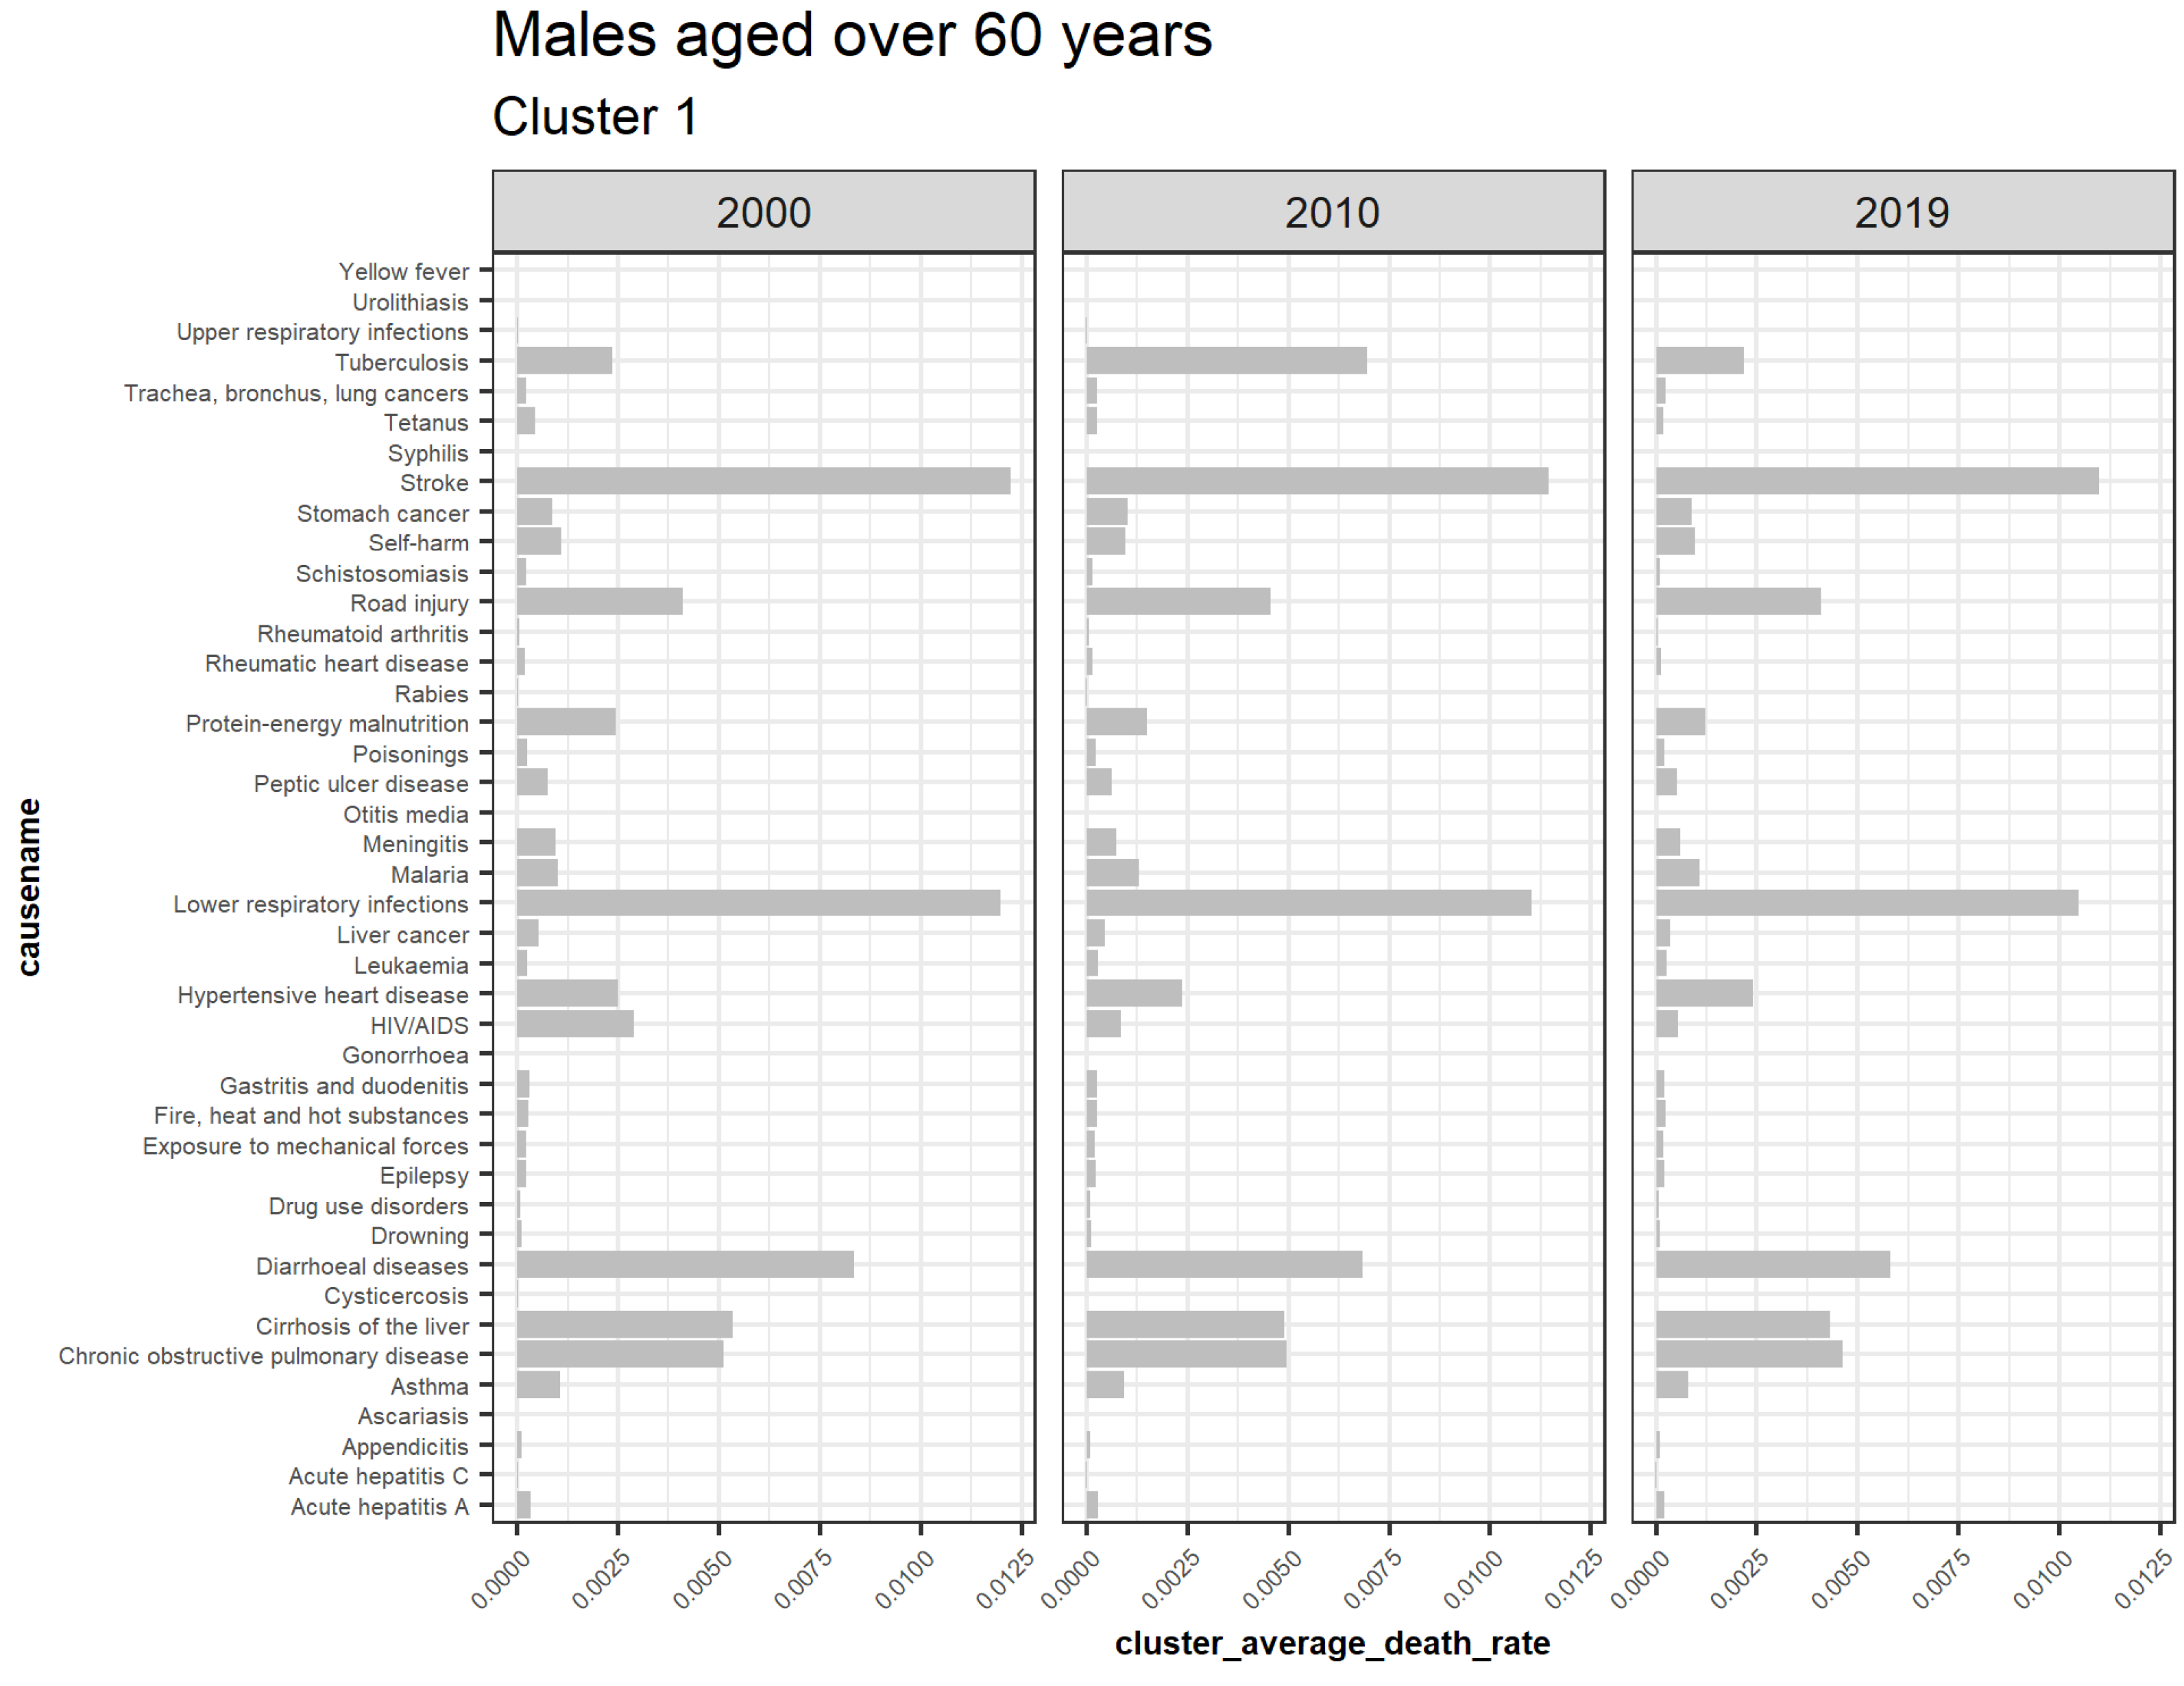
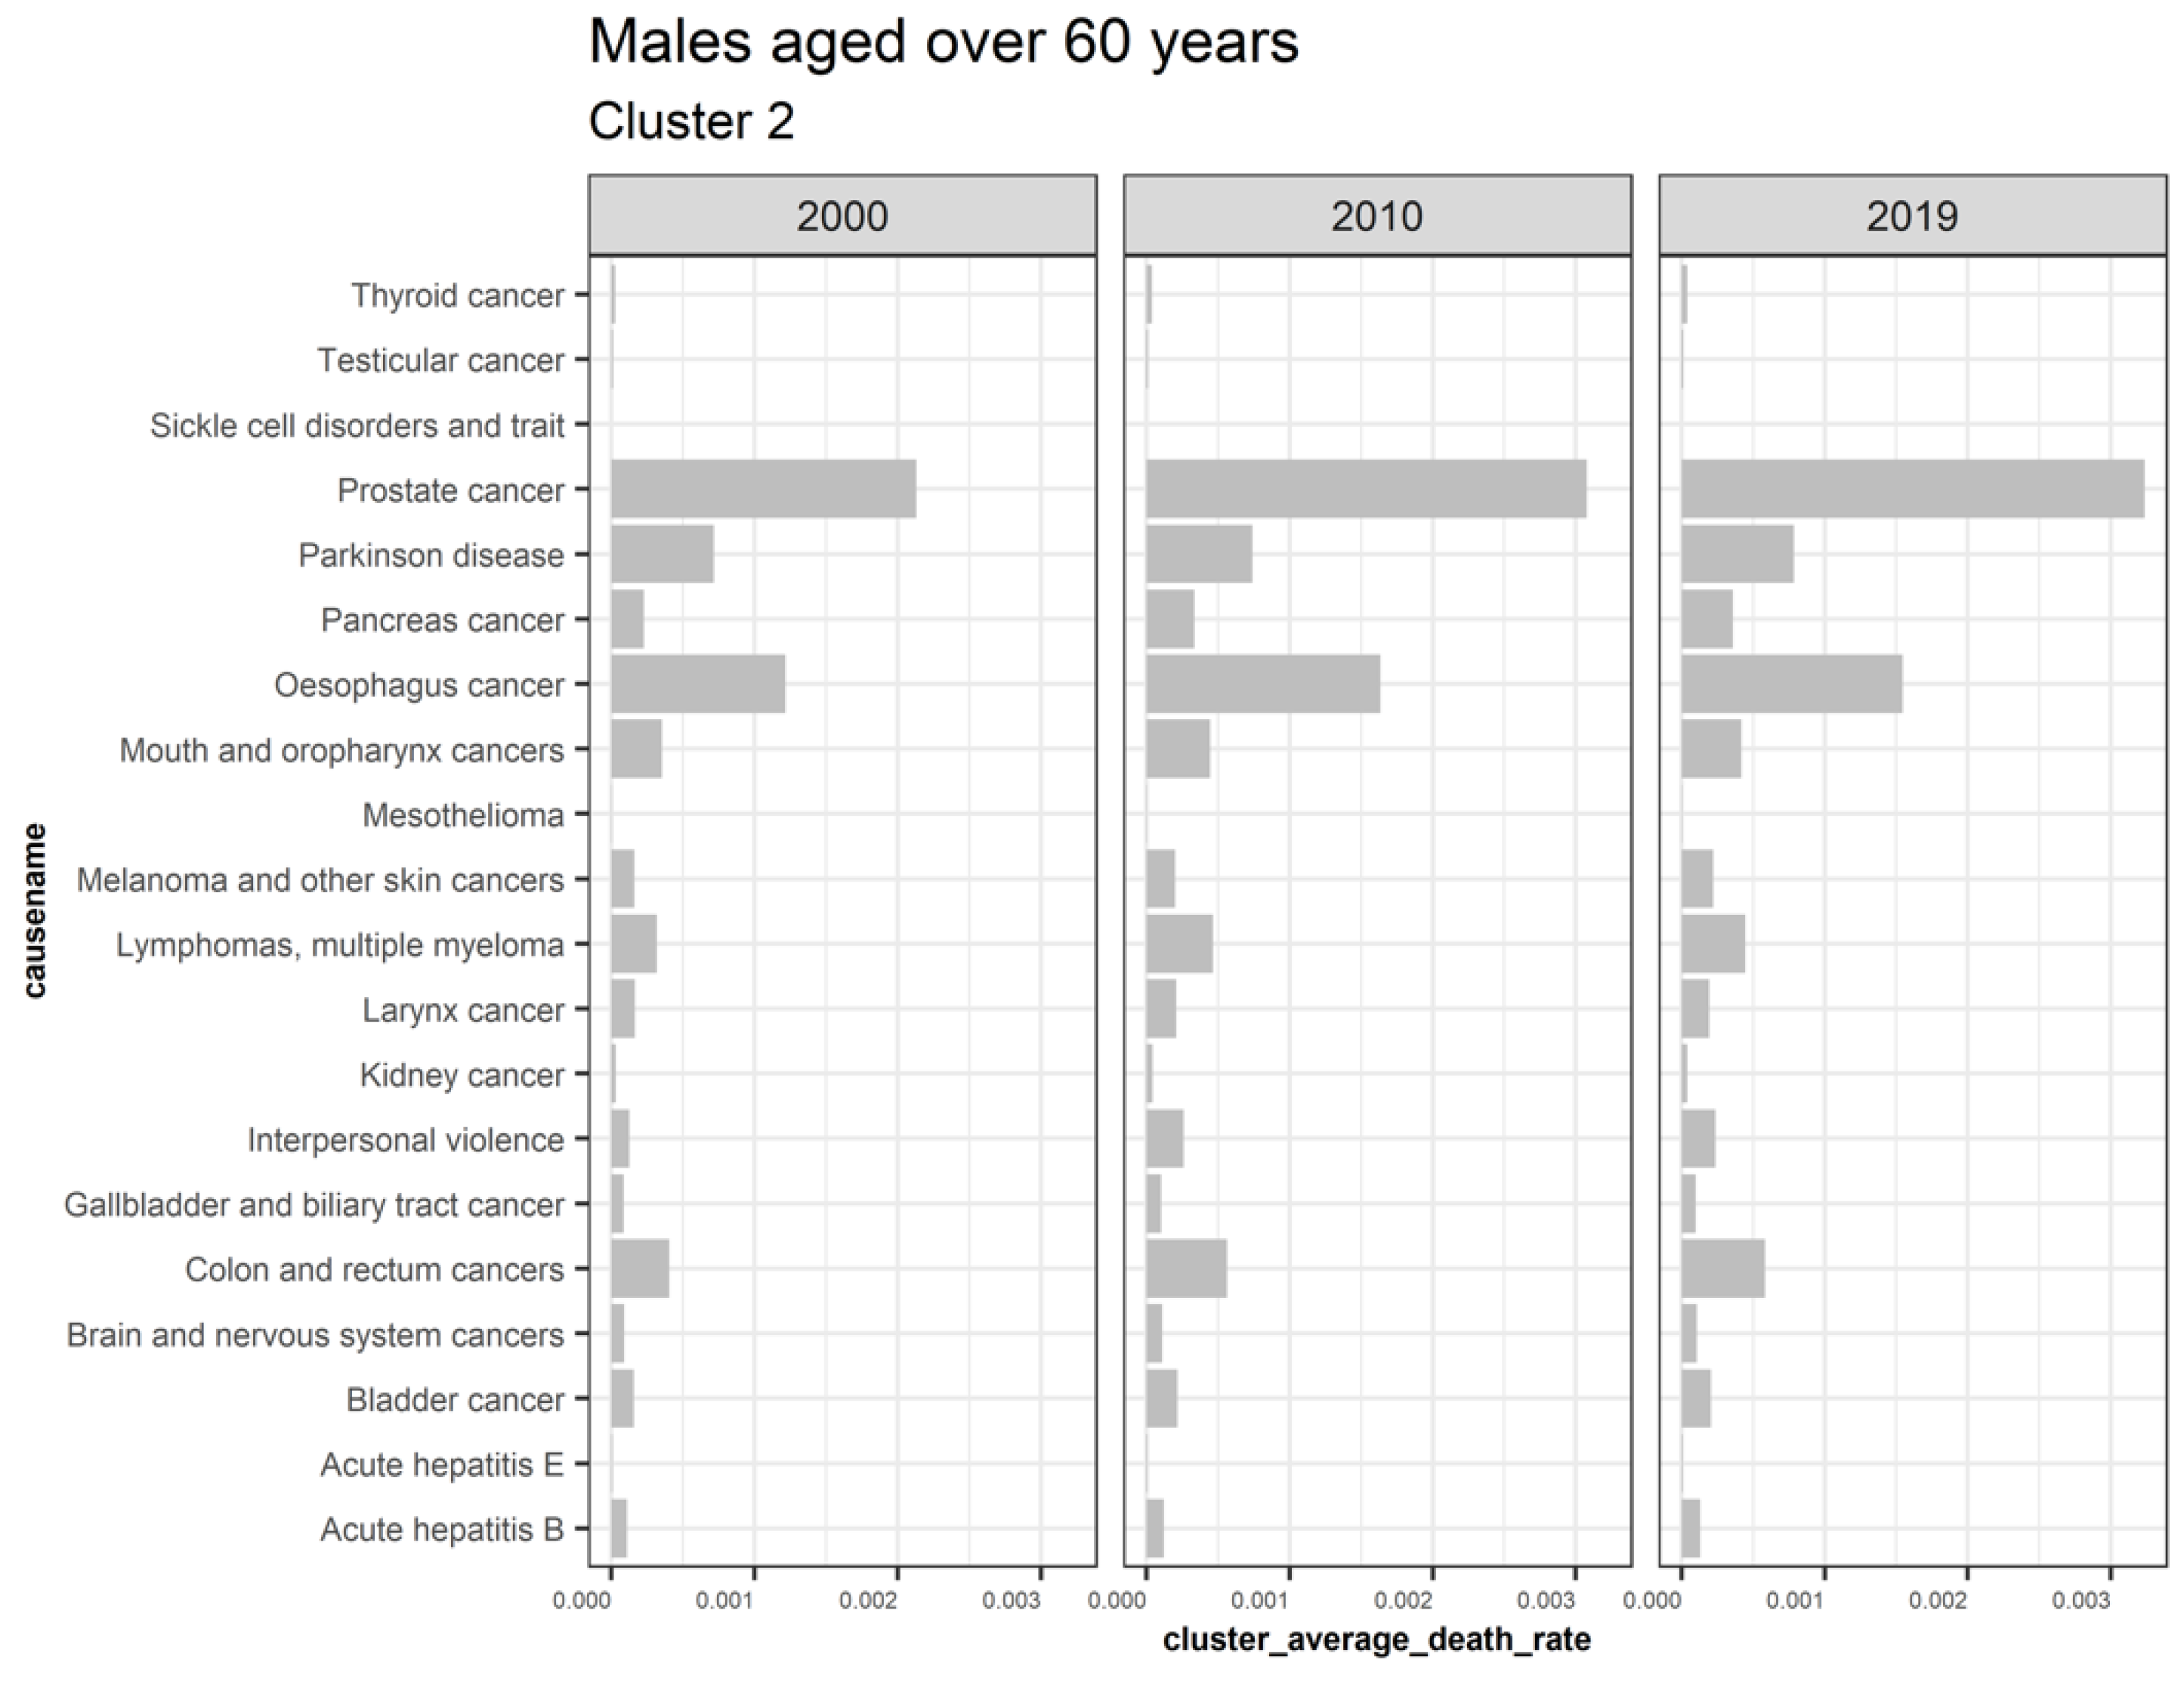
3.5.4. Males Aged over 60
3.6. Cause of Death Classification Based on the Proposed Clustering Approach
3.6.1. Trending Upwards
3.6.2. Trending Downwards
3.6.3. Outliers
3.6.4. Insignificant
3.7. Quantifying the Detected Clusters Based on Cause–Elimination Approach
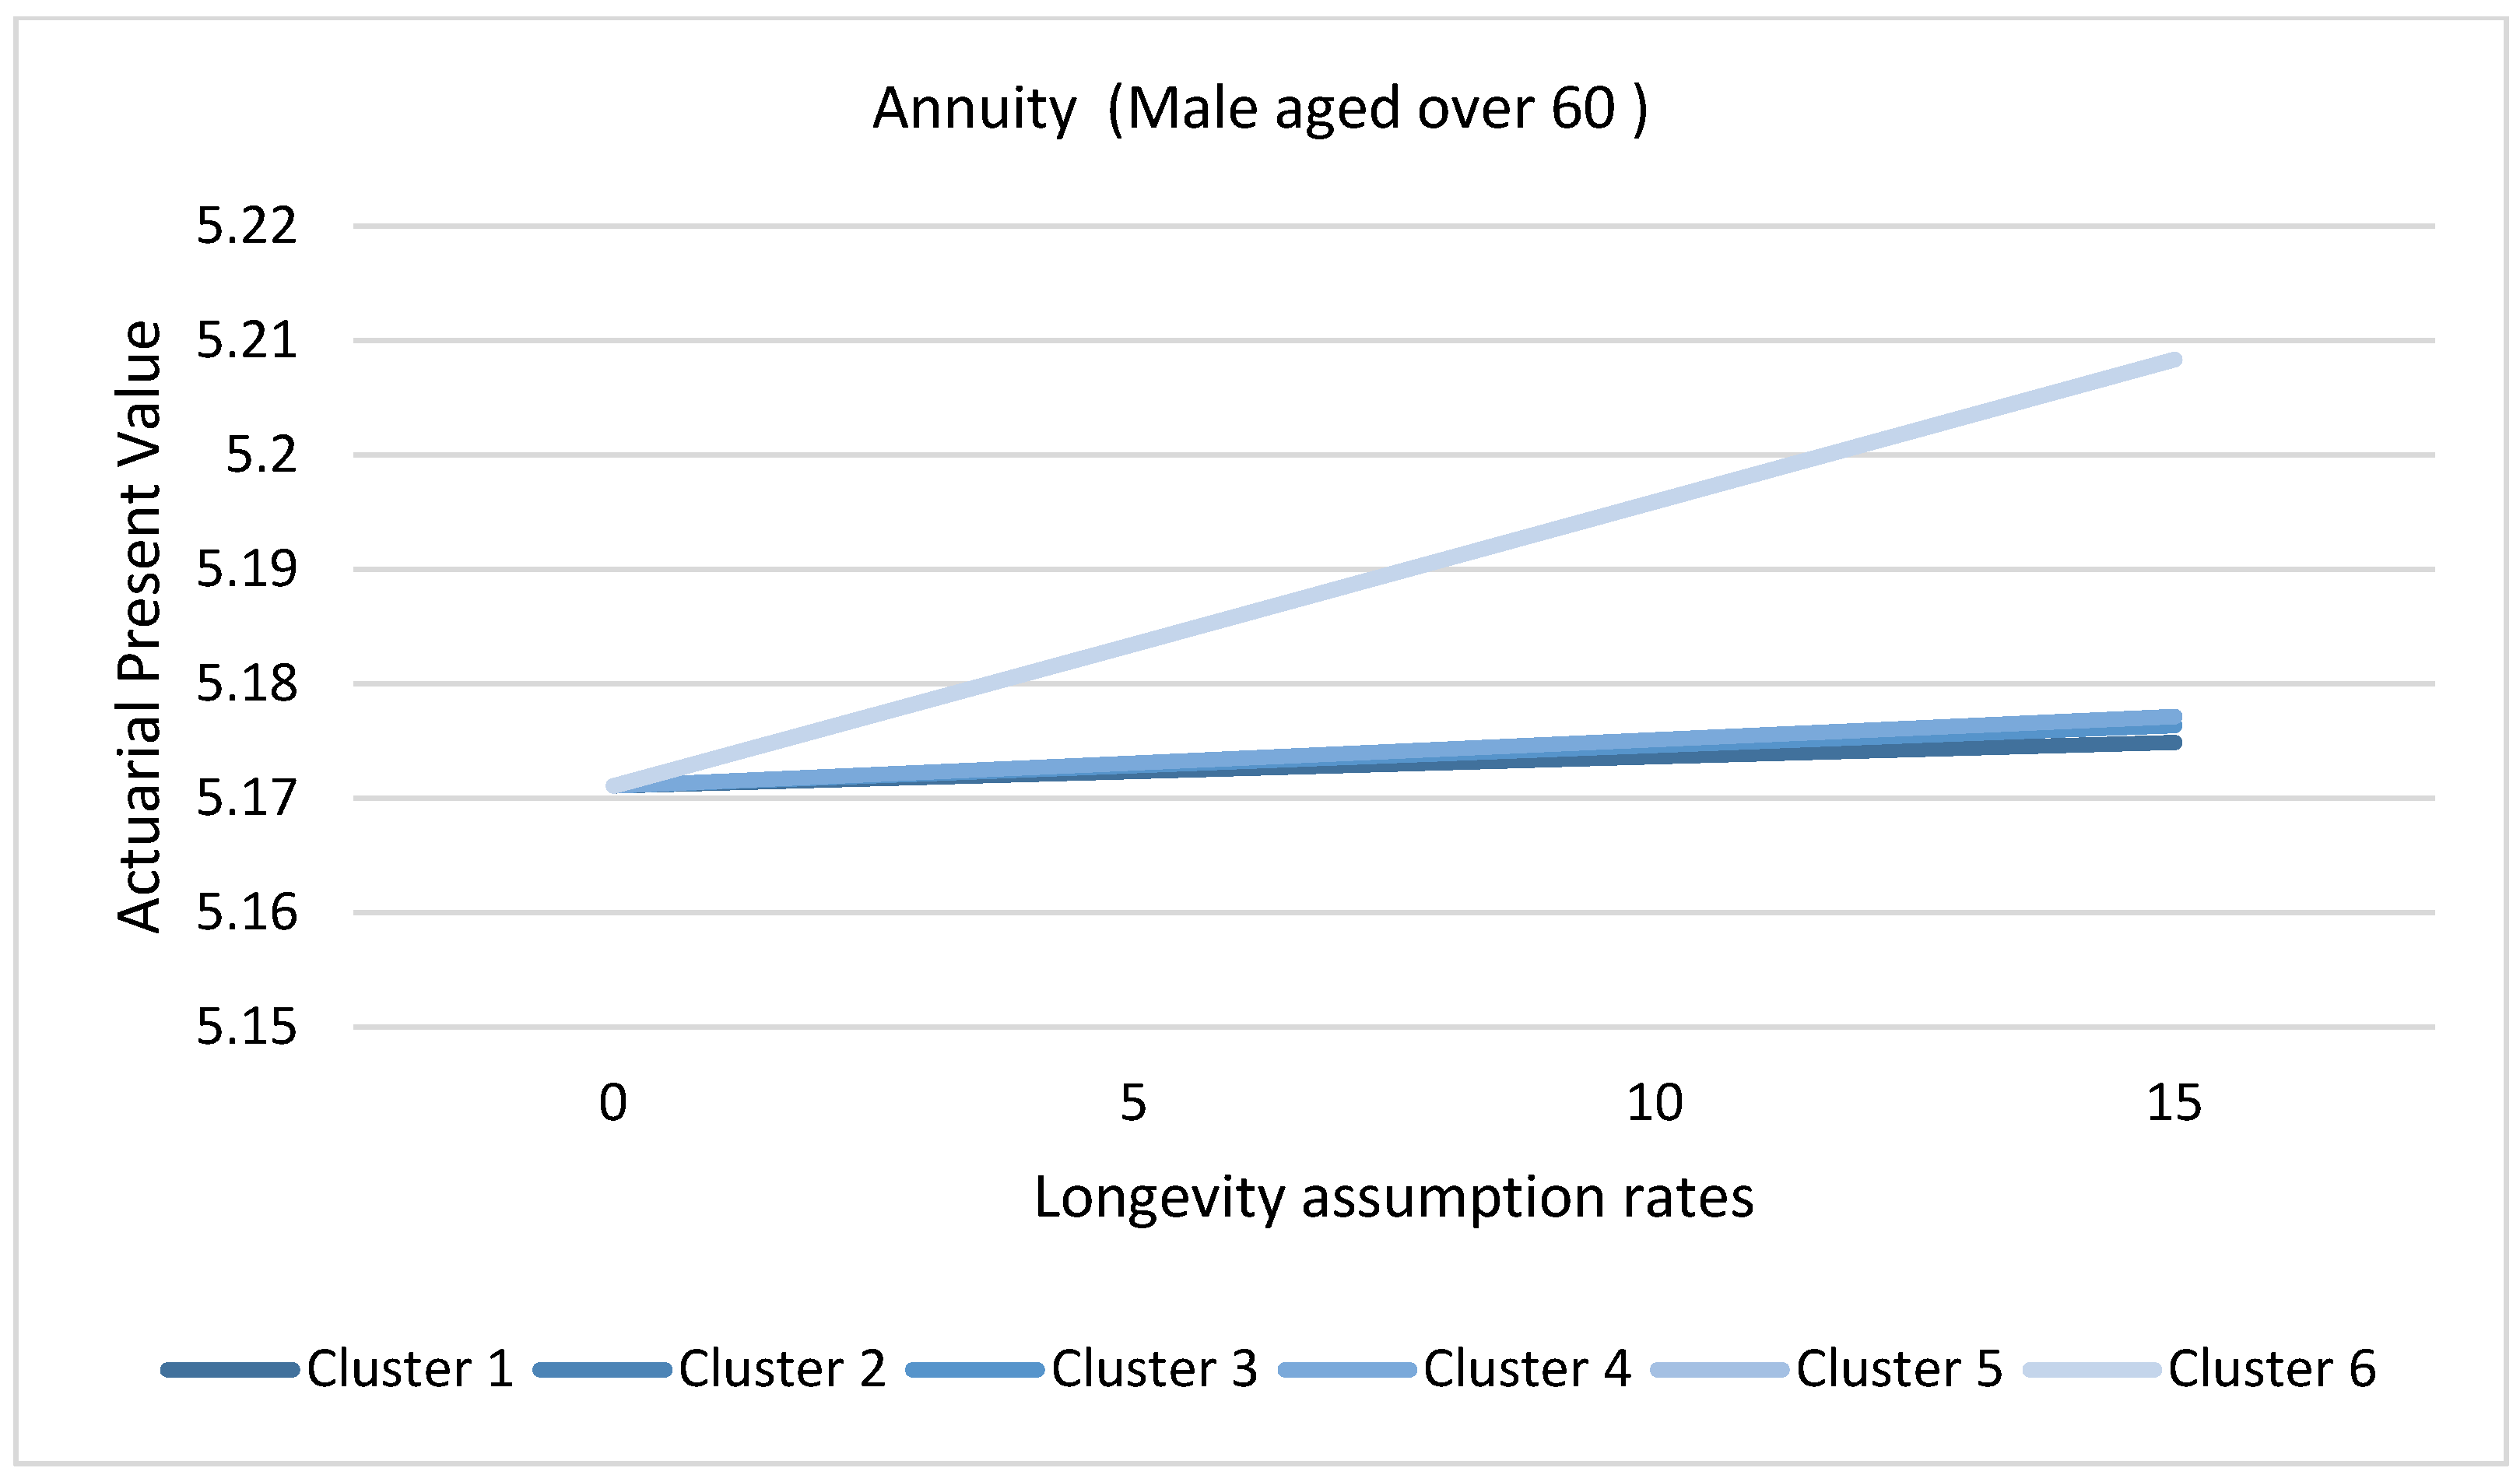
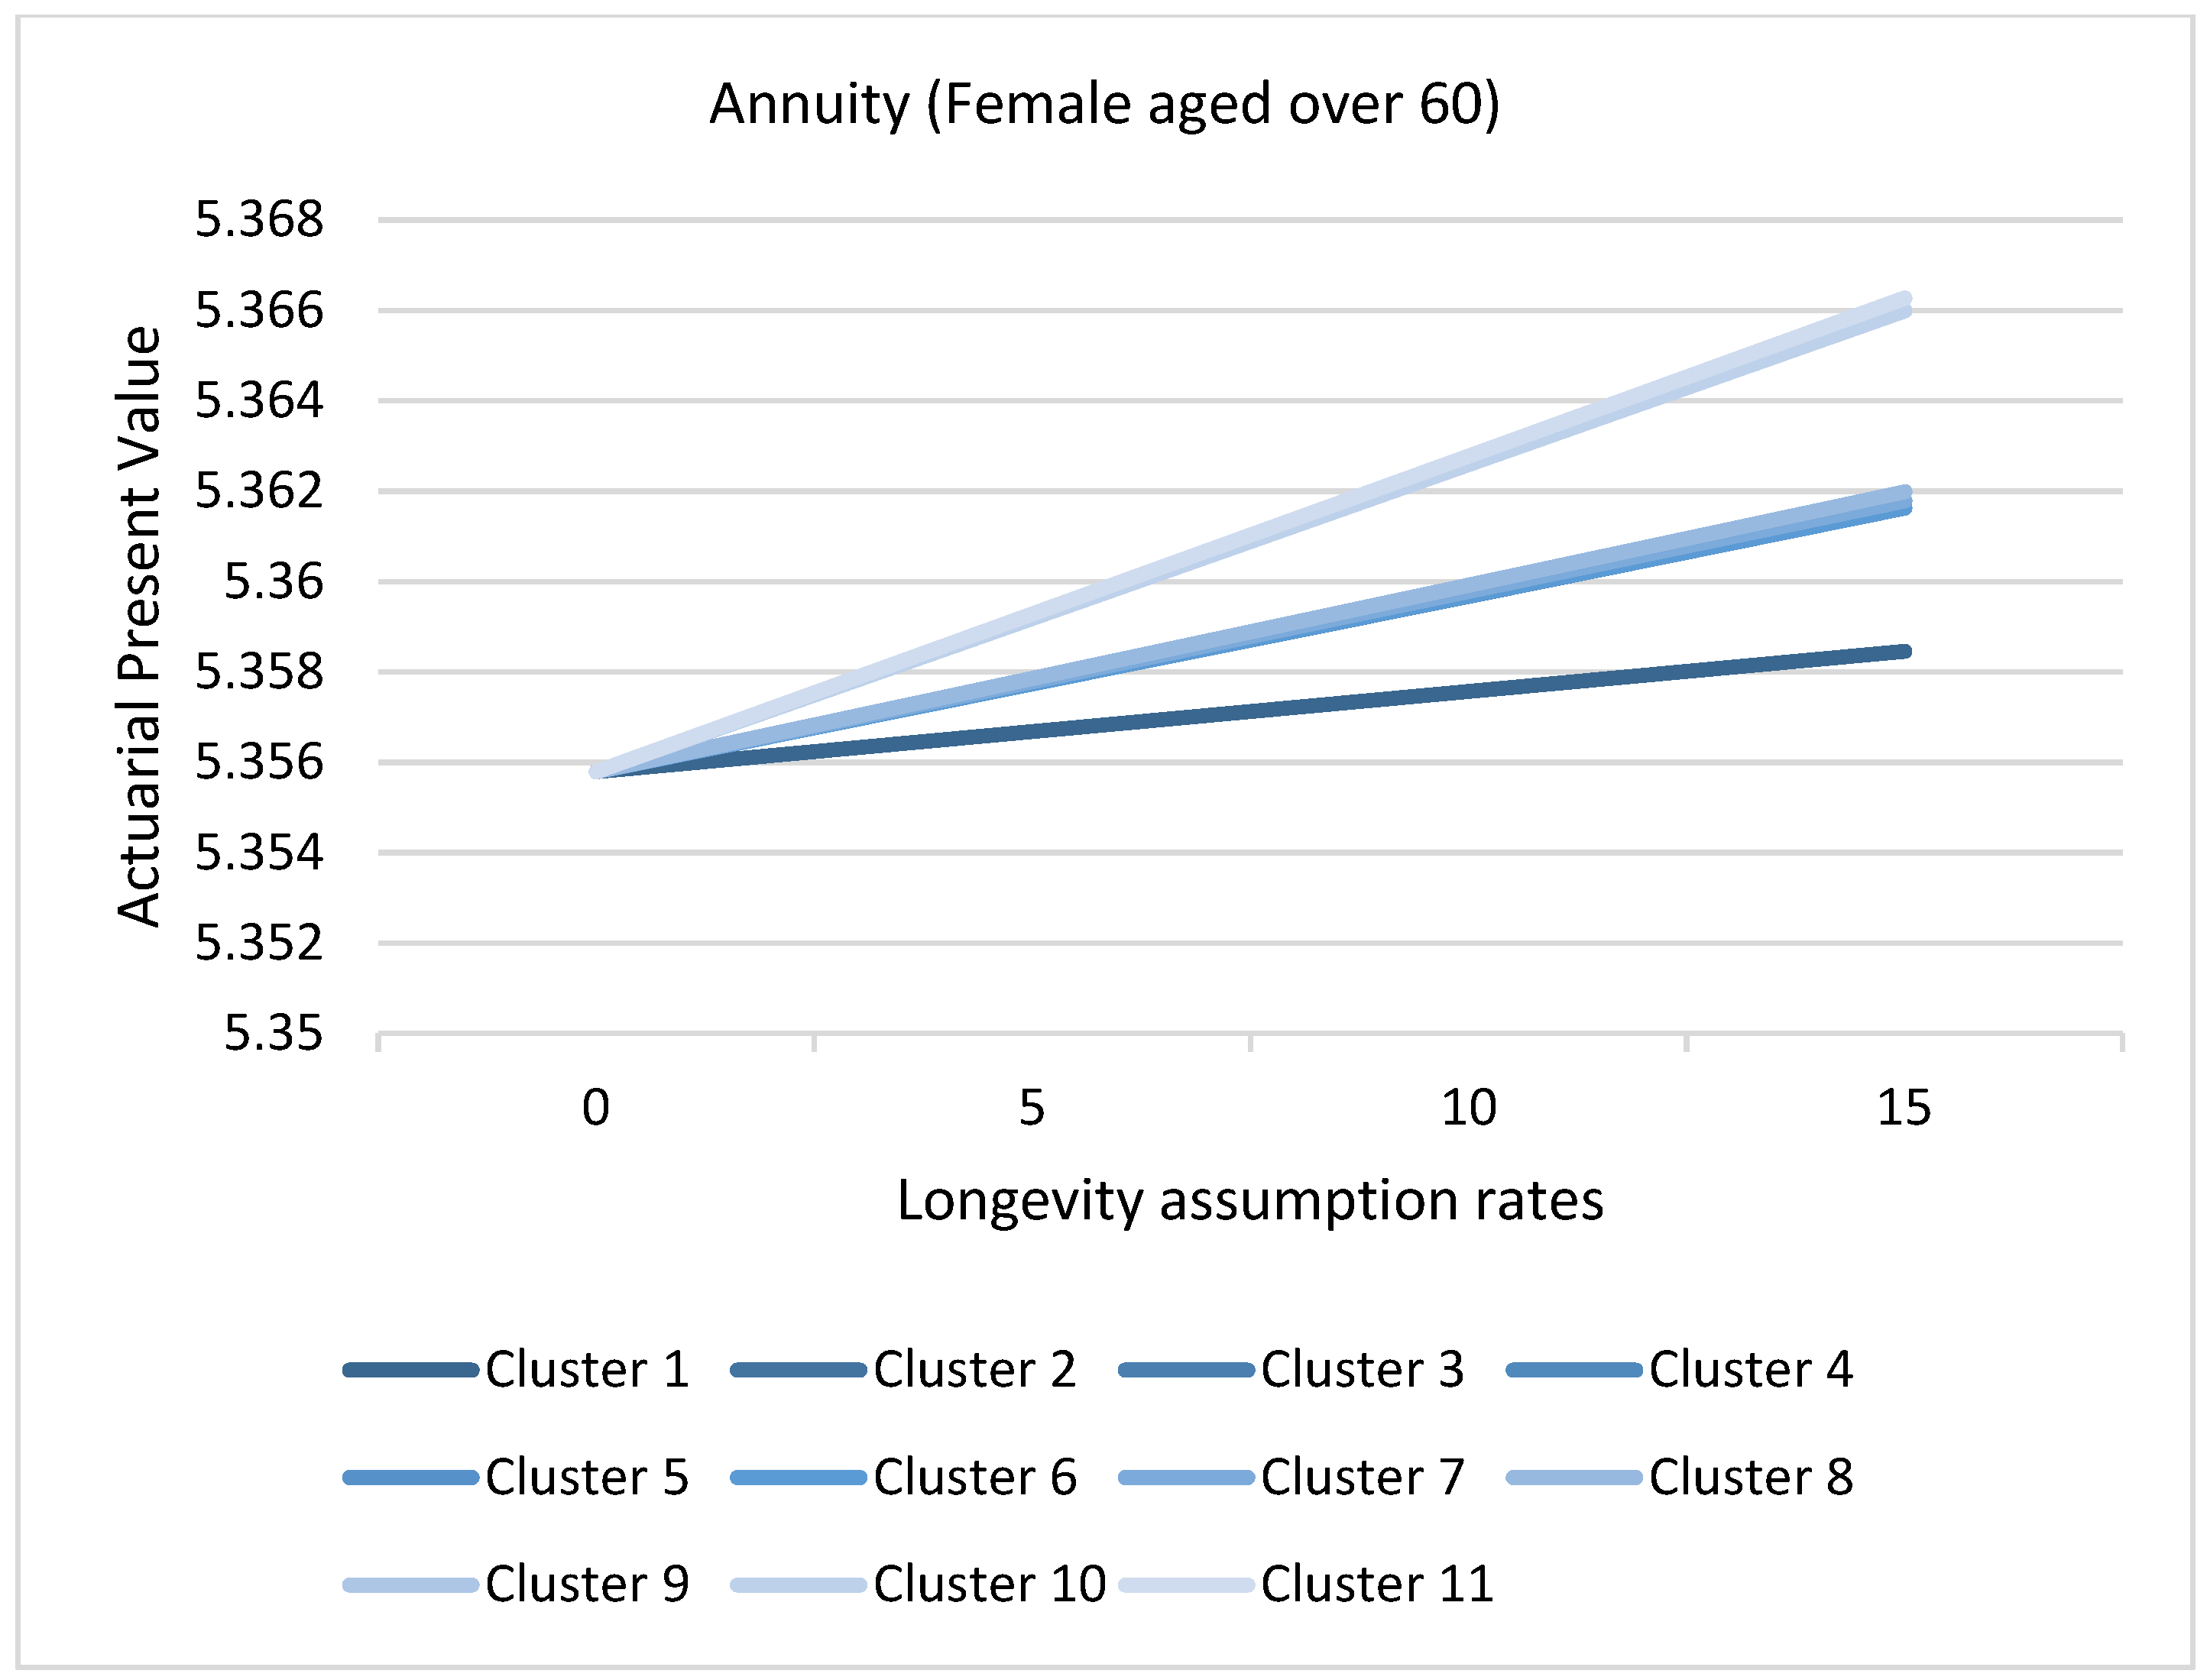
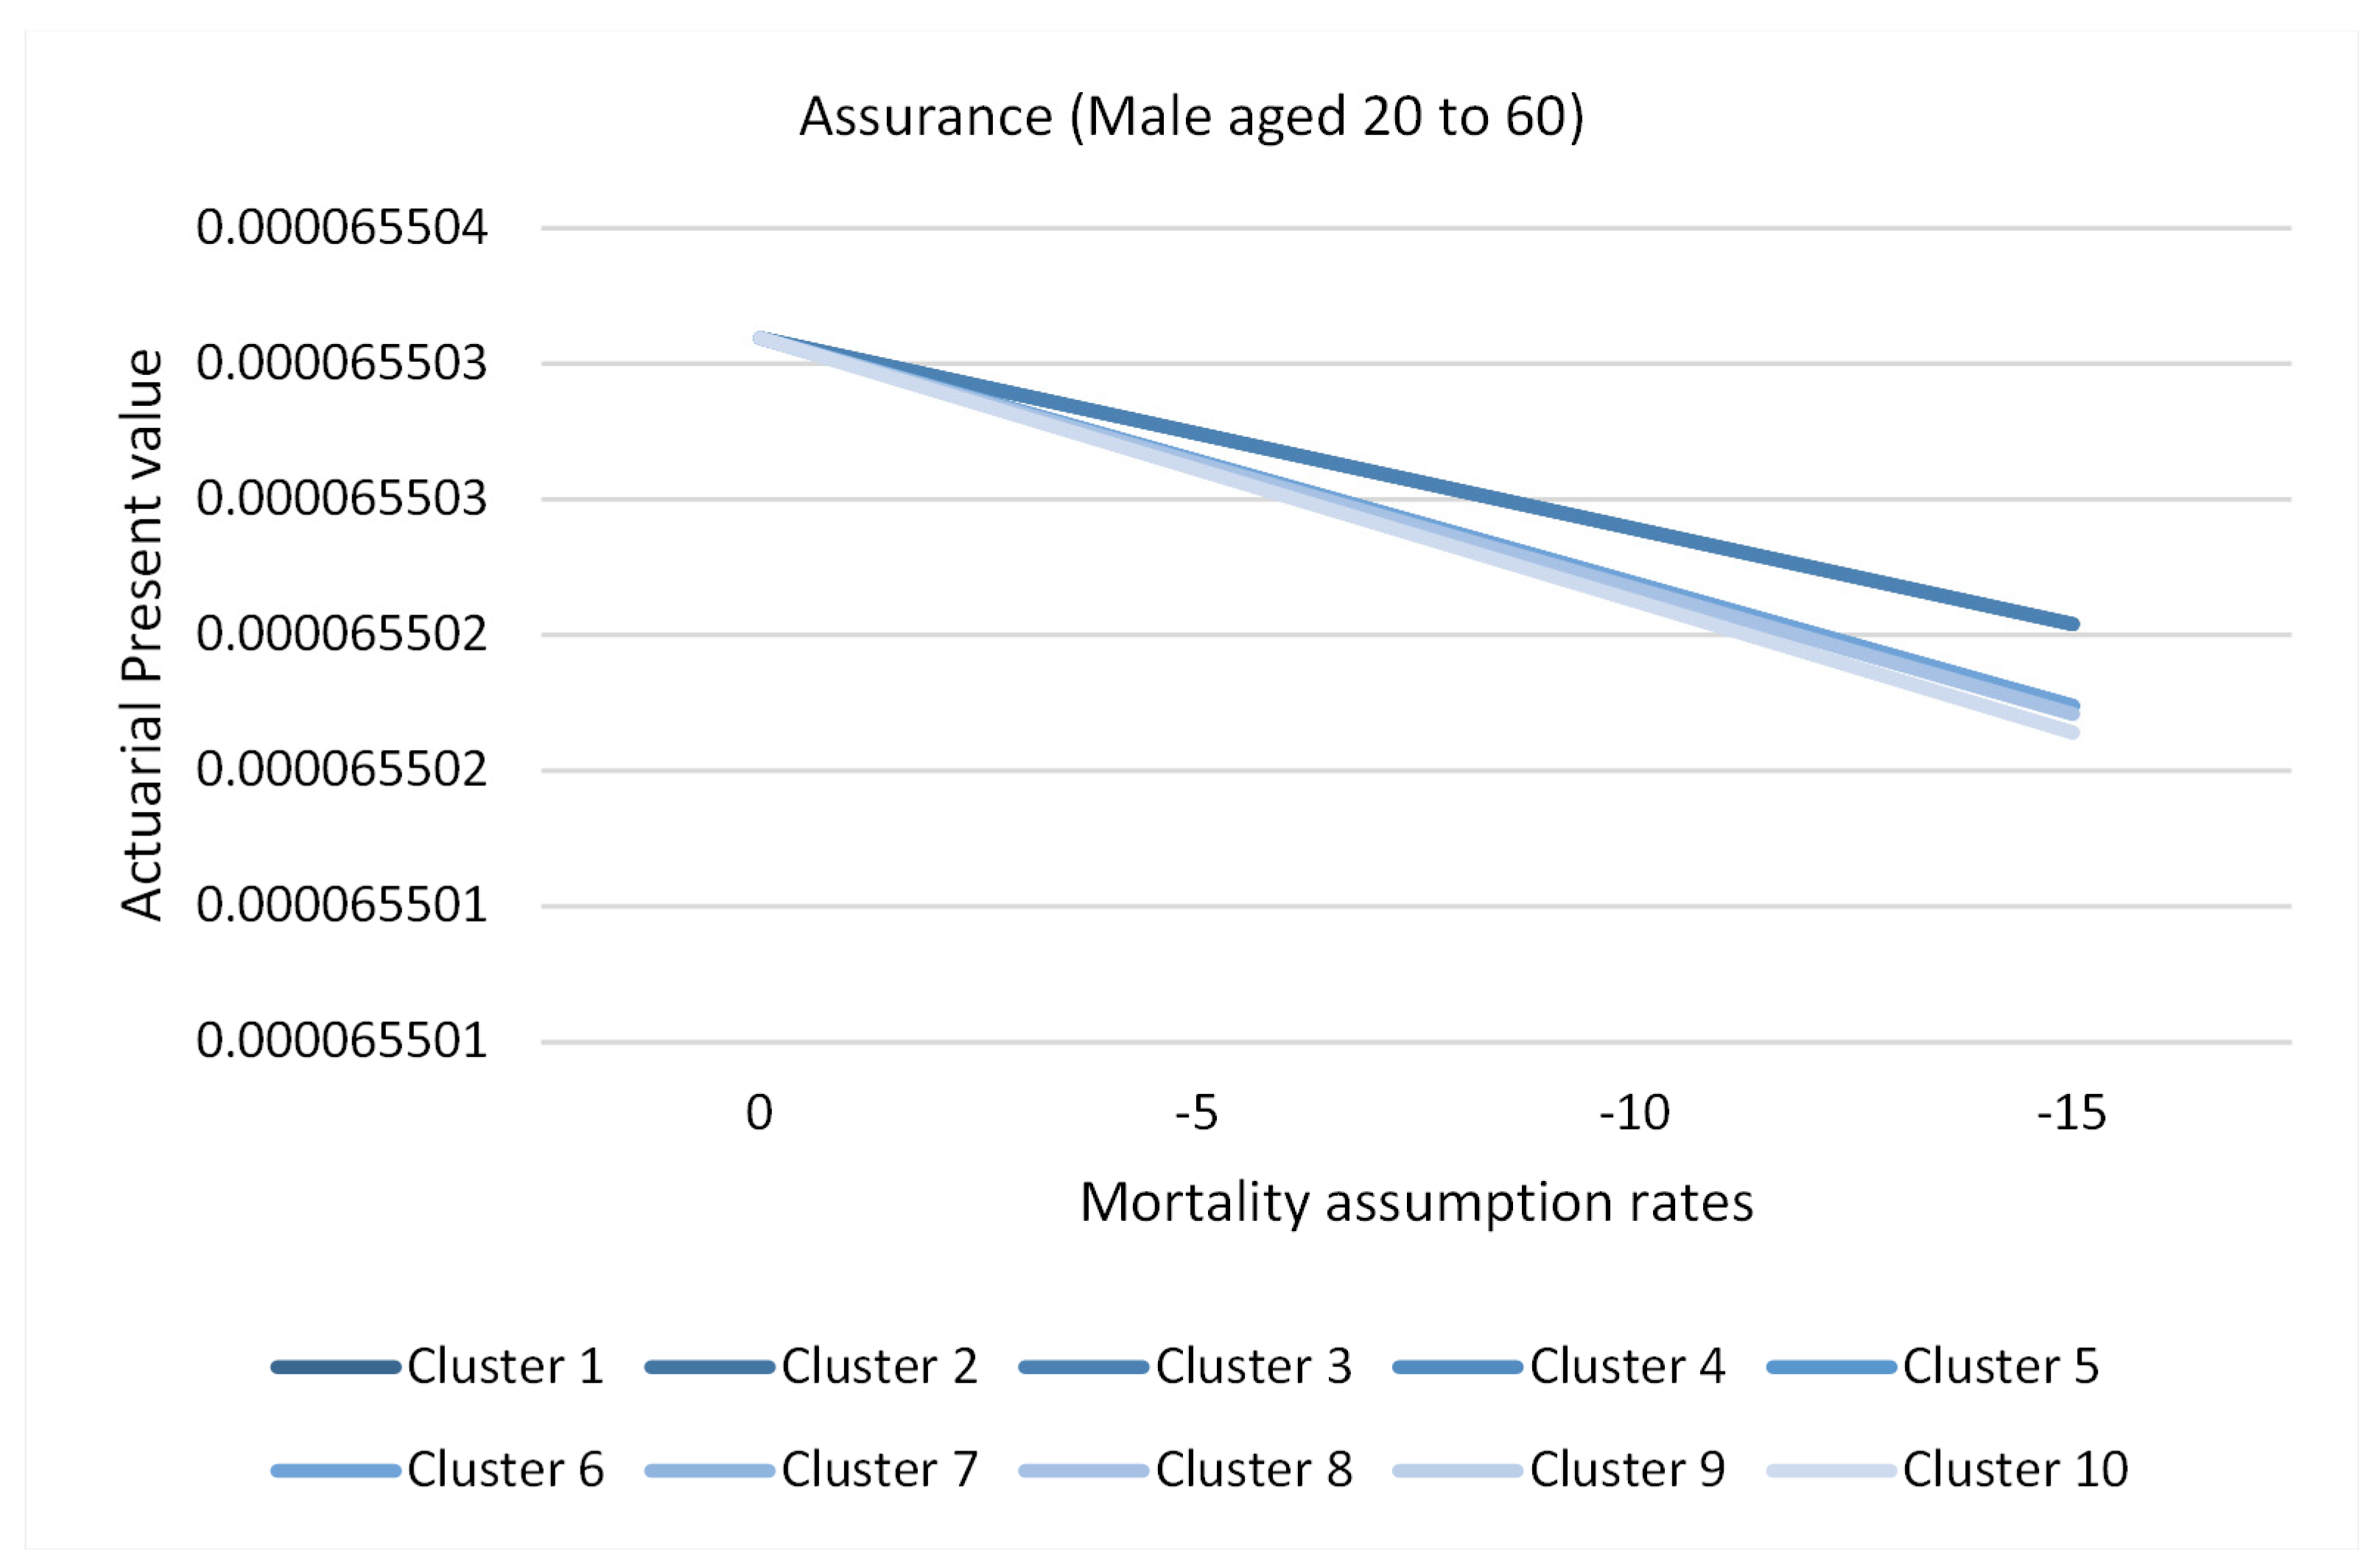
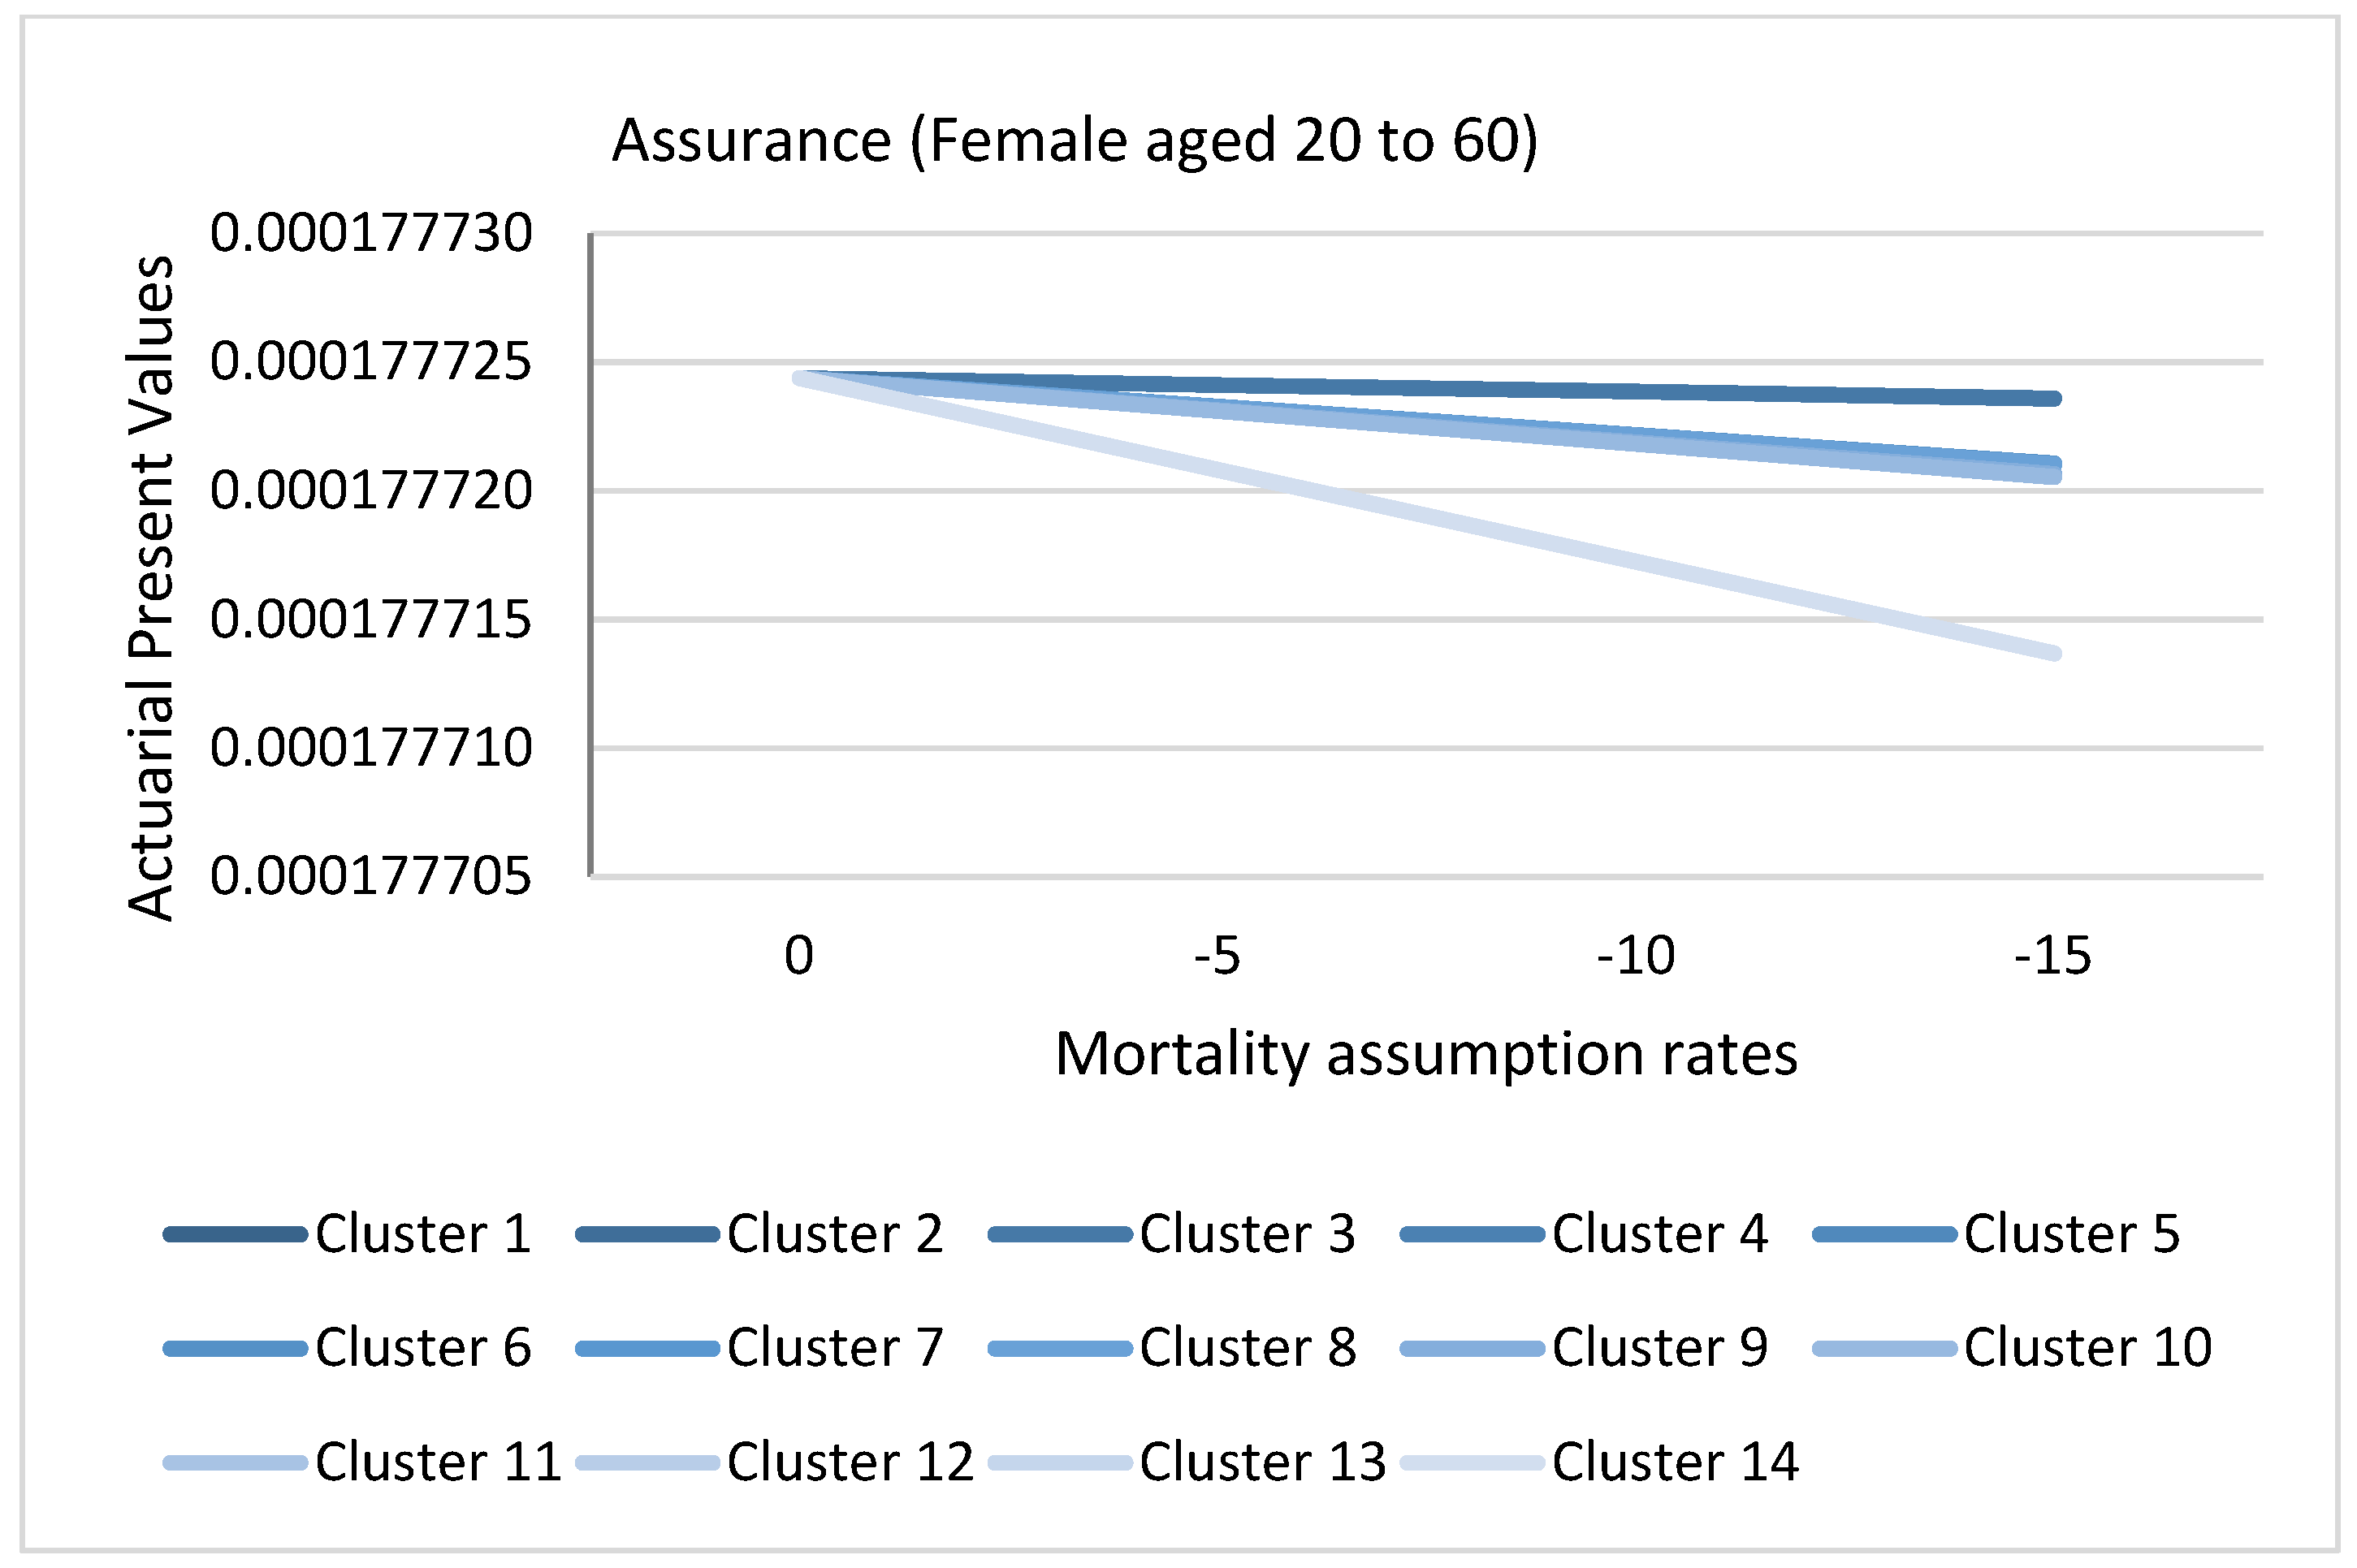
3.8. Application of Causes of Death Cluster Results in Actuarial Literature
3.9. Limitations of the Study
4. Conclusions
Author Contributions
Funding
Data Availability Statement
Acknowledgments
Conflicts of Interest
Appendix A

| GHE Code | Cause Name | ICD-10 Codes |
|---|---|---|
| 10 | I. Communicable, maternal, perinatal, and nutritional conditions | A00—B99, D50—D53, D64.9, E00—E02, E40—E46, E50—E64, G00—G04, G14, H65—H66, J00—J22, N70—N73, O00—O99, P00—P96, U04 |
| 20 | A. Infectious and parasitic diseases | A00—B99, G00—G04, G14, N70—N73, P37.3, P37.4 |
| 30 | 1. Tuberculosis | A15—A19, B90 |
| 40 | 2. STDs excluding HIV | A50—A64, N70—N73 |
| 50 | a. Syphilis | A50—A53 |
| 60 | b. Chlamydia | A55—A56 |
| 70 | c. Gonorrhoea | A54 |
| 80 | d. Trichomoniasis | A59 |
| 85 | e. Genital herpes | A60 |
| 90 | f. Other STDs | A57—A58, A63—A64, N70—N73 |
| 100 | 3. HIV/AIDS | B20—B24 |
| 101 | a. HIV resulting in TB | B20.0 |
| 102 | b. HIV resulting in other diseases | B20—B24 (minus B20.0) |
| 110 | 4. Diarrheal diseases | A00, A01, A03, A04, A06—A09 |
| 120 | 5. Childhood-cluster diseases | A33—A37, B05 |
| 130 | a. Whooping cough | A37 |
| 140 | b. Diphtheria | A36 |
| 150 | c. Measles | B05 |
| 160 | d. Tetanus | A33—A35 |
| 170 | 6. Meningitis | A39, G00, G03 |
| 180 | 7. Encephalitis | A83—A86, B94.1, G04 |
| 185 | 8. Hepatitis | B15—B19 (minus B17.8) |
| 186 | a. Acute hepatitis A | B15 |
| 190 | b. Acute hepatitis B | B16—B19 (minus B17.1, B17.2, B18.2, B18.8) |
| 200 | c. Acute hepatitis C | B17.1, B18.2 |
| 205 | d. Acute hepatitis E | B17.2, B18.8 |
| 210 | 9. Parasitic and vector diseases | A71, A82, A90—A91, A95, B50—B57, B65, B67, B69, B73, B74.0—B74.2, P37.3—P37.4 |
| 220 | a. Malaria | B50—B54, P37.3, P37.4 |
| 230 | b. Trypanosomiasis | B56 |
| 240 | c. Chagas disease | B57 |
| 250 | d. Schistosomiasis | B65 |
| 260 | e. Leishmaniasis | B55 |
| 270 | f. Lymphatic filariasis | B74.0—B74.2 |
| 280 | g. Onchocerciasis | B73 |
| 285 | h. Cysticercosis | B69 |
| 295 | i. Echinococcosis | B67 |
| 300 | j. Dengue | A90—A91 |
| 310 | k. Trachoma | A71 |
| 315 | l. Yellow fever | A95 |
| 320 | m. Rabies | A82 |
| 330 | 10. Intestinal nematode infections | B76—B81 |
| 340 | a. Ascariasis | B77 |
| 350 | b. Trichuriasis | B79 |
| 360 | c. Hookworm disease | B76 |
| 362 | d. Food-bourne trematodes | B78, B80, B81 |
| 365 | 11. Leprosy | A30 |
| 370 | 12. Other infectious diseases | A02, A05, A20—A28, A31, A32, A38, A40—A49, A65—A70, A74—A79, A80—A81, A87—A89, A92—A99, B00—B04, B06—B09, B17.8, B25—B49, B58—B60, B64, B66, B68, B70—B72, B74.3—B74.9, B75, B82—B89, B91—B99 (minus B94.1), G14 |
| 380 | B. Respiratory infectious | H65—H66, J00—J22, P23, U04 |
| 390 | 1. Lower respiratory infections | J09—J22, P23, U04 |
| 400 | 2. Upper respiratory infections | J00—J06 |
| 410 | 3. Otitis media | H65—H66 |
| 420 | C. Maternal conditions | O00—O99 |
| 490 | D. Neonatal conditions | P00—P96 (minus P23, P37.3, P37.4) |
| 500 | 1. Preterm birth complications | P05, P07, P22, P27—P28 |
| 510 | 2. Birth asphyxia and birth trauma | P03, P10—P15, P20—P21, P24—P26, P29 |
| 520 | 3. Neonatal sepsis and infections | P35—P39 (minus P37.3, P37.4) |
| 530 | 4. Other neonatal conditions | P00—P02, P04, P08, P50—P96 |
| 540 | E. Nutritional deficiencies | D50—D53, D64.9, E00—E02, E40—E46, E50—E64 |
| 550 | 1. Protein-energy malnutrition | E40—E46 |
| 560 | 2. Iodine deficiency | E00—E02 |
| 570 | 3. Vitamin A deficiency | E50 |
| 580 | 4. Iron-deficiency anemia | D50, D64.9 |
| 590 | 5. Other nutritional deficiencies | D51—D53, E51—E64 |
| 600 | II. Non-communicable diseases | C00—C97, D00—D48, D55—D64 (minus D 64.9), D65—D89, E03—E07, E10—E34, E65—E88, F01—F99, G06—G98 (minus G14), H00—H61, H68—H93, I00—I99, J30—J98, K00—K92, L00—L98, M00—M99, N00—N64, N75—N98, Q00—Q99, X41—X42, X44, X45, R95 |
| 610 | A. Malignant neoplasms c | C00—C97 |
| 620 | 1. Mouth and oropharynx cancers | C00—C14 |
| 621 | a. Lip and oral cavity | C00—C08 |
| 622 | b. Nasopharynx | C11 |
| 623 | c. Other pharynx | C09—C10, C12—C14 |
| 630 | 2. Esophagus cancer | C15 |
| 640 | 3. Stomach cancer | C16 |
| 650 | 4. Colon and rectum cancers | C18—C21 |
| 660 | 5. Liver cancer | C22 |
| 670 | 6. Pancreas cancer | C25 |
| 680 | 7. Trachea, bronchus, lung cancers | C33—C34 |
| 690 | 8. Melanoma and other skin cancers | C43—C44 |
| 691 | a. Malignant skin melanoma | C43 |
| 692 | b. Non-melanoma skin cancer | C44 |
| 700 | 9. Breast cancer | C50 |
| 710 | 10. Cervix uteri cancer | C53 |
| 720 | 11. Corpus uteri cancer | C54 |
| 730 | 12. Ovary cancer | C56 |
| 740 | 13. Prostate cancer | C61 |
| 742 | 14. Testicular cancer | C62 |
| 745 | 15. Kidney, renal pelvis, and ureter cancer | C64—C66 |
| 750 | 16. Bladder cancer | C67 |
| 751 | 17. Brain and nervous system cancers | C70—C72 |
| 752 | 18. Gallbladder and biliary tract cancer | C23—C24 |
| 753 | 19. Larynx cancer | C32 |
| 754 | 20. Thyroid cancer | C73 |
| 755 | 21. Mesothelioma | C45 |
| 760 | 22. Lymphomas, multiple myeloma | C81—C90, C96 |
| 761 | a. Hodgkin lymphoma | C81 |
| 762 | b. Non-Hodgkin lymphoma | C82—C86, C96 |
| 763 | c. Multiple myeloma | C88, C90 |
| 770 | 23. Leukemia | C91—C95 |
| 780 | 24. Other malignant neoplasms | C17, C26—C31, C37—C41, C46—C49, C51, C52, C57—C60, C63, C68, C69, C74—C75, C77—C79 |
| 790 | B. Other neoplasms | D00—D48 |
| 800 | C. Diabetes mellitus | E10—E14 (minus E10.2, E11.2, E12.2, E13.2, E14.2) |
| 810 | D. Endocrine, blood, immune disorders | D55—D64 (minus D64.9), D65—D89, E03—E07, E15—E34, E65—E88 |
| 811 | 1. Thalassemias | D56 |
| 812 | 2. Sickle cell disorders and trait | D57 |
| 813 | 3. Other hemoglobinopathies and hemolytic anemias | D55, D58—D59 |
| 814 | 4. Other endocrine, blood, and immune disorders | D60—D64 (minus D64.9), D65—D89, E03—E07, E15—E34, E65—E88 |
| 820 | E. Mental and substance use disorders | F04—F99, G72.1, Q86.0, X41—X42, X44, X45 |
| 830 | 1. Depressive disorders | F32—F33, F34.1 |
| 831 | a. Major depressive disorder | F32—F33 |
| 832 | b. Dysthymia | F34.1 |
| 840 | 2. Bipolar disorder | F30—F31 |
| 850 | 3. Schizophrenia | F20—F29 |
| 860 | 4. Alcohol-use disorders | F10, G72.1, Q86.0, X45 |
| 870 | 5. Drug-use disorders | F11—F16, F18—F19d, X41—X42, X44d |
| 871 | a. Opioid use disorders | F11, X42 |
| 872 | b. Cocaine use disorders | F14 |
| 873 | c. Amphetamine use disorders | F15 |
| 874 | d. Cannabis use disorders | F12 |
| 875 | e. Other drug use disorders | F13, F16, F18, X41 |
| 880 | 6. Anxiety disorders | F40—F44 |
| 890 | 7. Eating disorders | F50 |
| 900 | 8. Autism and Asperger syndrome | F84 |
| 910 | 9. Childhood behavioral disorders | F90—F92 |
| 911 | a. Attention deficit/hyperactivity syndrome | F90 |
| 912 | b. Conduct disorder | F91—F92 |
| 920 | 10. Idiopathic intellectual disability | F70—F79 |
| 930 | 11. Other mental and behavioral disorders | F04—F09, F17, F34—F39 (minus F34.1), F45—F48, F51—F69, F80—F83, F88—F89, F93—F99 |
| 940 | F. Neurological conditions | F01—F03, G06—G98 (minus G14, G72.1) |
| 950 | 1. Alzheimer disease and other dementias | F01—F03, G30—G31 |
| 960 | 2. Parkinson disease | G20—G21 |
| 970 | 3. Epilepsy | G40—G41 |
| 980 | 4. Multiple sclerosis | G35 |
| 990 | 5. Migraine | G43 |
| 1000 | 6. Non-migraine headache | G44 |
| 1010 | 7. Other neurological conditions | G06—G12, G23—G25, G36—G37, G45—G98 (minus G72.1) |
| 1020 | G. Sense organ diseases | H00—H61, H68—H93 |
| 1030 | 1. Glaucoma | H40 |
| 1040 | 2. Cataracts | H25—H26 |
| 1050 | 3. Uncorrected refractive errors | H49—H52 |
| 1060 | 4. Macular degeneration | H35.3 |
| 1070 | 5. Other vision loss | H30—H35 (minus H35.3), H53—H54 |
| 1080 | 6. Other hearing loss | H90—H91 |
| 1090 | 7. Other sense organ disorders | H00—H21, H27, H43—H47, H55—H61, H68—H83, H92—H93 |
| 1100 | H. Cardiovascular diseases | I00—I99 |
| 1110 | 1. Rheumatic heart disease | I01—I09 |
| 1120 | 2. Hypertensive heart disease | I11—I15 |
| 1130 | 3. Ischemic heart disease | I20—I25 |
| 1140 | 4. Stroke | I60—I69 |
| 1150 | 5. Cardiomyopathy, myocarditis, endocarditis | I30—I33, I38, I40, I42 |
| 1160 | 6. Other circulatory diseases | I00, I26—I28, I34—I37, I44—I51, I70—I99 |
| 1170 | I. Respiratory diseases | J30—J98 |
| 1180 | 1. Chronic obstructive pulmonary disease | J40—J44 |
| 1190 | 2. Asthma | J45—J46 |
| 1200 | 3. Other respiratory diseases | J30—J39, J47—J98 |
| 1210 | J. Digestive diseases | K20—K92 |
| 1220 | 1. Peptic ulcer disease | K25—K27 |
| 1230 | 2. Cirrhosis of the liver | K70, K74 |
| 1240 | 3. Appendicitis | K35—K37 |
| 1241 | 4. Gastritis and duodenitis | K29 |
| 1242 | 5. Paralytic ileus and intestinal obstruction | K56 |
| 1244 | 6. Inflammatory bowel disease | K50—K52, K58.0 |
| 1246 | 7. Gallbladder and biliary diseases | K80—K83 |
| 1248 | 8. Pancreatitis | K85—K86 |
| 1250 | 9. Other digestive diseases | K20—K22, K28, K30—K31, K38, K40—K46, K55, K57, K58.9, K59—K66, K71—K73, K75—K76, K90—K92 |
| 1260 | K. Genitourinary diseases | E10.2—E10.29, E11.2—E11.29, E12.2, E13.2—E13.29, E14.2, N00—N64, N75—N76, N80—N98 |
| 1270 | 1. Kidney diseases | N00—N19, E10.2, E11.2, E12.2, E13.2, E14.2 |
| 1271 | a. Acute glomerulonephritis | N00—N01 |
| 1272 | b. Chronic kidney disease due to diabetes | E10.2, E11.2, E12.2, E13.2, E14.2 |
| 1273 | c. Other chronic kidney disease | N02—N19 |
| 1280 | 2. Benign prostatic hyperplasia | N40 |
| 1290 | 3. Urolithiasis | N20—N23 |
| 1300 | 4. Other urinary diseases | N25—N39, N41—N45, N47—N51 |
| 1310 | 5. Infertility | N46, N97 |
| 1320 | 6. Gynecological diseases | N60—N64, N75—N76, N80—N96, N98 |
| 1330 | L. Skin diseases | L00—L98 |
| 1340 | M. Musculoskeletal diseases | M00—M99 |
| 1350 | 1. Rheumatoid arthritis | M05—M06 |
| 1360 | 2. Osteoarthritis | M15—M19 |
| 1370 | 3. Gout | M10 |
| 1380 | 4. Back and neck pain | M45—M48, M50—M54 |
| 1390 | 5. Other musculoskeletal disorders | M00, M02, M08, M11—M13, M20—M43, M60—M99 |
| 1400 | N. Congenital anomalies | Q00—Q99 (minus Q86.0) |
| 1410 | 1. Neural tube defects | Q00, Q05 |
| 1420 | 2. Cleft lip and cleft palate | Q35—Q37 |
| 1430 | 3. Down syndrome | Q90 |
| 1440 | 4. Congenital heart anomalies | Q20—Q28 |
| 1450 | 5. Other chromosomal anomalies | Q91—Q99 |
| 1460 | 6. Other congenital anomalies | Q01—Q04, Q06—Q18, Q30—Q34, Q38—Q89 (excluding Q86.0) |
| 1470 | O. Oral conditions | K00—K14 |
| 1480 | 1. Dental caries | K02 |
| 1490 | 2. Periodontal disease | K05 |
| 1500 | 3. Edentulism | — |
| 1502 | 4. Other oral disorders | K00, K01, K03, K04, K06—K14 |
| 1505 | P. Sudden infant death syndrome | R95 |
| 1510 | III. Injuries | V01—Y89 (minus X41—X42, X44, X45) |
| 1520 | A. Unintentional injuries | V01—X40, X43, X46—59, Y40—Y86, Y88, Y89 |
| 1530 | 1. Road injury | V01—V04, V06, V09—V80, V87, V89, V99 |
| 1540 | 2. Poisonings | X40, X43, X46—X48, X49 |
| 1550 | 3. Falls | W00—W19 |
| 1560 | 4. Fire, heat, and hot substances | X00—X19 |
| 1570 | 5. Drowning | W65—W74 |
| 1575 | 6. Exposure to mechanical forces | W20—W38, W40—W43, W45, W46, W49—W52, W75, W76 |
| 1580 | 7. Natural disasters | X33—X39 |
| 1590 | 8. Other unintentional injuries | Rest of V, W39, W44, W53—W64, W77—W99, X20—X32, X50—X59, Y40—Y86, Y88, Y89 |
| 1600 | B. Intentional injuries | X60—Y09, Y35—Y36, Y870, Y871 |
| 1610 | 1. Self—harm | X60—X84, Y870 |
| 1620 | 2. Interpersonal violence | X85—Y09, Y871 |
| 1630 | 3. Collective violence and legal intervention | Y35—Y36 |
| Cluster | Cause (Males Aged over 60) |
|---|---|
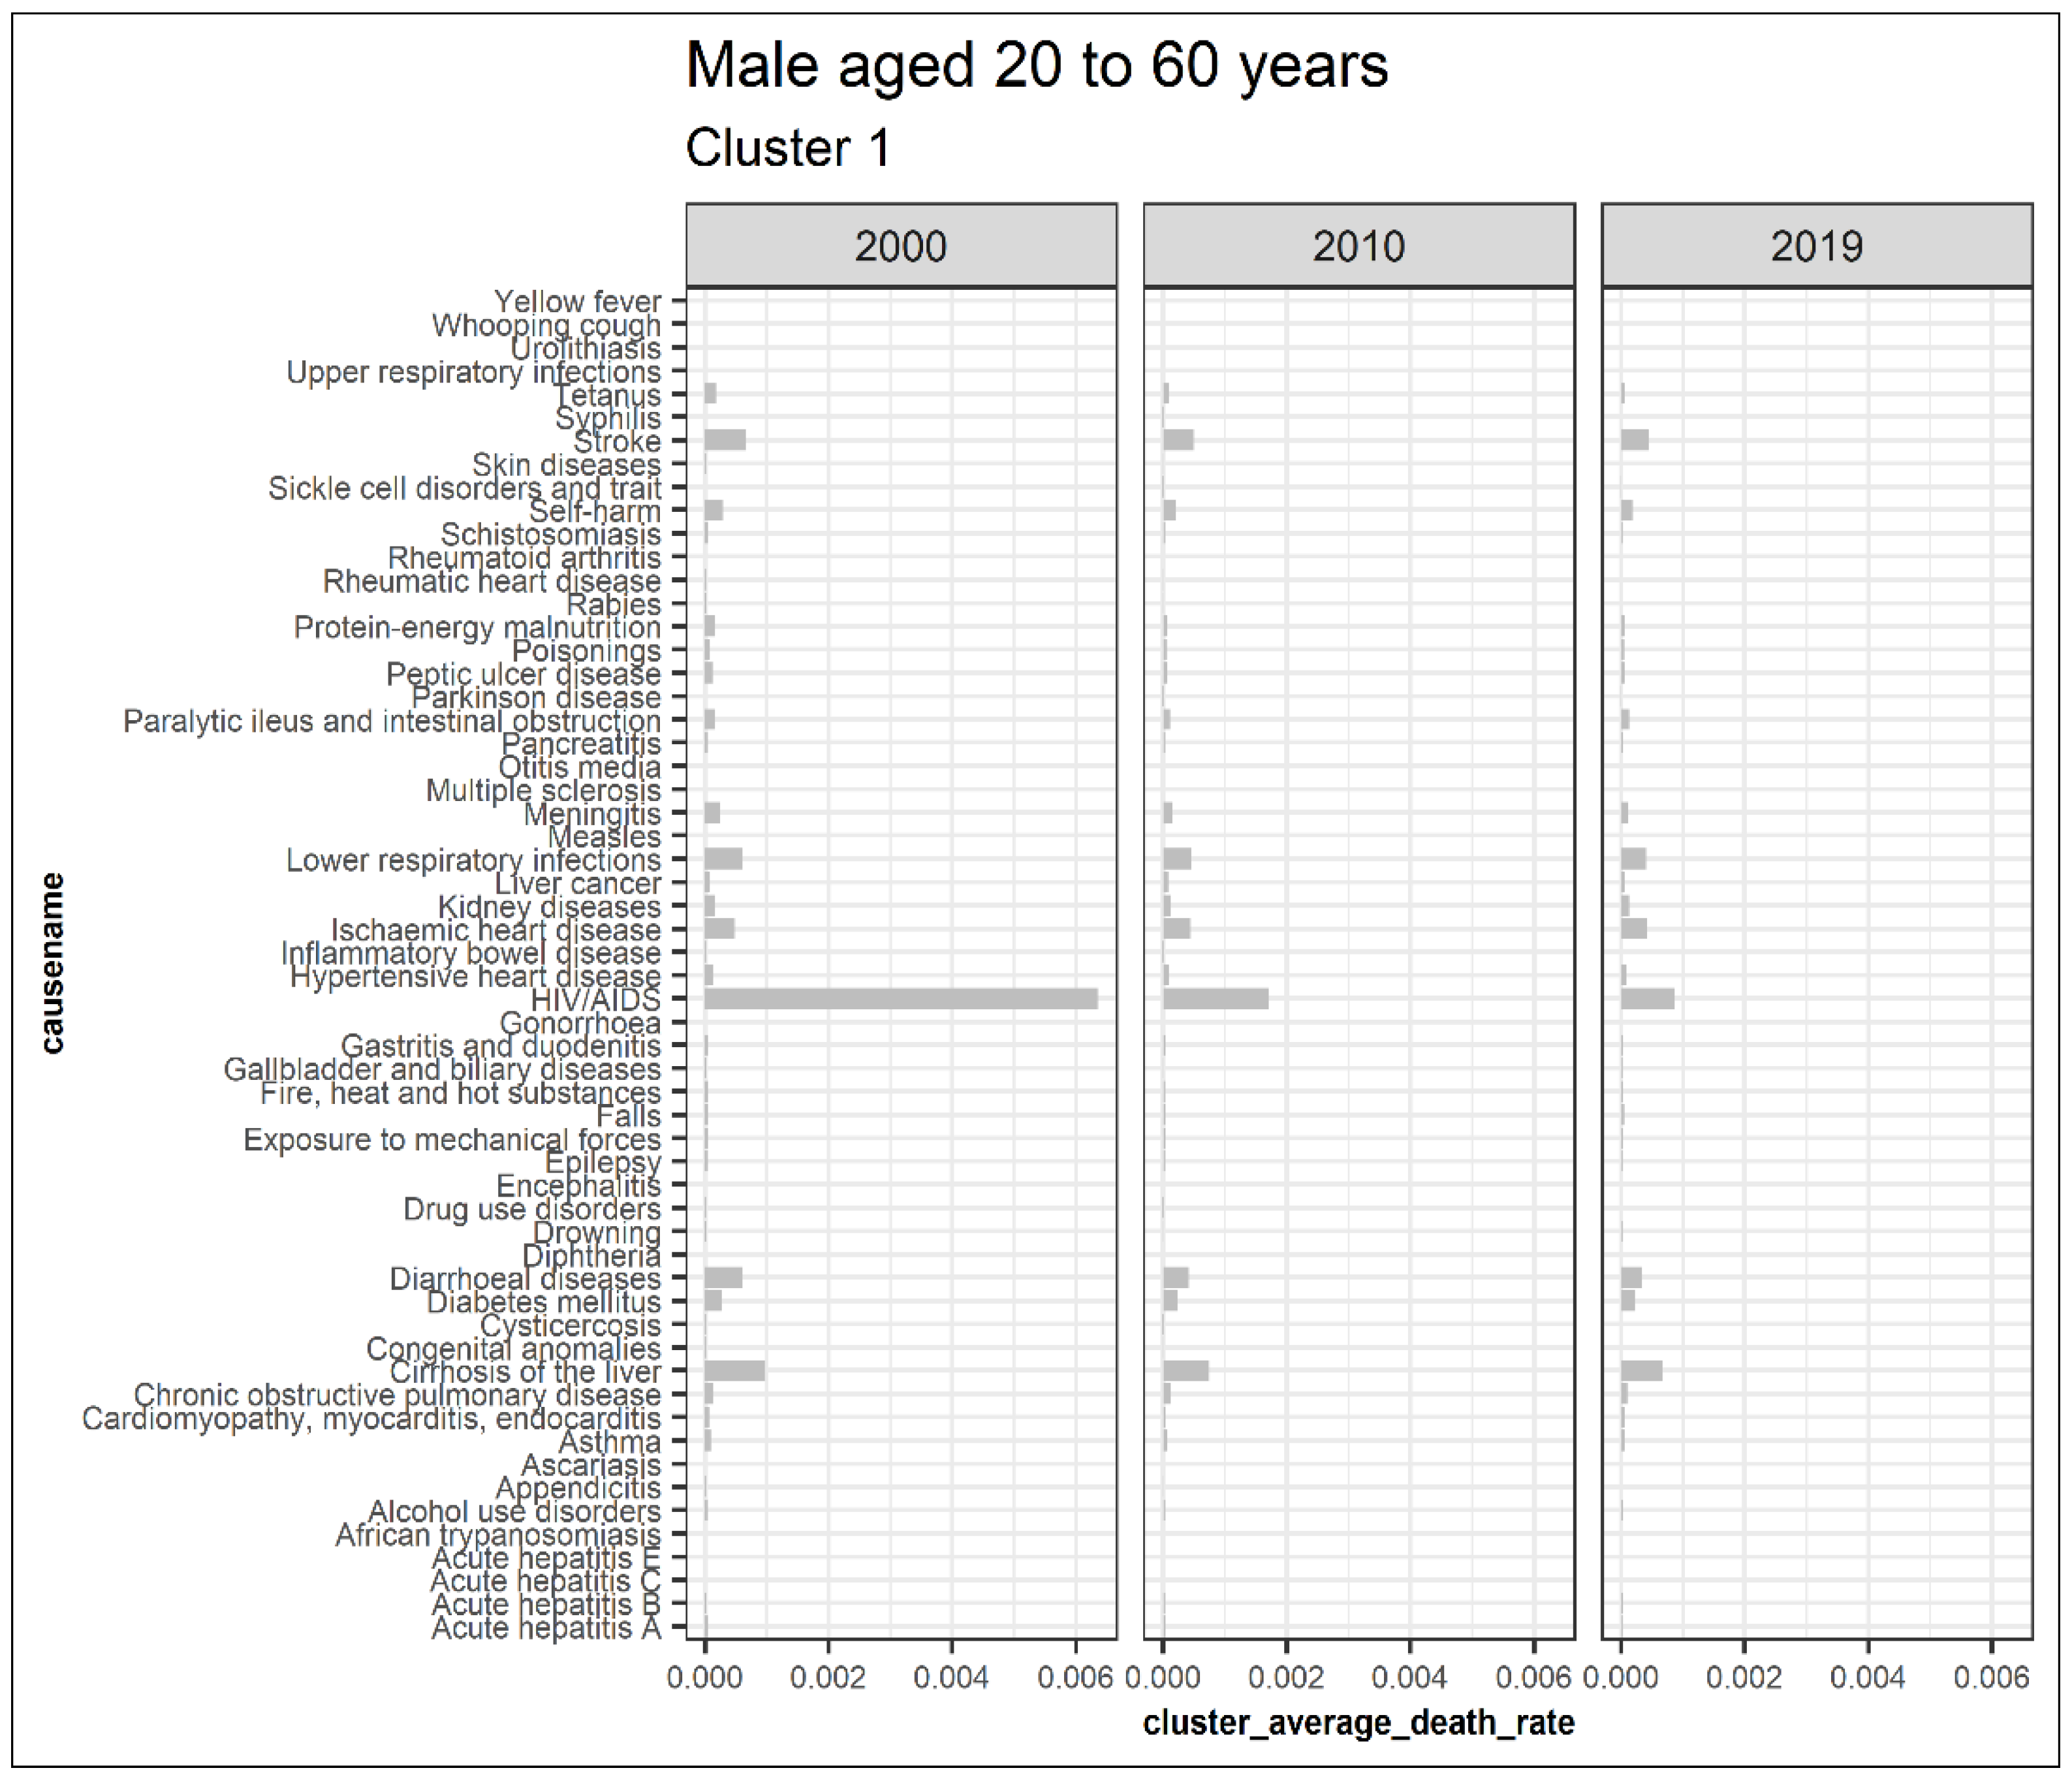
| 1 | Acute hepatitis A, Acute hepatitis C, Appendicitis, Ascariasis, Asthma, Chronic obstructive pulmonary disease, Cirrhosis of the liver, Cysticercosis, Diarrheal diseases, and Drowning Drug use disorders, Epilepsy, Exposure to mechanical forces, Fire heat and hot substances, astritis and duodenitis, Gonorrhea, HIV AIDS, Hypertensive heart disease, Leukemia, Liver cancer, Lower respiratory infections, Malaria, Meningitis, Otitis media, Peptic ulcer disease, Poisonings, Protein energy malnutrition, Rabies, Rheumatic heart disease, Rheumatoid arthritis, Road injury, Schistosomiasis, Self-harm, Stomach cancer, Stroke, Syphilis, Tetanus, Trachea bronchus lung cancers, Tuberculosis, Upper respiratory infections, Urolithiasis, and Yellow fever |
| 2 | Acute hepatitis B, Acute hepatitis E, Bladder cancer, Brain and nervous system cancers, Colon and rectum cancers, Gallbladder and biliary tract cancer, Interpersonal violence, Kidney cancer, Larynx cancer, Lymphomas multiple myeloma, Melanoma, and other skin cancers, Mesothelioma, Mouth and oropharynx cancers, Esophagus cancer, Pancreas cancer, Parkinson disease, Prostate cancer, Sickle cell disorders and trait, Testicular cancer, and Thyroid cancer |
| 3 | African trypanosomiasis |
| 4 | Alcohol-use disorders, Alzheimer disease, and other dementias, Anxiety disorders, Autism and Asperger syndrome, Back and neck pain, Benign prostatic hyperplasia, Bipolar disorder, Breast cancer, Cardiomyopathy myocarditis endocarditis, Cataracts, Cervix uteri cancer, Chagas disease, Childhood behavioral disorders, Chlamydia, Collective violence, and legal intervention Congenital anomalies, Corpus uteri cancer, Dengue, Depressive disorders, Diabetes mellitus, Diphtheria, Eating disorders, Echinococcosis, Encephalitis, Falls, Food bourne trematodes, Gallbladder and biliary diseases, Genital herpes, Glaucoma, Gout, Gynecological diseases, and Hookworm disease Idiopathic intellectual disability, Infertility, Inflammatory bowel disease, Iodine deficiency, Iron deficiency anaemia, Kidney diseases, Leishmaniasis, Leprosy, Lymphatic filariasis, Macular degeneration, Maternal conditions, Measles, Migraine, Multiple sclerosis, Neonatal conditions, Non migraine headache, Onchocerciasis, Oral conditions, Osteoarthritis, Other hearing loss, Other vision loss, Ovary cancer, Pancreatitis, Paralytic ileus and intestinal obstruction, Schizophrenia, Skin diseases, Sudden infant death syndrome, Thalassemias, Trachoma, Trichomoniasis, Trichuriasis, Uncorrected refractive errors, Vitamin A deficiency, and Whooping cough |
| 5 | Ischemic heart disease |
| 6 | Natural disasters |
| Cluster | Cause (Males Aged 20 to 60) |
|---|---|
| 1 | Acute hepatitis A, Acute hepatitis B, Acute hepatitis C, Acute hepatitis E, African trypanosomiasis, Alcohol-use disorders, Appendicitis, Ascariasis, Asthma, Cardiomyopathy myocarditis endocarditis, Chronic obstructive pulmonary disease, Cirrhosis of the liver, Congenital anomalies, Cysticercosis, Diabetes mellitus, Diarrheal diseases, Diphtheria, Drowning, Drug use disorders, Encephalitis, Epilepsy, Exposure to mechanical forces, Falls, Fire heat and hot substances, Gallbladder and biliary diseases, Gastritis and duodenitis, Gonorrhea, HIV AIDS, Hypertensive heart disease, Inflammatory bowel disease, Ischemic heart disease, Kidney diseases, Liver cancer, Lower respiratory infections, Measles, Meningitis, Multiple sclerosis, Otitis media, Pancreatitis, Paralytic ileus and intestinal obstruction, Parkinson disease, Peptic ulcer disease, Poisonings, Protein energy malnutrition, Rabies, Rheumatic heart disease, Rheumatoid arthritis, Schistosomiasis, Self-harm, Sickle cell disorders and trait, Skin diseases, Stroke, Syphilis, Tetanus, Upper respiratory infections, Urolithiasis, Whooping cough, and Yellow fever |
| 2 | Alzheimer disease and other dementias |
| 3 | Anxiety disorders, Autism and Asperger syndrome, Back and neck pain, Benign prostatic hyperplasia, Bipolar disorder, Cataracts, Cervix uteri cancer, Chagas disease, Childhood behavioral disorders, Chlamydia, Corpus uteri cancer, Depressive disorders, Food-bourne trematodes, Genital herpes, Glaucoma, Gout, Gynecological diseases, Hookworm disease, Idiopathic intellectual disability, Infertility, Iodine deficiency, Iron deficiency anemia, Leprosy, Lymphatic filariasis, Macular degeneration, Maternal conditions, Migraine, Neonatal conditions, Non migraine headache, Onchocerciasis, Oral conditions, Osteoarthritis, Other hearing loss, Other vision loss, Ovary cancer, Schizophrenia, Sudden infant death syndrome, Thalassemias, Trachoma, Trichomoniasis, Trichuriasis, Uncorrected refractive errors, and Vitamin A deficiency |
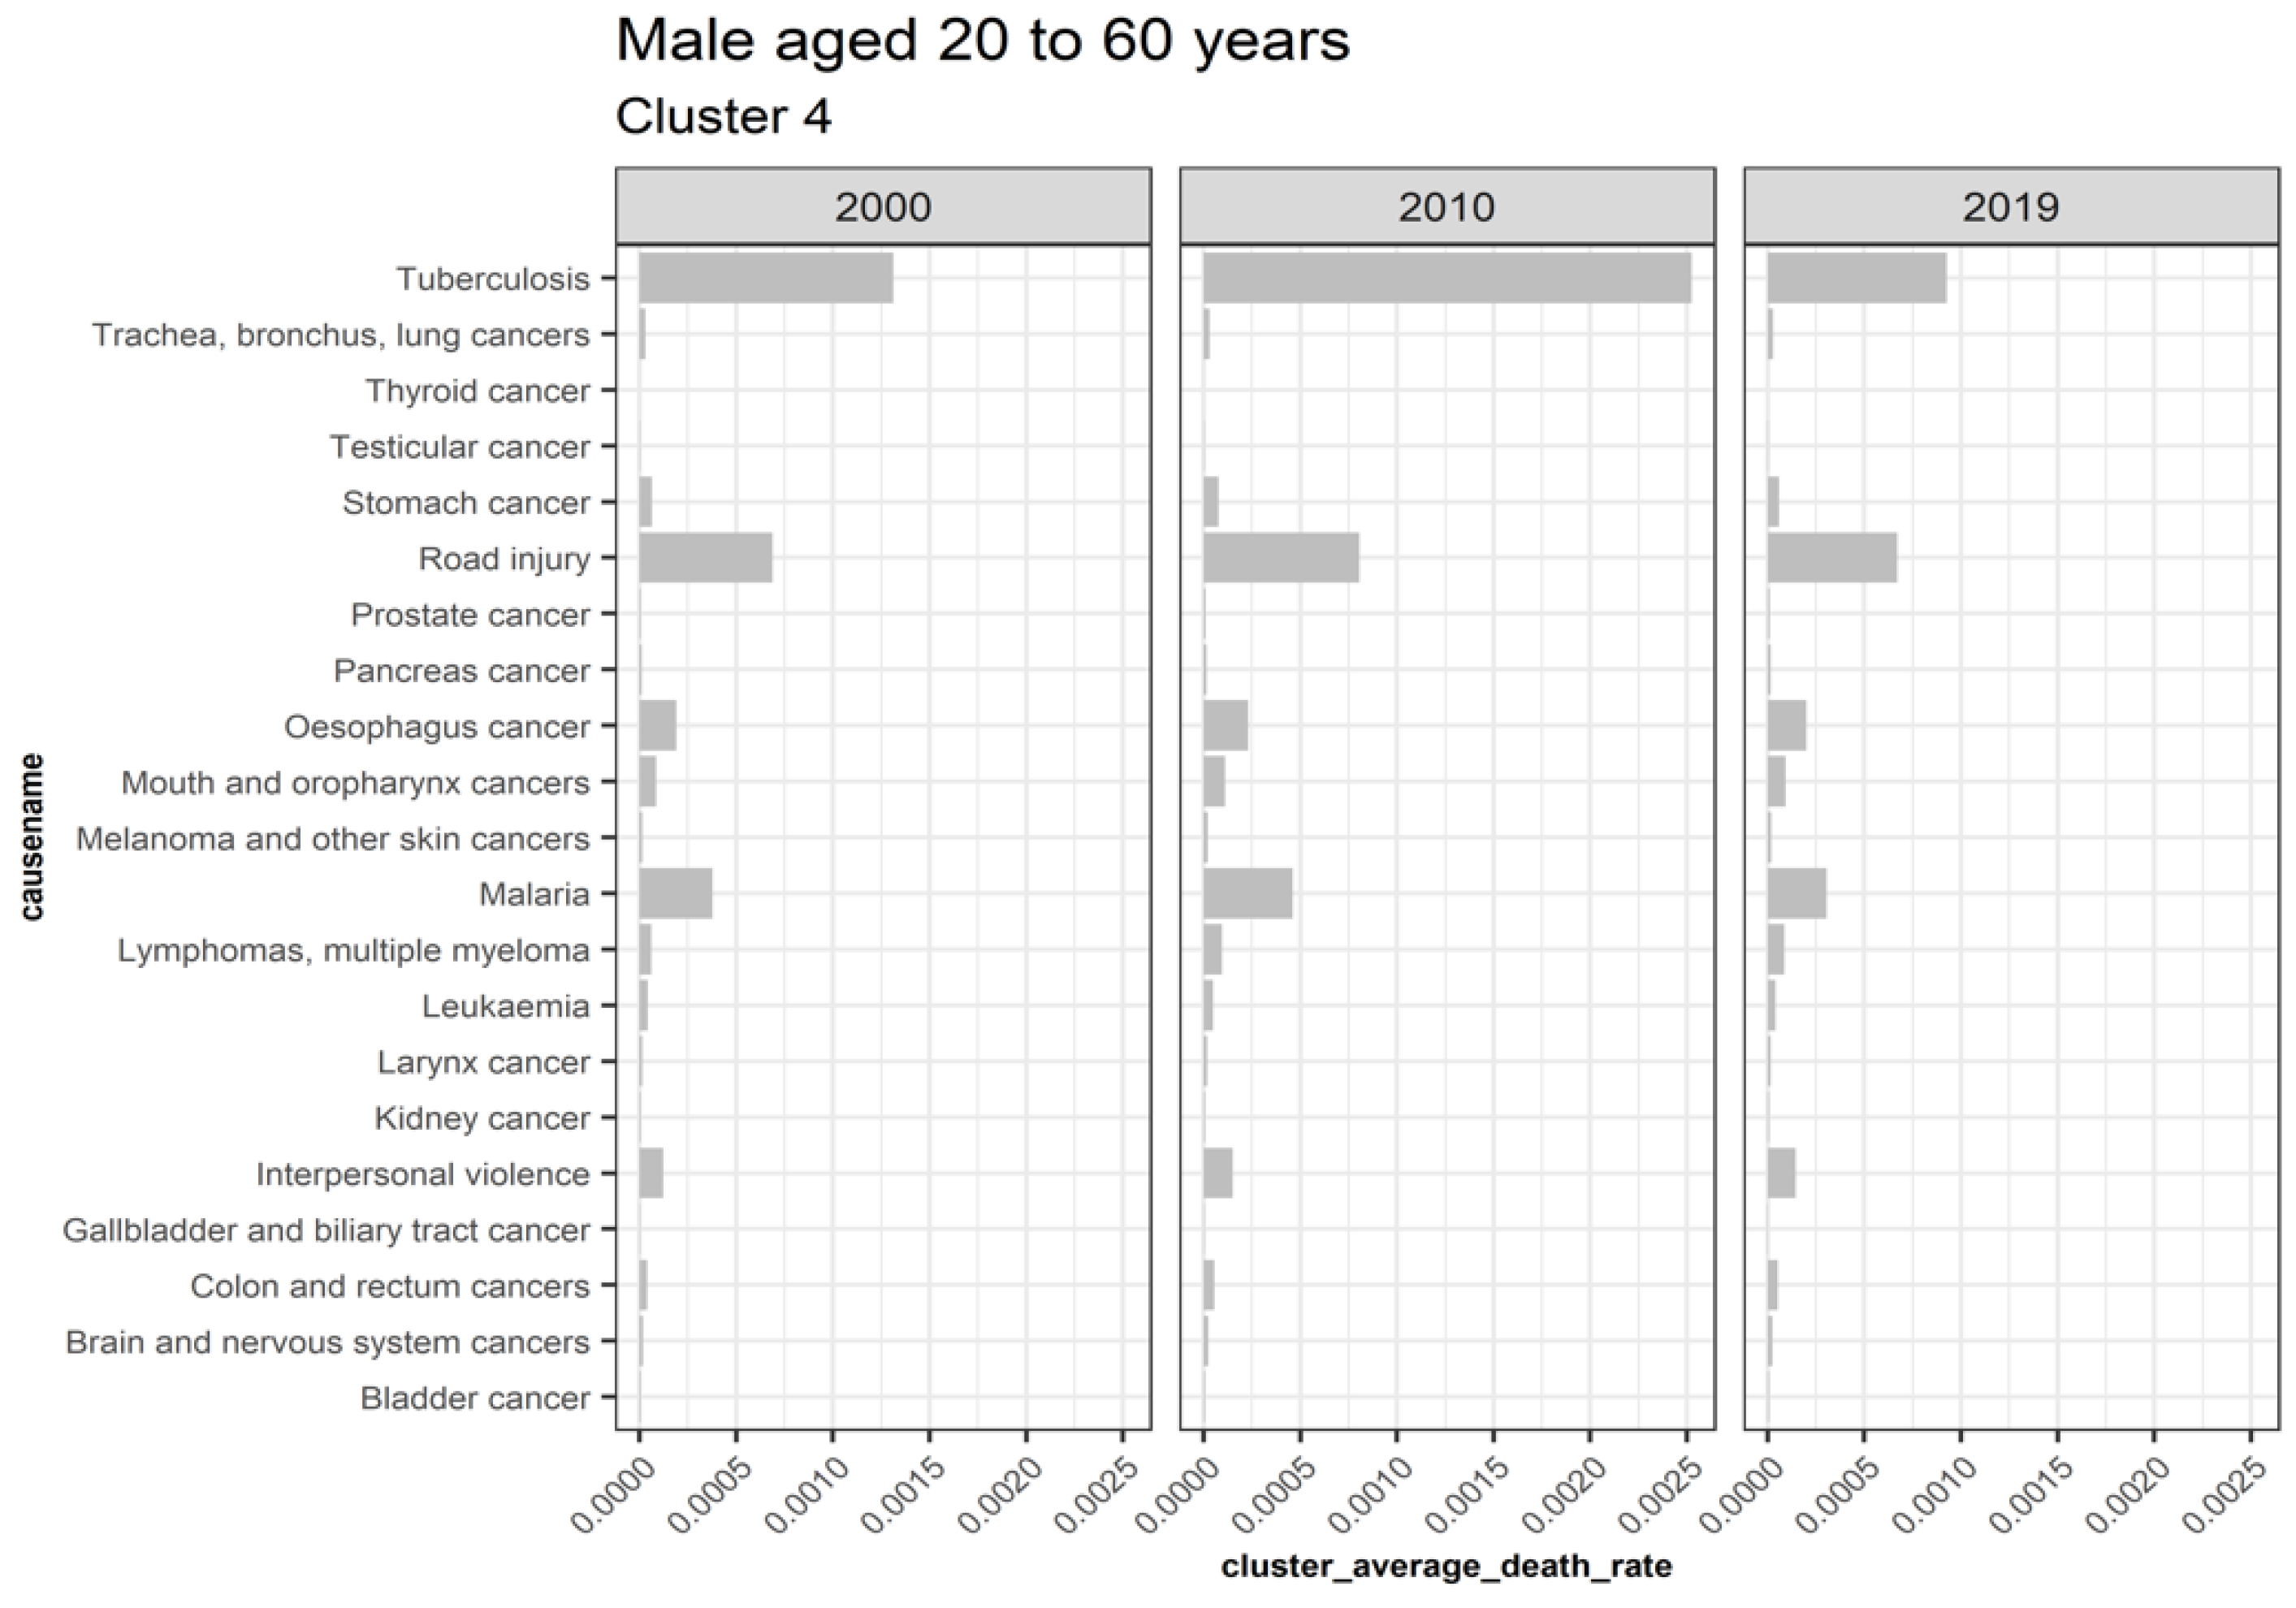
| 4 | Bladder cancer, Brain and nervous system cancers, Colon and rectum cancers, Gallbladder and biliary tract cancer, Interpersonal violence, Kidney cancer, Larynx cancer, Leukemia, Lymphomas multiple myeloma, Malaria, Melanoma and other skin cancers, Mouth and oropharynx cancers, Esophagus cancer, Pancreas cancer, Prostate cancer, Road injury, Stomach cancer, Testicular cancer, Thyroid cancer, Trachea bronchus lung cancers, and Tuberculosis |
| 5 | Breast cancer, Mesothelioma |
| 6 | Collective violence and legal intervention |
| 7 | Dengue, Echinococcosis |
| 8 | Eating disorders |
| 9 | Leishmaniasis |
| 10 | Natural disasters |
| Cluster | Cause (Females Aged over 60) |
|---|---|
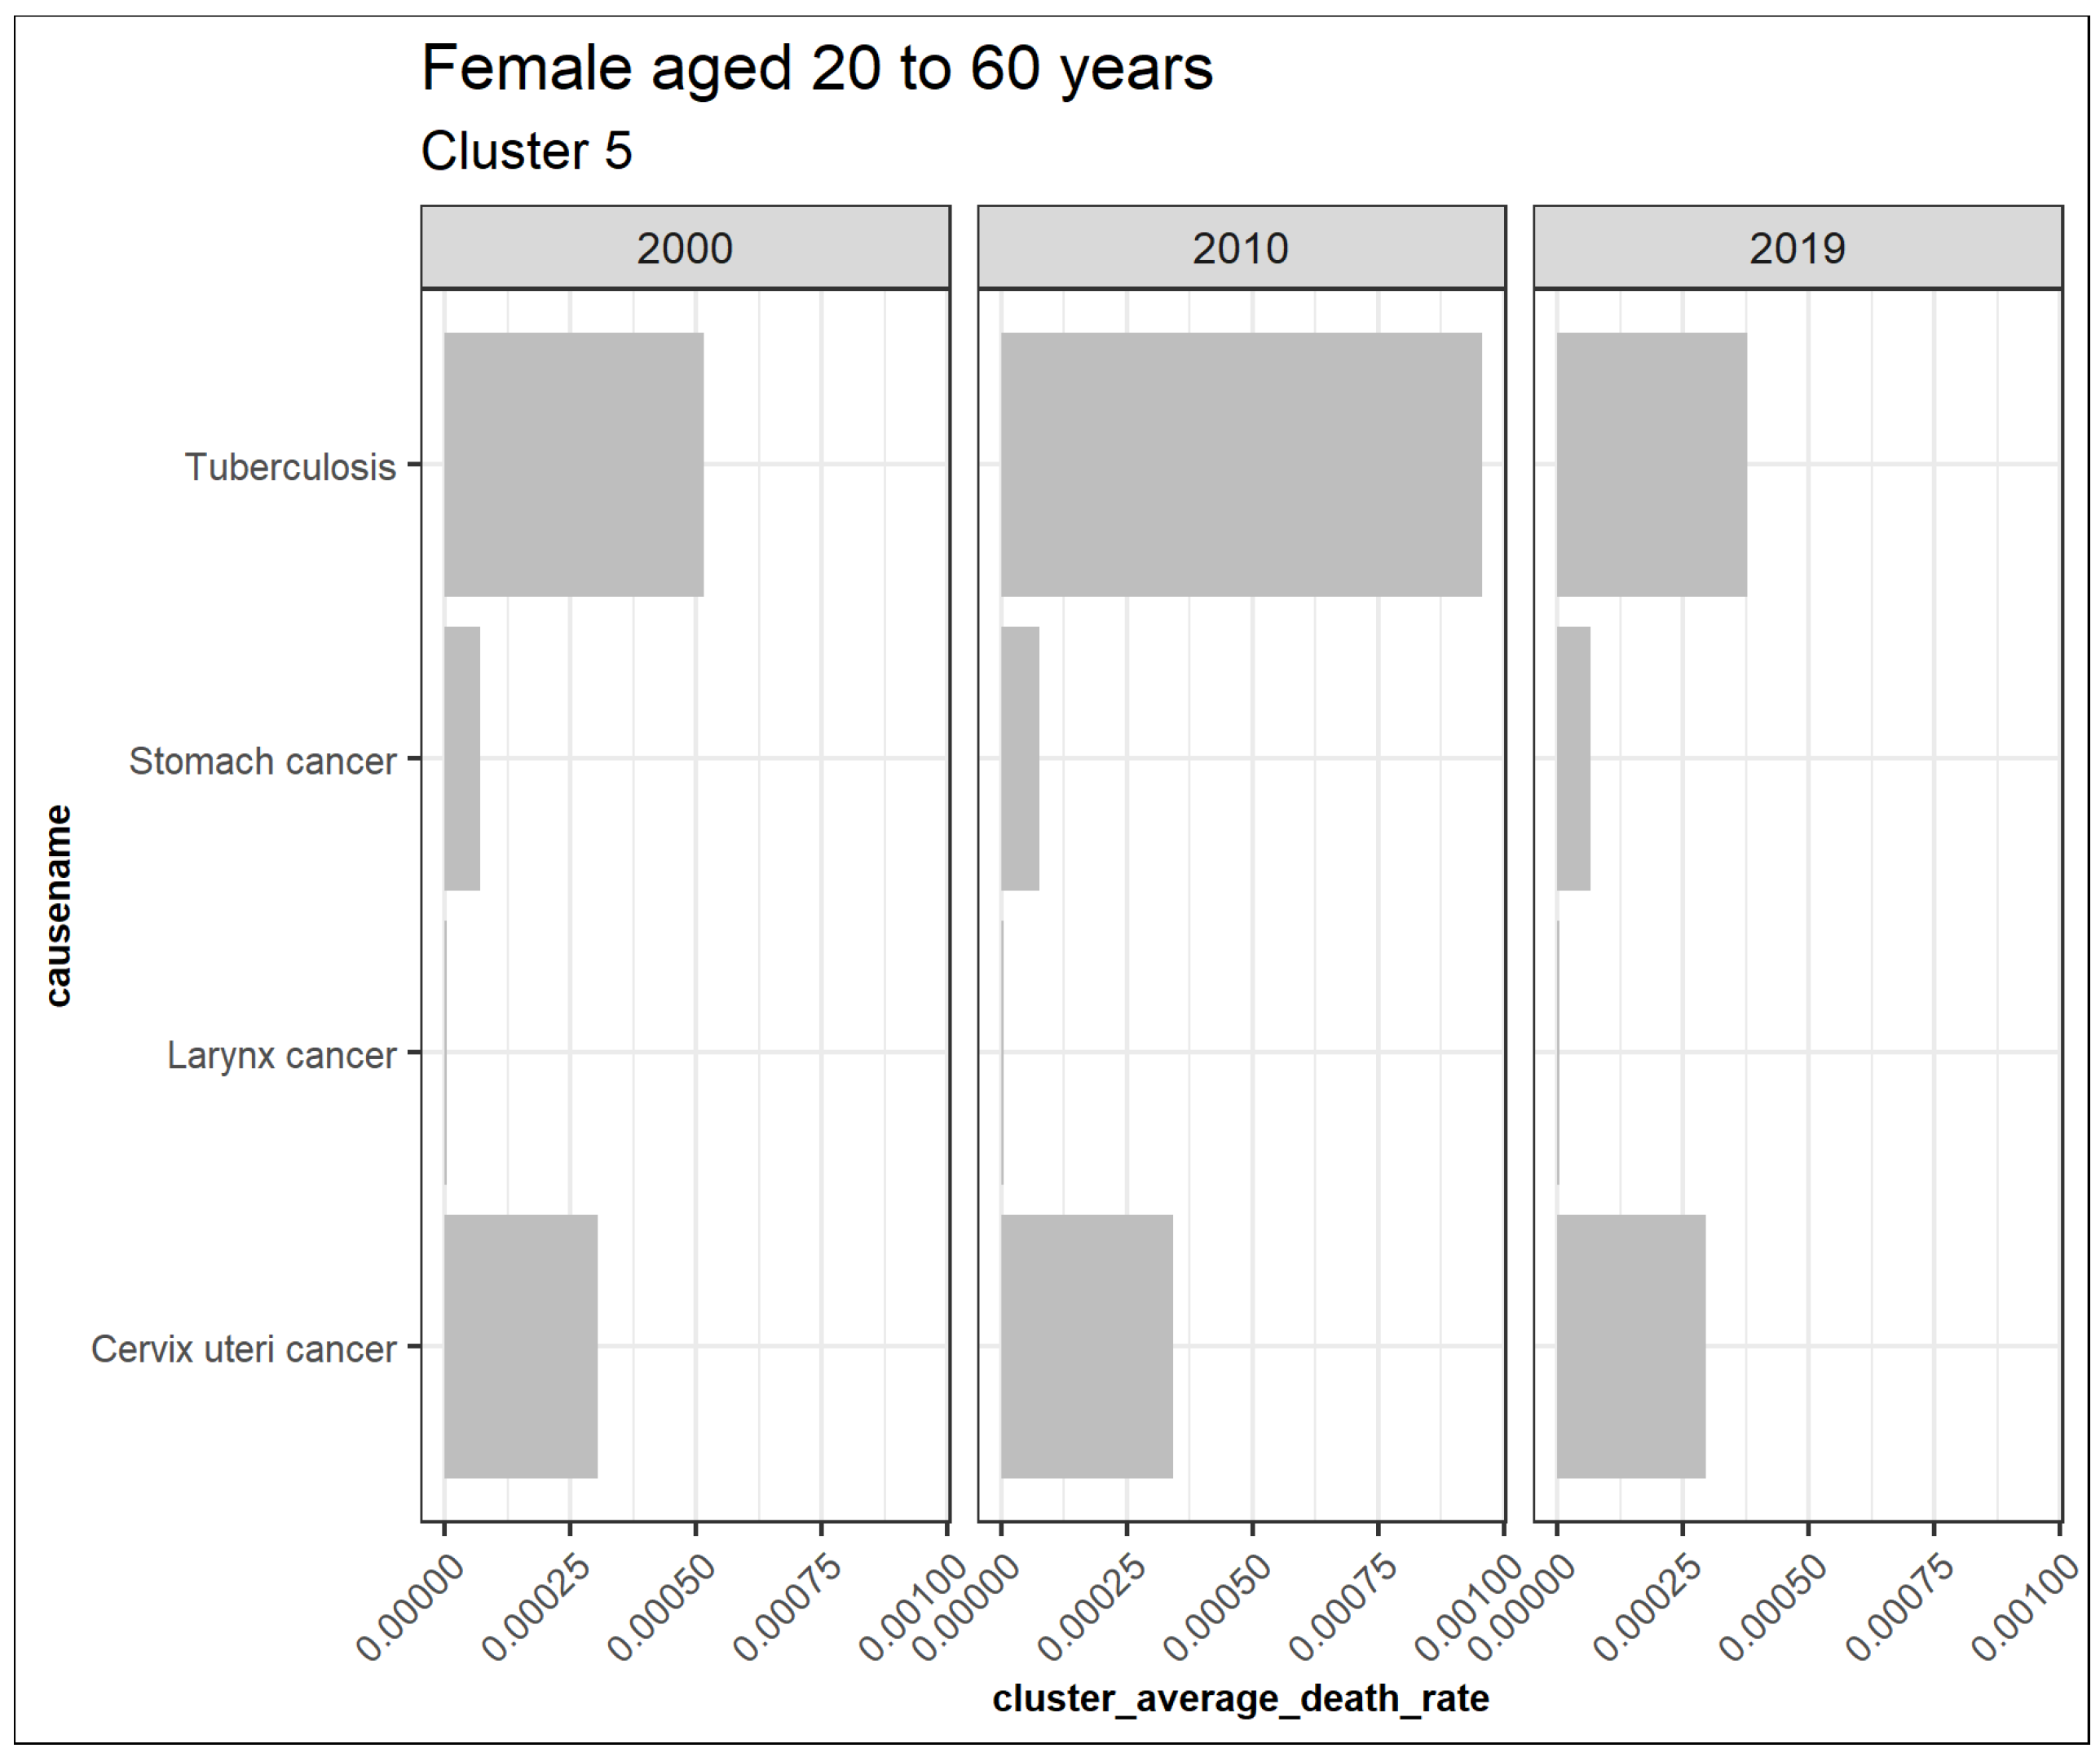
| 1 | Acute hepatitis A, Acute hepatitis C, Appendicitis, Asthma, Chlamydia, Chronic obstructive pulmonary disease, Cirrhosis of the liver, Congenital anomalies, Cysticercosis, Diarrheal diseases, Exposure to mechanical forces, Gastritis and duodenitis, Gonorrhea, Gynecological diseases, HIV AIDS, Meningitis, Otitis media, Peptic ulcer disease, Protein energy malnutrition, Rabies, Rheumatic heart disease, Schistosomiasis, Self-harm, Stroke, Syphilis, Tetanus, Tuberculosis, Upper respiratory infections, and Yellow fever |
| 2 | Acute hepatitis B, Acute hepatitis E, Alcohol-use disorders, Alzheimer disease and other dementias, Bladder cancer, Brain and nervous system cancers, Breast cancer, Cardiomyopathy myocarditis endocarditis, Cervix uteri cancer, Colon and rectum cancers, Corpus uteri cancer, Diabetes mellitus, Drug use disorders, Encephalitis, Epilepsy, Falls, Fire heat and hot substances, Gallbladder and biliary diseases, Gallbladder and biliary tract cancer, Hypertensive heart disease, Inflammatory bowel disease, Interpersonal violence, Ischemic heart disease, Kidney cancer, Kidney diseases, Larynx cancer, Leishmaniasis, Leukemia, Liver cancer, Lower respiratory infections, Lymphomas multiple myeloma, Melanoma and other skin cancers, Mouth and oropharynx cancers, Multiple sclerosis, Esophagus cancer, Ovary cancer, Pancreas cancer, Pancreatitis, Paralytic ileus and intestinal obstruction, Parkinson disease, Rheumatoid arthritis, Road injury, Sickle cell disorders and trait, Skin diseases, Stomach cancer, Thyroid cancer, Trachea bronchus lung cancers, and Urolithiasis |
| 3 | African trypanosomiasis |
| 4 | Anxiety disorders, Autism and Asperger syndrome, Back and neck pain, Benign prostatic hyperplasia, Bipolar disorder, Cataracts, Chagas disease, Childhood behavioral disorders, Dengue, Depressive disorders, Diphtheri, Eating disorders, Food borne trematodes, Genital herpes, Glaucoma, Gout, Hookworm disease, Idiopathic intellectual disability, Infertility, Iodine deficiency, Iron deficiency anemia, Leprosy, Lymphatic filariasis, Macular degeneration, Maternal conditions, Measles, Mesothelioma, Migraine, Neonatal conditions, Non migraine headache, Onchocerciasis, Oral conditions, Osteoarthritis, Other hearing loss, Other vision loss, Prostate cancer, Schizophrenia, Sudden infant death syndrome, Testicular cancer, Thalassemias, Trachoma, Trichomoniasis, Trichuriasis, Uncorrected refractive errors, Vitamin A deficiency, and Whooping cough |
| 5 | Ascariasis |
| 6 | Collective violence and legal intervention |
| 7 | Drowning |
| 8 | Echinococcosis |
| 9 | Malaria |
| 10 | Natural disasters |
| 11 | Poisonings |
| Cluster | Cause (Females Age 20 to 60) |
|---|---|
| 1 | Acute hepatitis A, Acute hepatitis B, Acute hepatitis C, Acute hepatitis E, Alcohol-use disorders, Alzheimer disease and other dementias, Appendicitis, Ascariasis, Asthma, Cardiomyopathy myocarditis endocarditis, Chlamydia, and Chronic obstructive pulmonary disease Cirrhosis of the liver, Congenital anomalies, Cysticercosis, Diabetes mellitus, Diarrheal diseases, Diphtheria, Drowning, Encephalitis, Epilepsy, Exposure to mechanical forces, Falls, Fire heat and hot substances, Gallbladder and biliary diseases, Gastritis and duodenitis, Gonorrhea, Gynecological diseases, HIV AIDS, Hypertensive heart disease, Inflammatory bowel disease, Ischemic heart disease, Kidney diseases, Lower respiratory infections, Maternal conditions, Meningitis, Multiple sclerosis, Otitis media, Pancreatitis, Paralytic ileus and intestinal obstruction, Parkinson disease, Peptic ulcer disease, Poisonings, Protein energy malnutrition, Rabies, Rheumatic heart disease, Rheumatoid arthritis, Road injury, Schistosomiasis, Self-harm, Sickle cell disorders and trait, Skin diseases, Stroke, Syphilis, Tetanus, Upper respiratory infections, Urolithiasis, Whooping cough, and Yellow fever |
| 2 | African trypanosomiasis |
| 3 | Anxiety disorders, Autism and Asperger syndrome, Back and neck pain, Benign prostatic hyperplasia, Bipolar disorder, Cataracts, Chagas disease, Childhood behavioral disorders, Dengue, Depressive disorders, Food borne trematodes, Genital herpes, Glaucoma, Gout, Hookworm disease, Idiopathic intellectual disability, Infertility, Iodine deficiency, Iron deficiency anaemia, Leprosy, Lymphatic filariasis, Macular degeneration, Migraine, Neonatal conditions, Non migraine headache, Onchocerciasis, Oral conditions, Osteoarthritis, Other hearing loss, Other vision loss, Prostate cancer, Schizophrenia, Sudden infant death syndrome, Testicular cancer, Thalassemias, Trachoma, Trichomoniasis, Trichuriasis, Uncorrected refractive errors, and Vitamin A deficiency |
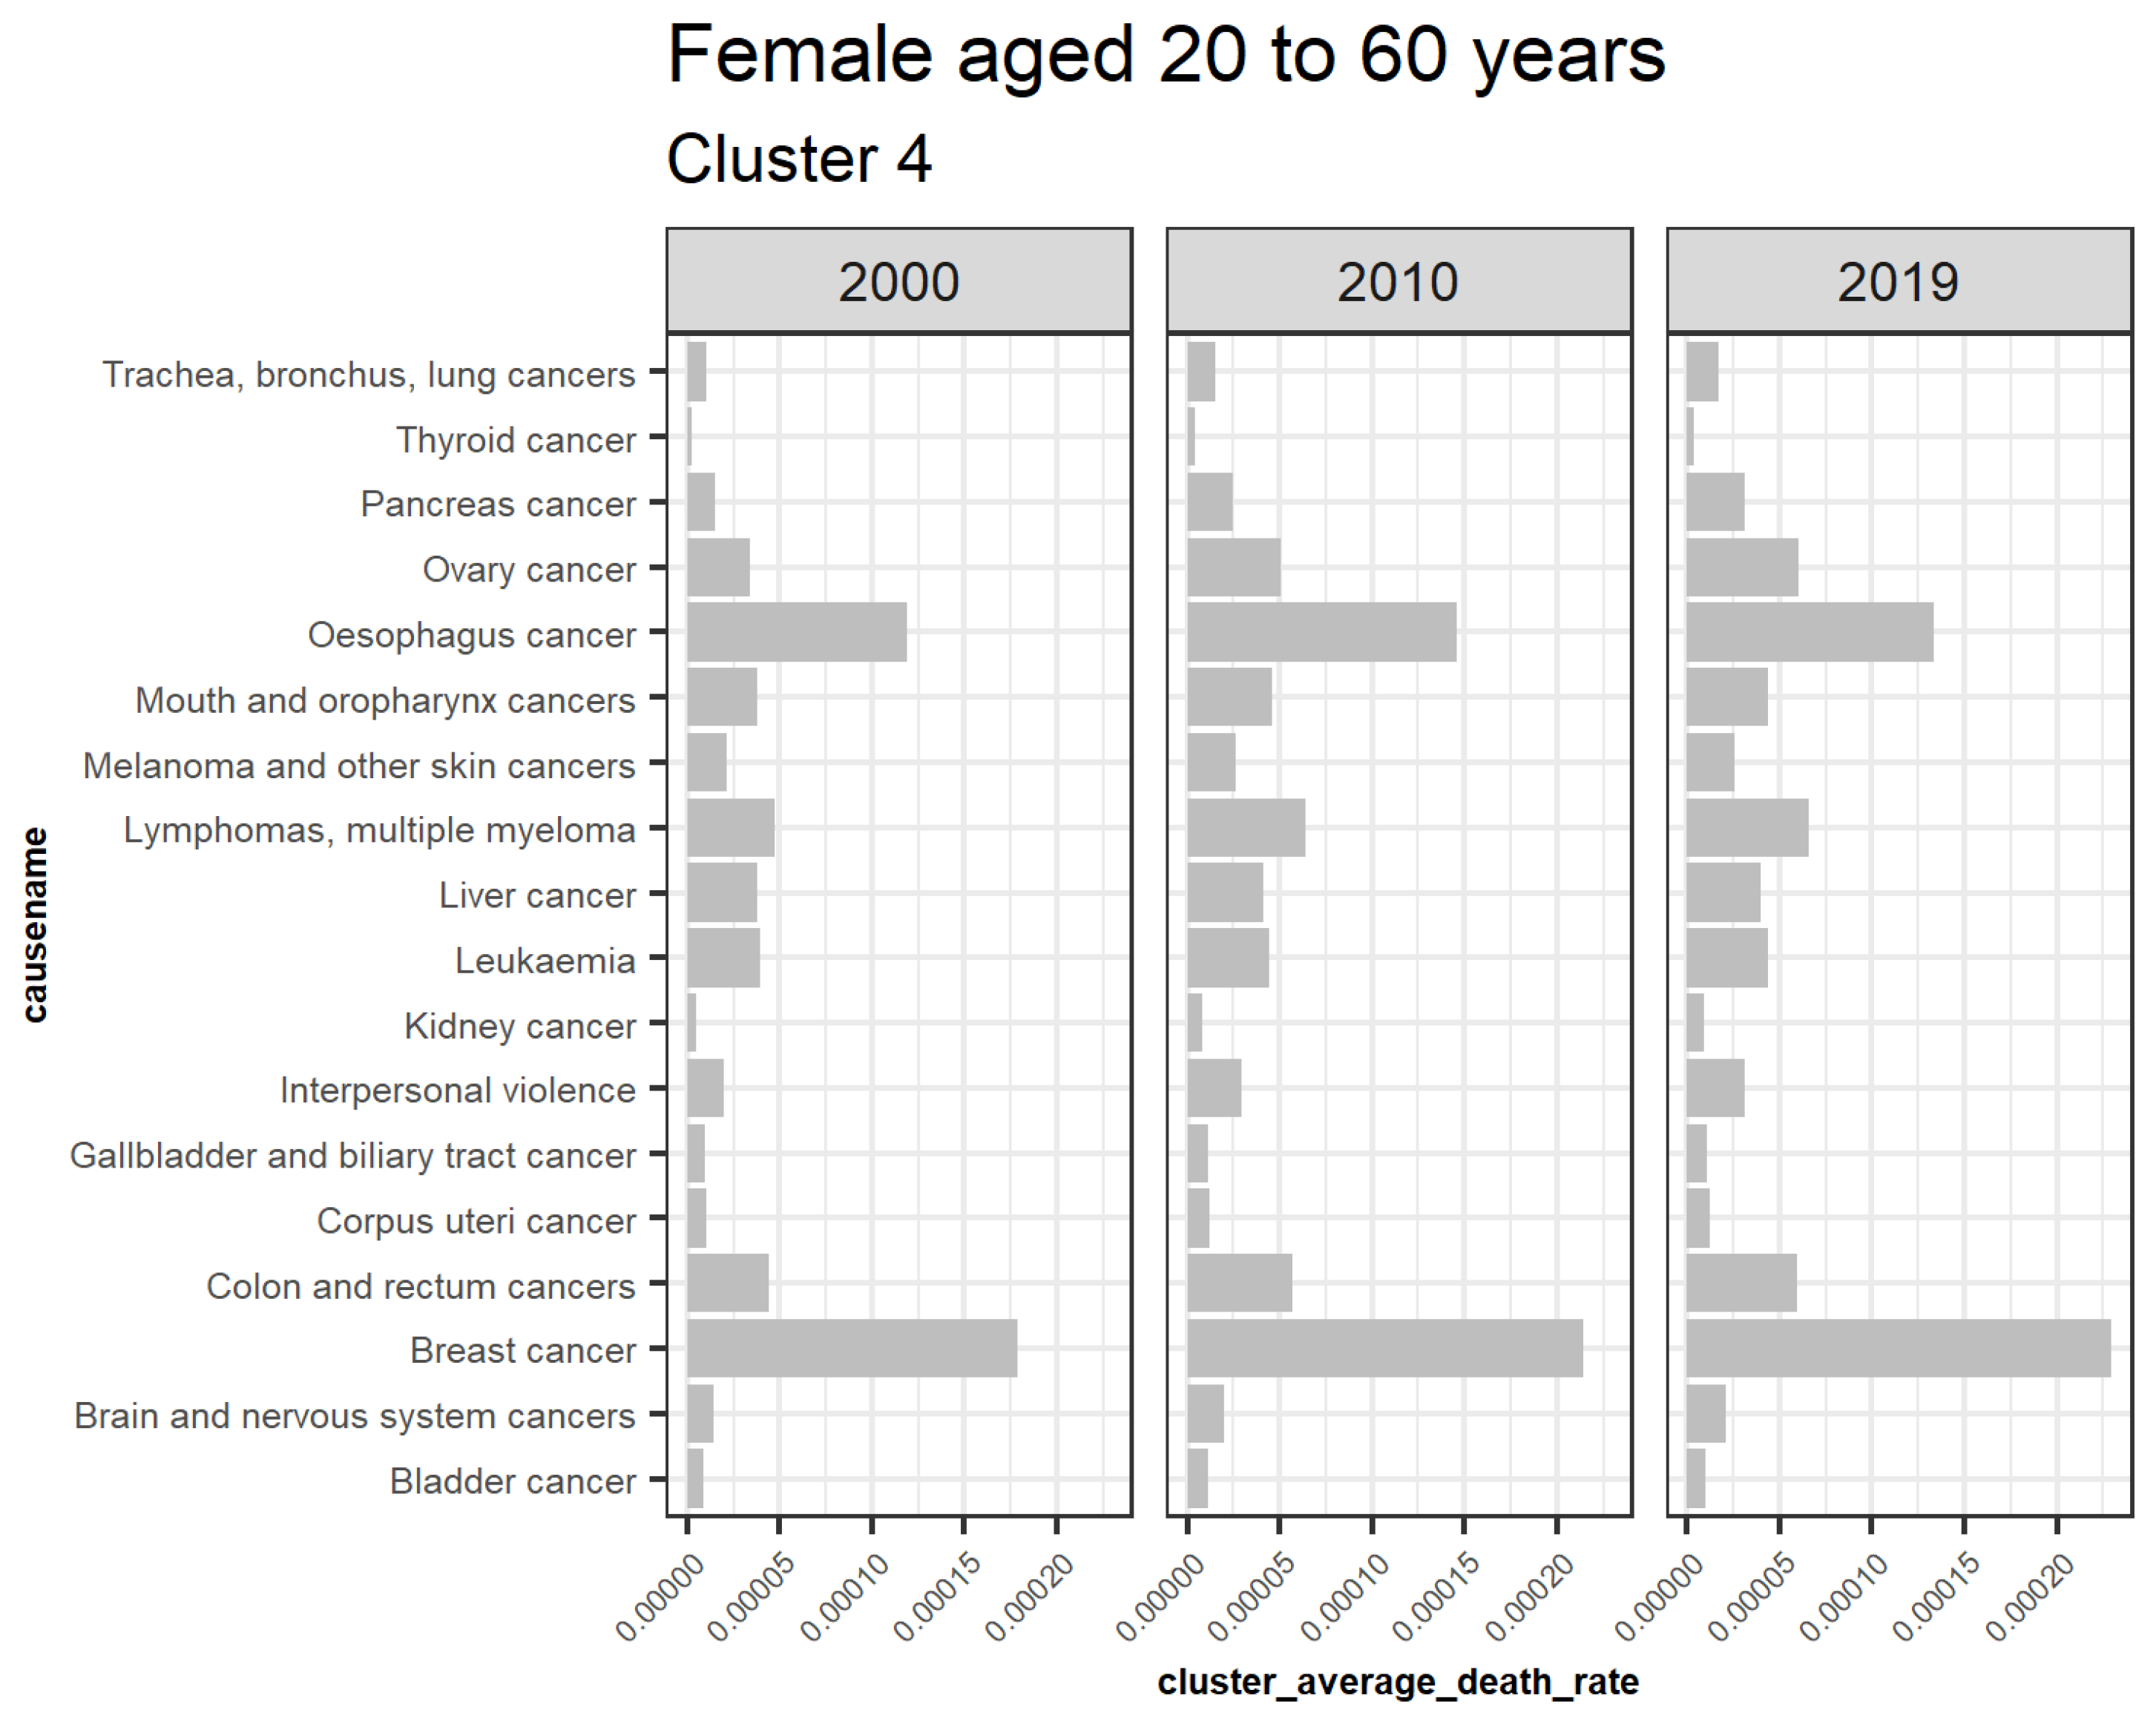
| 4 | Bladder cancer, Brain and nervous system cancers, Breast cancer, Colon and rectum cancers, Corpus uteri cancer, Gallbladder and biliary tract cancer, Interpersonal violence, Kidney cancer, Leukemia, Liver cancer, Lymphomas multiple myeloma, Melanoma and other skin cancers, Mouth and oropharynx cancers, Esophagus cancer, Ovary cancer, Pancreas cancer, Thyroid cancer, and Trachea bronchus lung cancers |
| 5 | Cervix uteri cancer, Larynx cancer, Stomach cancer, and Tuberculosis |
| 6 | Collective violence and legal intervention |
| 7 | Drug-use disorders |
| 8 | Eating disorders |
| 9 | Echinococcosis |
| 10 | Leishmaniasis |
| 11 | Malaria |
| 12 | Measles |
| 13 | Mesothelioma |
| 14 | Natural disasters |
References
- Aach, John, and George M. Church. 2001. Aligning Gene Expression Time Series with Time Warping Algorithms. Bioinformatics 17: 495–508. [Google Scholar] [CrossRef] [PubMed] [Green Version]
- Aggarwal, Charu C., Alexander Hinneburg, and Daniel A. Keim. 2001. On the Surprising Behavior of Distance Metrics in High Dimensional Space. In International Conference on Database Theory. Berlin: Springer, pp. 420–34. [Google Scholar]
- Aghabozorgi, Saeed, Ali Seyed Shirkhorshidi, and Teh Ying Wah. 2015. Time-Series Clustering—A Decade Review. Information Systems 53: 16–38. [Google Scholar] [CrossRef]
- Alai, Daniel H., Séverine Arnold (-Gaille), and Michael Sherris. 2015. Modelling Cause-of-Death Mortality and the Impact of Cause-Elimination. Annals of Actuarial Science 9: 167–86. [Google Scholar] [CrossRef]
- Aparicio, Hugo J., Jayandra J. Himali, Claudia L. Satizabal, Matthew P. Pase, Jose R. Romero, Carlos S. Kase, Alexa S. Beiser, and Sudha Seshadri. 2019. Temporal Trends in Ischemic Stroke Incidence in Younger Adults in the Framingham Study. Stroke 50: 1558–60. [Google Scholar] [CrossRef]
- Arbelaitz, Olatz, Ibai Gurrutxaga, Javier Muguerza, Jesus M. Perez, and Inigo Perona. 2013. An Extensive Comparative Study of Cluster Validity Indices. In Pattern Recongnition. Amsterdam: Elsevier. [Google Scholar]
- Arnold, Séverine, and Viktoriya Glushko. 2021. Cause-Specific Mortality Rates: Common Trends and Differences. Insurance: Mathematics and Economics 99: 294–308. [Google Scholar] [CrossRef]
- Arnold, Séverine, and Michael Sherris. 2013. Forecasting Mortality Trends Allowing for Cause-of-Death Mortality Dependence. North American Actuarial Journal 17: 273–82. [Google Scholar] [CrossRef]
- Arnold, Séverine, and Michael Sherris. 2015. Causes-of-Death Mortality: What Do We Know on Their Dependence? North American Actuarial Journal 19: 116–28. [Google Scholar] [CrossRef]
- Ashley, Thomas, Brian Ivanovic, and David N. Wylde. 2019. Recent Trends in Mortality by Cause of Death. Paper presented at 2019 Underwriting Issues & Innovation Seminar, Rosemont, IL, USA, July 28. [Google Scholar]
- Bartkowiak, Marcin, Katarzyna Kaczmarek-Majer, Aleksandra Rutkowska, and Olgierd Hryniewicz. 2018. Model Averaging Approach to Forecasting the General Level of Mortality. Paper presented at International Conference on Information Processing and Management of Uncertainty in Knowledge-Based Systems, Cdiz, Spain, June 11–15; pp. 453–64. [Google Scholar]
- Booth, Heather, and Leonie Tickle. 2008. Mortality Modelling and Forecasting: A Review of Methods. Annals of Actuarial Science 3: 3–43. [Google Scholar] [CrossRef]
- Brouhns, Natacha, Michel Denuit, and Jeroen K. Vermunt. 2002. Measuring the Longevity Risk in Mortality Projections. Bulletin of the Swiss Association of Actuaries 2: 105–30. [Google Scholar]
- Caselli, Graziella, Jacques Vallin, and Marco Marsili. 2019. How Useful Are the Causes of Death When Extrapolating Mortality Trends. An Update. In Old and New Perspectives on Mortality Forecasting. Berlin/Heidelberg: Springer, pp. 237–59. [Google Scholar]
- Cassisi, Carmelo, Placido Montalto, Marco Aliotta, Andrea Cannata, and Alfredo Pulvirenti. 2012. Similarity Measures and Dimensionality Reduction Techniques for Time Series Data Mining. Advances in Data Mining Knowledge Discovery and Applications 2012: 71–96. [Google Scholar]
- Charrad, Malika, Nadia Ghazzali, Véronique Boiteau, and Azam Niknafs. 2019. NbClust Package. An Examination of Indices for Determining the Number of Clusters. Available online: https://hal.archives-ouvertes.fr/hal-01126138 (accessed on 4 January 2022).
- Chiang, Chin Long. 1968. The Life Table and Its Construction. In Introduction to Stochastic Processes in Biostatistics. New York: Wiley, & Sons, Inc., pp. 198–214. [Google Scholar]
- Cox, Peter R. 1976. Demography. London: Cambridge University Press. [Google Scholar]
- Dickson, David C. M., Mary R. Hardy, and Howard R. Waters. 2019. Actuarial Mathematics for Life Contingent Risks. Cambridge: Cambridge University Press. [Google Scholar]
- Foreman, Kyle J., Rafael Lozano, Alan D. Lopez, and Christopher J. L. Murray. 2012. Modeling Causes of Death: An Integrated Approach Using CODEm. Population Health Metrics 10: 1–23. [Google Scholar] [CrossRef] [PubMed] [Green Version]
- Gaille, Séverine, and Michael Sherris. 2011. Modelling Mortality with Common Stochastic Long-Run Trends. The Geneva Papers on Risk and Insurance-Issues and Practice 36: 595–621. [Google Scholar] [CrossRef] [Green Version]
- Gan, Guojun, and Jimmy Xiangji Huang. 2017. A Data Mining Framework for Valuing Large Portfolios of Variable Annuities. Paper presented at 23rd ACM SIGKDD International Conference on Knowledge Discovery and Data Mining, Halifax, NS, Canada, August 13–17. [Google Scholar]
- Gan, Guojun, and Emiliano A. Valdez. 2016. An Empirical Comparison of Some Experimental Designs for the Valuation of Large Variable Annuity Portfolios. Dependence Modeling 4: 382–400. [Google Scholar] [CrossRef]
- Gan, Guojun, and Emiliano A. Valdez. 2020. Data Clustering with Actuarial Applications. North American Actuarial Journal 24: 168–86. [Google Scholar] [CrossRef]
- Gan, Guojun, Chaoqun Ma, and Jianhong Wu. 2007. Data Clustering: Theory, Algorithms, and Applications. Philadelphia: Society for Industrial and Applied Mathematics, p. 20. [Google Scholar]
- Guijo-Rubio, David, Antonio Manuel Durán-Rosal, Pedro Antonio Gutiérrez, Alicia Troncoso, and César Hervás-Martínez. 2020. Time-Series Clustering Based on the Characterization of Segment Typologies. IEEE Transactions on Cybernetics 51: 5409–22. [Google Scholar] [CrossRef]
- Hamdi, Yosr, Ines Abdeljaoued-Tej, Afzal Ali Zatchi, Sonia Abdelhak, Samir Boubaker, Joel S. Brown, and Alia Benkahla. 2021. Cancer in Africa: The Untold Story. Frontiers in Oncology 11: 650117. [Google Scholar] [CrossRef]
- Han, Jiawei, Micheline Kamber, and Jian Pei. 2011. Data Mining: Concepts and Techniques, 3rd ed. The Morgan Kaufmann Series in Data Management Systems; Oxford: Morgan Kaufmann. [Google Scholar]
- Holman, R. Jerome, and Cynthia S. MacDonald. 2021. U.S. Population Mortality Observations Updated with 2019 Experience; Society of Actuaries. Available online: https://www.soa.org/resources/research-reports/2021/us-population-mortality/ (accessed on 24 December 2021).
- Insurance Regulatory Authority. 2017. The Insurance Act. Available online: https://www.ira.go.ke/images/docs/2020/THE-INSURANCE-ACT-REVISED-2020.pdf (accessed on 4 January 2022).
- Janssen, Fanny. 2018. Advances in Mortality Forecasting: Introduction. Genus 74: 21. [Google Scholar] [CrossRef] [Green Version]
- Kaishev, Vladimir K., Dimitrina S. Dimitrova, and Steven Haberman. 2007. Modelling the Joint Distribution of Competing Risks Survival Times Using Copula Functions. Insurance: Mathematics and Economics 41: 339–61. [Google Scholar] [CrossRef]
- Kwon, Hyuk-Sung, and Vu Hai Nguyen. 2019. Analysis of Cause-of-Death Mortality and Actuarial Implications. Communications for Statistical Applications and Methods 26: 557–73. [Google Scholar] [CrossRef]
- Lamb, David, Joni Downs, and Steven Reader. 2020. Space-Time Hierarchical Clustering for Identifying Clusters in Spatiotemporal Point Data. ISPRS International Journal of Geo-Information 9: 85. [Google Scholar] [CrossRef] [Green Version]
- Lance, Godfrey N., and William Thomas Williams. 1967. A General Theory of Classificatory Sorting Strategies: 1. Hierarchical Systems. The Computer Journal 9: 373–80. [Google Scholar] [CrossRef] [Green Version]
- Lawson, Richard G., and Peter C. Jurs. 1990. New Index for Clustering Tendency and Its Application to Chemical Problems. Journal of Chemical Information and Computer Sciences 30: 36–41. [Google Scholar] [CrossRef]
- Lee, Seulbi, Jaehoon Kim, Jongyeon Hwang, Eunji Lee, Kyoung-Jin Lee, Jeongkyu Oh, Jungsu Park, and Tae-Young Heo. 2020. Clustering of Time Series Water Quality Data Using Dynamic Time Warping: A Case Study from the Bukhan River Water Quality Monitoring Network. Water 12: 2411. [Google Scholar] [CrossRef]
- Li, Hong, and Yang Lu. 2018. Modeling Cause-of-Death Mortality Using Hierarchical Archimedean Copula. Scandinavian Actuarial Journal 2019: 1–26. [Google Scholar] [CrossRef]
- Li, Han, Hong Li, Yang Lu, and Anastasios Panagiotelis. 2019. A Forecast Reconciliation Approach to Cause-of-Death Mortality Modeling. Insurance: Mathematics and Economics 86: 122–33. [Google Scholar] [CrossRef]
- Mahase, Elisabeth. 2019. Cancer Overtakes CVD to Become Leading Cause of Death in High Income Countries. BMJ: British Medical Journal 366. [Google Scholar] [CrossRef]
- McNown, Robert, and Andrei Rogers. 1992. Forecasting Cause-Specific Mortality Using Time Series Methods. International Journal of Forecasting 8: 413–32. [Google Scholar] [CrossRef]
- Medicare Centers for Medicaid Services and National Center for Health Statistics. 2019. ICD-10-CM Official Guidelines for Coding and Reporting. FY 2018. Available online: https://www.cms.gov/Medicare/Coding/ICD10/Downloads/2019-ICD10-Coding-Guidelines-.pdf (accessed on 4 January 2022).
- Meyer, Hermann, Rosina Ehmann, and Geoffrey L. Smith. 2020. Smallpox in the Post-Eradication Era. Viruses 12: 138. [Google Scholar] [CrossRef] [PubMed] [Green Version]
- Montero, Pablo, and José A. Vilar. 2015. TSclust: An R Package for Time Series Clustering. Journal of Statistical Software 62: 1–43. [Google Scholar]
- O’Hagan, Adrian, and Colm Ferrari. 2017. Model-Based and Nonparametric Approaches to Clustering for Data Compression in Actuarial Applications. North American Actuarial Journal 21: 107–46. [Google Scholar] [CrossRef]
- Olshansky, S. Jay, Leonard Hayflick, and Bruce A. Carnes. 2002. Position Statement on Human Aging. The Journals of Gerontology Series A: Biological Sciences and Medical Sciences 57: B292–B297. [Google Scholar] [CrossRef] [PubMed] [Green Version]
- Delgermaa, Vanya, Ken Takahashi, Eun-Kee Park, Giang Vinh Le, Toshiyuki Hara, and Tom Sorahan. 2011. Global mesothelioma deaths reported to the World Health Organization between 1994 and 2008. Bulletin of the World Health Organization 89: 716–24. [Google Scholar] [CrossRef]
- Petitjean, François, Alain Ketterlin, and Pierre Gançarski. 2011. A Global Averaging Method for Dynamic Time Warping, with Applications to Clustering. Pattern Recognition 44: 678–93. [Google Scholar] [CrossRef]
- Raftery, Adrian E., Jennifer L. Chunn, Patrick Gerland, and Hana Ševčíková. 2013. Bayesian Probabilistic Projections of Life Expectancy for All Countries. Demography 50: 777–801. [Google Scholar] [CrossRef] [Green Version]
- Richman, Ronald. 2018. AI in Actuarial Science. Available online: https://ssrn.com/abstract=3218082 (accessed on 4 January 2022). [CrossRef]
- Robertson, Tony, G. David Batty, Geoff Der, Candida Fenton, Paul G. Shiels, and Michaela Benzeval. 2013. Is Socioeconomic Status Associated with Biological Aging as Measured by Telomere Length? Epidemiologic Reviews 35: 98–111. [Google Scholar] [CrossRef] [PubMed]
- Roser, Max, Esteban Ortiz-Ospina, and Hannah Ritchie. 2013. Life Expectancy. Our World in Data. Available online: https://ourworldindata.org/life-expectancy (accessed on 4 January 2022).
- Roth, Gregory A., Mark D. Huffman, Andrew E. Moran, Valery Feigin, George A. Mensah, Mohsen Naghavi, and Christopher J. L. Murray. 2015. Global and Regional Patterns in Cardiovascular Mortality from 1990 to 2013. Circulation 132: 1667–78. [Google Scholar] [CrossRef] [PubMed] [Green Version]
- Saitta, Sandro, Benny Raphael, and Ian F. C. Smith. 2007. A Bounded Index for Cluster Validity. In International Workshop on Machine Learning and Data Mining in Pattern Recognition. Berlin: Springer, pp. 174–87. [Google Scholar]
- Sakoe, Hiroaki. 1971. Dynamic-Programming Approach to Continuous Speech Recognition. Paper presented at 7th International Congress on Acoustics, Budapest, Hungary, August 18–26. [Google Scholar]
- Sard, Alexis. 2019. Comparing Time-Series Clustering Algorithms in R Using the Dtwclust Package. pp. 1–45. Available online: https://www.semanticscholar.org/paper/Comparing-Time-Series-Clustering-Algorithms-in-R-Sarda-Espinosa/a46ec863bbf3e179de4e7ccedd205a96ab1ca64f#extracted (accessed on 4 January 2022).
- Sawe, Rispah T., Maggie Kerper, Sunil Badve, Jun Li, Mayra Sandoval-Cooper, Jingmeng Xie, Zonggao Shi, Kirtika Patel, David Chumba, Ayub Ofulla, and et al. 2016. Aggressive breast cancer in western Kenya has early onset, high proliferation, and immune cell infiltration. BMC Cancer 16: 1–15. [Google Scholar] [CrossRef] [PubMed] [Green Version]
- Shaylika, Chauhan. 2020. Comprehensive Review of Coronavirus Disease 2019 (COVID-19). Biomedical Journal 43: 334–40. [Google Scholar]
- Soheily-Khah, Saeid, Ahlame Douzal Chouakria, and Eric Gaussier. 2015. Progressive and Iterative Approaches for Time Series Averaging. Paper presented at 1st International Conference on Advanced Analytics and Learning on Temporal Data, Porto, Portugal, September 11; pp. 111–17. [Google Scholar]
- Tabeau, Ewa, Peter Ekamper, Corina Huisman, and Alinda Bosch. 1999. Improving Overall Mortality Forecasts by Analysing Cause-of-Death, Period and Cohort Effects in Trends. European Journal of Population/Revue Européenne de Démographie 15: 153–83. [Google Scholar] [CrossRef]
- Tsinaslanidis, Prodromos, Antonis Alexandridis, Achilleas Zapranis, and Efstratios Livanis. 2014. Dynamic Time Warping as a Similarity Measure: Applications in Finance. Paper presented at Hellenic Finance and Accounting Association, Volos, Greece, December 12–13. [Google Scholar]
- United Nations and Social Affairs. 2017. World Population Prospects: The 2017 Revision Data Booklet (ST/ESA/SER. A/401). Available online: https://www.un.org/development/desa/publications/world-population-prospects-the-2017-revision.html (accessed on 5 January 2022).
- Wang, Weina, and Yunjie Zhang. 2007. On Fuzzy Cluster Validity Indices. Fuzzy Sets and Systems 158: 2095–117. [Google Scholar] [CrossRef]
- Wang, Xiaoyue, Abdullah Mueen, Hui Ding, Goce Trajcevski, Peter Scheuermann, and Eamonn Keogh. 2013. Experimental Comparison of Representation Methods and Distance Measures for Time Series Data. Data Mining and Knowledge Discovery 26: 275–309. [Google Scholar] [CrossRef] [Green Version]
- WHO. 2020. WHO Methods and Data Sources for Country-Level Causes of Death 2000–19. Global Health Estimates Technical Paper WHO/DDI/DNA/GHE/2020.2. Geneva: World Health Organization, Available online: https://www.who.int/data/gho/data/themes/mortality-and-global-health-estimates/ghe-leading-causes-of-death (accessed on 4 January 2022).
- Yao, Ji. 2016. Clustering in General Insurance Pricing. In Predictive Modeling Applications in Actuarial Science. Edited by Edward W. Frees, Glenn Meyers and Richard A. Derrig. Cambridge: Cambridge University Press, pp. 159–79. [Google Scholar]
- Zhao, Jiaping, and Laurent Itti. 2018. Shapedtw: Shape Dynamic Time Warping. Pattern Recognition 74: 171–84. [Google Scholar] [CrossRef] [Green Version]


| Distance Criteria | Description | Reference |
|---|---|---|
| norm) | (Aggarwal et al. 2001) | |
| norm) | (Aggarwal et al. 2001) | |
| DTW | (Aghabozorgi et al. 2015; Sard 2019; Zhao and Itti 2018; Sakoe 1971) |
| Linkage Criteria | Equation | Reference |
|---|---|---|
| Single | Minimum pair distance between points in cluster i and j | |
| Average (UPGMA) | Average pair distance between points in cluster i and j | |
| Complete | Maximum pair distance between points in clusters i and j | |
| Centroid (UPGMC) | Pair distance between cluster centroid i (mean vector of length p features) and cluster centroid j | |
| Median (WPGMC) | Euclidean distance between weighted centroids of the two clusters | |
| Mcquitty (WPGMA) | Weighted mean of the between-cluster dissimilarities between the points in cluster i and j |
| Index | Description | Objective Criteria |
|---|---|---|
| Silhouette (Sil) | , | Maximum |
| Dunn (D) | Maximum | |
| COP | Minimum | |
| Calinski-Harabasz (CH) | Maximum | |
| Davies-Bouldin (DB) | Minimum | |
| Modified Davies-Bouldin (DB*) | Minimum | |
| Score Function (SF) | where & | Maximum |
| Gender and Age | Hopkins Statistic |
|---|---|
| Male aged 20 years to 60 years | 0.9521319 |
| Male aged over 60 years | 0.9597553 |
| Female aged 20 years to 60 years | 0.9661622 |
| Female aged over 60 years | 0.9727848 |
| Age Partition | Centroid Extraction |
|---|---|
| Males | |
| 20 ≤ x < 60 | 10 |
| x ≥ 60 | 6 |
| Females | |
| 20 ≤ x < 60 | 14 |
| x ≥ 60 | 11 |
| Clusters | CH | COP | D | DB | DBstar | SF | Sil | Rank |
|---|---|---|---|---|---|---|---|---|
| 10 | 29.44639 | 0.11639 | 0.232254 | 0.341024 | 0.505107 | 1.8 × 10⁻⁵ | 0.617272 | 3 |
| 11 | 29.62869 | 0.111384 | 0.232254 | 0.33342 | 0.490175 | 2.6 × 10⁻⁵ | 0.620358 | 1 |
| 12 | 25.55996 | 0.107246 | 0.232254 | 0.334859 | 0.48636 | 3.0 × 10⁻⁵ | 0.613325 | 2 |
| 13 | 26.17275 | 0.1068 | 0.232254 | 0.35341 | 0.53423 | 2.7 × 10⁻⁵ | 0.578546 | 6 |
| 14 | 23.59811 | 0.091103 | 0.240698 | 0.414231 | 0.50472 | 3.0 × 10⁻⁷ | 0.58151 | 9 |
| 15 | 23.54658 | 0.083028 | 0.26351 | 0.471052 | 0.521689 | 5.3 × 10⁻⁹ | 0.6016 | 10 |
| 2 | 111.2881 | 0.235012 | 0.171448 | 0.950741 | 0.950741 | 9.5 × 10⁻⁵ | 0.579936 | 13 |
| 3 | 67.6292 | 0.225413 | 0.1901 | 0.561149 | 0.574342 | 8.3 × 10⁻⁵ | 0.494053 | 12 |
| 4 | 38.85082 | 0.229005 | 0.1901 | 0.600825 | 0.610435 | 3.2 × 10⁻⁵ | 0.45468 | 14 |
| 5 | 35.32424 | 0.2118 | 0.1901 | 0.361477 | 0.440401 | 7.0 × 10⁻⁵ | 0.432569 | 7 |
| 6 | 29.89726 | 0.2041 | 0.212661 | 0.351287 | 0.440946 | 8.3 × 10⁻⁵ | 0.411587 | 5 |
| 7 | 24.10709 | 0.200178 | 0.212661 | 0.362019 | 0.448074 | 7.0 × 10⁻⁵ | 0.406142 | 11 |
| 8 | 35.31805 | 0.124642 | 0.232254 | 0.390179 | 0.51908 | 1.3 × 10⁻⁵ | 0.624278 | 4 |
| 9 | 30.08999 | 0.122617 | 0.232254 | 0.379862 | 0.535502 | 1.2 × 10⁻⁵ | 0.617032 | 8 |
| Clusters | CH | COP | D | DB | DBstar | SF | Sil | Rank |
|---|---|---|---|---|---|---|---|---|
| 10 | 23.03112202 | 0.176992601 | 0.301793526 | 0.453123272 | 0.626611534 | 1.0 × 10⁻⁵ | 0.480769677 | 7 |
| 11 | 20.66332201 | 0.176400898 | 0.301793526 | 0.537548358 | 0.72011021 | 1.4 × 10⁻⁷ | 0.489997742 | 14 |
| 12 | 17.79499587 | 0.171086725 | 0.301793526 | 0.487769359 | 0.683949639 | 1.4 × 10⁻⁵ | 0.483808735 | 11 |
| 13 | 26.24365828 | 0.156145699 | 0.363306552 | 0.439806196 | 0.670187773 | 4.0 × 10⁻⁷ | 0.518376075 | 2 |
| 14 | 20.62380578 | 0.147637517 | 0.363306552 | 0.432068468 | 0.645016557 | 1.8 × 10⁻⁶ | 0.504644184 | 1 |
| 15 | 20.75436142 | 0.144098812 | 0.326536521 | 0.448140897 | 0.648934575 | 1.5 × 10⁻⁶ | 0.465248088 | 4 |
| 2 | 114.5256387 | 0.337413364 | 0.312118689 | 0.801389578 | 0.801389578 | 5.2 × 10⁻⁵ | 0.496747633 | 9 |
| 3 | 58.42907753 | 0.348064594 | 0.312118689 | 0.528629753 | 0.611530795 | 2.5 × 10⁻⁵ | 0.351772891 | 3 |
| 4 | 27.97383786 | 0.299237587 | 0.312118689 | 0.592248656 | 0.619617138 | 1.8 × 10⁻⁵ | 0.314562125 | 10 |
| 5 | 40.80354807 | 0.211871067 | 0.312118689 | 0.591605495 | 0.692876715 | 3.8 × 10⁻⁶ | 0.567527201 | 6 |
| 6 | 39.30113349 | 0.194009708 | 0.312118689 | 0.708201159 | 0.855088578 | 2.3 × 10⁻⁸ | 0.576778735 | 13 |
| 7 | 34.14609145 | 0.187249741 | 0.312118689 | 0.568824721 | 0.665277285 | 5.5 × 10⁻⁸ | 0.556010119 | 8 |
| 8 | 29.25958277 | 0.181636074 | 0.270400505 | 0.529890711 | 0.665009974 | 7.5 × 10⁻⁸ | 0.536580308 | 11 |
| 9 | 32.26731808 | 0.183907178 | 0.270400505 | 0.437247903 | 0.663384937 | 1.2 × 10⁻⁵ | 0.526151517 | 4 |
| Clusters | CH | COP | D | DB | DBstar | SF | Sil | Rank |
|---|---|---|---|---|---|---|---|---|
| 10 | 24.99659434 | 0.123090442 | 0.182248041 | 0.655482395 | 0.798173272 | 4.2 × 10⁻⁹ | 0.591802123 | 9 |
| 11 | 27.34635291 | 0.118726105 | 0.182248041 | 0.61964455 | 0.764738128 | 6.8 × 10⁻⁹ | 0.585583308 | 3 |
| 12 | 27.88938198 | 0.101299096 | 0.25335064 | 0.76589228 | 0.961728169 | 9.9 × 10⁻¹² | 0.626175884 | 6 |
| 13 | 24.3911496 | 0.0980419 | 0.25335064 | 0.694189214 | 0.853283966 | 1.6 × 10⁻¹¹ | 0.596910016 | 9 |
| 14 | 24.48443327 | 0.096394885 | 0.25335064 | 0.66805504 | 0.90634624 | 1.4 × 10⁻¹¹ | 0.593231137 | 12 |
| 15 | 22.28606152 | 0.093863224 | 0.25335064 | 0.627373338 | 0.898826858 | 2.3 × 10⁻¹¹ | 0.590170622 | 11 |
| 2 | 59.74292696 | 0.396250575 | 0.123056136 | 0.883154977 | 0.883154977 | 2.0 × 10⁻⁵ | 0.471770673 | 14 |
| 3 | 45.59389522 | 0.374735197 | 0.123056136 | 0.580674345 | 0.666813972 | 3.6 × 10⁻⁵ | 0.332955657 | 4 |
| 4 | 24.63063128 | 0.285170151 | 0.123056136 | 0.595182936 | 0.715895755 | 1.7 × 10⁻⁵ | 0.255229931 | 13 |
| 5 | 26.77686722 | 0.274703824 | 0.123056136 | 0.508507562 | 0.613479317 | 2.3 × 10⁻⁵ | 0.219229328 | 5 |
| 6 | 32.62536615 | 0.200419606 | 0.182248041 | 0.587586059 | 0.648327692 | 3.1 × 10⁻⁷ | 0.485483154 | 1 |
| 7 | 25.35447125 | 0.182995324 | 0.182248041 | 0.626840469 | 0.727005256 | 4.9 × 10⁻⁷ | 0.473163122 | 6 |
| 8 | 25.56041713 | 0.180540144 | 0.182248041 | 0.536630486 | 0.666798427 | 5.5 × 10⁻⁷ | 0.457705734 | 2 |
| 9 | 28.39544452 | 0.128737317 | 0.182248041 | 0.777960456 | 0.866845765 | 2.6 × 10⁻⁹ | 0.605605777 | 6 |
| Clusters | CH | COP | D | DB | DBstar | SF | Sil | Rank |
|---|---|---|---|---|---|---|---|---|
| 10 | 23.37155949 | 0.155797 | 0.36972481 | 0.47549 | 0.58735429 | 1.5 × 10⁻⁷ | 0.568804 | 1 |
| 11 | 22.75250061 | 0.149873 | 0.27293163 | 0.50896 | 0.64024307 | 1.5 × 10⁻⁸ | 0.603456 | 6 |
| 12 | 23.13907169 | 0.141859 | 0.27293163 | 0.5322 | 0.6292448 | 2.3 × 10⁻¹⁰ | 0.576129 | 4 |
| 13 | 22.90632651 | 0.132435 | 0.27293163 | 0.46538 | 0.64787178 | 3.8 × 10⁻⁸ | 0.550531 | 5 |
| 14 | 22.96812575 | 0.102317 | 0.27293163 | 0.50069 | 0.63744017 | 1.8 × 10⁻¹⁰ | 0.577709 | 3 |
| 15 | 20.69612814 | 0.104242 | 0.27293163 | 0.53184 | 0.70119603 | 2.2 × 10⁻¹⁰ | 0.566868 | 9 |
| 2 | 64.59981838 | 0.758969 | 0.244642 | 0.49813 | 0.49812756 | 1.2 × 10⁻³ | 0.330671 | 2 |
| 3 | 34.00898982 | 0.51517 | 0.23087144 | 0.52147 | 0.59828352 | 7.1 × 10⁻⁴ | 0.221762 | 7 |
| 4 | 9.490859724 | 0.462423 | 0.23087144 | 0.60857 | 0.64559839 | 8.3 × 10⁻⁵ | 0.206575 | 14 |
| 5 | 17.88334313 | 0.436439 | 0.23087144 | 0.59989 | 0.62708712 | 1.8 × 10⁻⁴ | 0.183655 | 10 |
| 6 | 10.15629379 | 0.443874 | 0.23087144 | 0.58828 | 0.61021394 | 1.1 × 10⁻⁴ | 0.155563 | 12 |
| 7 | 7.483384607 | 0.429315 | 0.23087144 | 0.59759 | 0.63214043 | 1.4 × 10⁻⁵ | 0.163761 | 13 |
| 8 | 15.98544384 | 0.244135 | 0.36972481 | 0.57682 | 0.63000799 | 1.9 × 10⁻⁷ | 0.331158 | 8 |
| 9 | 10.37996996 | 0.227101 | 0.36972481 | 0.6093 | 0.65769103 | 2.0 × 10⁻⁷ | 0.262339 | 11 |
| Males Aged 20 to 60 | Males Aged over 60 | Females Aged 20 to 60 | Females Aged over 60 |
|---|---|---|---|
| Breast cancer, mesothelioma | African trypanosomiasis | Collective violence and legal intervention | Ascariasis |
| Collective violence and legal intervention | Ischemic heart disease | Drug use disorders | Collective violence and legal intervention |
| Dengue, echinococcosis | Natural disasters | Eating disorders | Drowning |
| Eating disorders | Echinococcosis | Echinococcosis | |
| Leishmaniasis | Leishmaniasis | Malaria | |
| Natural disasters | Malaria | Natural disasters | |
| Alzheimer disease and other dementias | Measles | Poisonings | |
| Mesothelioma | African trypanosomiasis | ||
| Natural disasters African trypanosomiasis |
Publisher’s Note: MDPI stays neutral with regard to jurisdictional claims in published maps and institutional affiliations. |
© 2022 by the authors. Licensee MDPI, Basel, Switzerland. This article is an open access article distributed under the terms and conditions of the Creative Commons Attribution (CC BY) license (https://creativecommons.org/licenses/by/4.0/).
Share and Cite
Bett, N.; Kasozi, J.; Ruturwa, D. Temporal Clustering of the Causes of Death for Mortality Modelling. Risks 2022, 10, 99. https://doi.org/10.3390/risks10050099
Bett N, Kasozi J, Ruturwa D. Temporal Clustering of the Causes of Death for Mortality Modelling. Risks. 2022; 10(5):99. https://doi.org/10.3390/risks10050099
Chicago/Turabian StyleBett, Nicholas, Juma Kasozi, and Daniel Ruturwa. 2022. "Temporal Clustering of the Causes of Death for Mortality Modelling" Risks 10, no. 5: 99. https://doi.org/10.3390/risks10050099
APA StyleBett, N., Kasozi, J., & Ruturwa, D. (2022). Temporal Clustering of the Causes of Death for Mortality Modelling. Risks, 10(5), 99. https://doi.org/10.3390/risks10050099