
The COVID-19 Pandemic and Overconfidence Bias: The Case of Cyclical and Defensive Sectors

 and
and
Abstract
:1. Introduction
2. Related Literature and Hypothesis Development
3. Materials and Methods
3.1. Data
- 1
- Pre-COVID-19 phase: 1 January 2015 to 29 January 2020.
- 2
- COVID-19 phase: 30 January 2020 to 31 December 2020.
3.2. The Model
4. Results
4.1. Descriptive Statistics
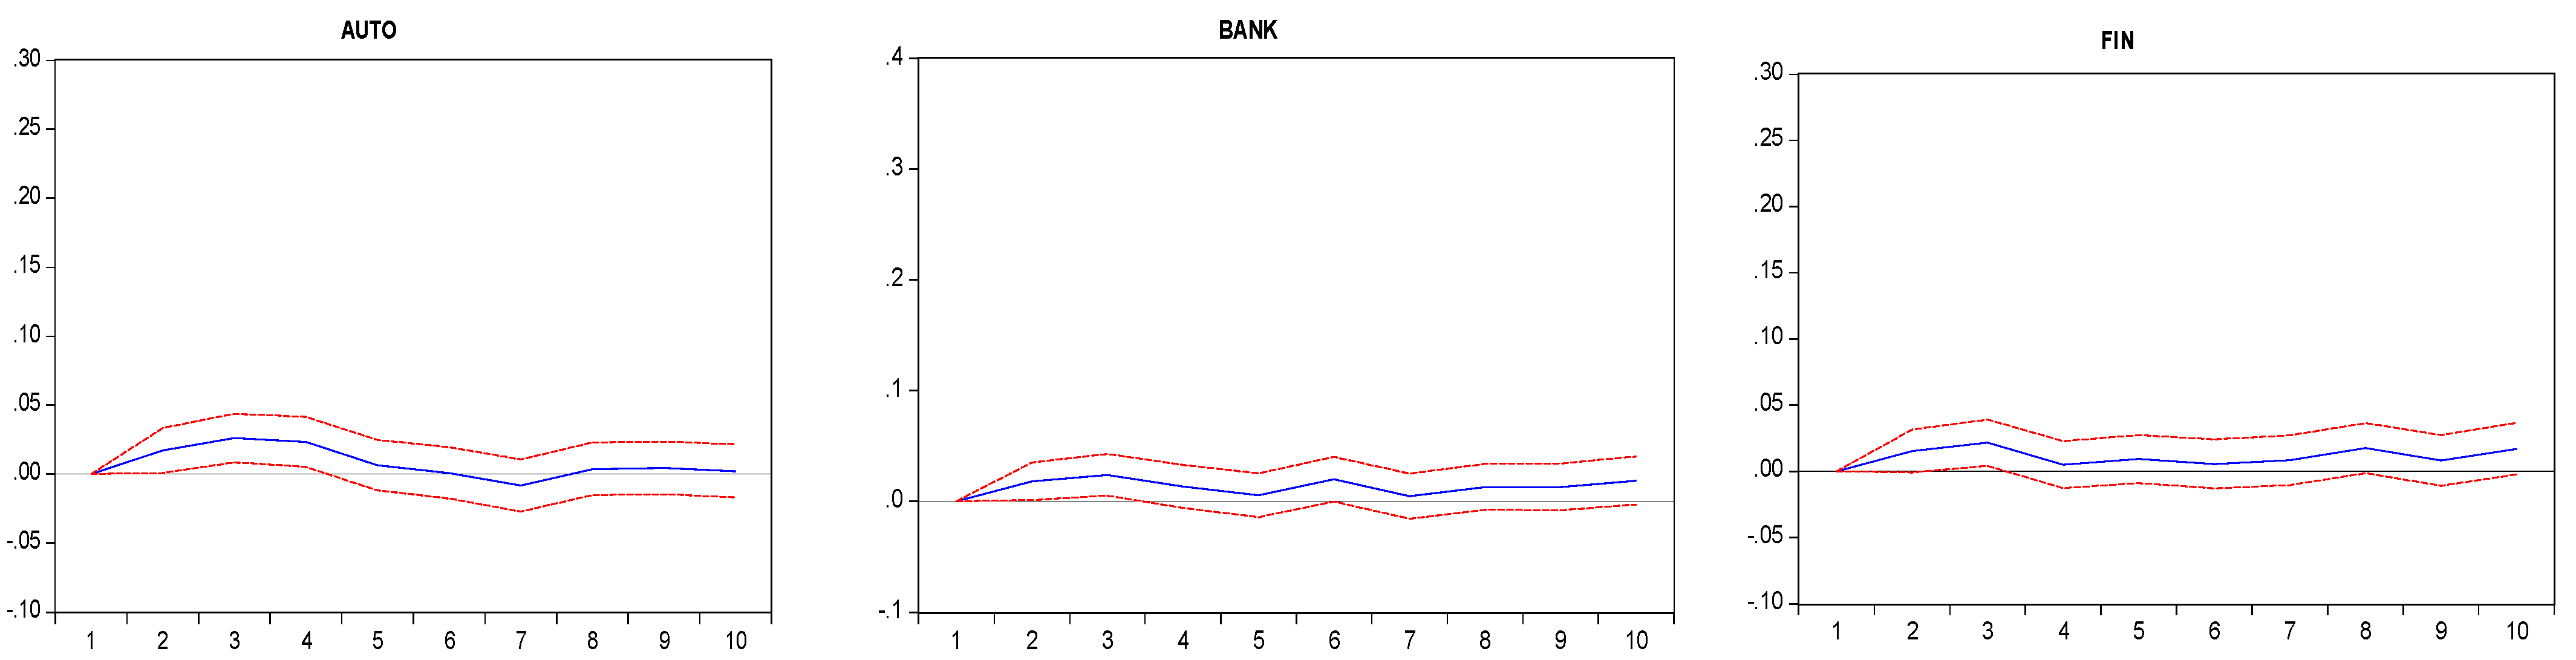
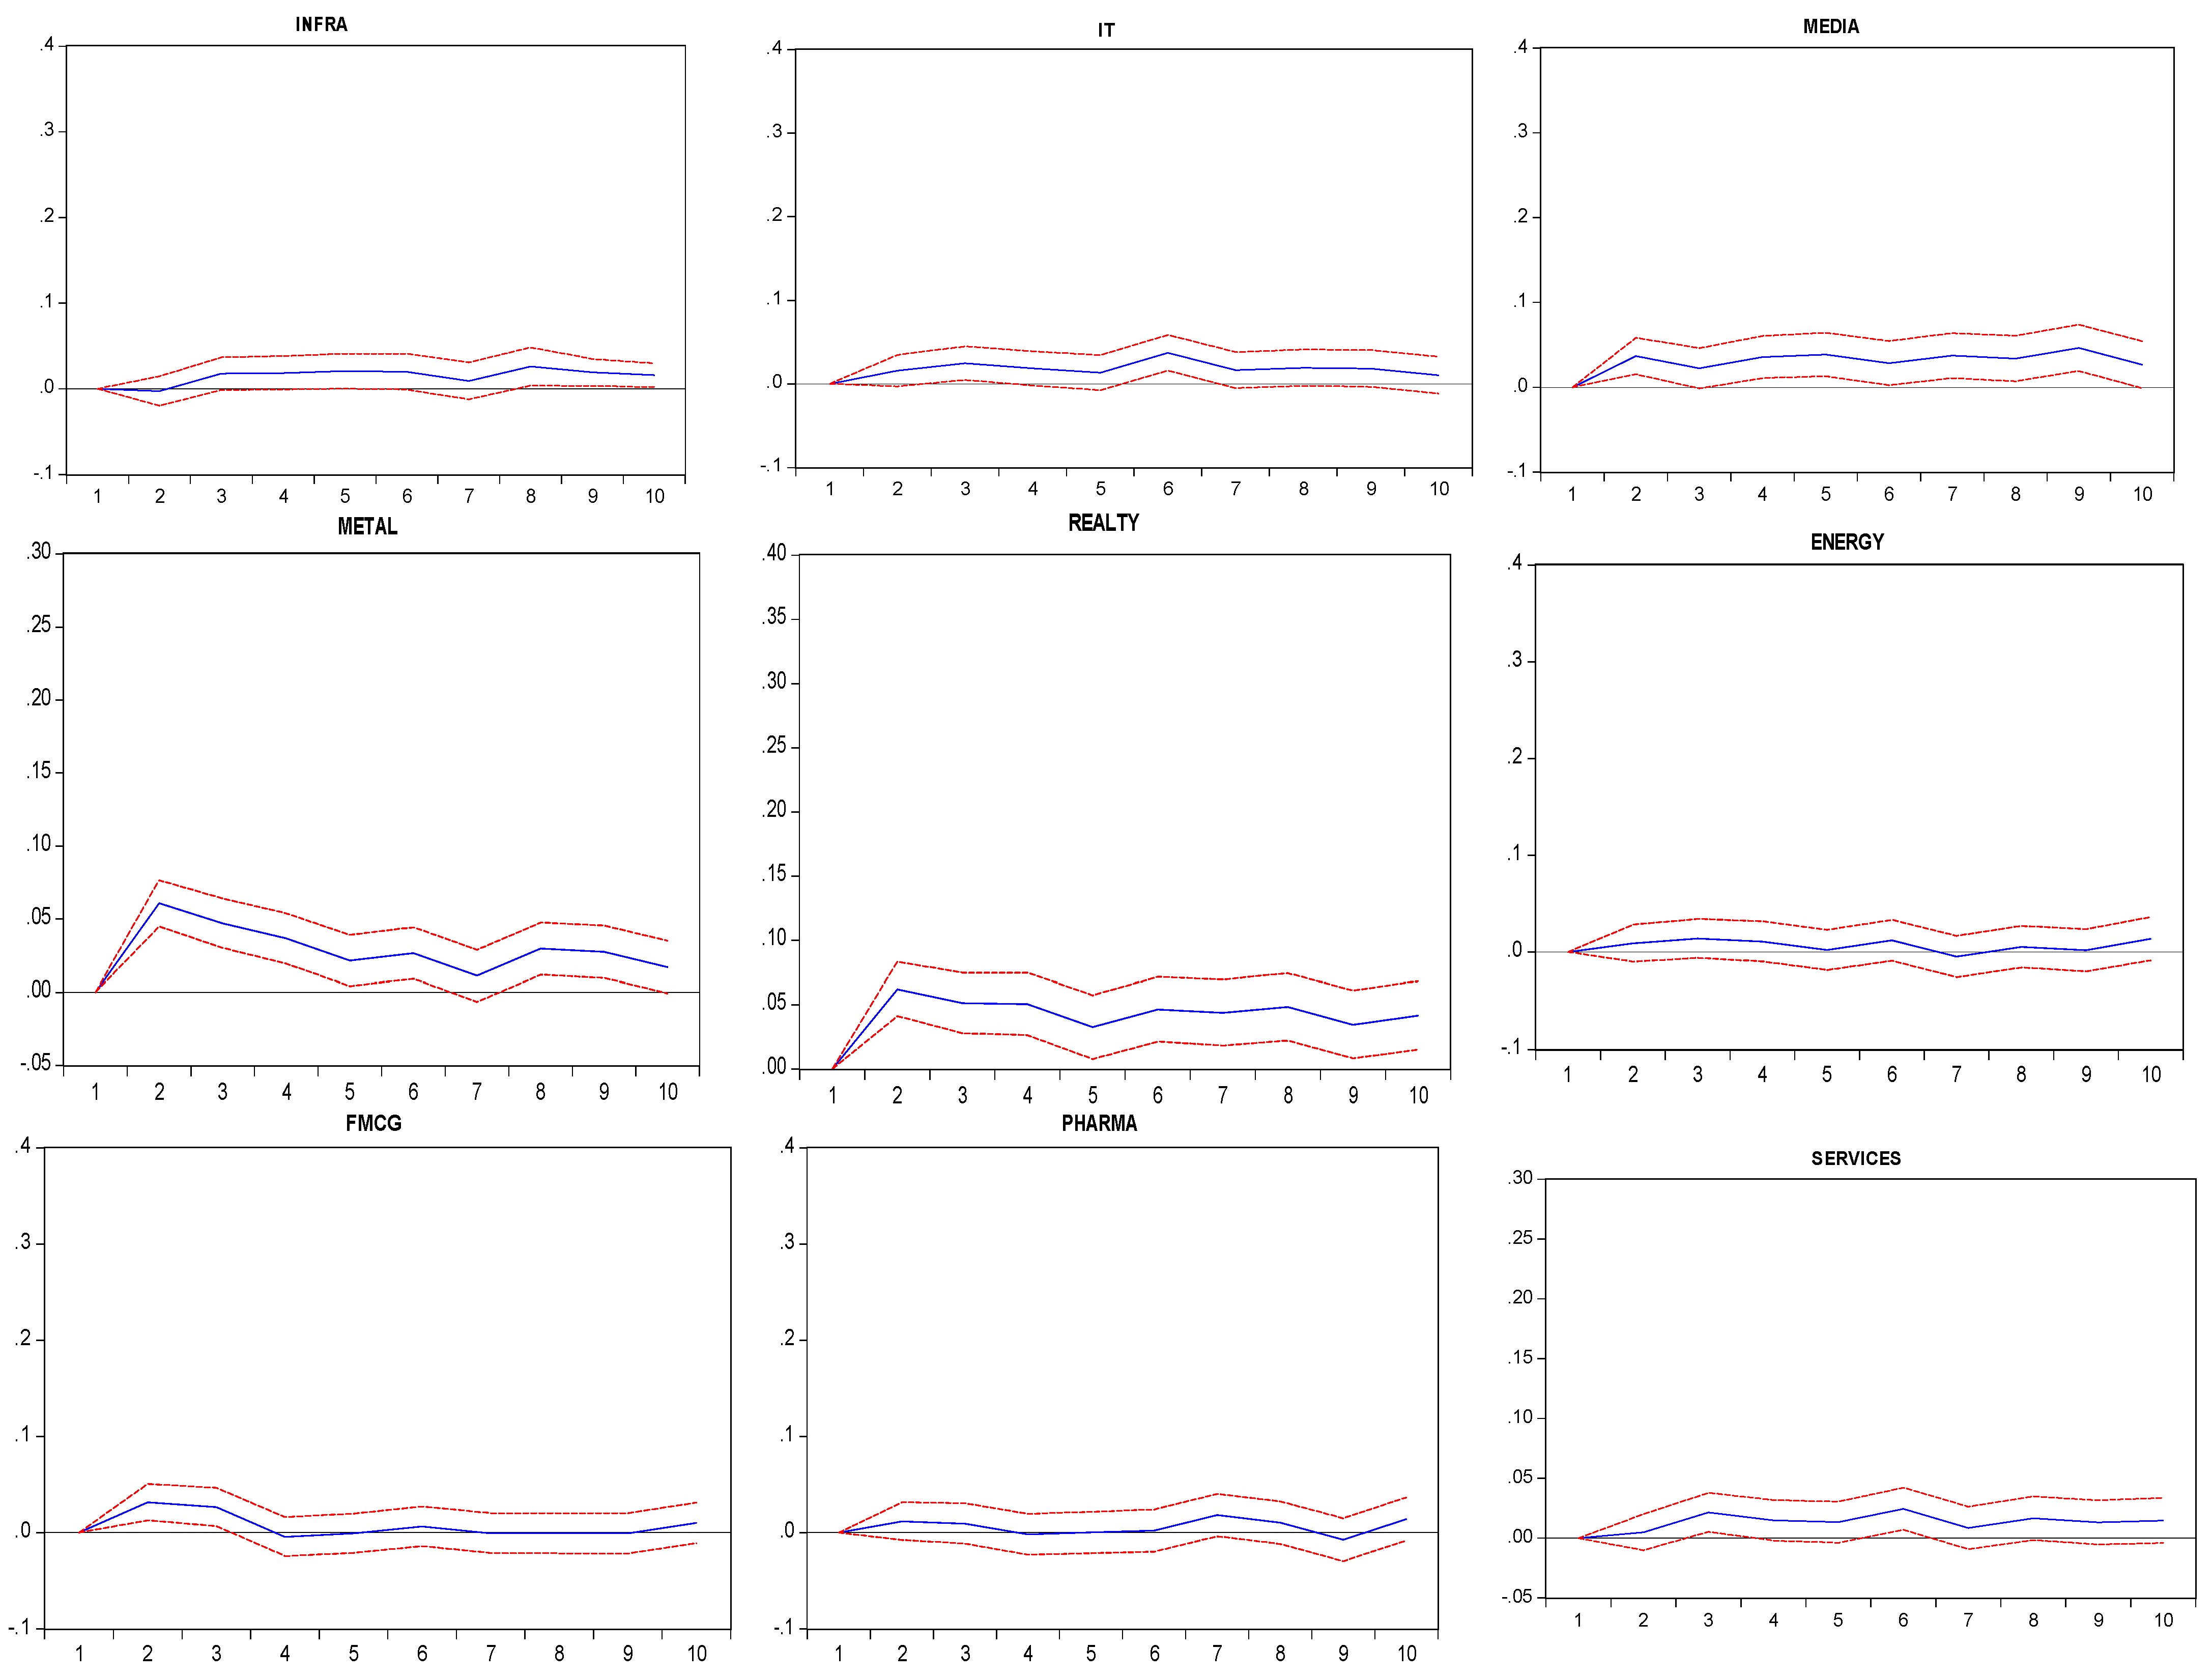
4.2. Pre-COVID-19: VAR and IRFs
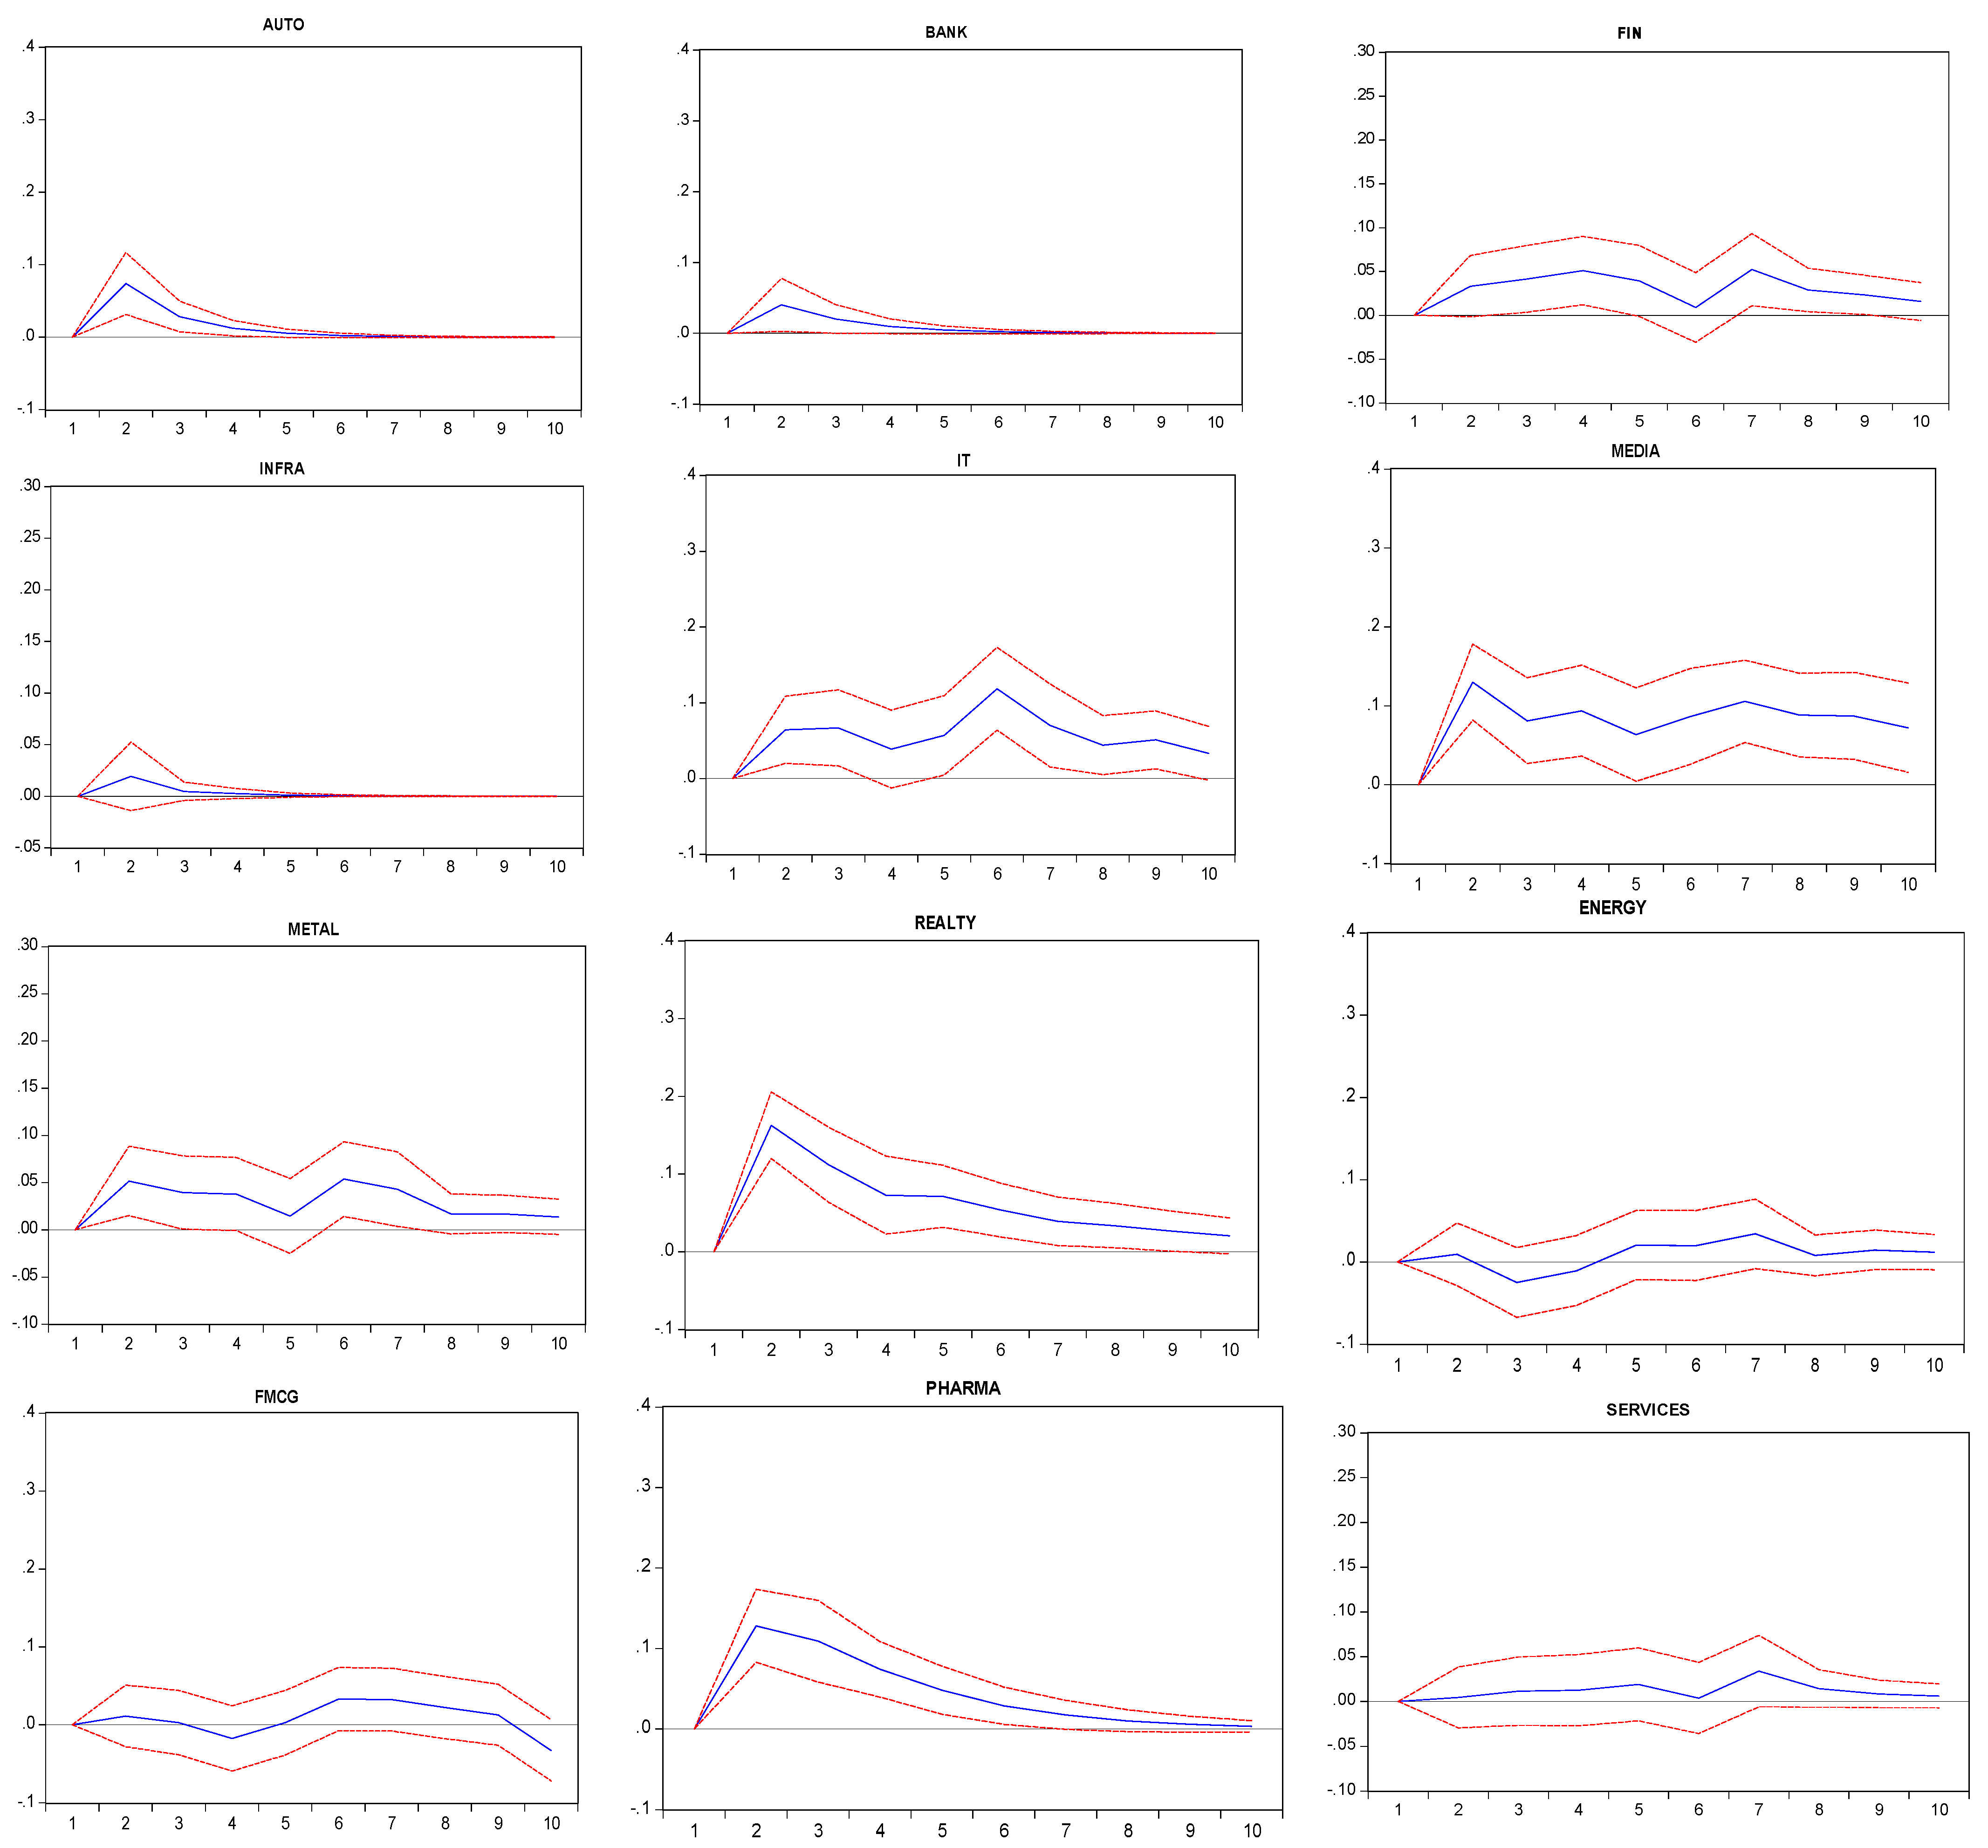
4.3. COVID-19: VAR and IRFs
5. Policy Implications
6. Conclusions
Author Contributions
Funding
Institutional Review Board Statement
Informed Consent Statement
Data Availability Statement
Conflicts of Interest
Appendix A

| Indices | Industry/Sector | Abbreviations | N |
|---|---|---|---|
| Nifty Auto Index | Automobile | AUTO | 15 |
| Nifty Bank Index | Banking | BANK | 12 |
| Nifty Financial Services Index | Financial services | FIN | 20 |
| Nifty FMCG Index | Fast-moving consumer goods | FMCG | 15 |
| Nifty IT Index | Information technology | IT | 10 |
| Nifty Media Index | Media and entertainment | MEDIA | 14 |
| Nifty Metal Index | Metal | METAL | 15 |
| Nifty Pharma Index | Pharmaceutical | PHARMA | 10 |
| Nifty Realty Index | Real estate | REALTY | 10 |
| Nifty Energy Index | Energy | ENERGY | 10 |
| Nifty Services Index | Services | SERVICES | 30 |
| Nifty Infra Index | Infrastructure | INFRA | 30 |
References
- Abbes, Mouna Boujelbène. 2013. Does Overconfidence Bias Explain Volatility During the Global Financial Crisis? Transition Studies Review 19: 291–312. [Google Scholar] [CrossRef]
- Alam, Md Mahmudul, Haitian Wei, and Abu NM Wahid. 2021. COVID-19 outbreak and sectoral performance of the Australian stock market: An event study analysis. Australian Economic Papers 60: 482–95. [Google Scholar] [CrossRef] [PubMed]
- Alam, Md Qaiser, and Md Shabbir Alam. 2021. Financial development, economic growth, and poverty reduction in India. Etikonomi: Jurnal Ekonomi 20: 13–22. [Google Scholar] [CrossRef]
- Alam, Mohammad Noor, Md Shabbir Alam, and Kavita Chavali. 2020. Stock market response during COVID-19 lockdown period in India: An event study. The Journal of Asian Finance, Economics, and Business 7: 131–37. [Google Scholar] [CrossRef]
- Al-Awadhi, Abdullah, Khaled Alsaifi, Ahmad Al-Awadhi, and Salah Alhammadi. 2020. Death and contagious infectious diseases: Impact of the COVID-19 virus on stock market returns. Journal of Behavioral and Experimental Finance 27: 1–8. [Google Scholar] [CrossRef]
- Albaity, Mohamed, Ray Saadaoui Mallek, and Hasan Mustafa. 2022. Bank Stock Return Reactions to the COVID-19 Pandemic: The Role of Investor Sentiment in MENA Countries. Risks 10: 43. [Google Scholar] [CrossRef]
- Ashraf, Badar Nadeem. 2020. Stock markets’ reaction to COVID-19: Cases or fatalities? Research in International Business and Finance 54: 1–7. [Google Scholar] [CrossRef]
- Baek, Seungho, Sunil K. Mohanty, and Mina Glambosky. 2020. COVID-19 and stock market volatility: An industry level analysis. Finance Research Letters 37: 101748. [Google Scholar] [CrossRef]
- Baker, H. Kent, Greg Filbeck, and Victor Ricciardi. 2017. Chapter 1: Financial behavior: An overview. In Financial Behavior: Players, Services, Products, and Markets. New York: Oxford University Press. [Google Scholar]
- Barber, Brad M., and Terrance Odean. 2001. Boys will be boys: Gender, overconfidence, and common stock investment. Quarterly Journal of Economics 116: 261–92. [Google Scholar]
- Beniwal, Vrishti. 2021. Covid deepens Indian infra sector’s troubles, flagship projects among casualties. The Economic Times, July 31. [Google Scholar]
- Bouri, Elie, Riza Demirer, Rangan Gupta, and Jacobus Nel. 2021. COVID-19 pandemic and investor herding in international stock markets. Risks 9: 168. [Google Scholar] [CrossRef]
- Burlea-Schiopoiu, Adriana, Simina Brostescu, and Liviu Popescu. 2021. The Impact of Foreign Direct Investment on the Economic Development of Emerging Countries of the European Union. International Journal of Finance and Economics. Available online: https://onlinelibrary.wiley.com/doi/10.1002/ijfe.2530 (accessed on 25 February 2022). [CrossRef]
- Business Standard. 2021. India’s Pharma Market Rebounds in April, Clocks. Available online: https://www.business-standard.com/article/companies/india-s-pharma-market-rebounds-in-april-clocks-51-5-sales-growth-121050701414_ (accessed on 21 May 2021).
- BusinessToday. 2021. India’s Unemployment in 2020 at Worst Level in 29 Years, Shows Study. BusinessToday. 2020–2021. Available online: https://www.businesstoday.in/sectors/jobs/india-unemployment-in-2020-at-worst-level-in-29-years-shows-study/story/440262.html (accessed on 25 September 2021).
- Cheema, Muhammad A., Yimei Man, and Kenneth R. Szulczyk. 2020. Does investor sentiment predict the near-term returns of the Chinese stock market? International Review of Finance 20: 225–33. [Google Scholar] [CrossRef]
- Chen, Conghui, Lanlan Liu, and Ningru Zhao. 2020. Fear Sentiment, Uncertainty, and Bitcoin Price Dynamics: The Case of COVID-19. Emerging Markets Finance and Trade 56: 2298–309. [Google Scholar] [CrossRef]
- Choi, Yukyung, Glenn Levine, and Samuel W. Malone. 2020. The Coronavirus (COVID-19) Pandemic: Assessing the Impact on Corporate Credit Risk. Moody’s Analytics. pp. 1–17. Available online: https://www.moodysanalytics.com/articles/2020/coronavirus-assessing-the-impact-on-corporate-credit-risk (accessed on 4 February 2022).
- Corbet, Shaen, Charles Larkin, and Brian Lucey. 2020. The contagion effects of the COVID-19 pandemic: Evidencefrom gold and cryptocurrencies. Finance Research Letters 35: 101–554. [Google Scholar] [CrossRef]
- Daniel, Kent, David Hirshleifer, and Avanidhar Subrahmanyam. 1998. Investor psychology and security market under- and overreactions. Journal of Finance 53: 1839–85. [Google Scholar] [CrossRef] [Green Version]
- Dhall, Rosy, and Bhanwar Singh. 2020. The COVID-19 Pandemic and Herding Behaviour: Evidence from India’s Stock Market. Millennial Asia 11: 366–90. [Google Scholar] [CrossRef]
- Górowski, Ireneusz, Bartosz Kurek, and Marek Szarucki. 2022. The Impact of a New Accounting Standard on Assets, Liabilities and Leverage of Companies: Evidence from Energy Industry. Energies 15: 1293. [Google Scholar] [CrossRef]
- Griffin, John M., Federico Nardari, and René M. Stulz. 2007. Do investors trade more when stocks have performed well? evidence from 46 countries. Review of Financial Studies 20: 905–51. [Google Scholar] [CrossRef]
- Gupta, Suman, Vinay Goyal, Vinay Kumar Kalakbandi, and Sankarshan Basu. 2018. Overconfidence, trading volume and liquidity effect in Asia’s Giants: Evidence from pre-, during- and post-global recession. Decision 45: 235–57. [Google Scholar] [CrossRef]
- Haacker, Mr Markus. 2004. Front matter. In The macroeconomics of HIV/AIDS. Washington, DC: International Monetary Fund. [Google Scholar]
- Hamilton, James Douglas. 1994. Time Series Analysis. Princeton: Princeton University Press. [Google Scholar]
- Hoffman, Steven J., and Sarah L. Silverberg. 2018. Delays in global disease outbreak responses: Lessons from H1N1, Ebola, and Zika. American Journal of Public Health 108: 329–33. [Google Scholar] [CrossRef]
- Kansal, Priya, and Seema Singh. 2018. Determinants of overconfidence bias in Indian stock market. Qualitative Research in Financial Markets 10: 381–394. [Google Scholar] [CrossRef]
- Karpoff, Jonathan M. 1987. The Relation Between Price Changes and Trading Volume: A Survey. The Journal of Financial and Quantitative Analysis 22: 109. [Google Scholar] [CrossRef]
- Kuranchie-Pong, Raphael, and Joseph Ato Forson. 2021. Overconfidence bias and stock market volatility in Ghana: Testing the rationality of investors in the COVID-19 era. African Journal of Economic and Management Studies 13: 147–61. [Google Scholar] [CrossRef]
- Liu, HaiYue, Aqsa Manzoor, CangYu Wang, Lei Zhang, and Zaira Manzoor. 2020. The COVID-19 outbreak and affected countries stock markets response. International Journal of Environmental Research and Public Health 17: 2800. [Google Scholar] [CrossRef] [PubMed] [Green Version]
- Liu, Zhifeng, Toan Luu Duc Huynh, and Peng-Fei Dai. 2021. The impact of COVID-19 on the stock market crash risk in China. Researchin international Business and Finance 57: 1–10. [Google Scholar] [CrossRef]
- Loh, Elaine. 2006. The impact of SARS on the performance and risk profile of airline stocks. International Journal of Transport Economics 33: 401–22. [Google Scholar]
- Mazur, Mieszko, Man Dang, and Miguel Vega. 2021. COVID-19 and the march 2020 stock market crash. Evidence from S&P1500. Finance Research Letters 38: 101690. [Google Scholar]
- Metwally, Ayman H., and Omneya Darwish. 2015. Evidence of the Overconfidence Bias in the Egyptian Stock Market in Different Market States. The Business and Managment Review 6: 178–98. [Google Scholar]
- Mushinada, Venkata Narasimha Chary, and Venkata Subrahmanya Sarma Veluri. 2018. Investors overconfidence behaviour at Bombay Stock Exchange. International Journal of Managerial Finance 14: 613–32. [Google Scholar] [CrossRef]
- Narasimhan, T. E. 2020. India’s First Coronavirus Case: Kerala Student in Wuhan Tested Positive. Business Standard India. Available online: https://www.business-standard.com/article/current-affairs/india-s-first-coronavirus-case-kerala-student-in-wuhan-tested-positive (accessed on 29 October 2021).
- Narayan, Paresh Kumar, and Susan Sunila Sharma. 2011. New evidence on oil price and firm returns. Journal of Banking & Finance 35: 3253–62. [Google Scholar]
- Naseem, Sobia, Muhammad Mohsin, Wang Hui, Geng Liyan, and Kun Penglai. 2021. The investor psychology and stock market behavior during the initial era of COVID-19: A study of China, Japan, and the United States. Frontiers in Psychology 12: 16. [Google Scholar] [CrossRef]
- Partner, K. 2020. COVID-19 Impact on Indian Industry. New Delhi: The Associated Chambers of Commerce and Industry of India (ASSOCHAM), April. [Google Scholar]
- Pendell, Dustin L., and Chulgu Cho. 2013. Stock market reactions to contagious animal disease outbreaks: An event study in korean foot-and-mouth disease outbreak. Agribusiness 29: 455–68. [Google Scholar] [CrossRef]
- Phan, Dzung Tran Trung, Van Hoang Thu Le, and Thanh Thi Ha Nguyen. 2020. Overconfidence bias, comparative evidences between Vietnam and selected ASEAN countries. Journal of Asian Finance, Economics, and Business 7: 101–13. [Google Scholar] [CrossRef]
- Prosad, Jaya M., Sujata Kapoor, Jhumur Sengupta, and Saurav Roychoudhary. 2017. Overconfidence and Disposition Effect in Indian Equity Market: An Empirical Evidence. Global Business Review 19: 1303–21. [Google Scholar] [CrossRef]
- Salisu, Afees A., and Xuan Vinh Vo. 2020. Predicting stock returns in the presence of COVID-19 pandemic: The role of health news. International Review of Financial Analysis 71: 101546. [Google Scholar] [CrossRef]
- Sharif, Arshian, Chaker Aloui, and Larisa Yarovaya. 2020. COVID-19 pandemic, oil prices, stock market, geopolitical risk and policy uncertainty nexus in the US economy: Fresh evidence from the wavelet-based approach. International Review of Financial Analysis 70: 101496. [Google Scholar] [CrossRef]
- Shen, Huayu, Mengyao Fu, Hongyu Pan, Zhongfu Yu, and Yongquan Chen. 2020. The Impact of the COVID-19 Pandemic on Firm Performance. Emerging Markets Finance and Trade 56: 2213–30. [Google Scholar] [CrossRef]
- Shrotryia, Vijay Kumar, and Himanshi Kalra. 2021. COVID-19 and overconfidence bias: The case of developed, emerging and frontier markets. International Journal of Emerging Markets. [Google Scholar] [CrossRef]
- Statman, Meir, Steven Thorley, and Keith Vorkink. 2006. Investor overconfidence and trading volume. Review of Financial Studies 19: 1531–65. [Google Scholar] [CrossRef]
- Sun, Yunchuan, Mengyuan Wu, Xiaoping Zeng, and Zihan Peng. 2021. The impact of COVID-19 on the Chinese stock market: Sentimental or substantial? Finance Research Letters 38: 1–13. [Google Scholar] [CrossRef]
- Talwar, Manish, Shalini Talwar, Puneet Kaur, Naliniprava Tripathy, and Amandeep Dhir. 2021. Has financial attitude impacted the trading activity of retail investors during the COVID-19 pandemic? Journal of Retailing and Consumer Services 58: 102341. [Google Scholar]
- Trejos, Cristian, Adrian van Deemen, Yeny E. Rodríguez, and Juan M. Gomez. 2019. Overconfidence and disposition effect in the stock market: A micro world based setting. Journal of Behavioral and Experimental Finance 21: 61–69. [Google Scholar] [CrossRef]
- Utomo, Christian Damara, and Dewi Hanggraeni. 2021. The Impact of COVID-19 Pandemic on Stock Market Performance in Indonesia. The Journal of Asian Finance, Economics and Business 8: 777–84. [Google Scholar]
- Xu, Libo. 2021. Stock Return and the COVID-19 pandemic: Evidence from Canada and the US. Finance Research Letters 38: 1–7. [Google Scholar] [CrossRef]
- Yarovaya, Larisa, Roman Matkovskyy, and Akanksha Jalan. 2020. The effects of a’Black Swan’event (COVID-19) on herding behavior in cryptocurrency markets: Evidence from cryptocurrency USD, EUR, JPY and KRW Markets. EUR, JPY and KRW Markets, April 27. [Google Scholar]
- Zaiane, Salma, and Ezzeddine Abaoub. 2009. Investor overconfidence and trading volume: Thecase of an emergent market. International Review of Business Research Papers 5: 213–22. [Google Scholar]
- Zaiane, Salma. 2013. Overconfidence, trading volume and the disposition effect: Evidence from the Shenzhen Stock Market of China. Journal Issues ISSN 2350: 157X. [Google Scholar]
- Zia, Lubna, Muzammal Ilyas Sindhu, and Shujahat Haider Hashmi. 2017. Testing overconfidence bias in Pakistani stock market. Cogent Economics and Finance 5: 1289656. [Google Scholar] [CrossRef]


| Pre COVID-19 | During COVID-19 | ||||||||||
|---|---|---|---|---|---|---|---|---|---|---|---|
| Time Periods | Lags | 1 January 2015–29 January 2020 | Lags | 30 January 2020–31 December 2020 | |||||||
| Parameters | Indices | Mean | Std Dev | Skewness | Kurtosis | Mean | Std Dev | Skewness | Kurtosis | ||
| Mkt return | AUTO | 10 | 0.000 | 0.012 | 0.049 | 7.532 | 1 | 0.001 | 0.024 | −1.077 | 11.669 |
| Mkt volume | 17.55 | 0.49 | 0.533 | 3.705 | 18.776 | 0.379 | −0.203 | 5.159 | |||
| Volatility | 0.015 | 0.008 | 2.796 | 21.845 | 0.026 | 0.019 | 3.354 | 21.264 | |||
| Mkt return | BANK | 11 | 0.000 | 0.012 | 0.151 | 6.841 | 1 | 0.000 | 0.029 | −1.378 | 10.95 |
| Mkt volume | 18.554 | 0.671 | 0.492 | 3.084 | 19.719 | 0.36 | −0.128 | 8.649 | |||
| Volatility | 0.014 | 0.008 | 2.561 | 16.538 | 0.031 | 0.023 | 2.796 | 14.144 | |||
| Mkt return | ENERGY | 10 | 0.000 | 0.012 | −0.805 | 8.327 | 6 | 0.000 | 0.021 | −0.673 | 8.682 |
| Mkt volume | 17.644 | 0.569 | 0.112 | 3.968 | 18.878 | 0.343 | 0.462 | 4.125 | |||
| Volatility | 0.015 | 0.007 | 2.739 | 16.906 | 0.023 | 0.018 | 4.843 | 41.09 | |||
| Mkt return | FIN | 11 | 0.001 | 0.011 | 0.042 | 6.481 | 6 | 0.000 | 0.027 | −1.458 | 10.905 |
| Mkt volume | 18.12 | 0.449 | 0.256 | 4.454 | 19.19 | 0.389 | −0.774 | 6.585 | |||
| Volatility | 0.013 | 0.007 | 2.495 | 15.062 | 0.028 | 0.022 | 3.034 | 15.789 | |||
| Mkt return | FMCG | 13 | 0.000 | 0.01 | −0.211 | 6.723 | 9 | 0.000 | 0.017 | −0.737 | 15.717 |
| Mkt volume | 16.807 | 0.457 | −0.17 | 5.593 | 17.762 | 0.355 | 0.335 | 5.683 | |||
| Volatility | 0.013 | 0.007 | 3.107 | 24.628 | 0.019 | 0.015 | 3.416 | 21.694 | |||
| Mkt return | INFRA | 7 | 0.000 | 0.011 | −0.232 | 5.669 | 1 | 0.000 | 0.02 | −1.457 | 12.995 |
| Mkt volume | 18.846 | 0.49 | 0.297 | 4.217 | 19.452 | 0.296 | −0.047 | 5.943 | |||
| Volatility | 0.014 | 0.007 | 2.057 | 10.378 | 0.02 | 0.018 | 4.349 | 32.734 | |||
| Mkt return | IT | 11 | 0.000 | 0.011 | −0.128 | 4.854 | 6 | 0.002 | 0.022 | −0.77 | 8.626 |
| Mkt volume | 16.733 | 0.576 | 0.106 | 3.921 | 17.475 | 0.467 | 0.075 | 7.138 | |||
| Volatility | 0.014 | 0.007 | 1.908 | 8.854 | 0.023 | 0.017 | 4.257 | 31.804 | |||
| Mkt return | MEDIA | 11 | 0.000 | 0.015 | −1.203 | 18.751 | 5 | 0.000 | 0.025 | −0.931 | 5.578 |
| Mkt volume | 16.757 | 0.75 | 0.54 | 3.288 | 17.613 | 0.485 | −0.269 | 4.817 | |||
| Volatility | 0.021 | 0.013 | 5.145 | 66.149 | 0.032 | 0.018 | 2.137 | 11.243 | |||
| Mkt return | METAL | 13 | 0.000 | 0.016 | −0.008 | 4.464 | 6 | 0.001 | 0.026 | −1.04 | 6.826 |
| Mkt volume | 18.01 | 0.46 | −0.43 | 4.154 | 18.769 | 0.317 | −0.25 | 6.188 | |||
| Volatility | 0.021 | 0.01 | 1.599 | 7.342 | 0.030 | 0.019 | 4.881 | 45.373 | |||
| Mkt return | PHARMA | 14 | 0.000 | 0.012 | −0.294 | 5.063 | 2 | 0.002 | 0.02 | −0.153 | 7.84 |
| Mkt volume | 16.465 | 0.536 | 0.295 | 4.178 | 17.53 | 0.451 | 0.057 | 5.311 | |||
| Volatility | 0.017 | 0.009 | 2.578 | 17.525 | 0.026 | 0.018 | 3.757 | 27.953 | |||
| Mkt return | REALTY | 14 | 0.000 | 0.018 | −0.515 | 7.635 | 3 | 0.000 | 0.026 | −1.026 | 6.237 |
| Mkt volume | 17.597 | 0.801 | −0.36 | 2.826 | 16.67 | 0.422 | 1.013 | 4.799 | |||
| Volatility | 0.023 | 0.012 | 2.188 | 11.242 | 0.031 | 0.019 | 2.371 | 11.07 | |||
| Mkt return | SERVICE | 11 | 0.000 | 0.009 | −0.249 | 6.163 | 6 | 0.001 | 0.023 | −1.65 | 11.741 |
| Mkt volume | 18.992 | 0.52 | 0.615 | 4.236 | 19.921 | 0.321 | −0.547 | 12.26 | |||
| Volatility | 0.011 | 0.006 | 2.36 | 13.533 | 0.022 | 0.019 | 3.763 | 23.774 | |||
| Cyclical Sector | Defensive Sector | |||||||||||
|---|---|---|---|---|---|---|---|---|---|---|---|---|
| Parameters | AUTO | BANK | FIN | INFRA | IT | MEDIA | METAL | REALTY | ENERGY | FMCG | PHARMA | SERVICES |
| Mkt vol (−1) | 0.364 *** | 0.444 *** | 0.372 *** | 0.451 *** | 0.354 *** | 0.461 *** | 0.285 *** | 0.468 *** | 0.320 *** | 0.338 *** | 0.366 *** | 0.397 *** |
| Mkt vol (−2) | 0.080 *** | 0.093 *** | 0.088 *** | 0.054 * | 0.104 *** | 0.105 *** | 0.069 *** | 0.057 ** | 0.103 *** | 0.075 *** | 0.096 *** | 0.118 *** |
| Mkt vol (−3) | 0.063 ** | 0.016 | 0.072 *** | 0.151 *** | 0.083 *** | 0.074 *** | 0.052 ** | 0.064 ** | 0.067 ** | 0.058 * | 0.092 *** | 0.035 |
| Mkt vol (−4) | 0.071 *** | 0.091 *** | 0.097 *** | 0.032 | 0.050 * | 0.003 | 0.069 *** | 0.051 * | 0.080 *** | 0.100 *** | 0.044 | 0.078 *** |
| Mkt vol (-5) | 0.075 *** | 0.064 ** | 0.071 *** | 0.093 *** | 0.042 | 0.033 | 0.091 *** | 0.058 ** | 0.090 *** | −0.002 | 0.032 | 0.071 *** |
| Mkt vol (−6) | −0.003 | 0.051 * | −0.007 | 0.068 ** | 0.025 | 0.054 * | 0.028 | 0.047 | 0.065 ** | 0.044 | 0.029 | 0.066 ** |
| Mkt vol (−7) | 0.022 | 0.022 | 0.025 | 0.047 * | 0.023 | 0.047 | 0.021 | −0.017 | 0.059 ** | 0.043 | 0.037 | 0.003 |
| Mkt vol (−8) | 0.086 *** | 0.083 *** | 0.053 * | 0.019 | 0.015 | 0.005 | 0.025 | 0.050 * | 0.022 | 0.048 * | 0.076 *** | |
| Mkt vol (−9) | −0.016 | −0.010 | −0.005 | −0.010 | 0.033 | 0.048 * | 0.032 | 0.013 | 0.040 | −0.027 | 0.031 | |
| Mktvol (−10) | 0.119 *** | 0.010 | 0.031 | −0.013 | 0.012 | 0.057 ** | 0.037 | 0.078 *** | 0.063 ** | 0.066 *** | 0.006 | |
| Mktvol (−11) | 0.092 *** | 0.083 *** | 0.043 | 0.070 *** | 0.057 ** | 0.024 | 0.015 | 0.065 *** | ||||
| Mktvol (−12) | 0.033 | 0.002 | −0.012 | 0.012 | ||||||||
| Mktvol (−13) | 0.049 * | 0.097 *** | 0.057** | 0.070 *** | ||||||||
| Mktvol (−14) | −0.001 | 0.032 | ||||||||||
| Mktvol (−15) | 0.057 ** | |||||||||||
| Mktvol (−16) | 0.052 ** | |||||||||||
| Mktrtn (−1) | 1.384 ** | 1.576 ** | 1.412 ** | −0.237 | 1.505 * | 2.404 *** | 3.787 *** | 3.445 *** | 0.789 | 3.219 *** | 0.952 | 0.567 |
| Mktrtn (−2) | 1.500 ** | 1.308 * | 1.386 * | 1.744 ** | 1.827 ** | 0.336 | 1.781 *** | 1.077 ** | 0.913 | 1.433 | 0.355 | 2.180 *** |
| Mktrtn (−3) | 0.903 | 0.054 | −0.441 | 0.884 | 0.788 | 1.422 ** | 1.252 *** | 1.281 ** | 0.410 | −1.551 * | −0.532 | 0.536 |
| Mktrtn (−4) | −0.451 | −0.227 | 0.458 | 1.039 | 0.343 | 1.221 * | 0.313 | 0.008 | −0.346 | −0.122 | −0.059 | 0.518 |
| Mktrtn (−5) | −0.450 | 1.276 * | −0.139 | 0.542 | 2.742 *** | 0.423 | 0.567 | 1.296 ** | 0.782 | 0.341 | 0.081 | 1.842 ** |
| Mktrtn (−6) | −1.017 | −0.656 | 0.281 | −0.418 | −0.090 | 1.182 * | −0.331 | 0.575 | −0.959 | −0.440 | 1.354 | −0.591 |
| Mktrtn (−7) | 0.355 | 0.663 | 1.126 | 1.439 * | 0.685 | 0.602 | 1.053 ** | 0.843 | 0.418 | −0.133 | 0.164 | 0.955 |
| Mktrtn (−8) | 0.111 | 0.224 | −0.169 | 0.467 | 1.487 ** | 0.544 | −0.247 | −0.184 | −0.259 | −1.128 | 0.211 | |
| Mktrtn (−9) | −0.163 | 0.611 | 0.897 | −0.188 | −0.167 | 0.093 | 0.769 | 0.904 | 0.917 | 1.173 | 0.407 | |
| Mktrtn (−10) | 0.651 | 0.459 | −0.193 | 0.030 | 1.068 | 0.016 | 0.329 | 0.143 | 0.308 | 0.790 | 0.740 | |
| Mktrtn (−11) | 0.630 | 0.722 | 0.852 | 1.235 * | 0.078 | 0.244 | −0.690 | 1.432 * | ||||
| Mktrtn (−12) | 1.048 | 0.167 | −0.147 | 1.917 ** | ||||||||
| Mktrtn (−13) | −0.512 | 0.295 | 0.712 | 1.088 | ||||||||
| Mktrtn (−14) | 1.821 ** | 1.021 * | ||||||||||
| Mktrtn (−15) | 0.529 | |||||||||||
| Mktrtn (−16) | −0.759 | |||||||||||
| Constt | 2.241 *** | 0.635 *** | 1.989 *** | 1.840 *** | 1.247 *** | 1.297 *** | 1.858 *** | 0.965 *** | 1.155 *** | 1.817 *** | 3.280 *** | 0.891 *** |
| Volatility | 13.355 *** | 13.077 *** | 14.415 *** | 8.192 *** | 18.809 *** | 11.533 *** | 13.607 *** | 15.745 *** | 11.193 *** | 19.193 *** | 18.028 *** | 13.430 *** |
| Cyclical Sector | Defensive Sector | |||||||||||
|---|---|---|---|---|---|---|---|---|---|---|---|---|
| Parameters | AUTO | BANK | FIN | INFRA | IT | MEDIA | METAL | REALTY | ENERGY | FMCG | PHARMA | SERVICES |
| Mkt vol (−1) | 0.453 *** | 0.527 *** | 0.305 *** | 0.414 *** | 0.320 *** | 0.410 *** | 0.241 *** | 0.311 *** | 0.309 *** | 0.344 *** | 0.355 *** | 0.435 *** |
| Mkt vol (−2) | 0.064 | 0.112 * | 0.125 * | −0.008 | 0.121 ** | 0.175 *** | 0.122 * | 0.125 ** | 0.075 | |||
| Mkt vol (−3) | 0.021 | 0.125 * | −0.017 | 0.034 | 0.214 *** | −0.070 | 0.023 | −0.024 | ||||
| Mkt vol (−4) | 0.103 | −0.012 | 0.041 | 0.134 ** | 0.085 | −0.069 | 0.030 | |||||
| Mkt vol (−5) | 0.131 ** | −0.036 | 0.201 | −0.091 | 0.006 | 0.082 | 0.043 | |||||
| Mkt vol (−6) | 0.081 | 0.118 ** | 0.140 ** | 0.126 ** | −0.120 * | 0.069 | ||||||
| Mkt vol (−7) | 0.004 | |||||||||||
| Mkt vol (−8) | 0.075 | |||||||||||
| Mkt vol (−9) | −0.117 * | |||||||||||
| Mkt vol (−10) | ||||||||||||
| Mkt rtn (−1) | 3.078 *** | 1.405 ** | 1.272 ** | 0.979 | 3.156 *** | 5.226 *** | 2.048 *** | 6.432 *** | 0.452 | 0.751 | 6.486 *** | 0.220 |
| Mkt rtn (−2) | 1.202 * | 2.717 ** | 0.883 | 1.295 * | 2.045 *** | −1.324 | 0.099 | 3.435 *** | 0.459 | |||
| Mkt rtn (−3) | 1.435 ** | 0.611 | 1.281 | 0.973 | 0.216 | −0.478 | −1.339 | 0.361 | ||||
| Mkt rtn (−4) | 0.799 | 0.914 | −0.013 | 0.013 | 1.447 | 0.183 | 0.614 | |||||
| Mkt rtn (−5) | −0.395 | 4.256 *** | 1.271 | 1.453 ** | 1.026 | 2.340 * | −0.204 | |||||
| Mkt rtn (−6) | 1.196 * | 1.539 | 0.943 | 1.254 | 1.758 | 1.356 * | ||||||
| Mkt rtn (−7) | 0.891 | |||||||||||
| Mkt rtn (−8) | 0.121 | |||||||||||
| Mkt rtn (−9) | −3.298 *** | |||||||||||
| Mkt rtn (−10) | ||||||||||||
| Constt | 10.165 *** | 9.203 *** | 5.494 *** | 11.311 *** | 6.259 *** | 3.973 *** | 10.099 *** | 5.702 *** | 6.843 *** | 11.539 *** | 8.921 *** | 7.298 *** |
| Volatility | 4.066 *** | 3.778 *** | 6.002 *** | 4.106 *** | 9.895 *** | 7.446 *** | 7.043 *** | 6.702 *** | 5.443 *** | 7.103 *** | 7.188 *** | 4.033 *** |
Publisher’s Note: MDPI stays neutral with regard to jurisdictional claims in published maps and institutional affiliations. |
© 2022 by the authors. Licensee MDPI, Basel, Switzerland. This article is an open access article distributed under the terms and conditions of the Creative Commons Attribution (CC BY) license (https://creativecommons.org/licenses/by/4.0/).
Share and Cite
Azam, M.Q.; Hashmi, N.I.; Hawaldar, I.T.; Alam, M.S.; Baig, M.A. The COVID-19 Pandemic and Overconfidence Bias: The Case of Cyclical and Defensive Sectors. Risks 2022, 10, 56. https://doi.org/10.3390/risks10030056
Azam MQ, Hashmi NI, Hawaldar IT, Alam MS, Baig MA. The COVID-19 Pandemic and Overconfidence Bias: The Case of Cyclical and Defensive Sectors. Risks. 2022; 10(3):56. https://doi.org/10.3390/risks10030056
Chicago/Turabian StyleAzam, Md Qamar, Nazia Iqbal Hashmi, Iqbal Thonse Hawaldar, Md Shabbir Alam, and Mirza Allim Baig. 2022. "The COVID-19 Pandemic and Overconfidence Bias: The Case of Cyclical and Defensive Sectors" Risks 10, no. 3: 56. https://doi.org/10.3390/risks10030056
APA StyleAzam, M. Q., Hashmi, N. I., Hawaldar, I. T., Alam, M. S., & Baig, M. A. (2022). The COVID-19 Pandemic and Overconfidence Bias: The Case of Cyclical and Defensive Sectors. Risks, 10(3), 56. https://doi.org/10.3390/risks10030056