Article

Comparison of National Innovation Systems in the European Union Countries

1
Department of Institutional Economics and Microeconomics, University of Lodz, Rewolucji 1905 r. Street, No. 41, 90-214 Łódź, Poland
2
Department of Economic and Social Statistics, University of Lodz, Rewolucji 1905 r. Street, No. 41, 90-214 Łódź, Poland
*
Author to whom correspondence should be addressed.
Submission received: 30 September 2021 / Revised: 21 December 2021 / Accepted: 22 December 2021 / Published: 29 December 2021
(This article belongs to the Special Issue Risk and Multifaceted Failures in Business Operations)

Abstract

:
The effective operation of national innovation systems can be a source of many opportunities, but it cannot be forgotten that innovation in itself may mean limiting but also generating various types of risks for the functioning of the local market. The main aim of the article is to present the concept and classification of national innovation systems in the world and to try to answer whether the type of NIS determines the level of innovation of the economies of the European Union countries. The following research thesis was formulated in the study: the type of National Innovation System determines a certain level of innovation in the economy of an European Union country, i.e., in countries belonging to a developed NIS, the level of innovation of the economy is higher than in countries belonging to developing systems. The results of the analysis confirm the research thesis. In the empirical part, the level of innovation in the European Union countries was assessed using the synthetic measure of development (SMD) by Z. Hellwig. Based on the obtained values of the synthetic measure of development (innovation), a ranking of the innovation of the economies of the EU countries was compiled and groups of countries with a similar degree of innovation in the economy were distinguished. The developed ranking of the European Union countries was compared with the NSI classification presented in the theoretical part of the article. The study covered 2010 and 2019.

1. Introduction

For several decades, the ability to create, apply and disseminate innovation has been treated as the most important factor for sustainable economic growth and development (Dworak 2020). It is emphasized that innovation is the result of interactions between people, organizations and their environment (Świadek and Gorączkowska 2020; Prokop et al. 2021). This understanding of innovation is reflected in the concept of National Innovation System (NIS) that plays an important role in the innovation policy of all developed market economies.
There is a great deal of risk associated with innovation activity, and this is seen as one of the main barriers to conducting such activity. A low level of innovation of the new Member States of the European Union (EU) stems from, among other factors, a low propensity for risk taking. In a situation of relatively small financial resources, entrepreneurs’ fears concerning the return of expenditure on innovation activity diminish their willingness to conduct this activity. An insufficient level of innovativeness of enterprises results in a low level of innovation in the economies of these countries.
The main aim of the article is to present the concept and classification of national innovation systems in the world and to try to answer the question whether the type of National Innovation System determines the level of innovation of the economies of the European Union countries. The following research thesis was formulated in the study: the type of National Innovation System determines a certain level of innovation of the economy of an EU country, i.e., in countries belonging to developed National Innovation System the level of innovation of the economy is higher than in countries belonging to developing systems. The results of the analysis confirm the research thesis. In the context of the research conducted, it should be emphasized that the development through innovation increases a country’s competitiveness and improves its position on the international arena. However, each development has its own economic and social consequences, which means that it is a source of potential risks.
The research originality of the article results primarily from making intergroup comparisons (between groups of countries) based on the authors’ own concept of comparing the means in individual groups for each variable with the total means and, on this basis, indicating factors with high, medium and low values within the groups. The authors’ contribution to the research on the innovativeness of economies also results from the determination of the relationship between the level of innovativeness of the European Union economies and the type of NIS.
The article consists of the following sections: Introduction; Literature Review; Methodology; Results and Discussion; and Conclusions. The Introduction presents, among other content, the aim of the paper and the research hypothesis, as well as demonstrates the need for research in the field of national innovation systems. The theoretical part of the article reviews the literature in the field of National Innovation System issues and presents the definitions and selected classifications of National Innovation Systems in the world. In the empirical part, the level of innovation in the EU countries was assessed using the synthetic measure of development by Z. Hellwig, called the synthetic measure of development (SMD). Based on the obtained values of the synthetic measure of development (innovation), a ranking of the innovation of the economies of the European Union countries was compiled and groups of countries with a similar degree of innovation in the economy were distinguished. The developed ranking of the EU countries was compared with the National Innovation Systems classification presented in the theoretical part of the article. The study covered 2010 and 2019. The choice of years was dictated by taking into account the most recent statistical data and the need to show the studied phenomenon over a 10-year time horizon. The data used in the study was obtained from the Eurostat and OECD databases.

Literature Review—The Concept and Classifications of the National Innovation System

The concept of the national innovation system was created in the 1980s and 1990s (Lopez-Rubio et al. 2020; Alnafrah 2021; Lopez-Rubio et al. 2021). It has become the focus of the following economists: Ch. Freeman (Freeman 1992), R. Nelson and N. Rosenberg (Nelson and Rosenberg 1993), P. Patel and K. Pavitt (Patel and Pavitt 1994a, 1994b), C. Edquist (Edquist 1997) and B.A. Lundvall (Lundvall 1992). It should be emphasized that the problems concerning the determinants of innovative processes were discussed earlier in the economic literature. Nevertheless, they were treated as elements of considerations on the industrial, scientific and technical policy (Edquist 1997, p. 52). Various definitions of the national innovation system exist in the economic literature. An overview of these definitions is presented in Table 1.
The literature also includes many typologies of national innovation systems, distinguished based on various criteria (Schmoch et al. 2006), i.e., from the point of view of the type of innovation that dominates in a given system, and the areas determining the development of the system (Patel and Pavitt 1991, pp. 35–58; Schmoch et al. 2006) or institutional factors (regulations in the sphere of educational, scientific, technological, and innovative activity) (Amable et al. 2008; Kotlebova et al. 2020) and according to the way of interactions between science and economy (OECD 2000, pp. 168–72; Grzelak 2011; Radicic et al. 2016; Roszko-Wójtowicz and Białek 2018; Bal-Domańska et al. 2020; Gorączkowska 2020).
An attempt at a multi-level NIS typology is a universal approach, made with the method of hierarchical cluster analysis, based on the following classification criteria (this classification was developed by M. Godinho, S. Mendonça, T. Pereira and is hereinafter referred to as the GMP classification) (Weresa 2012):
(a) the internal market, described by the following indicators: GDP in absolute terms, GDP per capita, and population density;
(b) institutional conditions, measured by income inequality, life expectancy, demographic structure, and corruption index;
(c) tangible and intangible investments, as shown by expenditure on R&D and education per capita and as % of GDP;
(d) theoretical and applied knowledge, described in terms of the percentage of population with secondary and tertiary education, percentage of students of exact sciences, number of research workers in relation to total employment, and number of publications per capita;
(e) the structure of the economy, presented by the share of high-tech industries in exports and GDP, the turnover of domestic R&D companies on a global scale in relation to GDP;
(f) connections of the economy with the environment, measured by the balance of foreign trade and direct investment in relation to GDP, broadband Internet connections;
(g) knowledge diffusion, described by the following indicators: Internet access, cellular network density, number of ISO 9000 and ISO 1400 certificates per capita;
(h) innovation, measured by the number of patents and trademarks per capita.
On the basis of the above-mentioned measures, two main types of NSI were distinguished: (1) developed innovative systems, (2) developing innovative systems. Within these NIS types, three sub-types are distinguished in each group, some of which have their types listed. This typology is presented in Table 2.

2. Methodology: Grouping Linearly Ordered Objects

The main goal of grouping objects is to create groups of objects (clusters) that are as homogeneous as possible due to the similarity in terms of the internal structure of the variables that describe this object. There are two criteria for grouping: homogeneity and heterogeneity. The first criterion assumes that objects that belong to the same group should be as similar to each other as possible. On the other hand, the heterogeneity criterion says that objects assigned to different groups should be as different from each other as possible (Panek 2009, p. 105). In the literature, methods for grouping objects are classified according to various criteria. The article uses one of the methods of grouping linearly ordered objects–the method of standard deviations. The diagram below presents the subsequent stages of the research procedure—from the building of the database with the variables to the determining of individual values of the synthetic measure (Figure 1).
The starting point of the standard deviation method is the linear ordering of the objects. The objects are divided into groups based on the study of deviations of the value of the synthetic variable of the objects from the mean value of the synthetic variable with the values of standard deviations. The set of examined objects is divided into four groups, or classes. The objects are assigned to specific classes based on the boundaries of the measurement ranges q i determined using the arithmetic mean q ¯ and standard deviation S q as follows:
Class   I :   q i     q ¯ + S q
Class   II :   q ¯ + S q > q i     q ¯
Class   III :   q ¯ > q i   q ¯ S q
Class   IV :   q i < q ¯ S q
Linear ordering methods are often used in the field of economics in ranking and classification studies of multidimensional objects and phenomena. In the literature, in the field of multivariate comparative analysis, many linear ordering procedures have been developed, including standard and non-standard methods. They differ, among others, by methods of determining weights of variables, methods of normalizing variables and the method of constructing a synthetic variable. In the literature, one can find many original ideas on this subject: Perkal (1953); Hellwig (1968); Strahl (1978); Borys (1978); Hwang and Yoon (1981); Kukuła (2000) Kukuła and Luty (2015); Młodak (2006); Walesiak (2014); Kisielińska (2016). Therefore, a problem of choosing the right line-ordering procedure for analyzing statistical data emerges. In this study, the Hellwig synthetic measure was used, which allows for the linear ordering of the EU countries with the use of a standard.
In the present study, the objects were ordered linearly due to one aggregate variable which synthetically describes many variables characterizing the ordered objects. From the geometric point of view, it is the transfer of points describing objects in a multidimensional space of variables into a line representing an aggregate variable. The most important of the stages of linear ordering is the choice of a method that aggregates diagnostic variables. Due to the analytical form, these methods are divided into standard and non-standard methods. In this analysis, a synthetic measure was used, which enables linear ordering of objects with the use of a pattern. This measure is the “measure of economic development” proposed by Z. Hellwig in 1968 (Bąk 2013).
The basic stages of linear ordering using the Hellwig’s economic development measure are as follows (Bąk 2013):
  • Building a database contaning the values of admissible diagnostic indicators;
  • Initial data analysis: descriptive analysis of diagnostic indicators (measures of position, variability), correlation analysis, reduction and selection of diagnostic variables;
  • Determining the nature of variables (stimulants, destimulants, and nominants). A variable is a stimulant if its growth positively affects the assessment of the subject. A variable is a destimulant if its decreasing values have a positive effect on the object’s assessment. Nominant is a variable whose values have a positive effect on the object up to a certain point, and when this threshold is exceeded, it adversely affects the assessment of the object;
  • Standardization of variables:
    z ij = x ij x ¯ j S ( x j )
    where:
    • x ¯ j —arithmetic mean of the next feature; Sj—standard deviation of another feature; zij—standardized value;
  • Calculation of pattern coordinates:
    z 0 j = { max i { z i j } f o r s t i m u l a n t s min i { z i j }   f o r d e s t i m u l a n t s
  • Calculation of the distance from the pattern:
    d i 0 = j = 1 m ( z i j z 0 j ) 2
  • Determining the value of the measure of economic development:
    q i   ( usually   q i [ 0 ; 1 ] )     q i = 1 d i 0 d 0
    where :   d 0 = d ¯ 0 + 2 s d ,   d ¯ 0 = 1 n i = 1 n d i 0 ,   s d = i = 1 n ( d i 0 d ¯ 0 ) 2
The results of the research carried out in accordance with the above-presented procedure are described in the next paragraph.

3. Results and Discussion: Classification of the European Union Countries in Terms of the Level of Innovation of the Economy

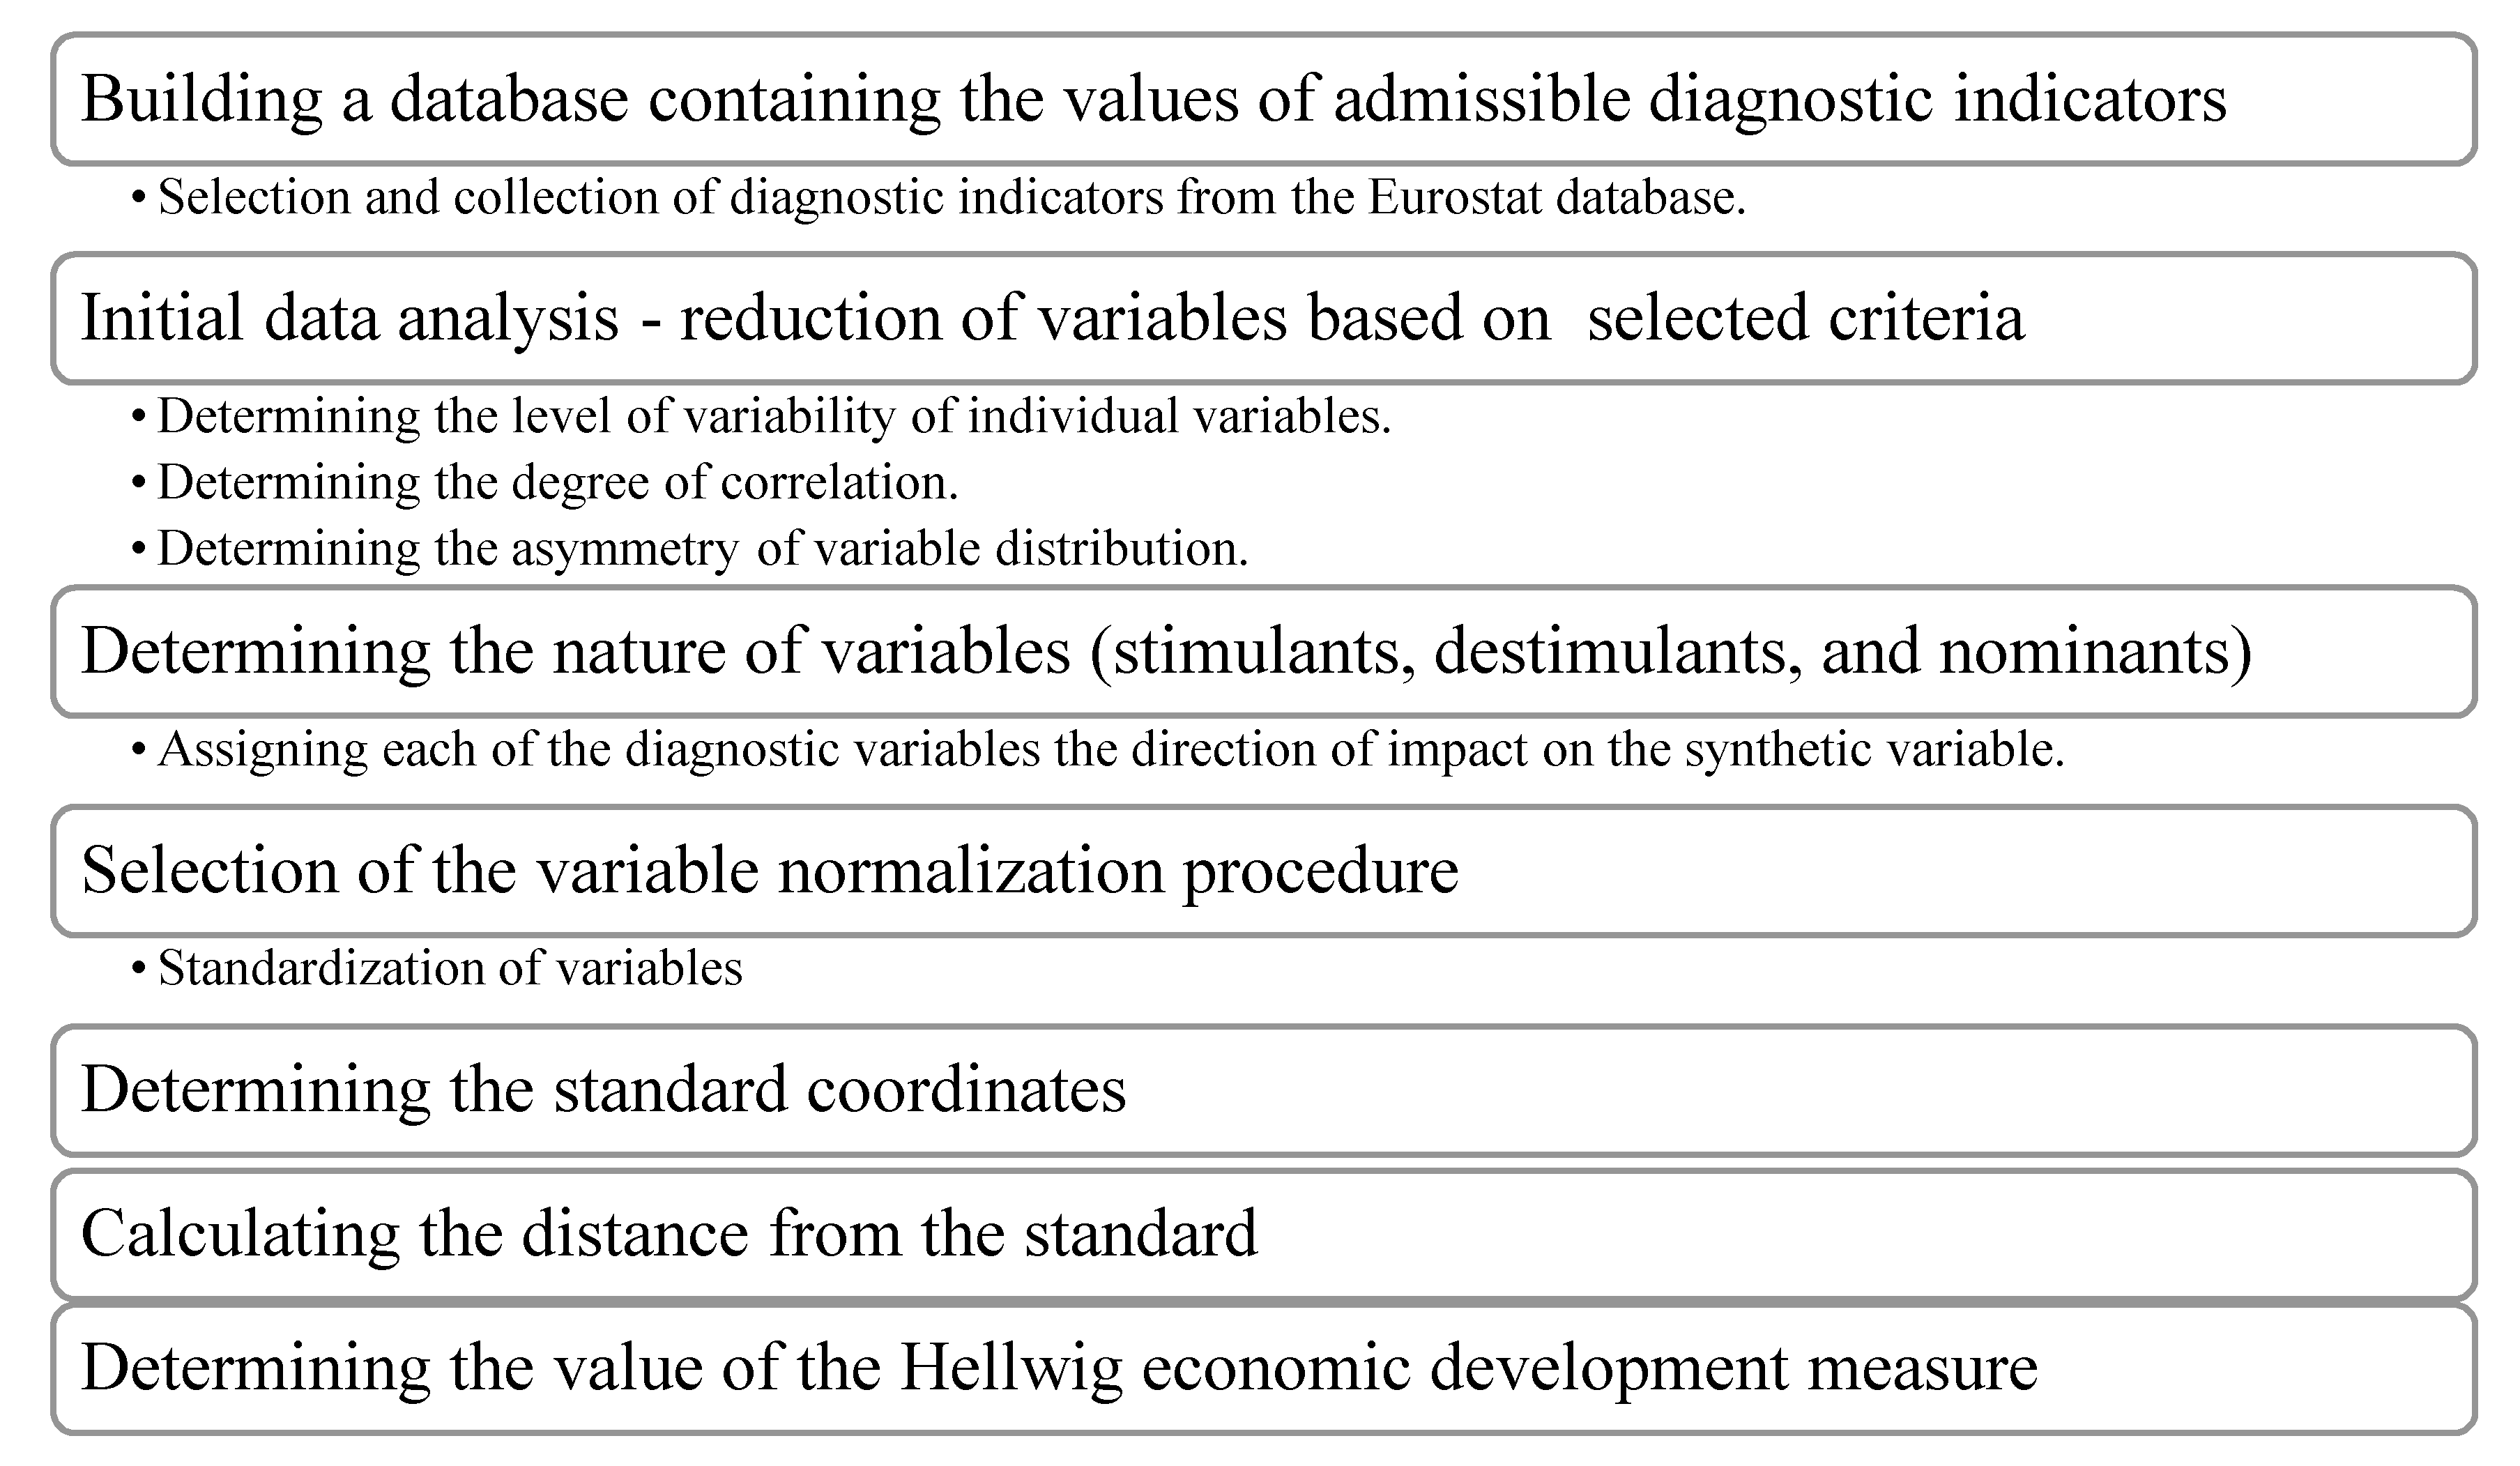
The aim of the empirical study is to classify the EU countries according to the level of innovation of their economies in 2010 and 2019. One of the methods of multivariate statistical analysis was used in the study: the method of standard deviations of linearly ordered objects. In the context of measuring and assessing the innovation of economies, apart from the problem of data availability for the analyzed period, there is also the problem of selecting indicators that best describe this phenomenon. Economic literature devotes a great deal of space to determinants of NIS development (Seidel et al. 2013; Roszko-Wójtowicz and Grzelak 2020). Each of these determinants reflects an aspect of the innovation system, and they may be grouped into three levels: a micro, meso and macro level. The micro level (i) consists of private and public institutions that provide support for main actors in the innovation system, while the meso level (ii) is considered as an important intermediary tool to convert policy decisions into practice. Generally, at the meso level, we find clusters, technology transfer centers, innovation service providers, and funding agencies. Meanwhile, the macro level (iii) is a level of national policies: laws, regulations, training and education, and master plans.
This study refers to the methodological proposals contained in the Oslo Manual (OECD/Eurostat 2018) which is the result of the joint work of Eurostat and OECD. Following the Oslo methodology, 13 variables, potential indicators of innovation, were included in the input data set. The set of these variables is presented in Table 3. All potential indicators describing innovation were treated as stimulants, i.e., variables whose increasing values have a positive impact on the studied phenomenon.
In the first step of preliminary data analysis, the usefulness of indicators for the analysis was assessed, using measures of descriptive statistics (Table 4). However, in the case of this study, at this stage, there is transition from a set of acceptable indicators, determined based on the substantive and formal premises, to a set of diagnostic indicators (Panek 2009, pp. 20–21). At this stage, no variable was eliminated as all indicators were characterized by high volatility. The next stage of the preliminary data analysis involves the assessment of the correlation of potential diagnostic indicators. For this purpose, among many methods of reduction and selection of diagnostic variables due to their informational potential, the parametric Hellwig method is used. This method is based on the Pearson linear correlation coefficient matrix and removes those features that are strongly correlated with the remaining features, usually at a level greater than 0.9 (and this was also the level adopted in this study). As a result of correlation analysis, the following indicators were removed from further analysis: number 1 (total R&D expenditure in EUR per capita) in 2010 and numbers 1 and 4 (expenditure on R&D in the higher education sector in EUR per capita) in 2019.
The results of the calculations in line with the stages described in the Methodology section, and thus the classification and ranking of the EU countries in terms of innovation, are summarized in Figure 2 and 
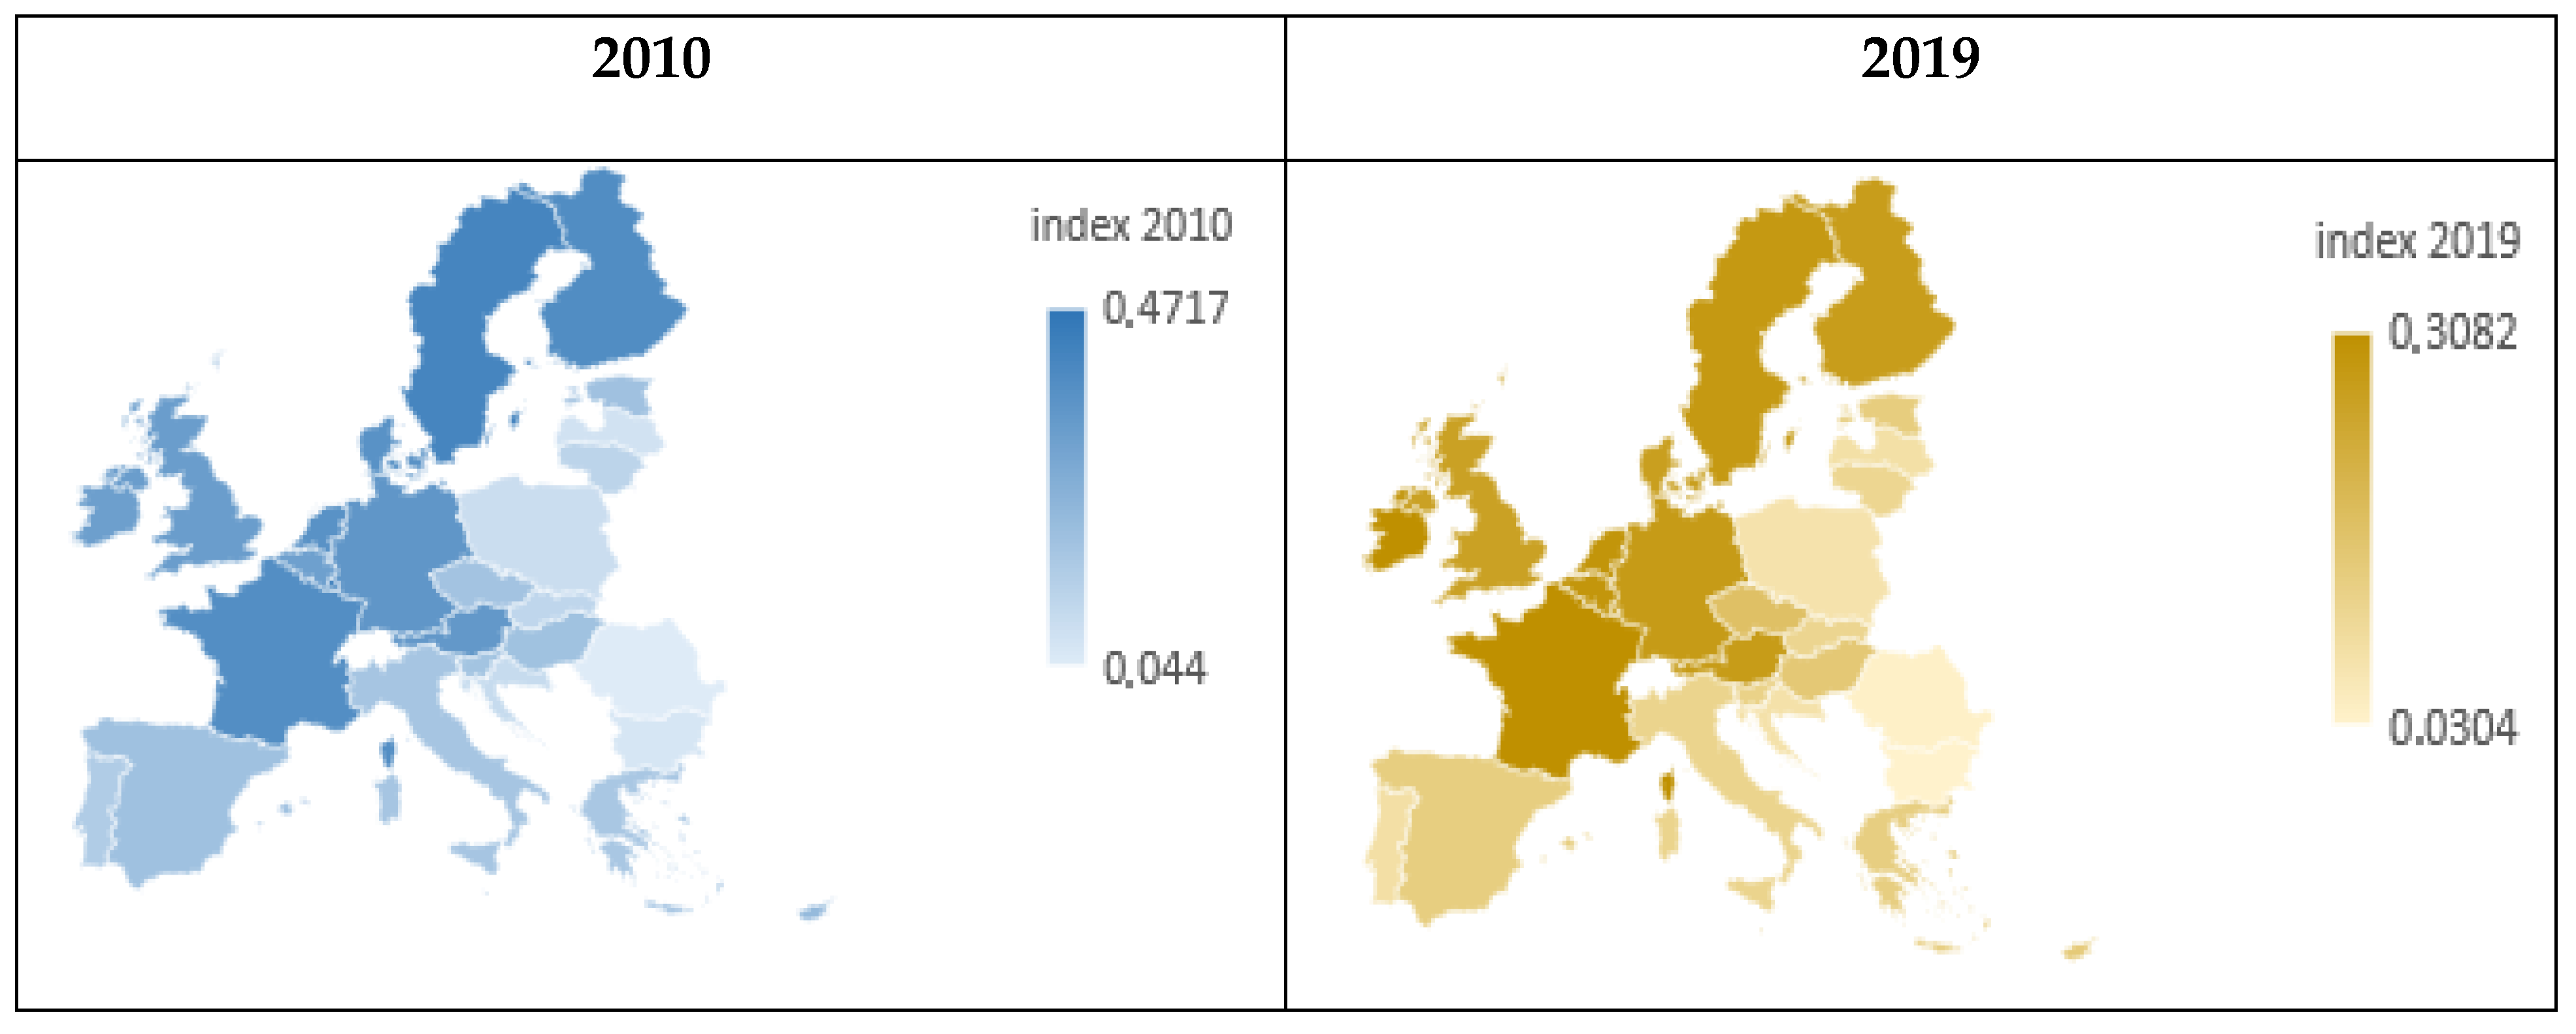
Figure 3. Based on the value of the synthetic measure of innovation, the EU countries were ranked from “best” to “worst” (Figure 2). Based on the value of the measure qi, taking into account 12 (2010) or 11 (2019) features assigned to individual countries, it can be concluded that in 2010 Luxembourg (0.4717), Sweden (0.4140), Finland (0.3864), France (0.3823), Denmark (0.3674) and the Netherlands (0.3664) were the most innovative EU countries. In 2019, group 1, i.e., the group of the most innovative countries, was more numerous. For example, Ireland (0.3082), Belgium (0.2916), Germany (0.2775), and Austria (0.2751) joined the group. Luxembourg, the innovation leader in 2010, left the group. Group 1, regardless of the year under study, is dominated by the Scandinavian countries, which are generally recognized as the most innovative in Europe. Group 3 is the most numerous, 11 countries were classified into it in 2010 and 10 countries in 2019. This group includes mainly southern European countries and the countries of the former Eastern Bloc. The results show that in 2010 the least innovative countries included Croatia, Poland, Latvia, Bulgaria and Romania. Portugal joined these countries in 2019. Unfortunately, in the analyzed period, no significant progress was made in increasing the level of innovation of the Polish economy compared to other EU countries. Poland ranks low in the innovation ranking and belongs to the last group in the years 2010 and 2019. The conducted study is part of the trend in research on innovation where changes over time are assessed (Roszko-Wójtowicz and Białek 2019).
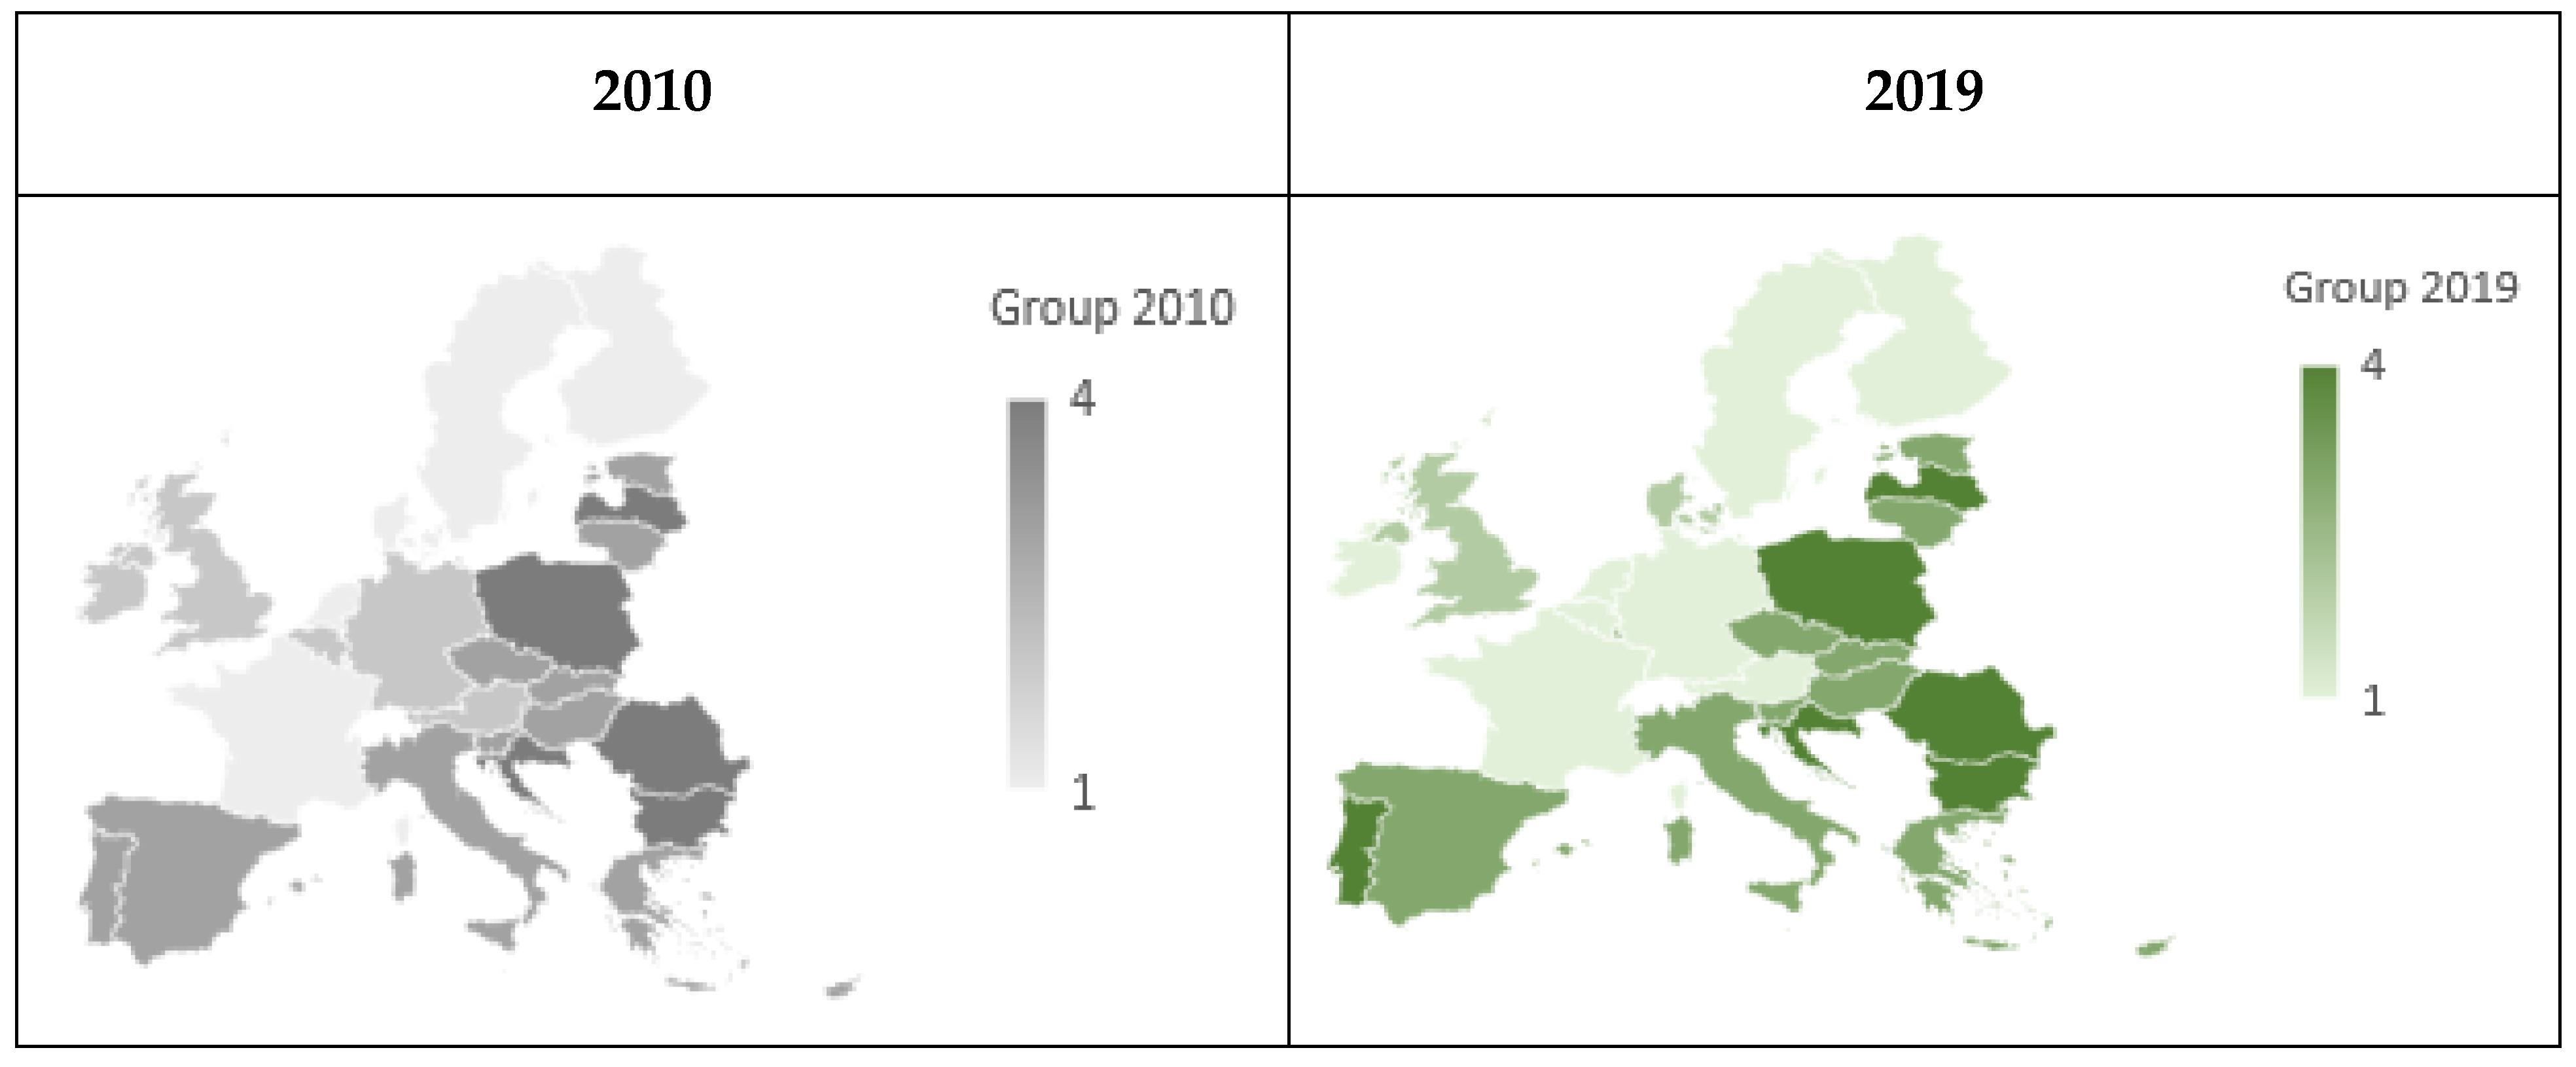
Based on the value of the synthetic measure for the EU countries ( q i ), obtained as a result of applying the Hellwig economic development measure, countries were grouped according to the level of economic innovation in 2010 and 2019, using standard deviations (Figure 3). The values of the arithmetic mean and standard deviation of the synthetic variable were as follows: in 2010, q ¯ = 0.235497 and S q = 0.118259; and in 2019, q ¯ = 0.178826 and S q = 0.089795. Based on the above-presented values, the ranges of variability of the synthetic measure were determined for groups of EU countries, which are summarized in Table 5.
The classification of countries into particular groups in 2010 is presented below (Figure 3):
Group 1.
Luxembourg, Sweden, Finland, France, Denmark, The Netherlands
Group 2.
Germany, Austria, United Kingdom, Ireland, Belgium, Malta
Group 3.
Cyprus, Spain, Estonia, Hungary, Czech Republic, Slovenia, Italy, Greece, Portugal, Lithuania, Slovakia
Group 4.
Croatia, Poland, Latvia, Bulgaria, Romania
The classification of countries into particular groups in 2019 is presented below (Figure 3):
Group 1.
Ireland, France, The Netherlands, Belgium, Sweden, Germany, Austria, Finland
Group 2.
Denmark, Luxembourg, United Kingdom, Malta
Group 3.
Czech Republic, Hungary, Cyprus, Estonia, Spain, Greece, Slovenia, Italy, Slovakia, Lithuania
Group 4.
Portugal, Latvia, Croatia, Poland, Romania, Bulgaria
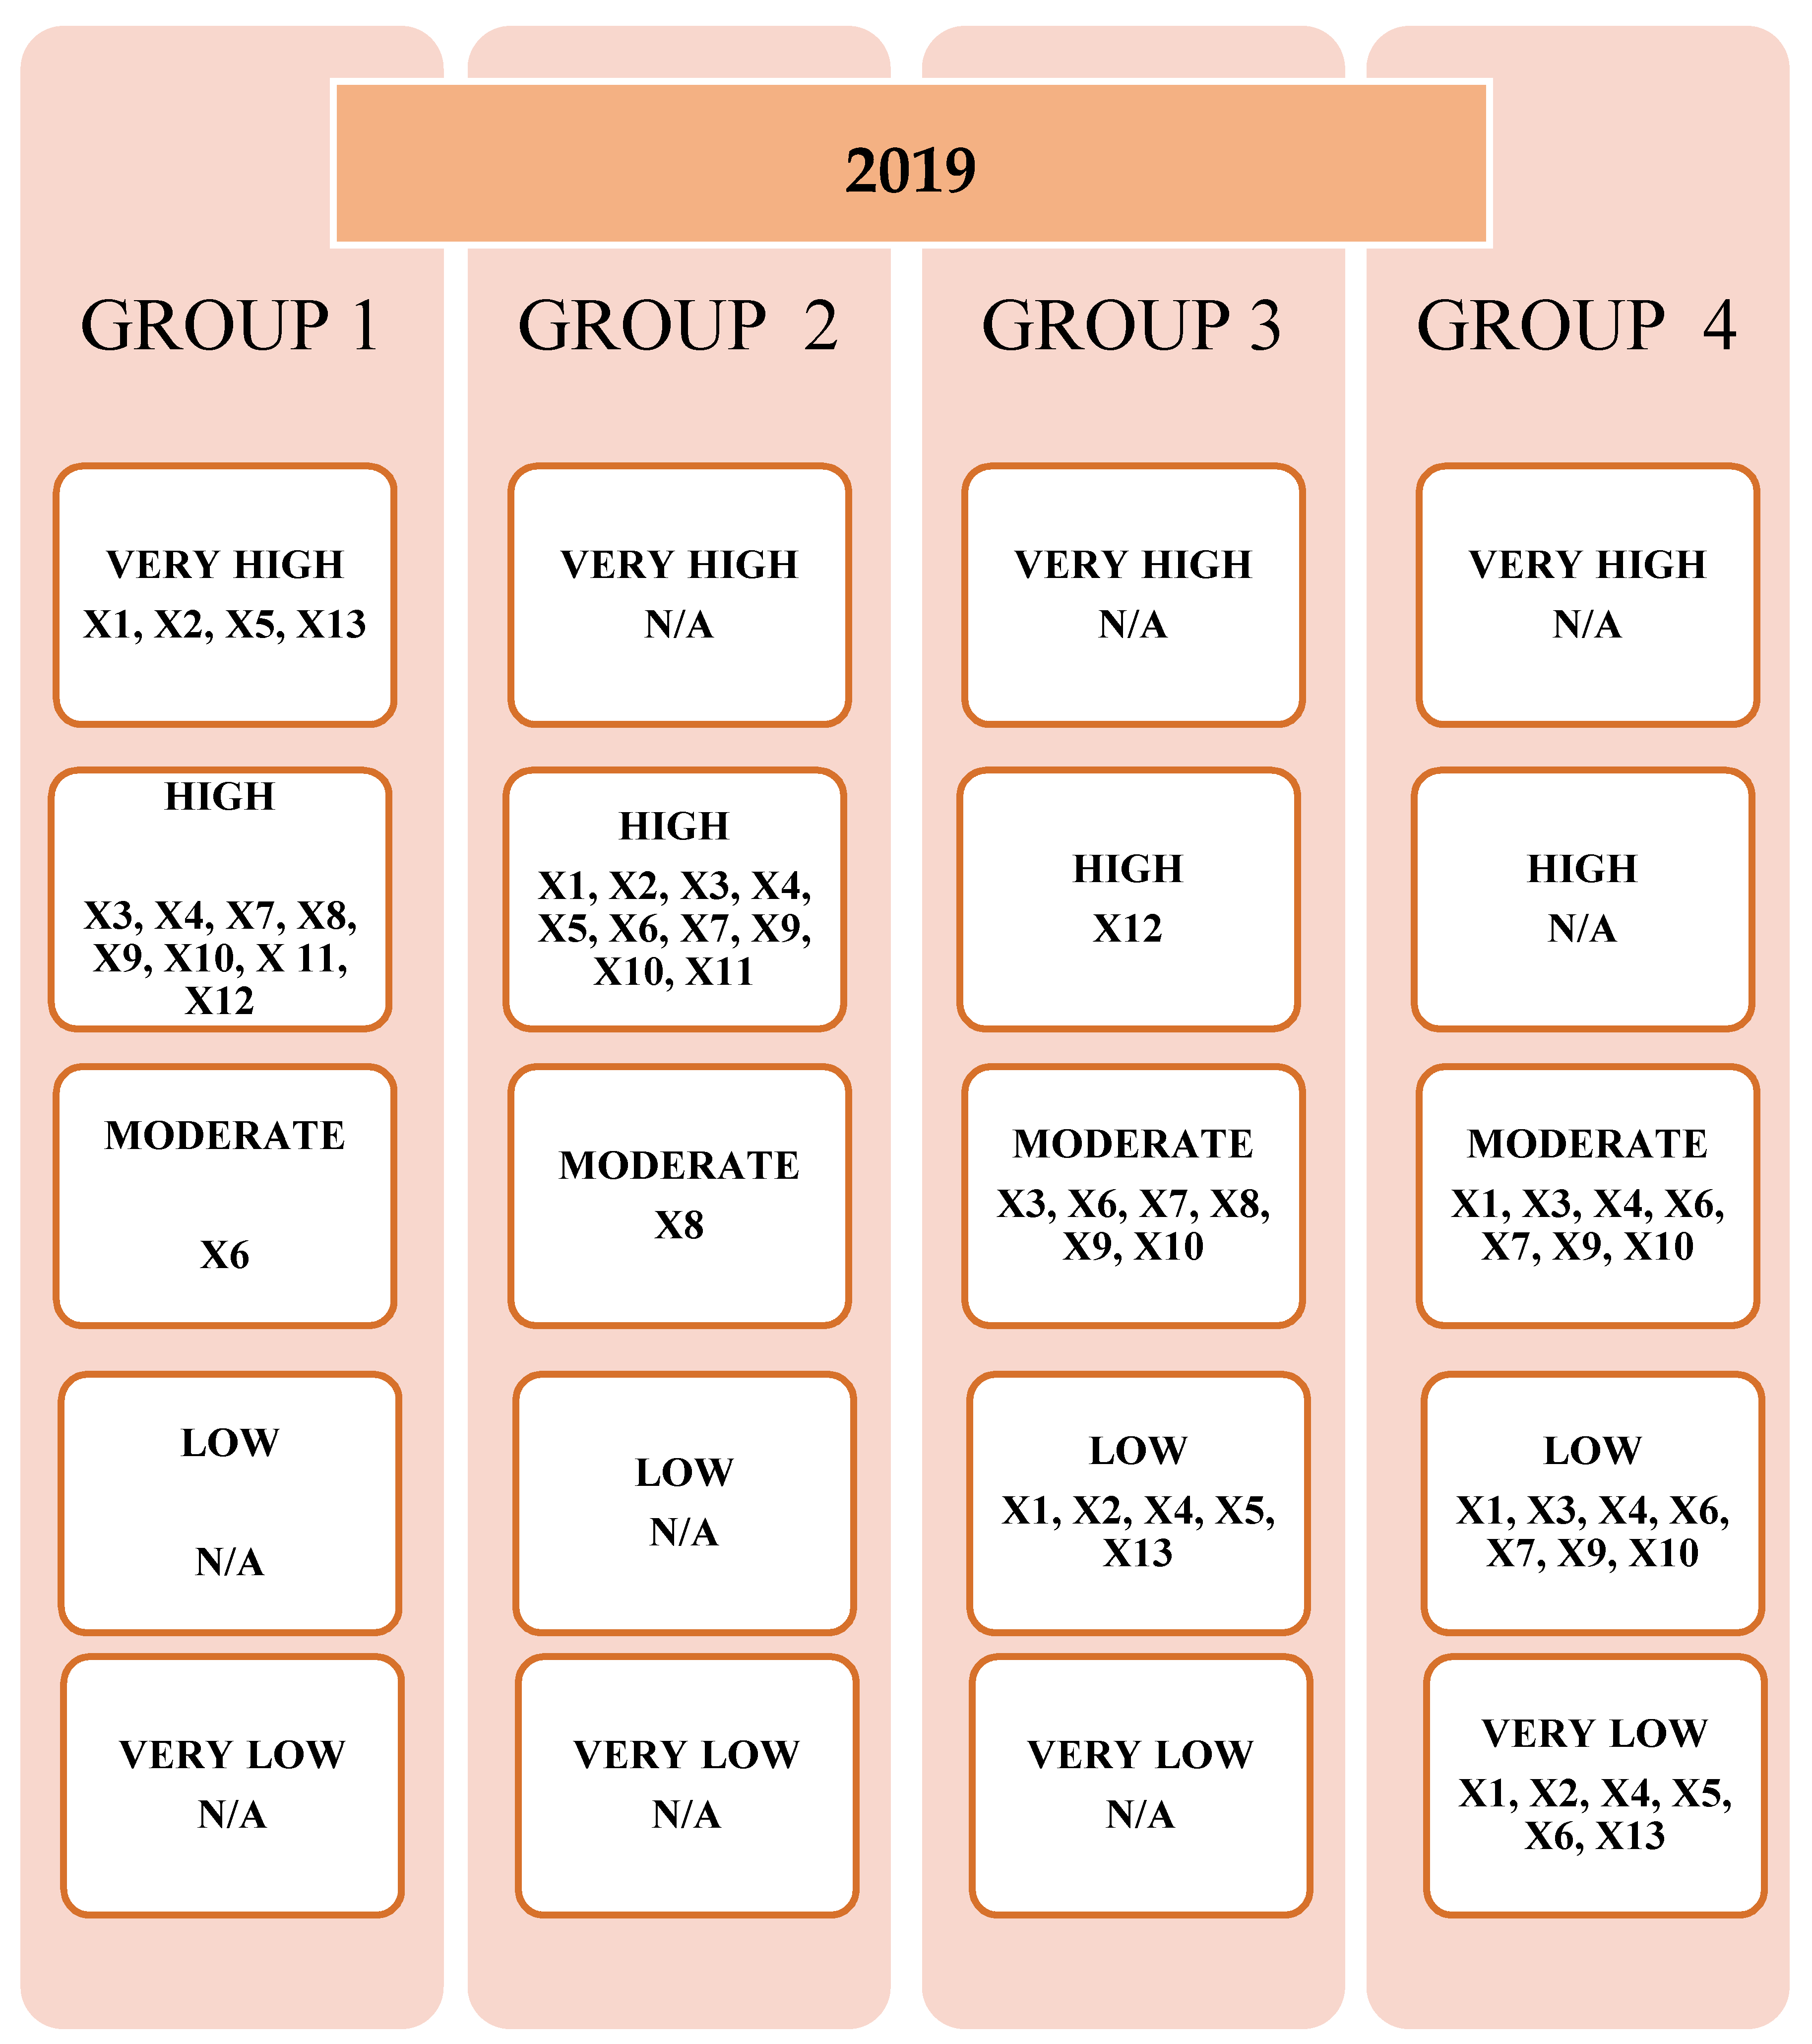
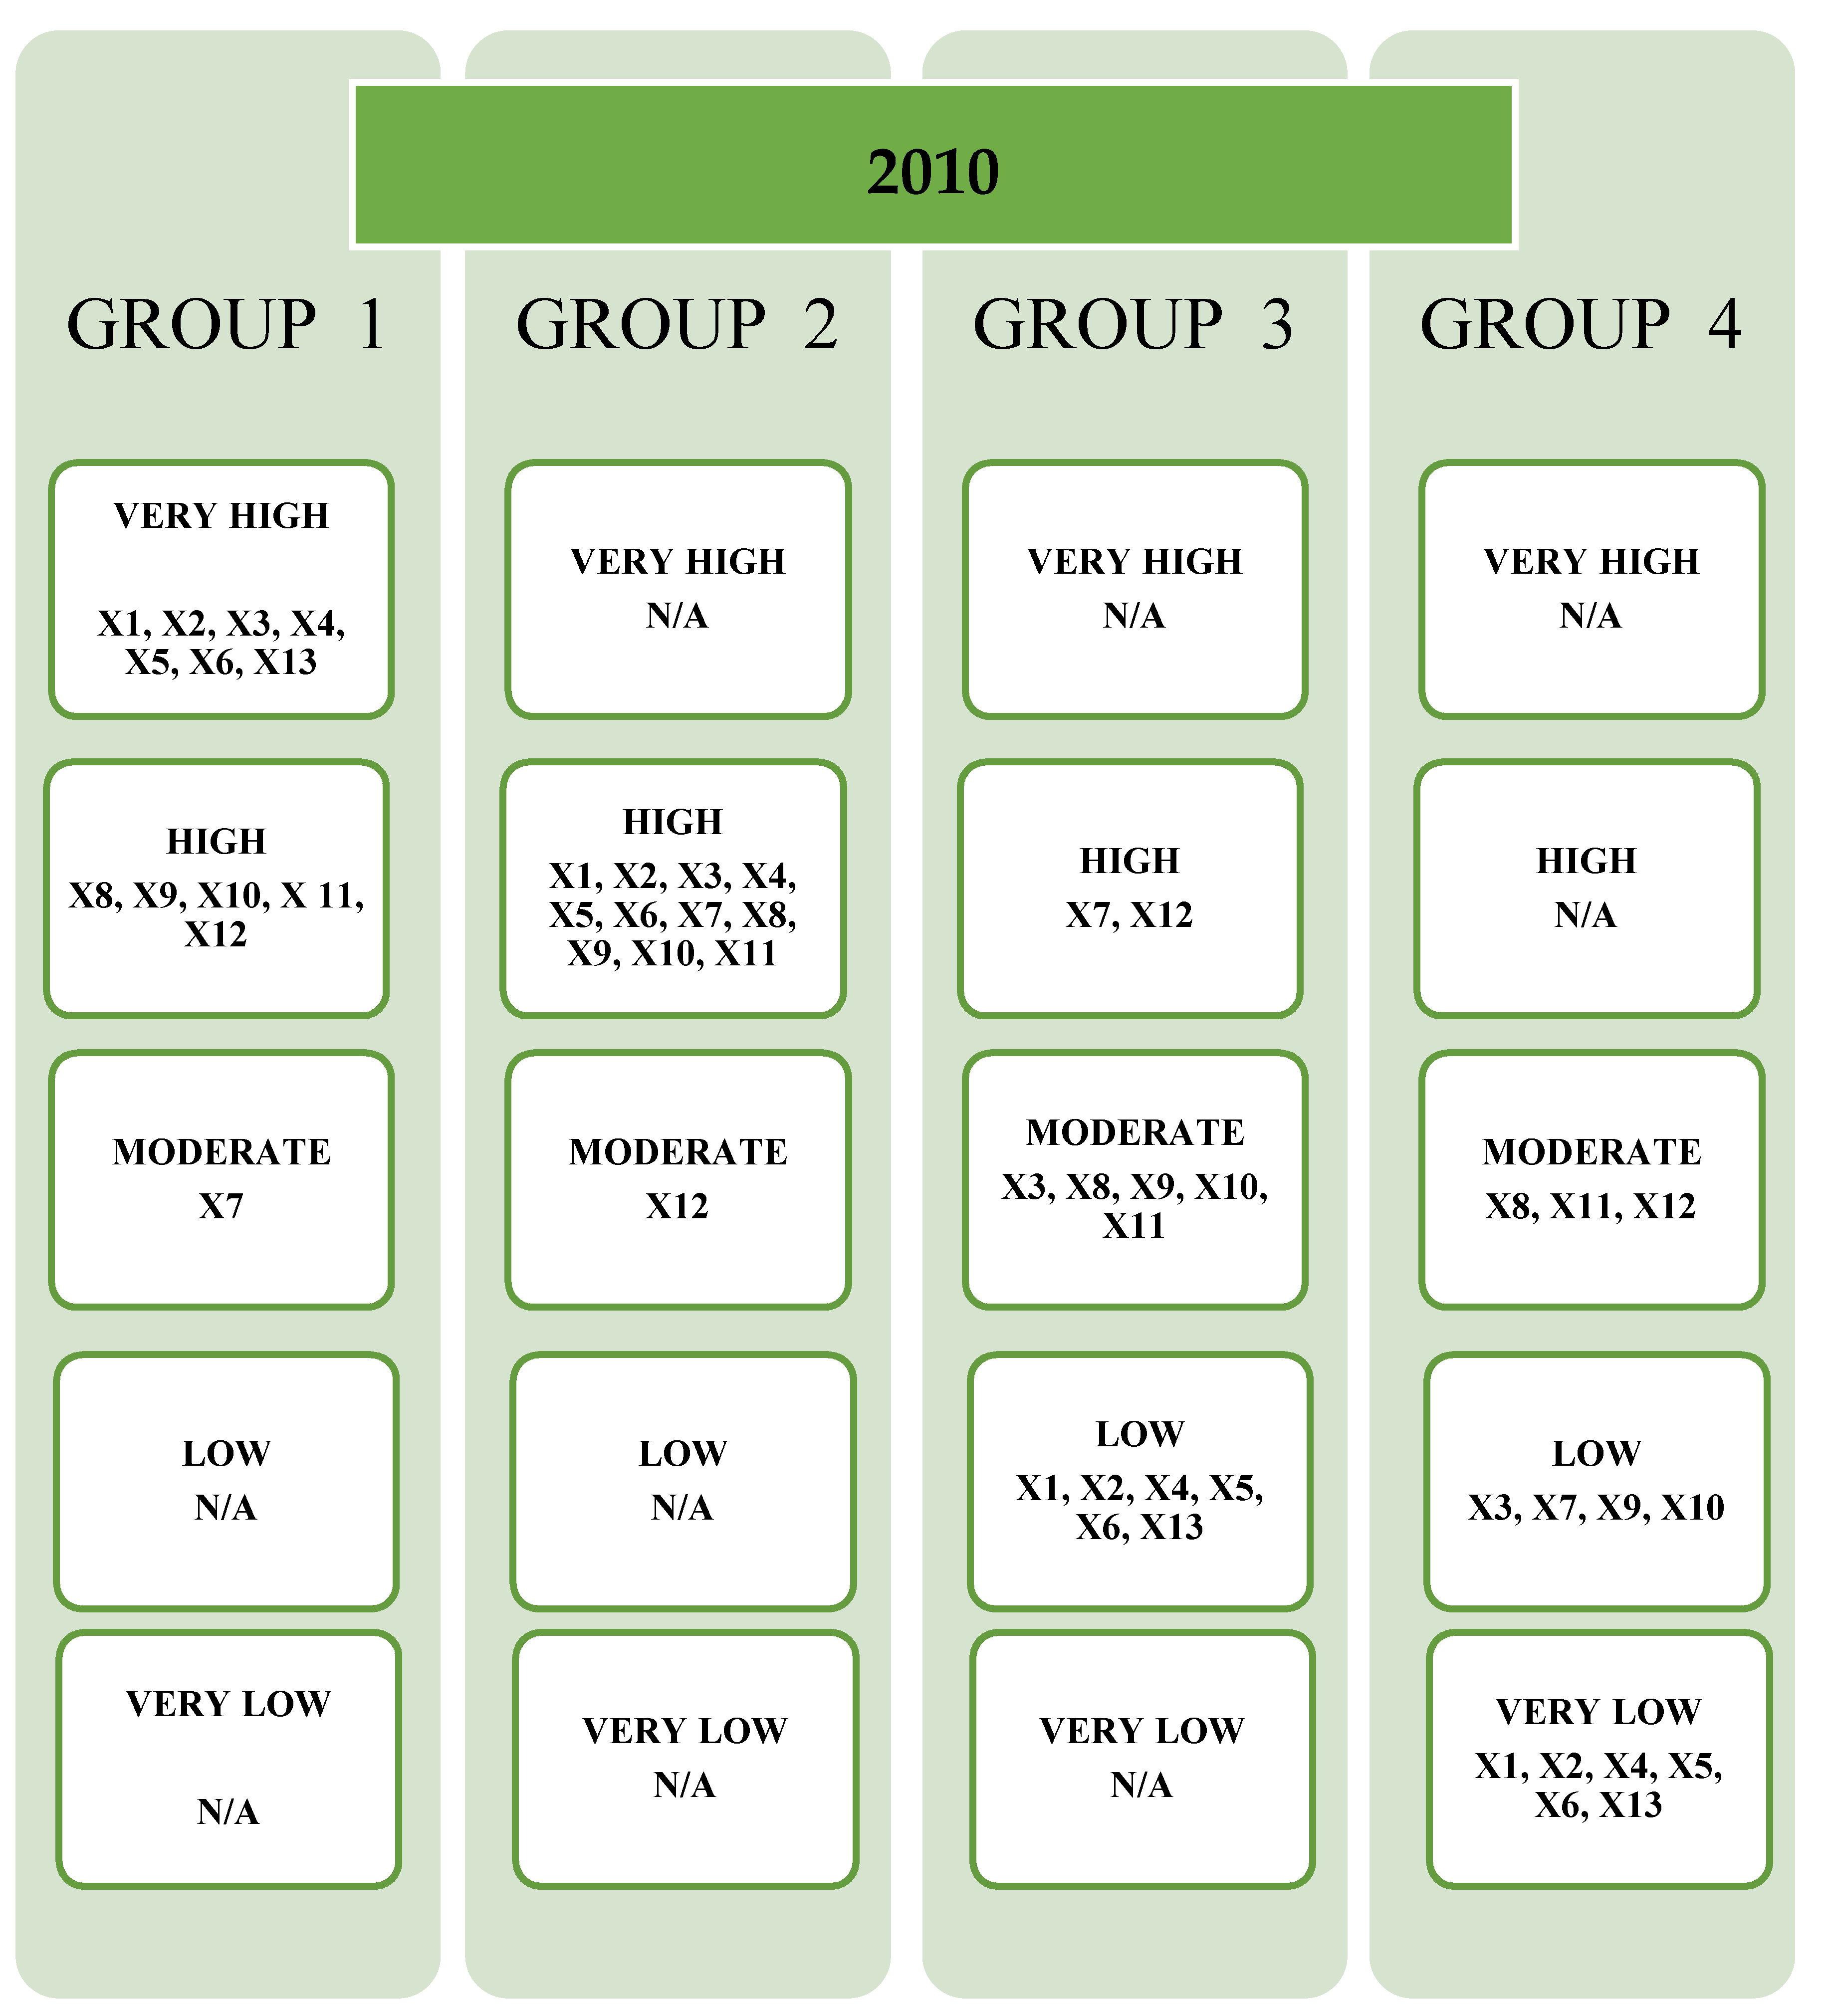
Comparing the means in individual groups with the average levels of the indicators in total, the following classification was made:
Very high level: the value of the indicator in the group is at least twice the average value for all the analyzed countries.
High level: the value of the indicator in the group is higher than the average value for all the analyzed countries, but not twice as high.
Moderate level: the value of the indicator in the group is lower than the average value determined for all the analyzed countries, and constitutes from 60% to 99% of this value.
Low level: the value of the indicator in the group is lower than the average value determined for all the analyzed countries, and constitutes from 20% to 59% of this value.
Very low level: the value of the indicator in the group is lower than the average value determined for all the analyzed countries, and constitutes less than 20% of this value.
In 2010, compared to other groups, group 1 achieved the best results, significantly exceeding the levels of individual variables recorded in the other groups. Group 1 is the best in terms of high-tech patent applications to the EPO per million inhabitants and triadic patent family applications per million inhabitants. Despite this fact, group 1 is the worst in terms of the share of students as a percentage of the population aged 18 years, with the mean value not only below the total mean, but also significantly lower than that recorded in groups 2 and 3. Group 2 is the least diversified from the point of view of the mean values of individual indicators and their relation to the total mean. This group performs best in terms of student share as a percentage of the population at the age of 18. Likewise, group 3 performs best in terms of the share of students as a percentage of the population aged 18 and the share of product or process innovative enterprises engaged in any cooperation in the total number of innovative enterprises. Group 1 is the best in terms of high-tech patent applications to the EPO per million inhabitants and triadic patent family applications per million inhabitants. On the other hand, the greatest advantage of group 4 is the share of employment in knowledge-intensive activities in total employment, with the mean value for this group being the lowest in comparison to the means of the other groups (Table 6, Table 7 and Table 8, Figure 3 and Figure 4). Thus, group 4 is the worst in comparison with the other groups. It is the only group with such low mean values for as many as five variables (Table 6, Table 7 and Table 8, Figure 3 and Figure 4).
Similarly to 2010, group 1 is also the best compared to the other groups in 2019. This group is distinguished in particular by very high values of the rate of high-technology patent applications to the EPO per million inhabitants and the triadic patent family applications per million inhabitants. Group 1 is the worst in terms of EU trademark applications per million inhabitants. Group 2, as in 2010, is the least diversified from the point of view of the mean values of individual indicators and their relation to the total mean. At the same time, group 2 is the best in terms of EU trademark applications per million inhabitants. Group 3 performs best in terms of the share of students as a percentage of the population aged 18 and the share of product or process innovative enterprises engaged in any cooperation in the total number of innovative enterprises. Group 1 is the worst in terms of high-tech patent applications to the EPO per million inhabitants and triadic patent family applications per million inhabitants. In 2019, as in 2010, group 4 is the worst compared to the other groups, it is the only group where such low mean values were recorded for as many as three variables. The greatest advantage of this group is trade in high technologies in EUR million as a percentage of total trade and the share of employment in knowledge-intensive activities in total employment, though the mean values for these variables in this group are still lower than the means in the other groups (Table 6, Table 7 and Table 8, Figure 3 and Figure 4).
The analysis conducted shows that although the composition of individual groups has changed over the years, the general characteristics of these groups are relatively stable over time, especially when the subsequent issues are considered (Raghupathi and Raghupathi 2017; Roszko-Wójtowicz and Grzelak 2020). The following variables are definitely determinants of innovation: total R&D expenditure in EUR per capita; R&D expenditure in the enterprise sector in EUR per capita; high-tech patent applications to the EPO per million inhabitants; and triadic patent family applications per million inhabitants. The variables that have a small impact on the high level of innovation include: EU trademark applications per million inhabitants; and the share of students as a percentage of the population aged 18 years. In the case of the groups with the lowest levels of innovation, it should be emphasized that their weakest point is low R&D expenditure, which certainly translates, at least to some extent, into low rates of patent applications, especially those in the field of high technologies and triadic patent families. Despite the shifts between the groups, the best results are achieved by the Scandinavian countries, the Netherlands and France. In 2019, Austria and Germany moved to a better, more innovative group. Over the years, the differentiation between countries has diminished, the values of the coefficients of variation have decreased in the case of eight variables. In both analyzed years, group 2 turned out to be the most numerous.
It is significant that the indicators concerning the higher education system in the countries belonging to group 3 are favorable. Nevertheless, it should be emphasized that they only testify to a high level of formal education, and not to a high quality of teaching, which is clearly indicated by the level of innovation in the economies of the countries belonging to the analyzed group. The education system in these countries does not foster the promotion of creativity and the ability to cooperate, nor does it encourage the building of social capital. An insufficient level of social capital development is also evidenced by the lack of lasting links between the sphere of research and scientific institutions and the sphere of enterprises. According to the Global Competitiveness Report, in 2019, the Polish economy ranked 74th among 141 countries under consideration based on the indicators on cooperation and diversification. Poland ranked 70th in terms of the level of development of clusters, while the country held the 116th position in terms of advanced cooperation in the field of research and development between enterprises and universities or research institutions (Schwab 2019). It can therefore be concluded that Poland lacks an effective system of cooperation between these spheres. On the one hand, entrepreneurs complain that the innovative projects offered by R&D institutions do not meet their needs and show a passive approach to the commercialization of research results. On the other hand, representatives of R&D institutions believe that enterprises have little interest in using research results, as their strategy is focused mainly on the use of simple resources for increasing labor productivity. The reason for this phenomenon can be seen in the shortcomings of social capital, manifested, among others, in the inability to perform tasks jointly, the lack of trust, and the social unwillingness to become engaged in public–private activities.
Moreover, in a situation of a lack of incentives for cooperation between the scientific and research sphere and entrepreneurs, it should not be surprising that expenditures on R&D activities in the economies belonging to groups 3 and 4 are at a relatively low level-in Poland it is only 49% of the EU average, while expenditures on innovation not connected with R&D activities exceed the EU average by more than 29%. It should also be added that the level of state expenditure on R&D activity in Poland is one of the lowest among the EU and OECD countries—according to the European Innovation Scoreboard, the share of public expenditure in 2019 was 53% of the EU average. It is also below the average level observed in the Visegrad Group countries.
This situation results in low rates of high-tech patent applications to the EPO per million inhabitants and triadic patent family applications per million inhabitants in the countries belonging to group 3. Research shows that there is a positive correlation between patent activity and the level of development of the country (Vonortas 2009). In highly developed countries, there is a traditional culture of inventiveness (e.g., Germany, the Anglo-Saxon countries and the Far East), and patent activity is a common phenomenon. Countries with a lower level of development, however, lack well-established traditions and institutions in this field, hence patent activity is weak.

4. Conclusions

Summarizing the considerations made so far, it must be stated that four groups of the EU countries were distinguished in the study according to the level of innovativeness of the economy (Figure 2 and Figure 3). In order to answer the question whether the type of NIS determines the level of innovation of the economies of the European Union countries, the classification of countries in terms of the level of innovation of the economy should be compared with the NIS classification presented in Section 2 (GMP classification). Comparing these classifications, one can see the compliance of the empirical classification with the NIS classification developed by Godinho, Mendoca, Pereira (GMP classification) (Table 2). This classification lists two types of NIS–developed and developing, each of which has three subtypes. In the study presented in the article, the EU countries were divided into four groups on the basis of a synthetic measure of innovation of the economy. A comparison of the results of both lists allows us to state that the first two groups of the EU countries in the ranking of innovation of the economy correspond to the developed NIS in the classification of Godinho, Mendoca, Pereira, while the last two to the developing NIS. The only exceptions are Malta and Spain. Malta, belonging to the developing NIS in the GMP classification, was included in the group of countries with a relatively high level of innovation of the economy, and therefore among the developed NIS in the ranking based on the synthetic measure of innovation. On the other hand, Spain, classified in the GMP ranking among developed NSI, was in this ranking among the developing systems. It is worth noting that the countries with the highest level of economic innovation (belonging to the first group in the innovation ranking)—Ireland, the Netherlands, Finland, Sweden, Germany, Great Britain, Finland and Italy—took the highest places in the GMP classification, i.e., they were among the dynamic and stably functioning national information systems in this classification. Summing up, it should be stated that the type of NIS determines the level of innovation in the EU economies.
In the context of the considerations made in the article, it should be stated that the main aim and the research hypothesis formulated in the introduction to the article have been positively verified; thus, the type of NIS determines the level of innovation of the economy in the EU countries. In 2010 and 2019, the countries included in the developed NIS represented a high level of innovation of the economy (except for Spain, which showed a relatively low level of innovation of the economy in the analyzed years), while the countries belonging to the developing NIS show a relatively lower level of innovation (the exception is Malta, which recorded a relatively high level of innovation of the economy in the analyzed years). The countries included in the first group are the founding countries of the EU and the countries admitted to the EU before 2004, the second group includes the countries admitted to the EU in 2004 and later, which, despite many benefits resulting from integration with the EU, have still not closed the innovation gap and caught up to the most developed European economies.
As far as the research originality is concerned, it should be emphasized that it consists mainly in noting the relationship between the level of innovativeness of the EU economies and the type of NSI. Intergroup comparisons of countries based on the authors’ own concept constitute the added value of the presented study. The comparison of the group means with the total means allows us to identify indicators characterized by high, moderate and low values in the individual groups. The basic limitation that the authors had to face concerns the data used in the article. The authors are aware that conducting primary research (e.g., in enterprises) would certainly have enabled us to carry out more in-depth analysis. Moreover, it is worth drawing attention to the fact that there is always the problem of selection and quality of variables in the case of research on multivariate phenomena. It should be noted that data from official statistics (Eurostat) have been used in this research procedure. Nevertheless, it can be assumed that the research results presented in the paper may provide valuable insights that could be used in the type of economic policy where innovation policy plays an important role. The analysis conducted indicates that increasing the efficiency of NSI results in a higher level of innovativeness of the economy. There is no doubt that the conducted research has confirmed that the countries with the highest level of innovativeness are the countries characterized by a relatively high level of variables related to patents. Therefore, the most developed innovation systems are those in which the applicable regulations, including patent law, are conducive to generating innovation. It is worth adding, however, that the propensity for commercializing the results of creative works is a more complex issue resulting also from the general social attitude and the need to legalize the results of conducted research. Hence, as part of recommendations concerning economic policy, in addition to changes in legislation (facilitation and limitation of procedural red tape), programs for entrepreneurs and citizens that will promote the commercialization of research and scientific work should be mentioned. The key prerequisite for increasing the level of innovativeness of the economy is also to ensure a stable macroeconomic environment and an efficiently functioning institutional system which affect the degree of utilizing the technological potential of the economy. Appropriate allocation of financial resources from the state budget and enterprise funds to R&D activity and implementation is also important. Changes in this area should primarily consist in increasing enterprises’ expenditure on R&D by facilitating access to capital at all stages of R&D project implementation. Budget expenditure on R&D ought to also be increased, provided that private enterprises’ expenditure on this type of activity grows faster as well. For financing innovative ventures in enterprises, the development of the venture capital market (private equity, venture capital) is essential. Increasing the level of innovativeness of the economy requires also the development of permanent connections between entities from the R&D sphere and the business sphere, which is fostered by the growth of social capital.

Author Contributions

Conceptualization, E.D., M.M.G. and E.R.-W.; methodology, M.M.G., E.R.-W.; software, M.M.G., E.R.-W.; validation, E.D., M.M.G. and E.R.-W.; formal analysis, E.D., M.M.G. and E.R.-W.; investigation, E.D., M.M.G.; resources, E.R.-W.; data curation, E.R.-W.; writing—original draft preparation, E.D., M.M.G. and E.R.-W.; writing—review and editing, E.D., M.M.G. and E.R.-W.; visualization, E.R.-W.; supervision, E.D.; project administration, M.M.G. and E.R.-W.; funding acquisition, E.D., M.M.G. and E.R.-W. All authors have read and agreed to the published version of the manuscript.

Funding

This research received no external funding.

Data Availability Statement

The empirical part is based on the Eurostat database, which is publicly available.

Conflicts of Interest

The authors declare no conflict of interest.

References

  1. Alnafrah, Ibrahim. 2021. Efficiency evaluation of BRICS’s national innovation systems based on bias-corrected network data development analysis. Journal of Innovation and Entrepreneurship 10: 1–28. [Google Scholar] [CrossRef]
  2. Amable, Bruno, Remy Barre, and Robert Boyer. 2008. Los sistemas de innovacion en la era de la globalizacion. Post-Print and Working Papers hal-00368634, HAL. Paris: Université Paris1 Panthéon-Sorbonne. [Google Scholar]
  3. Bąk, Andrzej. 2013. Metody porządkowania liniowego w polskiej taksonomii–pakiet pllord. In Taksonomia 20. Klasyfikacja i analiza danych–teoria i zastosowania. Edited by Krzysztof Jajuga and Marek Walesiak. Wrocław: Wydawnictwo Uniwersytetu Ekonomicznego we Wrocławiu. [Google Scholar]
  4. Bal-Domańska, Beata, Elżbieta Sobczak, and Elżbieta Stańczyk. 2020. A multivariate approach to the identification of initial smart specialisations of Polish voivodeships. Equilibrium. Quarterly Journal of Economics and Economic Policy 15: 785–810. [Google Scholar] [CrossRef]
  5. Borys, Tadeusz. 1978. Metody normowania cech w statystycznych badaniach porównawczych (Methods of normalizing characteristics in statistical comparative studies). Przegląd Statystyczny 2: 227–39. [Google Scholar]
  6. Carayannis, Elias, Evangelos Grigoroudis, and Yorgos Goletsis. 2016. A multilevel and multistage efficiency evaluation of innovation systems: A multiobjective DEA approach. Expert Systems with Applications 62: 63–80. [Google Scholar] [CrossRef]
  7. Chaminade, Cristina, Bengt-Ake Lundvall, and Shagufta Haneef. 2018. Advanced Introduction to National Innovation Systems. Cheltenham and Northampton: Edward Elgar Publishing. [Google Scholar]
  8. Dworak, Edyta. 2020. The Innovation Gap between the Polish Economy and the European Union, Comparative Economic Research. Central and Eastern Europe 23: 63–73. [Google Scholar] [CrossRef]
  9. Edquist, Charles. 1997. Systems of Innovation. London: Technologies, Institutions and Organizations, Printer. [Google Scholar]
  10. Freeman, Christopher. 1992. The Economics of Hope. London: Pinter Publishers. [Google Scholar]
  11. Garifullin, Ildar N., and Ildar N. Ablaev. 2015. National Innovation System and Its Structure. Mediterranean Journal of Social Sciences 6: 426–29. [Google Scholar] [CrossRef] [Green Version]
  12. Godinho, Manuel Mira, Sandro Mendonça, and Tiago Santos Pereira. 2003. Mapping innovation systems: A framework based on innovation surveys data. Paper presented at the First Globelics Conference “Innovation Systems and Development for the Third Millenium”, Rio de Janeiro, Brazil, November 2–6. [Google Scholar]
  13. Goel, Vinod K., Ekaterina Koryukin, Madhulika Bhatia, and Priyanka Agarwal. 2004. Innovation Systems, World Bank Working Paper, No. 32. Washington, DC: World Bank. [Google Scholar] [CrossRef]
  14. Gorączkowska, Jadwiga. 2020. Enterprise innovation in technology incubators and university business incubators in the context of Polish industry. Oeconomia Copernicana 11: 799–817. [Google Scholar] [CrossRef]
  15. Grzelak, Maria Magdalena. 2011. Innowacyjność przemysłu spożywczego w Polsce. Ocena. In Uwarunkowania. Łódź: Rozwój, Wydawnictwo Uniwersytetu Łódzkiego. [Google Scholar] [CrossRef]
  16. Hellwig, Zdzisław. 1968. Zastosowanie metody taksonomicznej do typologicznego podziału krajów ze względu na poziom ich rozwoju oraz zasoby i strukturę wykwalifikowanych kadr (Application of the taxonomic method to the typological division of countries due to the level of their development and the resources and structure of qualified personnel). Przegląd Statystyczny 4: 307–27. [Google Scholar]
  17. Hwang, Ching-Lai, and Kwangsun Yoon. 1981. Multiple Attribute Decision Making: Methods and Applications. New York: Springer. [Google Scholar]
  18. Kisielińska, Joanna. 2016. Ranking państw UE ze względu na potencjalne możliwości zaspokojenia zapotrzebowania na produkty rolnicze z wykorzystaniem metod porządkowania liniowego (Ranking of EU countries due to the potential possibilities of meeting the demand for agricultural products using linear ordering methods). Problemy Rolnictwa Światowego 16: 142–52. [Google Scholar]
  19. Kotlebova, Jana, Peter Arendas, and Bozena Chovancova. 2020. Government expenditures in the support of technological innovations and impact on stock market and real economy: The empirical evidence from the US and Germany. Equilibrium. Quarterly Journal of Economics and Economic Policy 15: 717–34. [Google Scholar] [CrossRef]
  20. Kukuła, Karol. 2000. Metoda unitaryzacji zerowanej (The Method of Zero-Standardization). Warszawa: PWN. [Google Scholar]
  21. Kukuła, Karol, and Lidia Luty. 2015. Propozycja procedury wspomagającej wybór metody porządkowania liniowego (Proposition of procedures supporting the choice of the method of linear ordering). Przegląd Statystyczny 62: 219–31. [Google Scholar]
  22. Lopez-Rubio, Pedro, Norat Roig-Tierno, and Alicia Mas-Tur. 2020. Regional innovation system research trends: Toward knowledge management and entrepreneurial ecosystems. International Journal of Quality Innovation 6: 1–16. [Google Scholar] [CrossRef]
  23. Lopez-Rubio, Pedro, Norat Roig-Tierno, and Francisco Mas-Verdu. 2021. Assessing the Origins, Evolution and Prospects of National Innovation Systems. Journal of the Knowledge Economy, 1–24. [Google Scholar] [CrossRef]
  24. Lundvall, Bengt-Ake. 1992. National Systems of Innovation. London: Pinter Publishers. [Google Scholar]
  25. Maloney, William F. 2017. Revisiting the National Innovation System in Developing Countries. Policy Research Working Paper, No. 8219. Washington, DC: World Bank. [Google Scholar] [CrossRef] [Green Version]
  26. Manzini, Sibusiso T. 2012. The national system of innovation concept: An ontological review and critique. South African Journal 108: 1–7. [Google Scholar] [CrossRef]
  27. Metcalfe, John Stanley. 1995. The economic foundations of technology policy: Equilibrium and evolutionary perspectives. In Handbook of Economics of Innovation and Technological Change. Edited by Pauled Stoneman. Oxford: Blackwell. [Google Scholar]
  28. Młodak, Andrzej. 2006. Analiza Taksonomiczna w statystyce regionalnej (Taxonomic Anazlysis in Regional Statistics). Warszawa: Difin. [Google Scholar]
  29. Mytelka, Lynn. 2003. The dynamics of catching up: The relevance of an innovation system approach in Africa. In Putting Africa First: The Making of African Innovation Systems. Edited by Mammo Muchie, Peter Gammeltoft and Bengt-Ake Lundvall. Aalborg: Aalborg University Press. [Google Scholar]
  30. Nelson, Richard R., and Nathan Rosenberg. 1993. Technical Innovation and National Systems. In National Innovation Systems, a Comparative Analysis. Edited by Richard R. Nelson. New York: Oxford University Press. [Google Scholar]
  31. Niosi, Jorge, Paolo Saviotti, Bertrand Bellon, and Michael Crow. 1993. National systems of innovations. Search of a Workable Concept, Technology Society 15: 207–27. [Google Scholar] [CrossRef]
  32. OECD. 2000. Science, Technology and Industry Outlook. Paris: OECD, pp. 168–72. [Google Scholar]
  33. OECD/Eurostat. 2018. Oslo Manual 2018: Guidelines for Collecting, Reporting and Using Data on Innovation, 4th ed. The Measurement of Scientific, Technological and Innovation Activities. Paris: OECD Publishing, Luxembourg: Eurostat. [Google Scholar] [CrossRef]
  34. Panek, Tomasz. 2009. Statystyczne metody wielowymiarowej analizy porównawczej. Warszawa: SGH. [Google Scholar]
  35. Patel, Pari, and Keith Pavitt. 1991. Europe’s technological performance. In Technology and the Future of Europe: Global Competition and Environment in the 1990s. Edited by Christopher Freeman, Margaret Sharp and William Walker. London: Printer. [Google Scholar]
  36. Patel, Pari, and Keith Pavitt. 1994a. National Innovation Systems: Why They Are Important, And How They Might Be Measured And Compared. Economics of Innovations and New Technology 3: 77–95. [Google Scholar] [CrossRef]
  37. Patel, Pari, and Keith Pavitt. 1994b. The Nature and Economic Importance of National Innovation Systems, OECD STI Review No. 14. Paris: Organization for Economic Co-Operation and Development. [Google Scholar]
  38. Perkal, Julian. 1953. Taksonomia wrocławska (Wrocław’s taxonomy). In Przegląd Antropologiczny, t. 19. Poznań: Polskie Towarzystwo Antropologiczne i Polskie Zakłady Antropologii, pp. 209–19. [Google Scholar]
  39. Prokop, Viktor, Jan Stejskal, Viktorie Klimova, and Vladimir Zitek. 2021. The role of foreign technologies and R&D in innovation processes within catching-up CEE countries. PLoS ONE 16: e0250307. [Google Scholar] [CrossRef]
  40. Radicic, Dragana, Geoffrey Pugh, Hugo Hollanders, René Wintjes, and Jon Fairburn. 2016. The impact of innovation support programs on small and medium enterprises innovation in traditional manufacturing industries: An evaluation for seven European Union regions. Environment and Planning C: Government and Policy 34: 1425–52. [Google Scholar] [CrossRef] [Green Version]
  41. Raghupathi, Viju, and Wullianallur Raghupathi. 2017. Innovation at country-level: Association between economic development and patents. Journal of Innovation and Entrepreneurship 6: 4. [Google Scholar] [CrossRef] [Green Version]
  42. Roszko-Wójtowicz, Elżbieta, and Jacek Białek. 2018. Diverse approaches to the multidimensional assessment of innovation in the European Union. Acta Oeconomica 68: 521–47. [Google Scholar] [CrossRef]
  43. Roszko-Wójtowicz, Elżbieta, and Jacek Białek. 2019. Measurement of the average innovativeness change overtime in the EU member states. Journal of Business Economics and Management 20: 268–93. [Google Scholar] [CrossRef] [Green Version]
  44. Roszko-Wójtowicz, Elżbieta, and Maria Magdalena Grzelak. 2020. Macroeconomic stability and the level of competitiveness in EU member states: A comparative dynamic approach. Oeconomia Copernicana 11: 657–88. [Google Scholar] [CrossRef]
  45. Schmoch, Ulrich, Christian Rammer, and Harald Legler. 2006. National Systems of Innovation in Comparison. In Structure and Performance Indicators for Knowledge Societies. Chem: Springer. [Google Scholar] [CrossRef]
  46. Schwab, Klaus, ed. 2019. Global Competitiveness Report. Geneva: World Economic Forum. [Google Scholar]
  47. Seidel, Stefan, Jan Recker, and J. Jan vom Brocke. 2013. Sensemaking and sustainable practicing: Functional affordances of information systems in green transformations. MIS Quarterly 37: 1275–99. [Google Scholar] [CrossRef]
  48. Strahl, Danuta. 1978. Propozycja konstrukcji miary syntetycznej (A proposal for the construction of a synthetic measure). Przegląd Statystyczny 25: 205–15. [Google Scholar]
  49. Świadek, Arkadiusz, and Jadwiga Gorączkowska. 2020. The institutional support for an innovation cooperation in industry: The case of Poland. Equilibrium. Quarterly Journal of Economics and Economic Policy 15: 811–31. [Google Scholar] [CrossRef]
  50. Vonortas, Nicholas S. 2009. European Research Framework Programmes in a global context; targets, impacts, lessons for the future. The Innovation Imperative. In National Innovation Strategies in the Global Economy. Edited by Marklund Göran, Nicholas S. Vonortas and Charles Wessner. Cheltenham: Edward Elgar. [Google Scholar]
  51. Walesiak, Marek. 2014. Przegląd formuł normalizacji wartości zmiennych oraz ich własności w statystycznej analizie wielowymiarowej (Review of formulas for normalization of the values of variables and their properties in statistical multidimensional analysis). Przegląd Statystyczny 4: 363–72. [Google Scholar]
  52. Wangwe, Samuel. M. 2003. African systems of innovation: Towards an interpretation of the development experience. In Putting Africa First: The Making of African Innovation Systems. Edited by Mammo Muchie, Peter Gammeltoft and Bengt-Ake A. Lundvall. Aalborg: Aalborg University Press. [Google Scholar]
  53. Weresa, Marzenna Anna. 2012. Systemy innowacyjne we współczesnej gospodarce światowej. Warsaw: Wydawnictwo Naukowe PWN S.A. [Google Scholar]
  54. White Paper. 1996. White Paper on Science and Technology: Preparing for the 21st Century. Pretoria: Department of Arts, Culture, Science and Technology (DACST). [Google Scholar]
Figure 1. Procedure of determining the synthetic measure and linear ordering. Source: Authors’ own compilation based on Hellwig (1968) and Bąk (2013).
Risks 10 00006 g001
Figure 2. Comparison of the EU countries in terms of the value of the synthetic measure in 2010 and 2019. Source: Authors’ own compilation based on Eurostat data; visualization supported by Bing, Geonames, Microsoft, TomTom.
Risks 10 00006 g002
Figure 3. Classification of the EU countries into particular groups based on the value of the synthetic measure in 2010 and 2019. Source: Authors’ own compilation based on Eurostat data; visualization supported by Bing, Geonames, Microsoft, TomTom.
Risks 10 00006 g003
Figure 4. Characteristics of individual groups based on the relation of group mean values to the total means for individual variables in 2010 and 2019. Source: Authors’ own compilation based on Eurostat data.
Risks 10 00006 g004aRisks 10 00006 g004b
Table 1. Definitions of the national innovation system.
DefinitionAuthors
An innovation system encompasses all the organizations and institutions involved in the innovation process and the national innovation system gives special attention to those institutions and organizations which are located in or rooted in a nation state. The system is open and one crucial characteristic of the national innovation system is its capacity to absorb and use knowledge developed abroad.Chaminade et al. (2018)
The institutions, human capital and interactions among them that facilitate the creation and diffusion of knowledge.Maloney (2017)
An innovation system is a multilevel concept where national, regional and sectoral innovation systems can coexist and coevolve together in the same country. Carayannis et al. (2016)
A unity of enterprises of various patterns of ownership that individually or through interaction with each other provide the formation and dispersion of innovation technologies within a definite state; (…) it encourages the implementation of the derived technologies into production and development of new products saleable in the world market; among such organizations there are scientific institutions (R&D institutes, institutes of higher education, private laboratories, scientific departments of corporations—all of them can be summarized under the term “creators of innovation”); then, “infrastructural” enterprises–technoparks, innovative technology centers, venture funds; agencies conditioning the innovation climate and governmental bodies: ministries and specialized departments; the small, medium and big businesses as the first and the final consumer and as one of the primary initiators of innovation.Garifullin and Ablaev (2015)
A network of interacting policies, institutions, and organizations whose holistic functionality depends on the quality of cooperation between the various component parts.Manzini (2012)
Creating an efficient innovation system and business environment that encourages innovation and entrepreneurship, comprising firms, science and research centers, universities, think tanks, and other organizations that can tap into and contribute to the growing stock of global knowledge, that can adapt it to local needs, and that can use it to create new products, services, and ways of doing business.Goel et al. (2004)
A network of economic agents, together with the institutions and policies that influence their innovative behavior and performance.Mytelka (2003)
An evolutionary system in which enterprises in interaction with each other and supported by institutions and organizations such as industry associations, R&D, innovation and productivity centers, standard setting bodies, universities and vocational training centers, information gathering and analysis services, and banking and other financing mechanisms play a key role in bringing new products, new processes and new forms of organization into economic use.Wangwe (2003)
A mean by which a country seeks to create, acquire, diffuse and put into practice new knowledge that will help that country and its people achieve their individual and collective goals.White Paper (1996)
A system of interconnected institutions to create, store and transfer the knowledge, skills and artifacts which define new technologies.Metcalfe (1995)
That set of distinct institutions which jointly and individually contribute to the development and diffusion of new technologies, and which provides the framework within which governments form and implement policies to influence the innovation process.Metcalfe (1995)
System of interacting private and public firms (either large or small), universities, and government agencies aiming at the production of science and technology within national borders.Niosi et al. (1993)
National institutions, their incentive structures and their competencies that determine the rate and direction of technological learning (or the volume and composition of change generating activities) in a country.Patel and Pavitt (1994b)
The system of production, scientific and technical subsystems, institutional solutions, and relationships between them, which affect the level of innovation in the economy.Lundvall (1992)
Network of institutions in the public and private sectors whose activities and interactions initiate, import, modify and diffuse new technologies.Freeman (1992)
Source: Authors’ own compilation.
Table 2. Typology of national innovation systems according to M.M. Godinho, S. Mendonça, T.S. Pereira (GMP classification).
NIS TypeNIS SubtypeNSI KindCountries Belonging to a Given NIS Type
T.0Hongkong
T.1. Developed innovation systemsT. 1.1. Dynamic NSIIreland, Netherlands, Switzerland, Finland, Sweden, Singapore
T. 1.2. Stable functioning NIST. 1.2. 1. Germany, Great Britain, France, Italy, South Korea, Taiwan
T. 1.2.2.USA, Japan
T. 1.2.3.Canada, Norway, Australia, Austria, New Zealand, Spain
T. 1.3. Unevenly developed NSIDenmark, Belgium, Luxembourg
T.2. Developing innovation systemsT.2.1. Catching up NIST.2.1.1.Portugal, Greece, Poland, Hungary, the Czech Republic, Slovenia
T.2.1.2.Malaysia, Malta
T.2.1.3.Latvia, Estonia, Lithuania, Slovakia, Ukraine
T.2.2. Unbalanced NIST.2.2.1.Russia
T.2.2.2.China, Brazil, South Africa, Thailand, Argentina, India, Mexico
T.2.2.3.Turkey, Colombia, Bulgaria, Indonesia, the Philippines, Peru, Romania
T.2.2.4.Egypt, Cyprus, Chile, Venezuela
T.2.3. Unshaped NIST.2.3.1.Algeria, Iran, Vietnam, Morocco, Bangladesh
T.2.3.2.Pakistan, Kenya, Ethiopia, Tanzania, Sudan, Nigeria, Congo, Myanmar
Source: Weresa (2012) Systemy innowacyjne we współczesnej gospodarce światowej, Wydawnictwo Naukowe PWN S.A., Warsaw, p. 46, (after:) Godinho et al. (2003), Mapping innovation systems: a framework based on innovation surveys data, paper presented at the First Globelics Conference, “Innovation Systems and Development for the Third Millenium”, Rio de Janeiro, 2–6 November.
Table 3. A set of potential diagnostic indicators of innovation.
SymbolName of the Indicator
X1R&D expenditure in euro per capita–all sectors
X2R&D expenditure in euro per capita–business enterprise sector
X3R&D expenditure in euro per capita–government sector
X4R&D expenditure in euro per capita–high education sector
X5High-tech patent applications to the EPO per million inhabitants
X6EU trademark applications per million population
X7Students in tertiary education by age groups as % of corresponding age population
X8Total high-tech trade in million euro as % of total (imports)
X9R&D personnel as % of the labor force
X10High–tech exports as % of total exports
X11Employment in knowledge-intensive activities as % of total employment
X12Product or process innovative enterprises engaged in cooperation as % of innovative enterprises
X13Triadic patent families per million inhabitants
Source: Eurostat, accessed on 20 December 2020.
Table 4. Comparison of selected measures of descriptive statistics in total in 2010 and 2019.
2010
MeanSXVSxMAXCountryMINCountry
X1458.7444.396.9%1303.00Finland28.00Romania
X2279.7295.9105.8%907.00Finland11.00Romania
X349.750.8102.1%256.00Luxembourg3.00Malta
X4111.7102.892.1%388.00Denmark3.40Bulgaria
X517.723.1130.8%84.30Finland0.51Bulgaria
X6173.8297.4171.1%1637.00Luxembourg4.90Croatia
X714.214.098.9%50.00Greece0.10Poland
X811.13.127.8%19.70Ireland6.10Croatia
X91.50.744.9%3.04Finland0.17Poland
X1012.27.763.4%33.00Malta3.00Portugal
X1134.96.819.4%56.60Luxembourg20.00Romania
X1233.612.135.9%55.80Denmark13.80Romania
X1313.617.5128.8%64.60Sweden0.07Bulgaria
2019
MeanSXVSxMAXCountryMINCountry
X1581.6514.388.4%1581.00Denmark53.00Romania
X2370.9343.492.6%1096.00Sweden24.00Malta
X356.657.8102.2%288.00Luxembourg2.00Malta
X4139.3123.888.8%513.00Denmark3.30Bulgaria
X515.119.7129.8%85.50Finland0.43Bulgaria
X6290.9422.9145.4%2190.00Luxembourg31.00Chorwacja
X715.615.9102.1%49.00Greece0.50Denmark
X811.43.632.1%27.10Ireland6.20Luxembourg
X91.90.735.7%3.20Denmark0.54Romania
X1011.77.059.6%35.00Ireland4.00Portugal
X1135.85.816.1%49.00Luxembourg22.00Romania
X1234.212.235.7%65.30Great Britain12.50Italy
X136.18.6141.4%32.30Netherlands0.09Greece
Source: Authors’ own compilation based on Eurostat data.
Table 5. The boundaries of groups/classes of the synthetic Hellwig index of EU innovation in 2010 and 2019.
GroupIntervals of Variability of a Synthetic Variable
20102019
Group 1 q i ≥ 0.3538 q i ≥ 0.2686
Group 2 0.3538   >   q i ≥ 0.2355 0.2686   >   q i ≥ 0.1788
Group 3 0.2355   >   q i ≥ 0.1172 0.1788   >   q i ≥ 0.0890
Group 4 q i < 0.1172 q i < 0.0890
Source: Authors’ own compilation.
Table 6. Comparison of selected measures of descriptive statistics for individual groups in 2010.
Variable
MeasureX1X2X3X4X5X6X7X8X9X10X11X12X13
Group 1Mean1064.6696.2106.3258.250.6408.410.711.62.417.341.840.938.1
Sx284.5235.172.788.926.6550.713.91.90.67.36.97.716.2
VSx26.7%33.8%68.4%34.4%52.6%134.9%130.0%16.2%25.4%42.5%16.5%18.9%42.5%
MAX130390725638884.3163735.8143.043156.655.864.6
MIN657.13152814510.7594.10.58.91.489.336.730.112.7
Group 2Mean678.0410.252.4147.722.7191.024.713.41.716.739.932.619.7
Sx371.8194.938.063.110.651.39.04.10.48.02.511.512.4
VSx54.8%47.5%72.6%42.7%46.7%26.8%36.7%30.7%22.2%47.7%6.2%35.3%62.9%
MAX1282.0661.0127.0250.039.4272.030.319.72.333.043.248.840.6
MIN97.059.33.034.04.9130.04.78.01.18.435.819.82.5
Group 3Mean193.999.832.955.84.691.214.610.81.49.632.034.22.8
Sx102.770.017.926.13.670.815.32.30.36.21.811.92.8
VSx53.0%70.2%54.4%46.8%78.3%77.6%105.2%21.1%22.7%64.6%5.8%34.9%99.3%
MAX364.0247.066.496.013.0274.050.014.61.822.034.551.49.0
MIN70.018.012.321.01.328.71.27.30.63.028.216.20.4
Group 4Mean51.019.415.915.81.123.64.88.40.66.326.924.90.5
Sx20.37.96.08.80.514.44.11.70.32.03.811.40.3
VSx39.9%40.5%37.6%56.0%47.3%61.1%85.9%20.8%48.1%31.5%14.2%45.7%68.1%
MAX78.034.025.025.51.939.011.610.61.09.831.539.31.1
MIN28.011.010.43.40.54.90.16.10.24.120.013.80.1
Source: Authors’ own compilation based on Eurostat data.
Table 7. Comparison of selected measures of descriptive statistics for individual groups in 2019.
Variable
MeasureX1X2X3X4X5X6X7X8X9X10X11X12X13
Group 1Mean1164.3778.289.4252.838.1245.022.013.42.516.739.935.215.3
Sx299.1186.239.673.820.262.916.15.30.38.43.07.910.2
VSx25.7%23.9%44.3%29.2%53.1%25.7%73.2%39.3%11.2%50.3%7.4%22.5%67.0%
MAX1581.01096.0171.0391.085.5346.046.427.13.035.045.151.932.3
MIN769.0506.033.0159.019.0118.90.59.42.16.137.025.03.5
Group 2Mean890.3553.093.9238.818.1916.316.311.12.313.643.435.98.2
Sx547.5338.1113.4172.114.7793.515.72.80.87.13.619.65.2
VSx61.5%61.1%120.8%72.1%81.1%86.6%96.5%25.5%33.3%52.5%8.4%54.7%63.8%
MAX1581.01016.0288.0513.041.42190.034.713.03.225.649.065.316.5
MIN149.091.02.056.02.3193.00.56.21.17.239.016.02.5
Group 3Mean265.1154.740.266.53.8186.713.410.81.69.233.538.41.3
Sx108.186.215.628.21.9185.017.12.40.44.32.010.71.8
VSx40.8%55.7%38.8%42.4%49.3%99.1%127.3%22.4%25.2%46.5%5.9%28.0%131.4%
MAX432.0320.062.0123.56.5707.049.014.72.218.038.453.26.5
MIN134.049.013.027.01.157.31.07.10.84.531.412.50.1
Group 4Mean126.566.815.443.21.572.210.39.81.27.729.324.70.4
Sx73.241.76.836.31.136.79.91.00.52.23.86.30.1
VSx57.8%62.3%44.1%83.9%73.5%50.9%96.4%10.4%41.2%29.1%13.0%25.5%24.0%
MAX269.0139.024.0112.03.7128.031.611.42.211.233.034.50.6
MIN53.024.03.13.30.431.02.58.50.54.022.016.30.3
Source: Authors’ own compilation based on Eurostat data.
Table 8. The ratio of the group average to the total average in 2010 and 2019.
2010
Group 1Group 2Group 3Group 4
X1232.10%147.80%42.30%11.10%
X2248.90%146.60%35.70%6.90%
X3213.60%105.30%66.10%31.90%
X4231.10%132.30%49.90%14.10%
X5285.90%128.40%25.80%6.00%
X6234.90%109.90%52.50%13.60%
X775.50%174.20%102.90%34.10%
X8104.90%120.80%97.10%75.60%
X9153.90%112.40%90.90%40.60%
X10141.90%137.20%78.70%52.00%
X11119.80%114.40%91.80%77.00%
X12121.50%96.90%101.80%73.90%
X13281.00%145.00%20.50%3.70%
2019
Group 1Group 2Group 3Group 4
X1200.20%153.10%45.60%21.80%
X2209.80%149.10%41.70%18.00%
X3157.90%165.80%71.00%27.20%
X4181.40%171.40%47.70%31.00%
X5251.40%119.40%25.30%9.70%
X684.20%315.00%64.20%24.80%
X7140.80%104.30%86.00%66.10%
X8118.10%97.20%95.10%85.90%
X9131.60%119.90%87.40%65.60%
X10143.20%116.90%79.20%65.90%
X11111.40%121.20%93.50%81.60%
X12103.00%105.10%112.30%72.20%
X13250.00%134.40%22.10%6.90%
Source: Authors’ own compilation based on Eurostat data.
Publisher’s Note: MDPI stays neutral with regard to jurisdictional claims in published maps and institutional affiliations.

