
Tumor Necrosis Receptor Superfamily Interact with Fusion and Fission of Mitochondria of Adipose Tissue in Obese Patients without Type 2 Diabetes
.JPG)
 ,
,  , ,
, ,  ,
,
Abstract
:1. Introduction
2. Materials and Methods
2.1. Serum/Plasma Blood Studying
2.2. Gene Expression Research
2.3. Western Blot Analysis
2.4. Statistical Analysis
3. Results
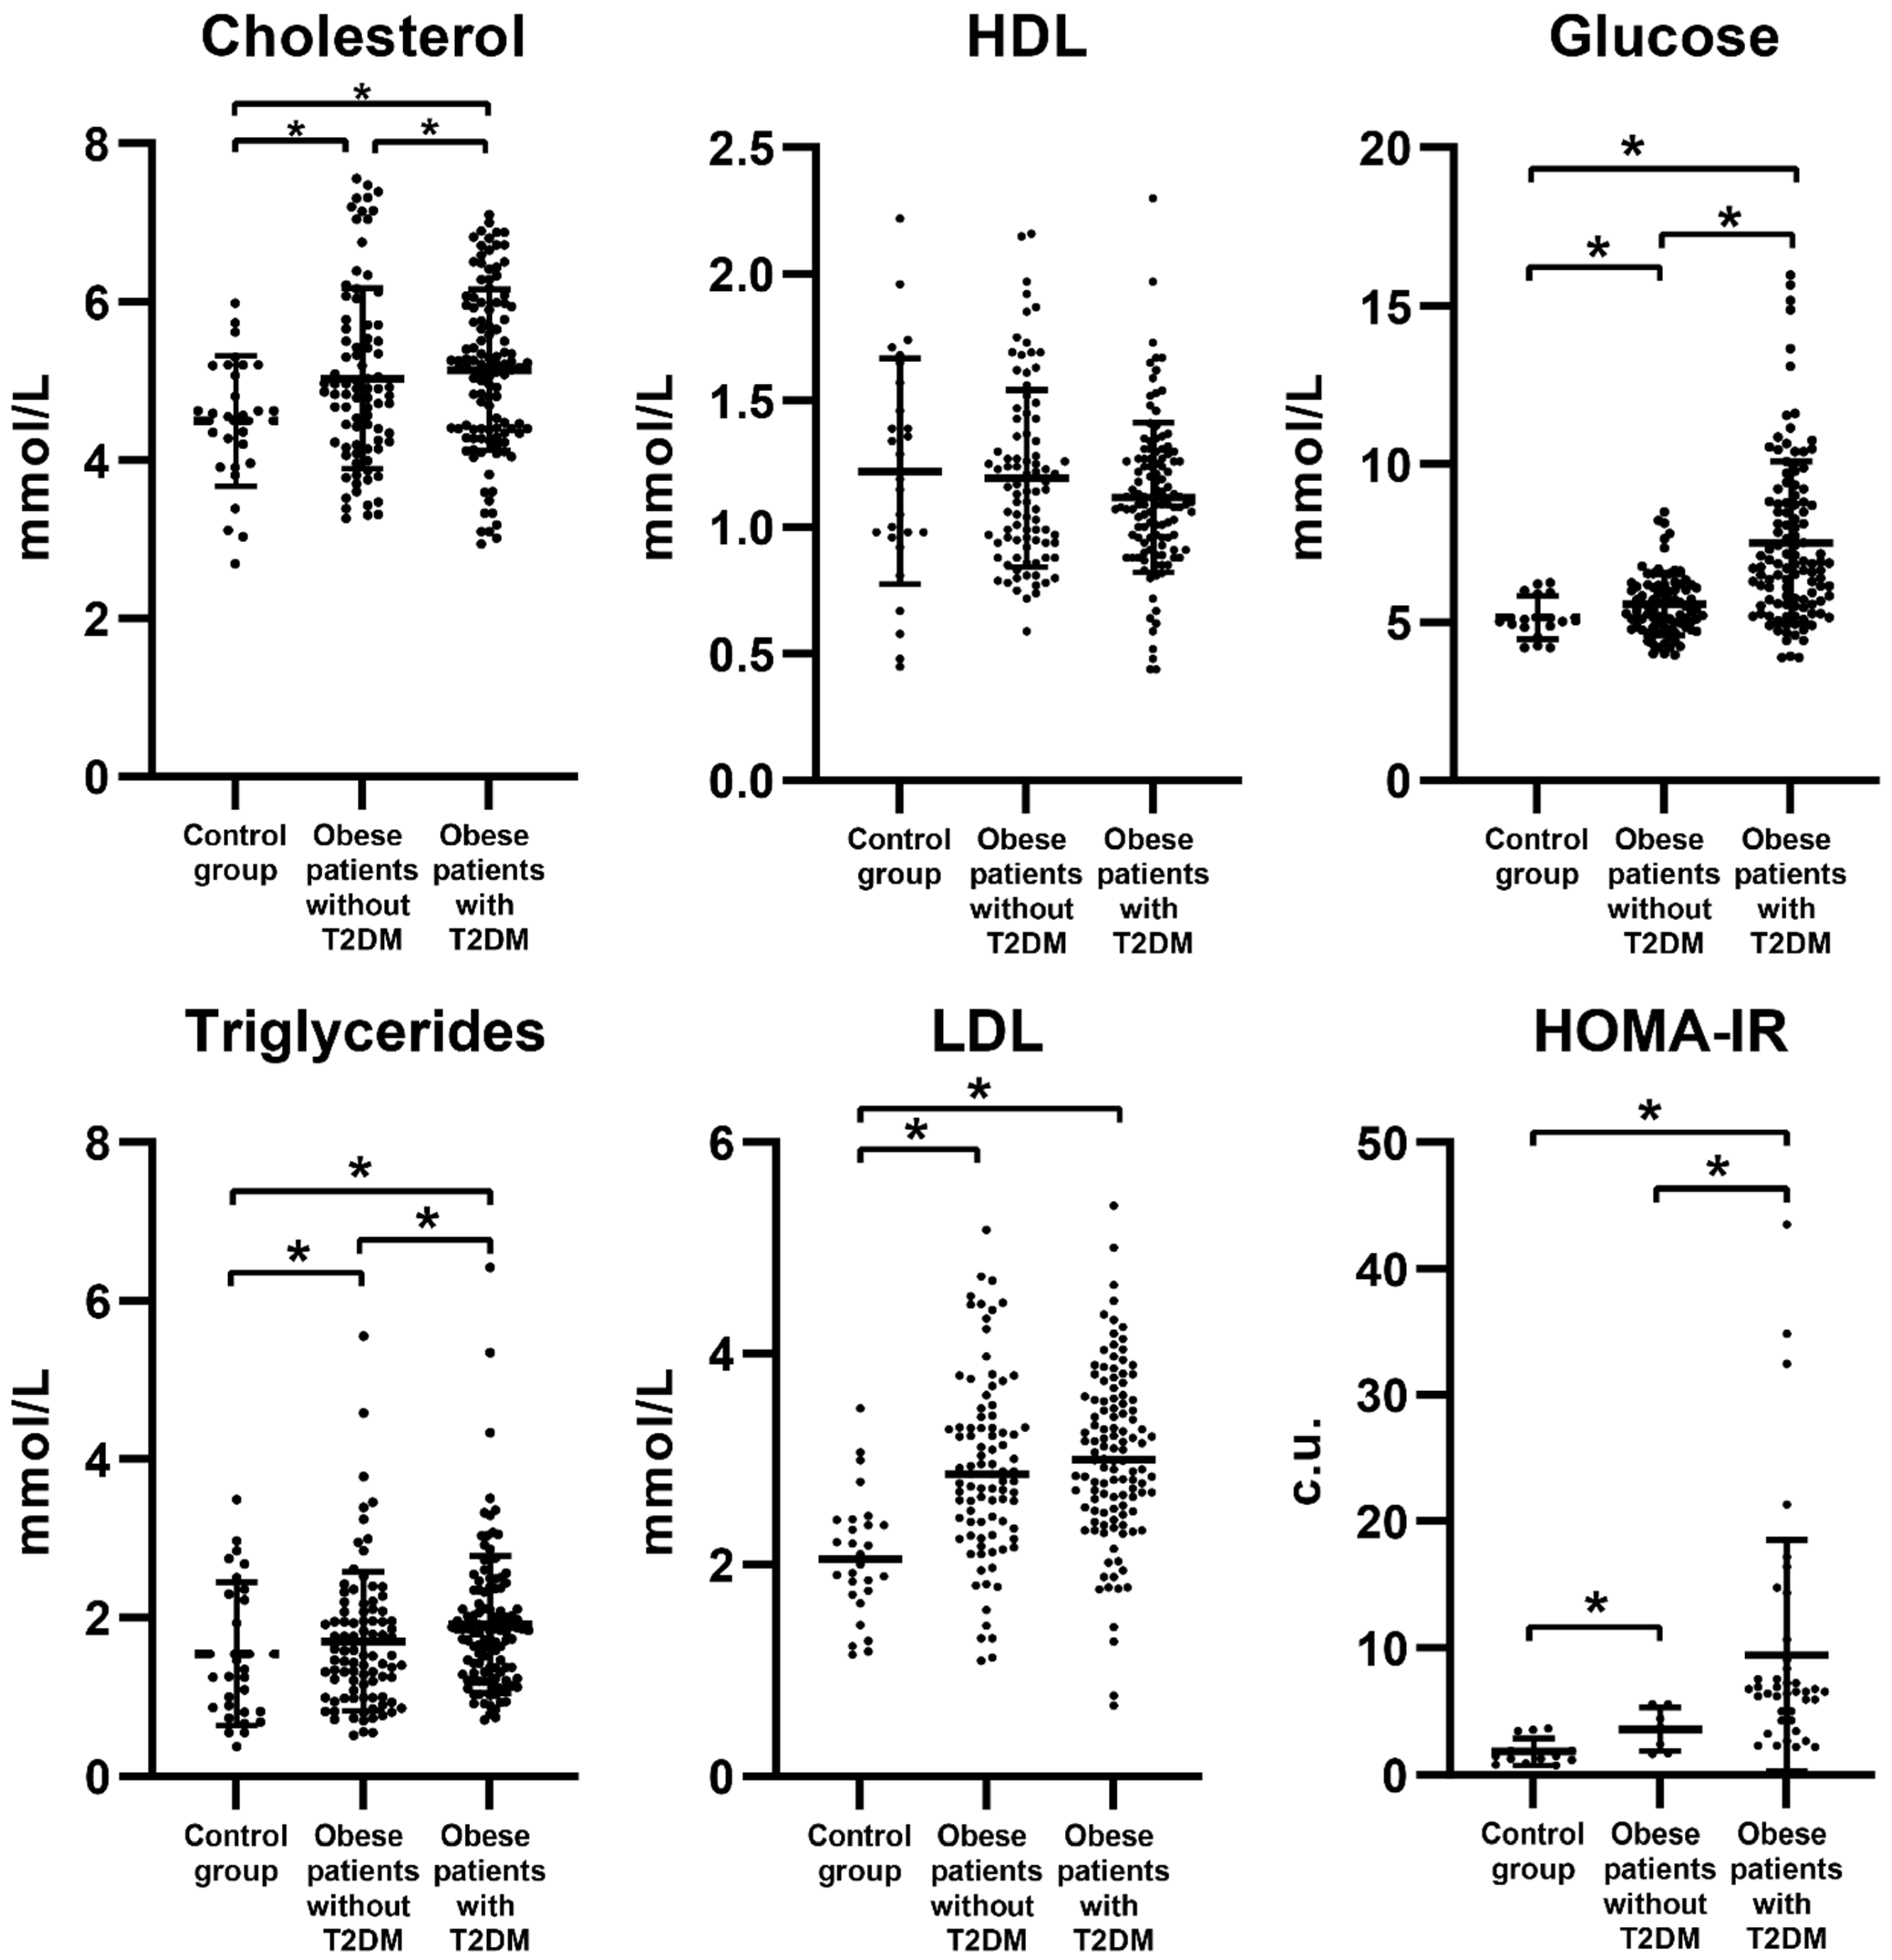
3.1. Biochemical Parameters of Obese Patients
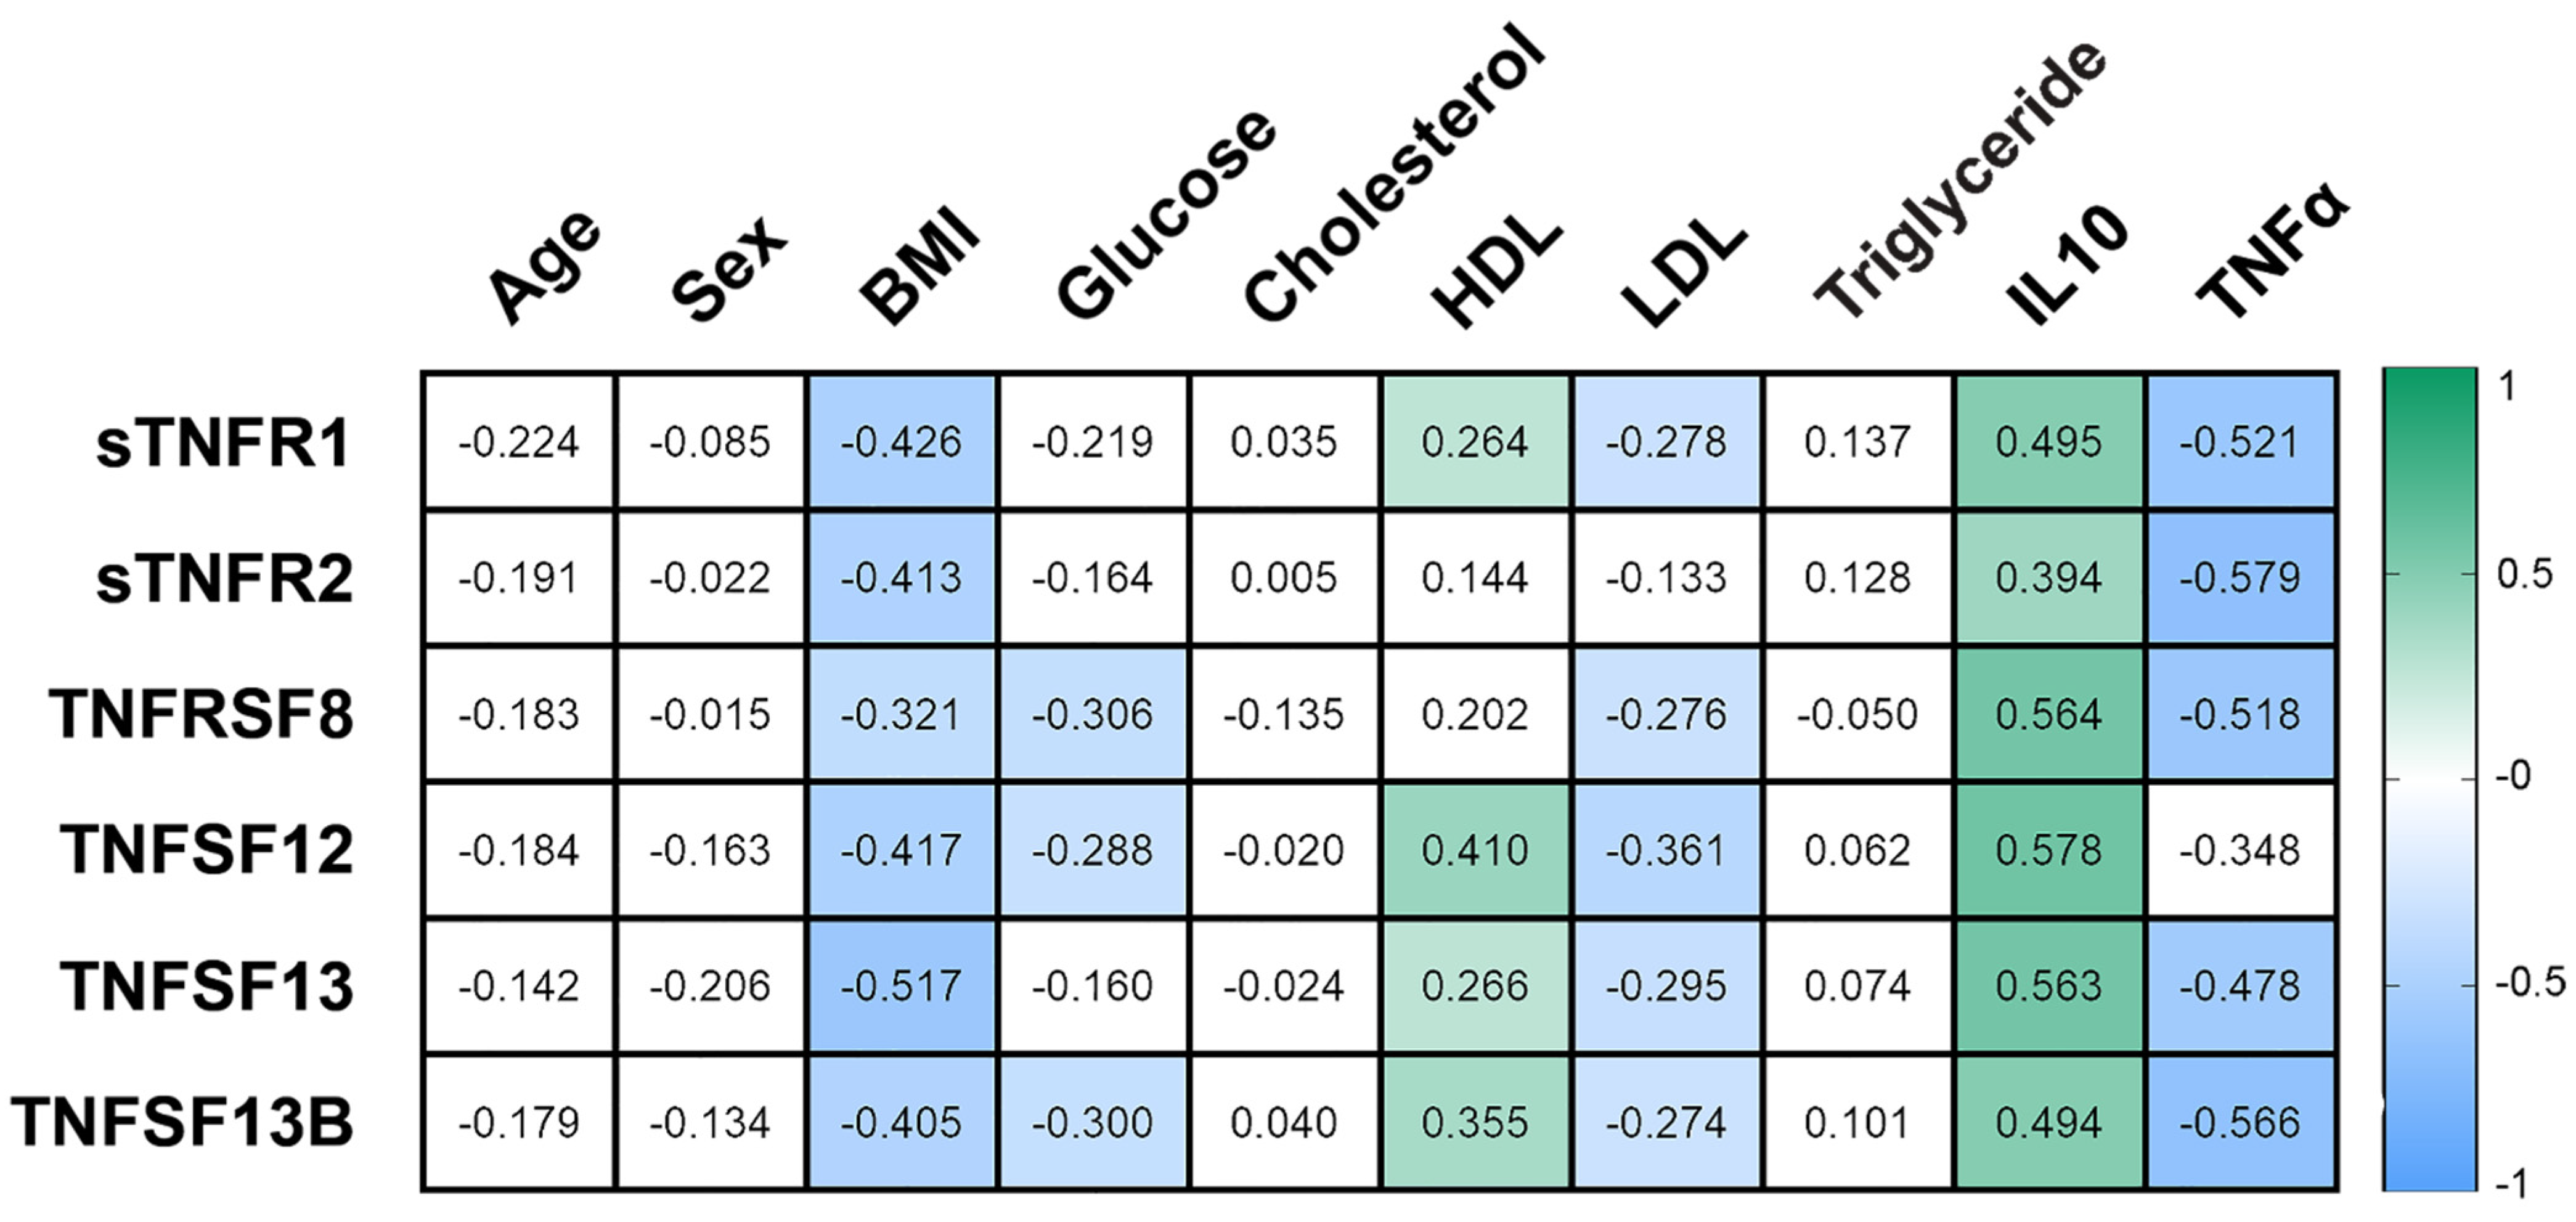
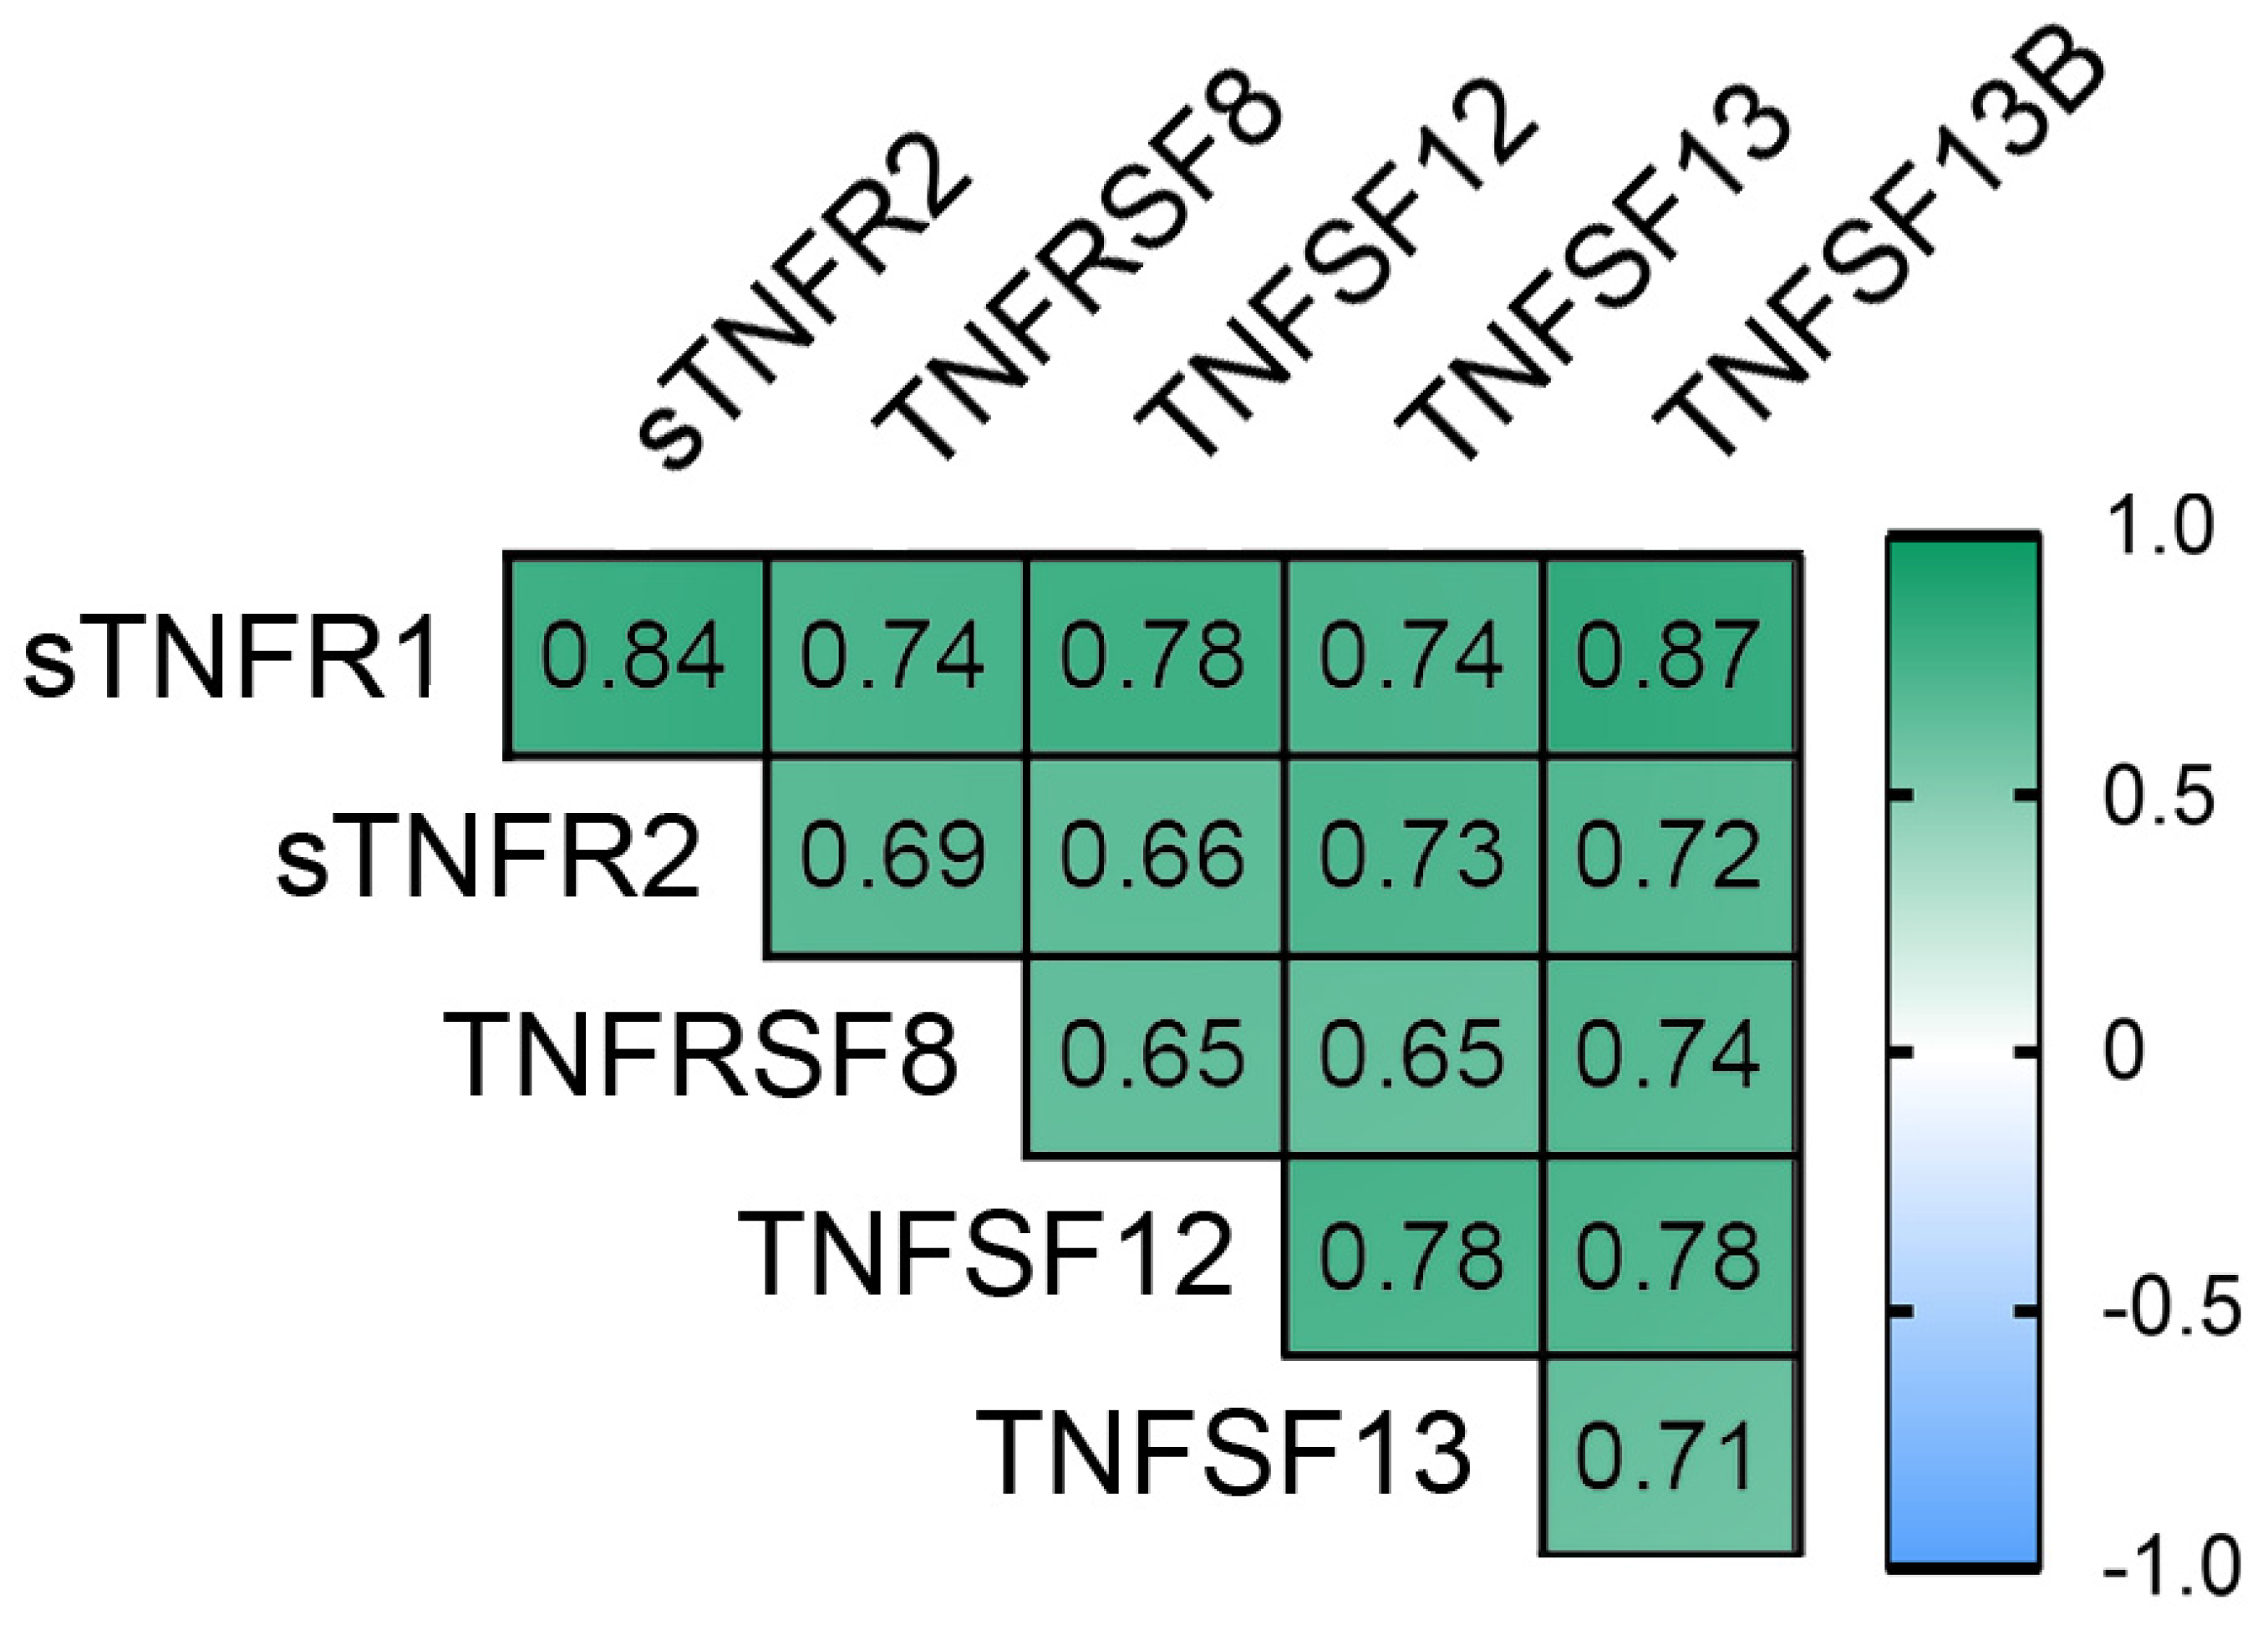
3.2. The Concentration of Plasma Cytokines of the TNF Receptor Superfamily in Obese Patients
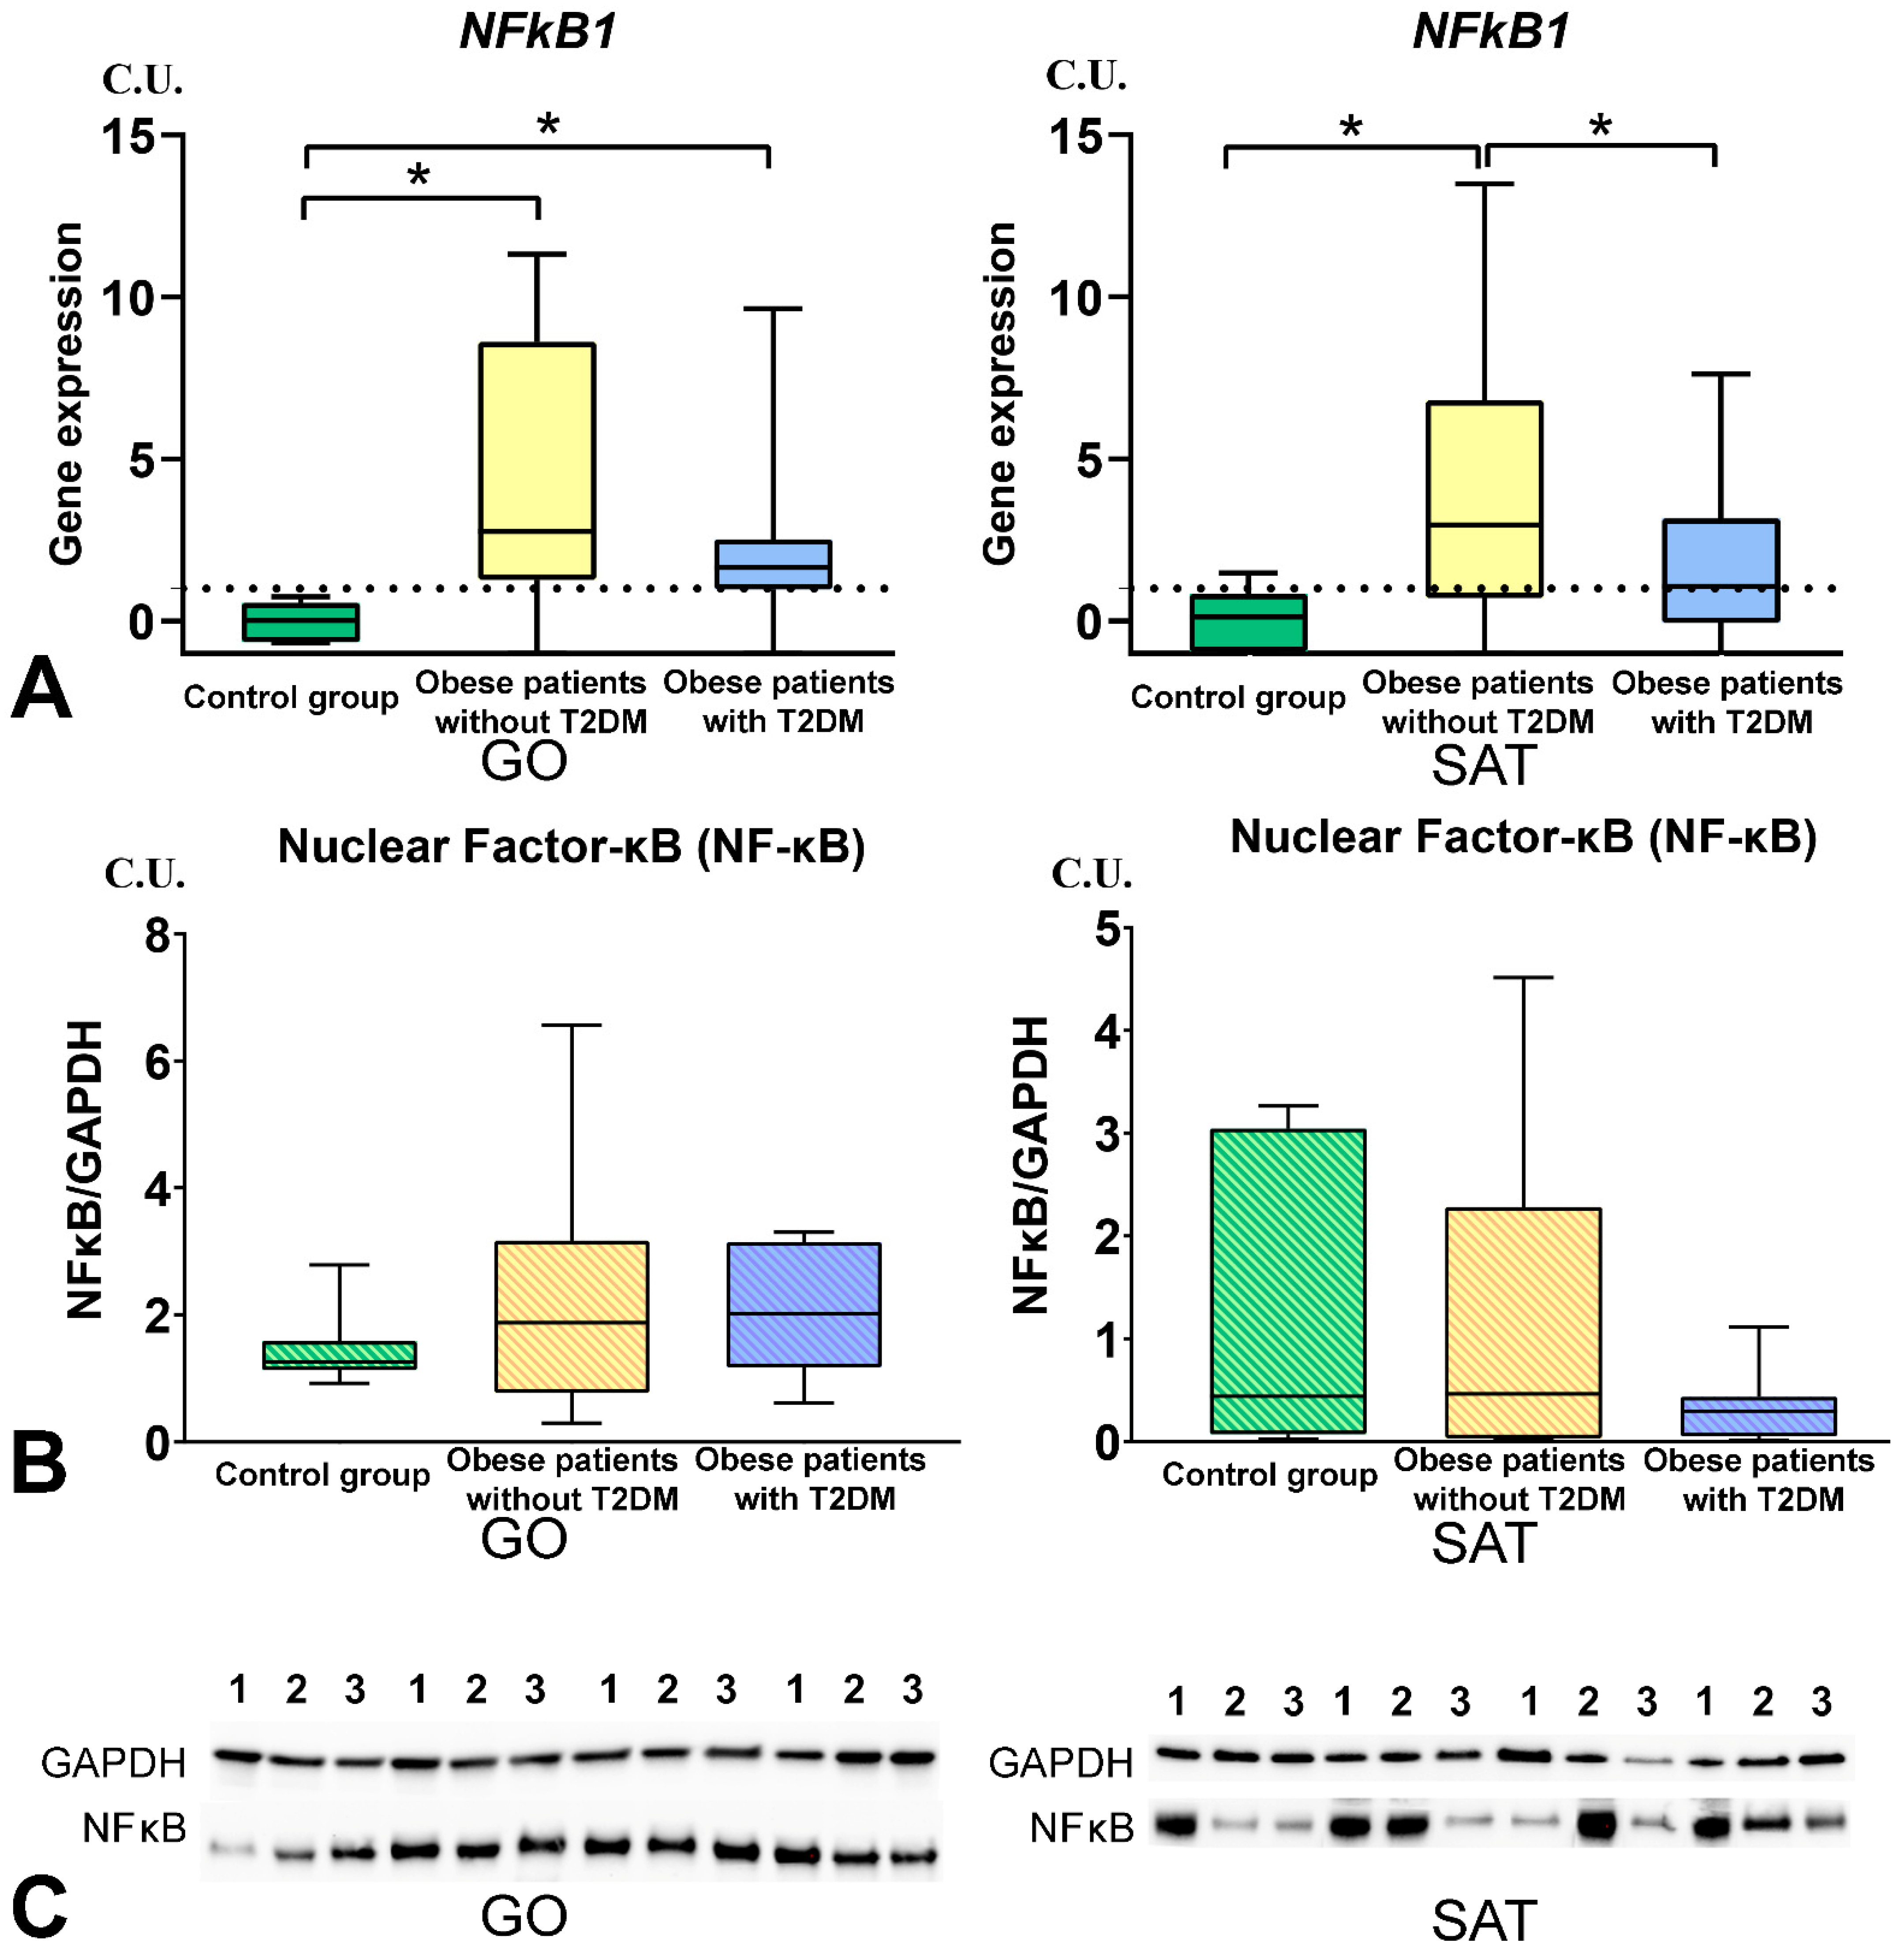
3.3. The NF-kB Levels in Obese Patients
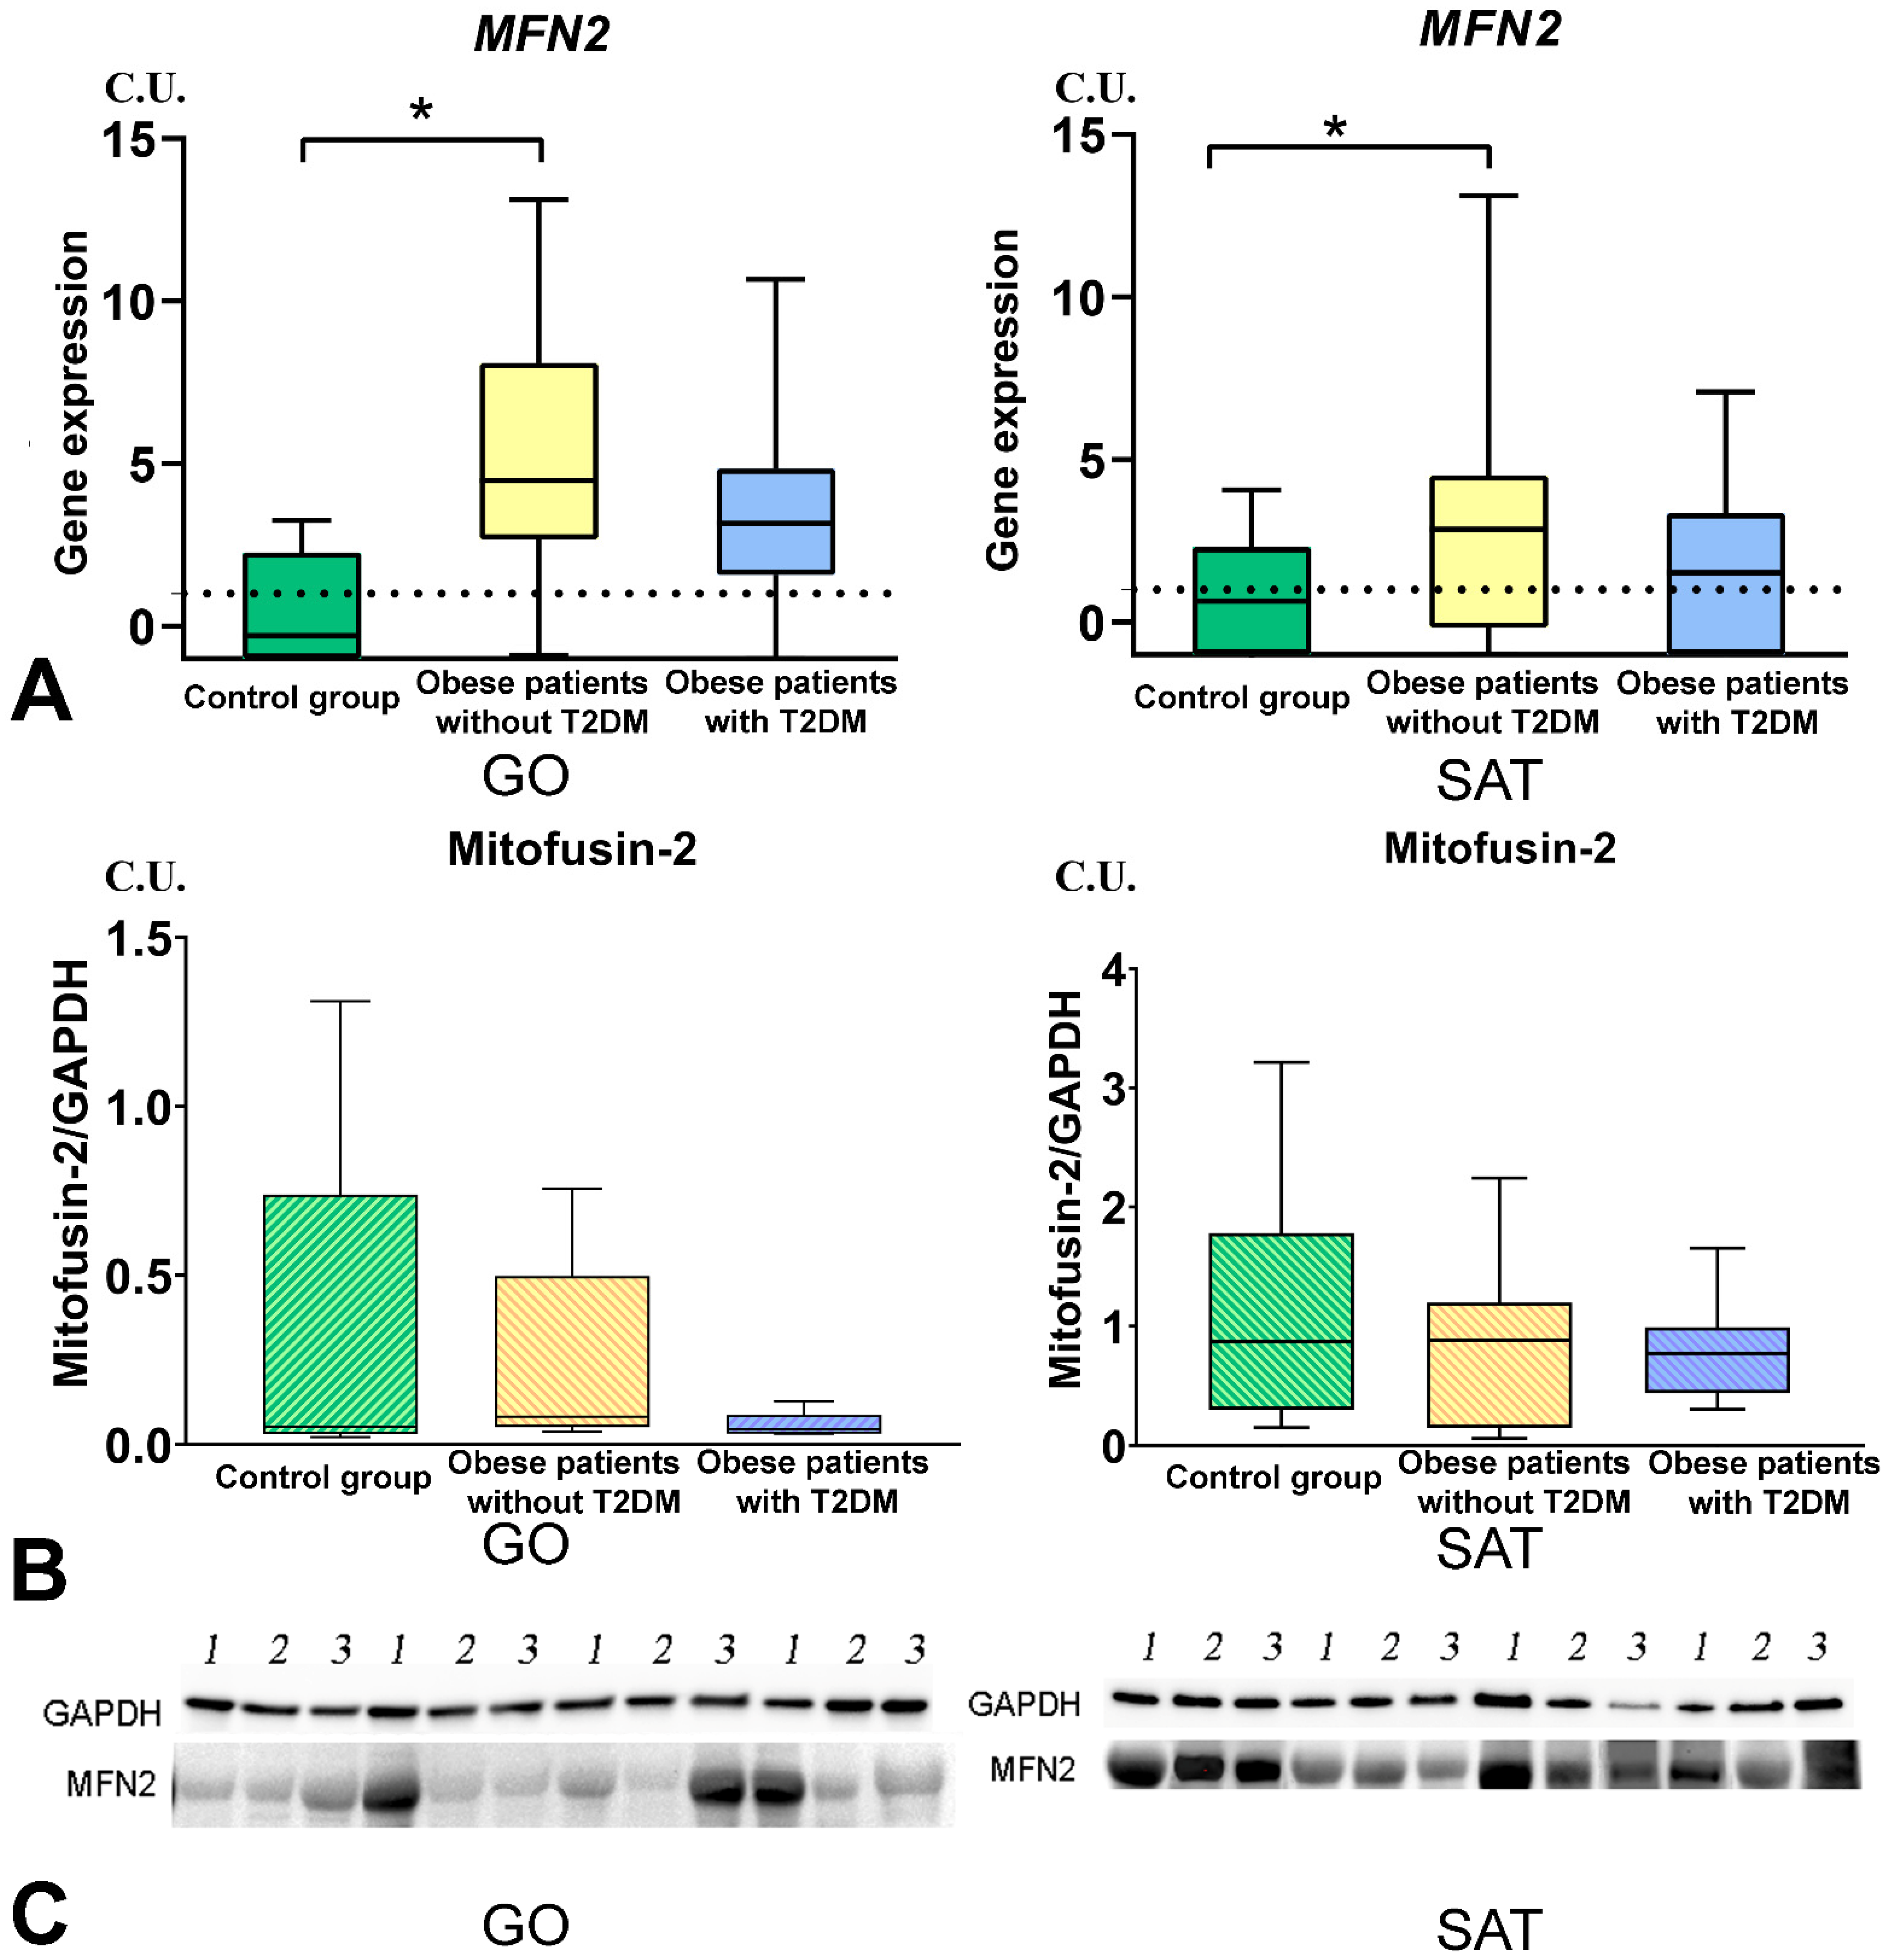
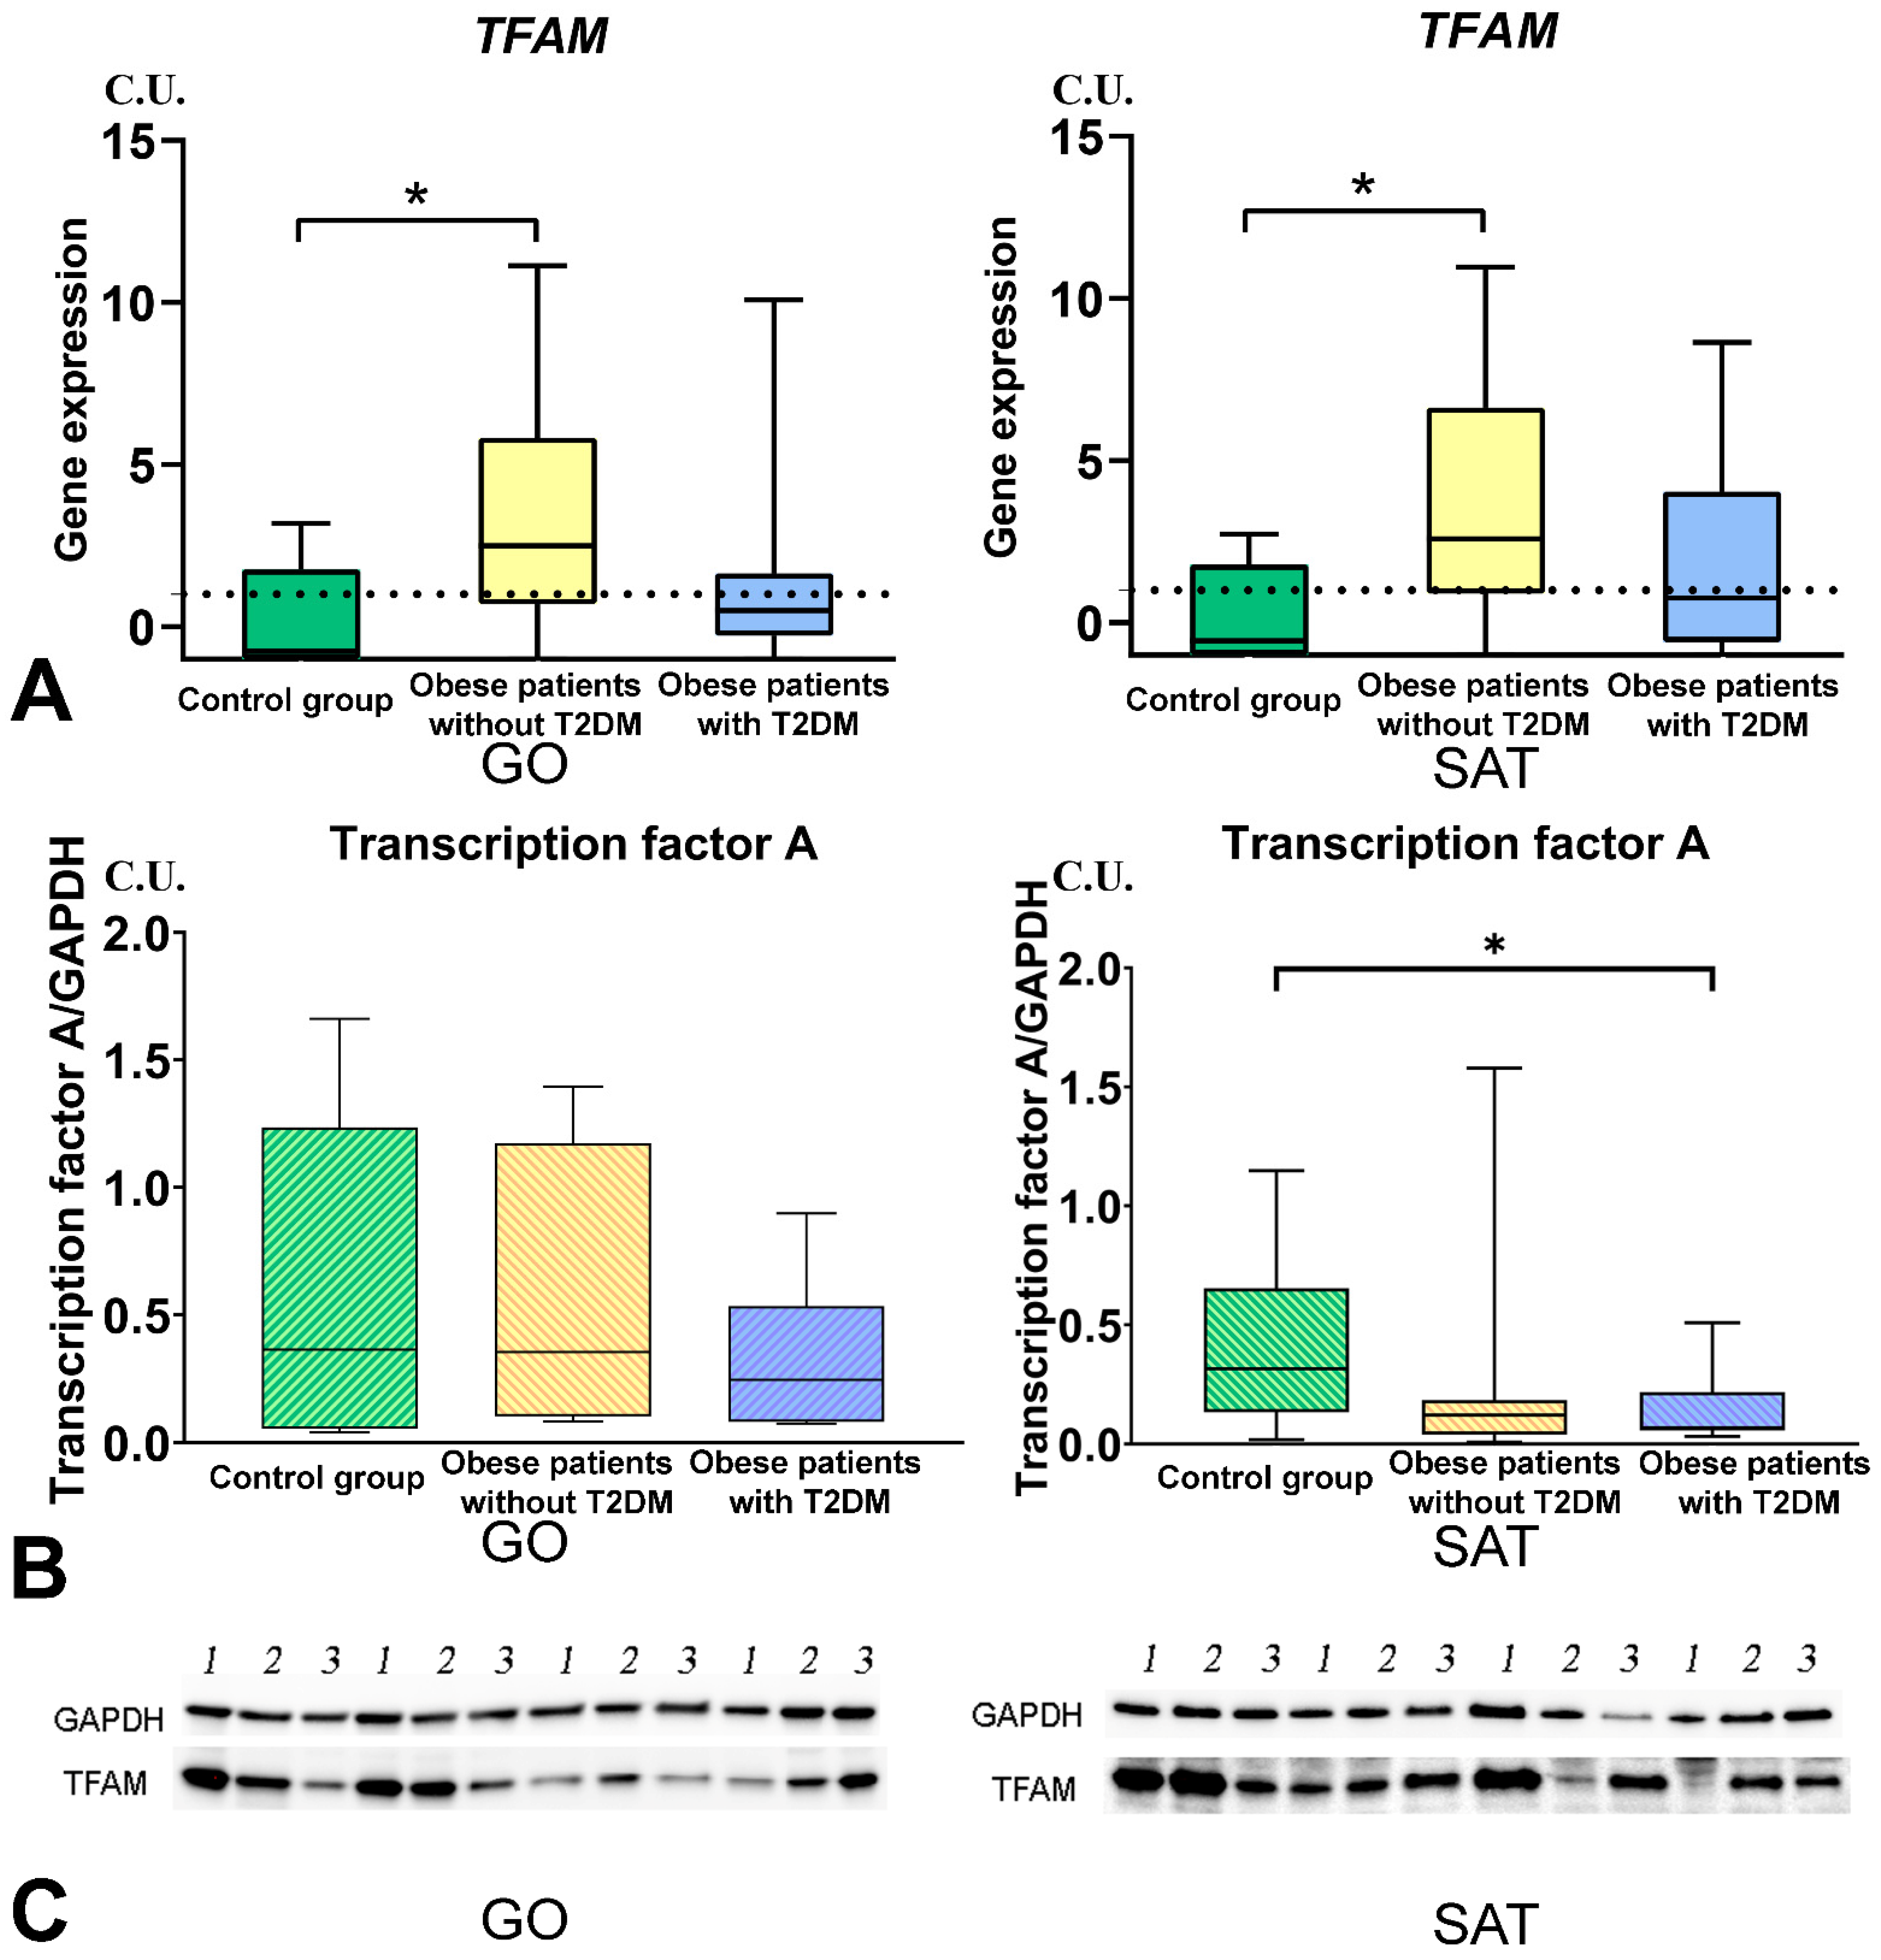
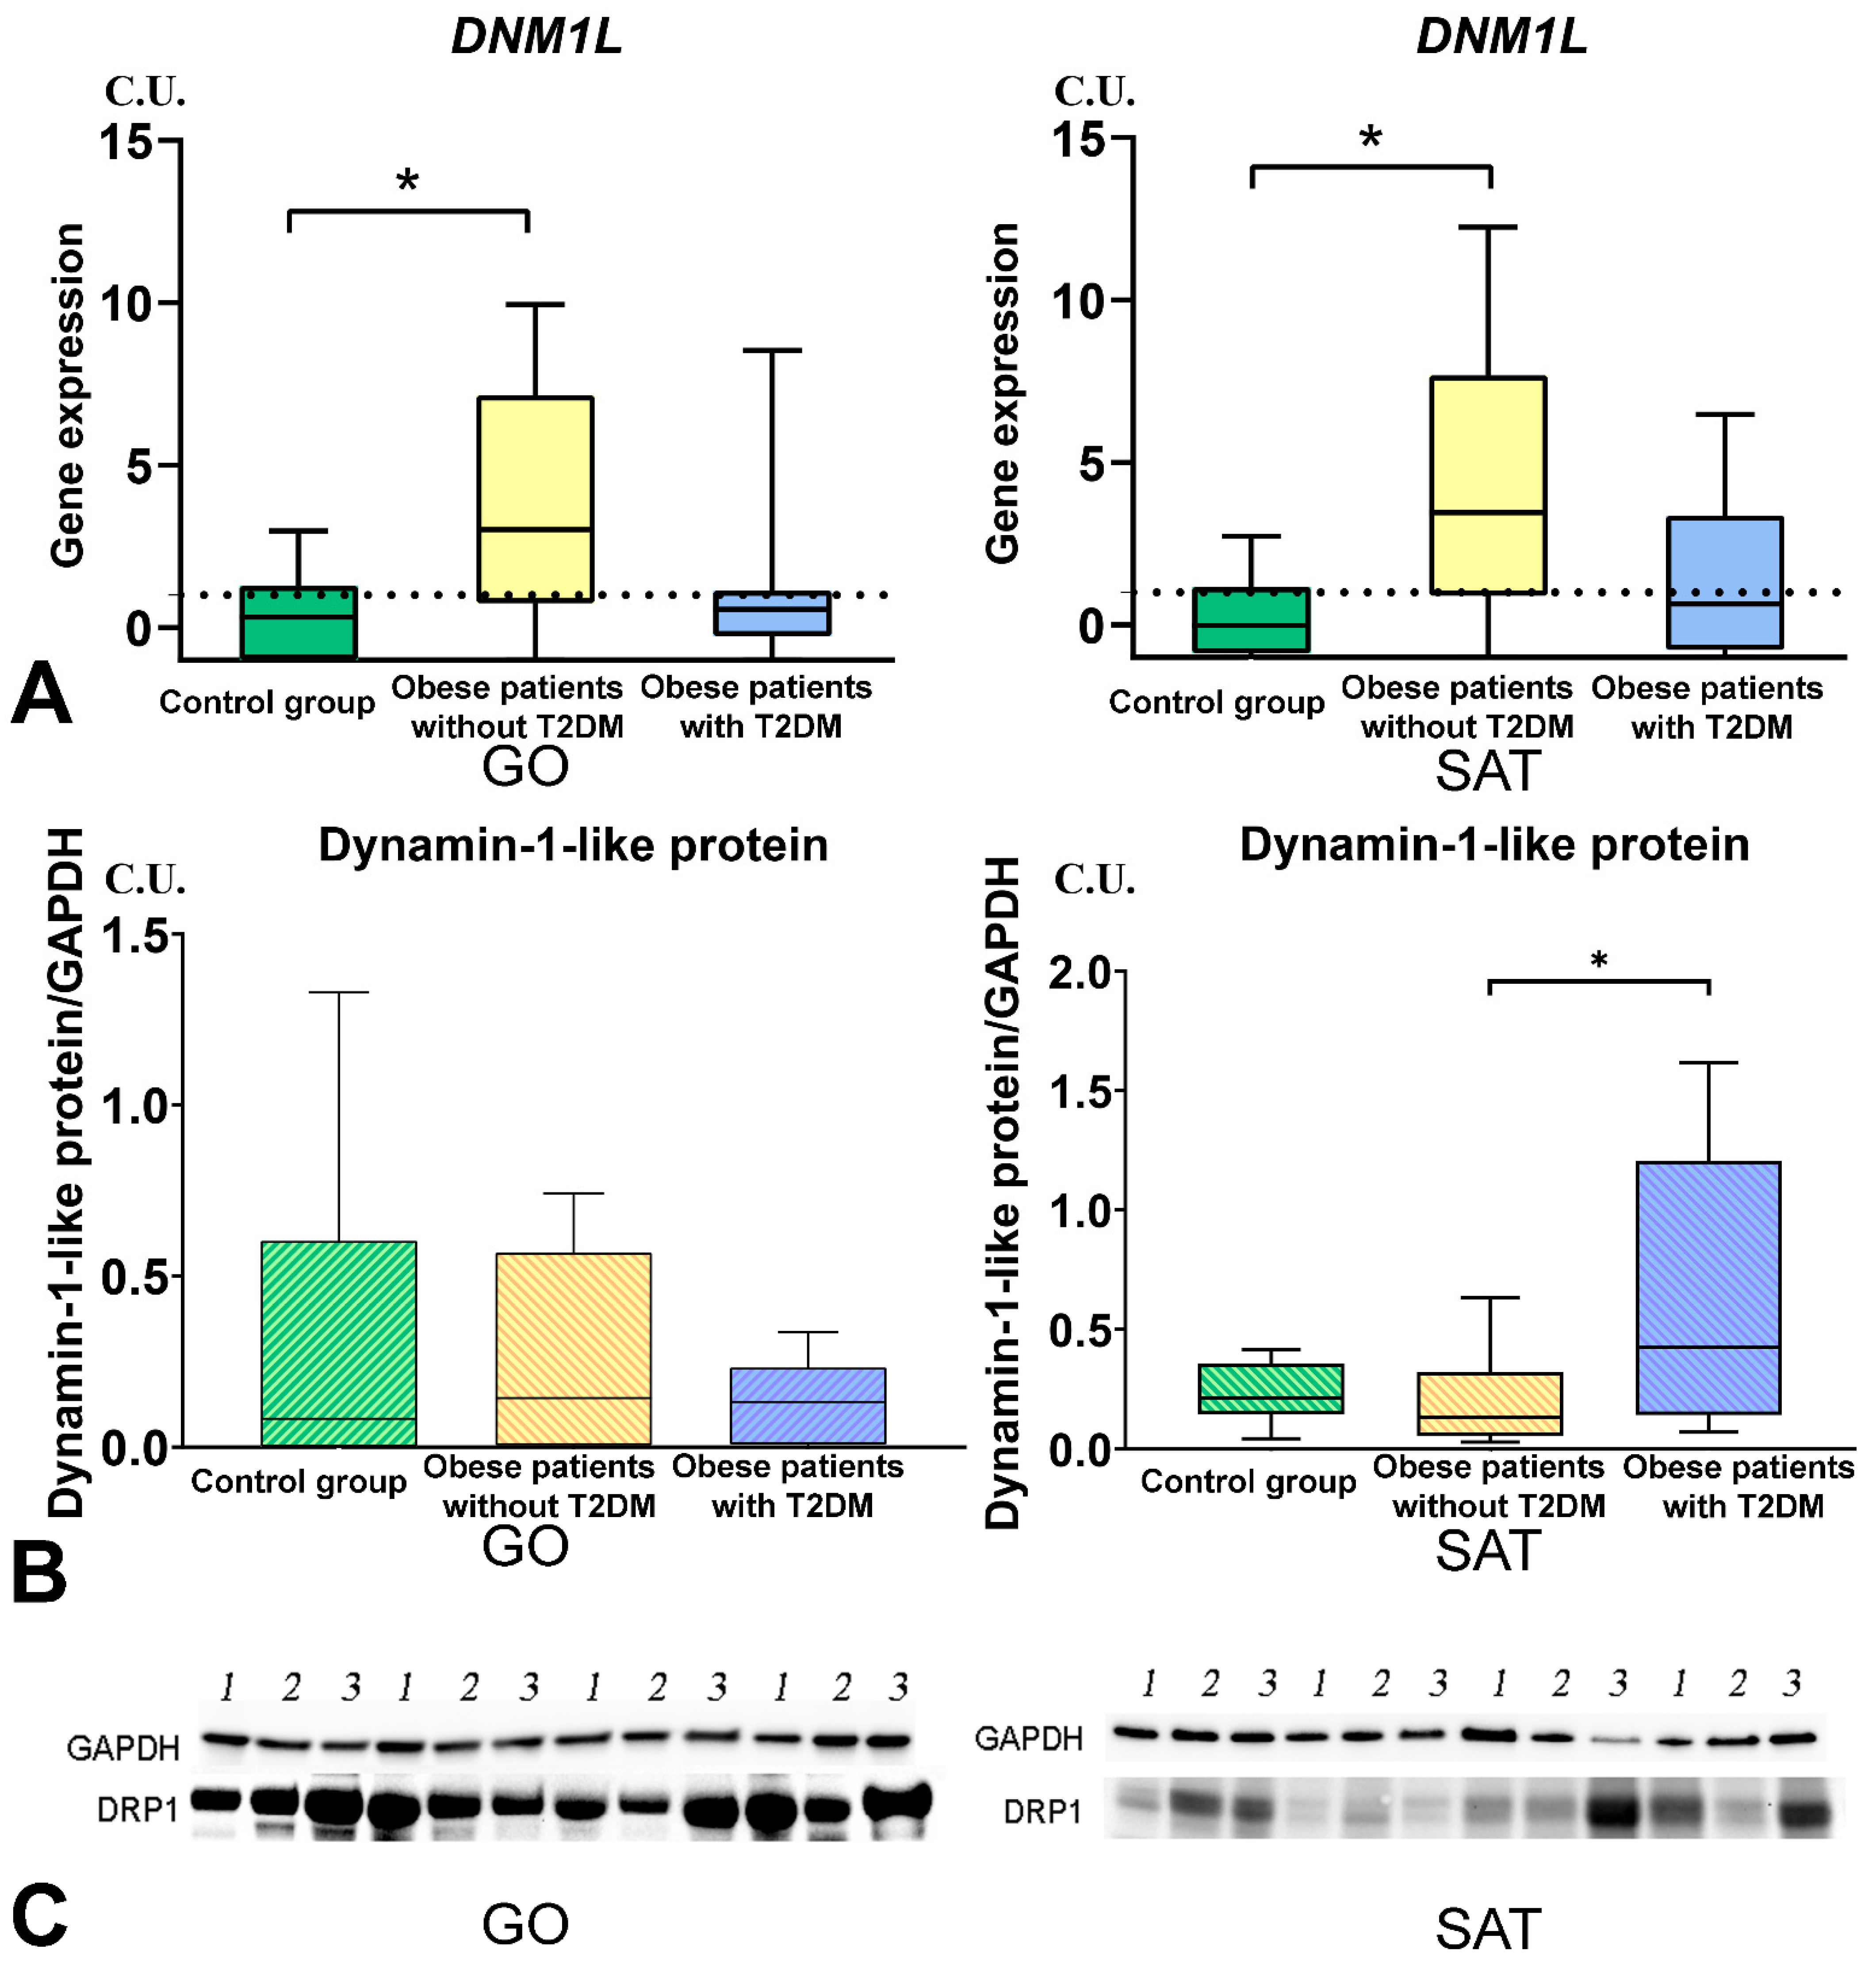
3.4. Mitochondrial Dynamics—Division and Fusion
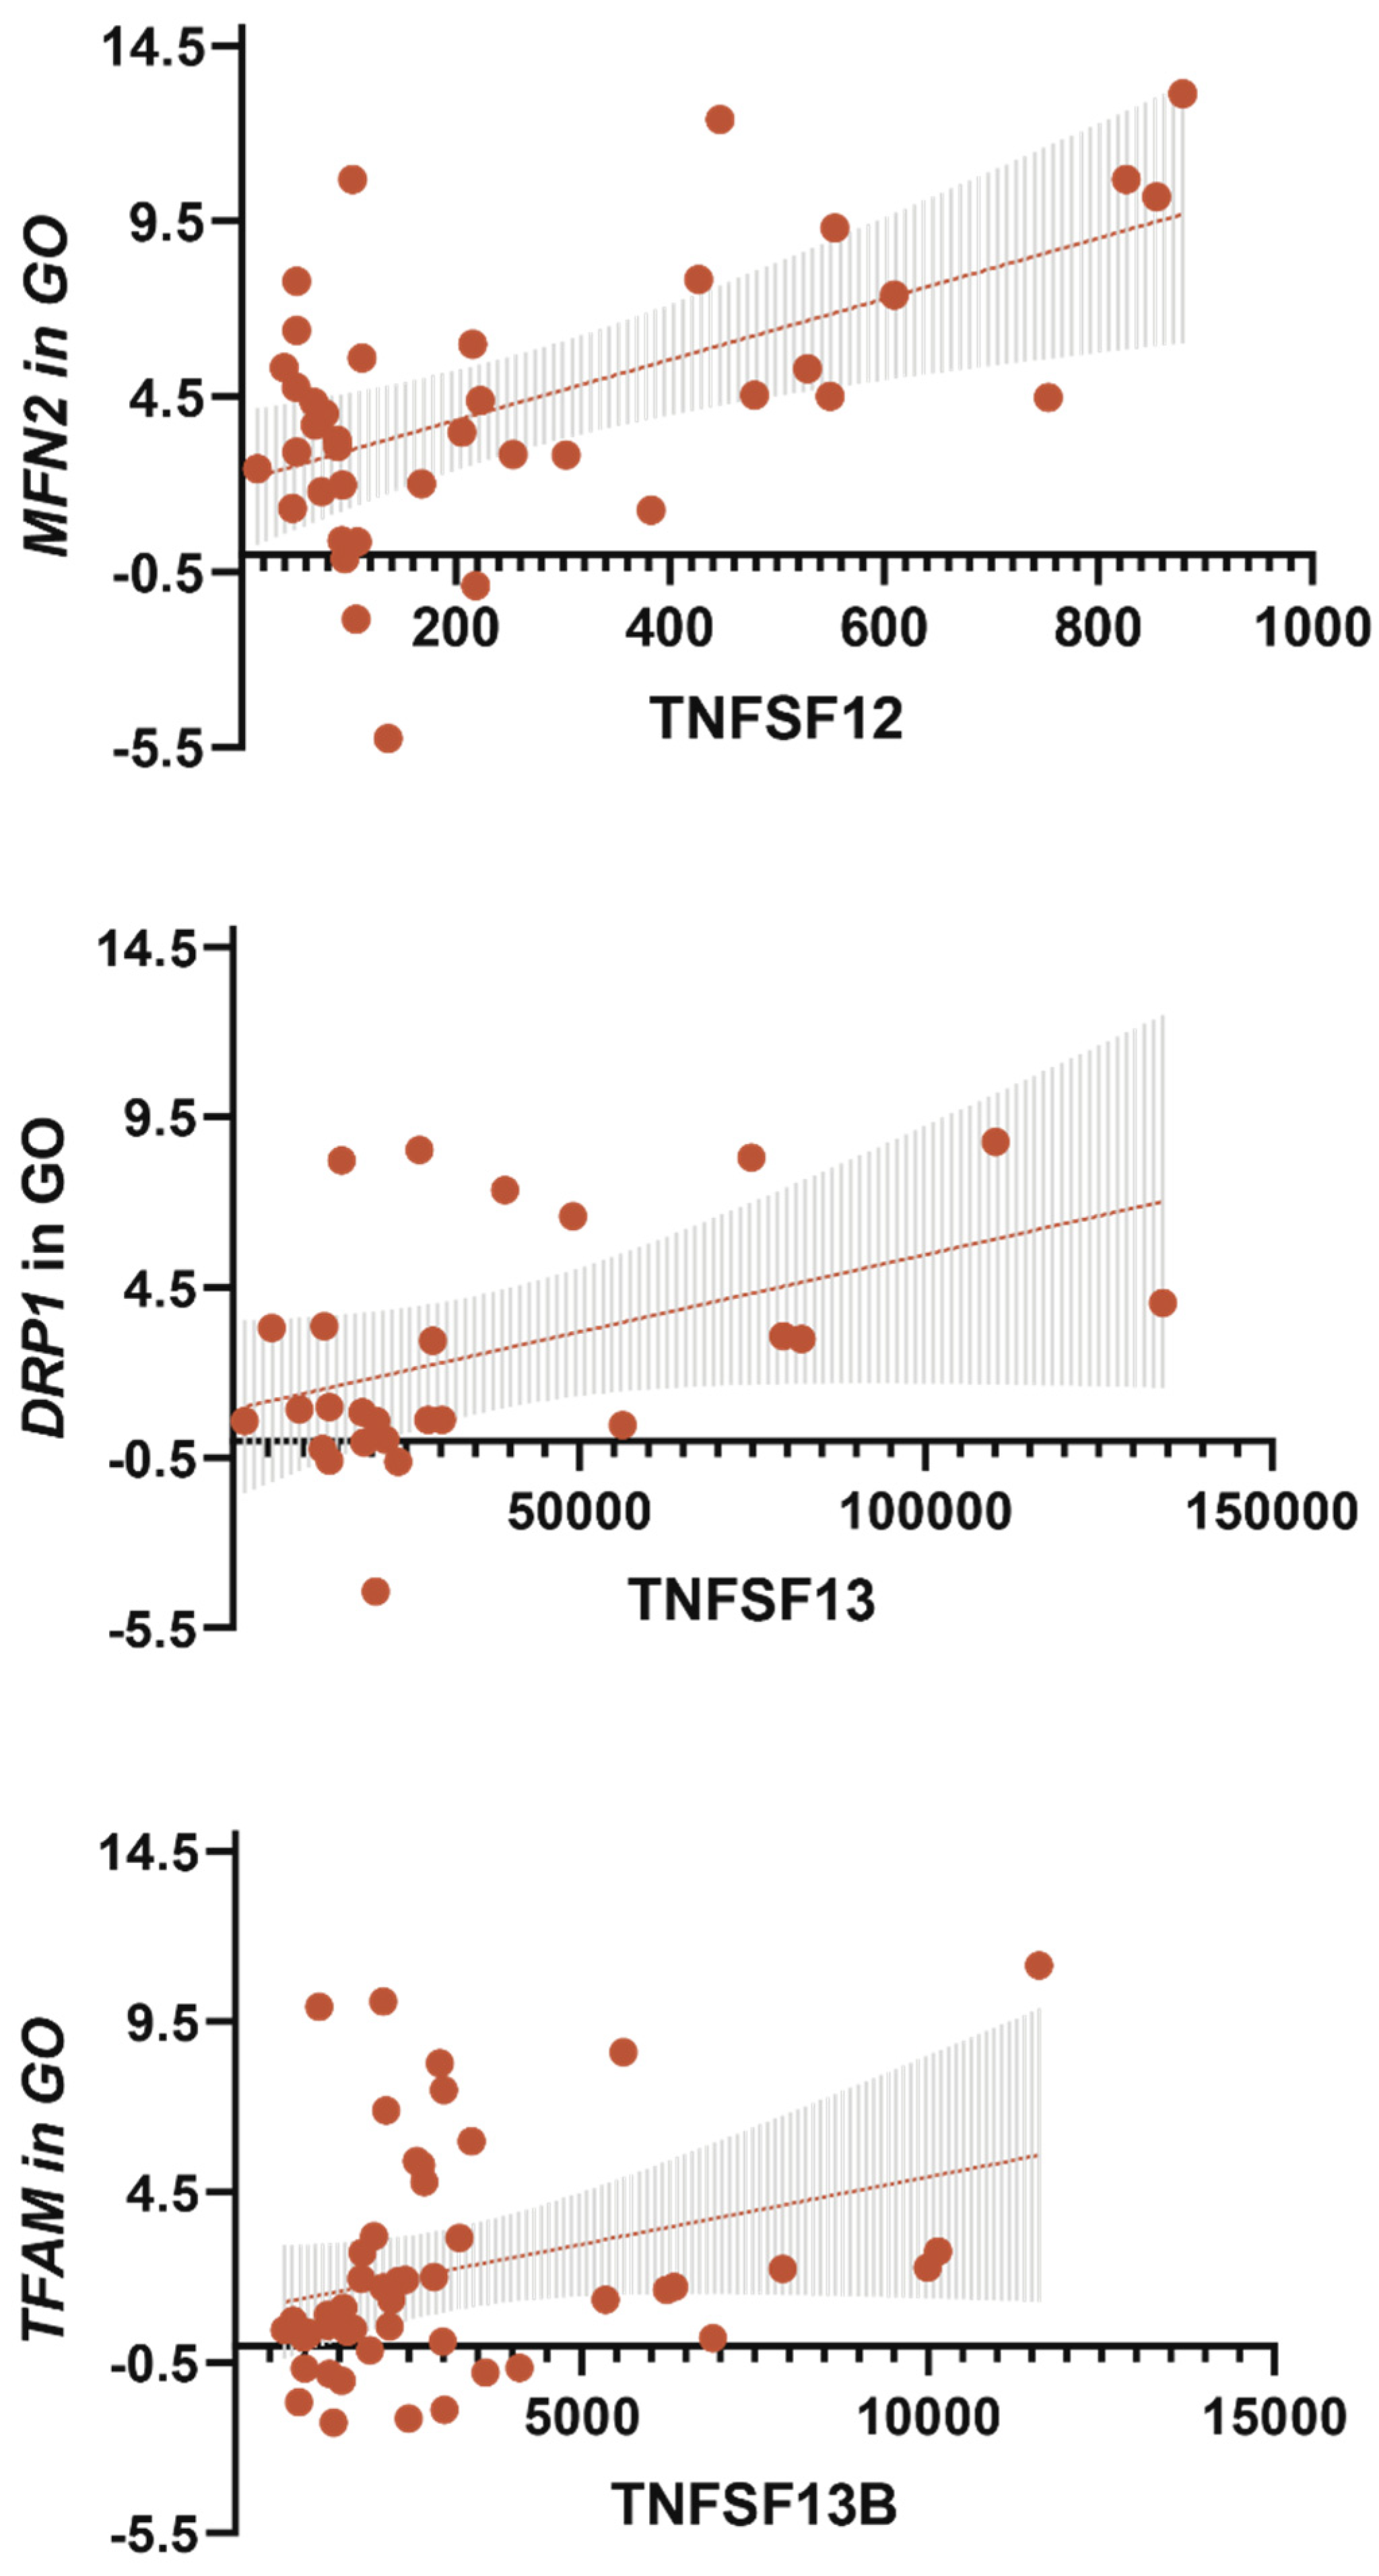
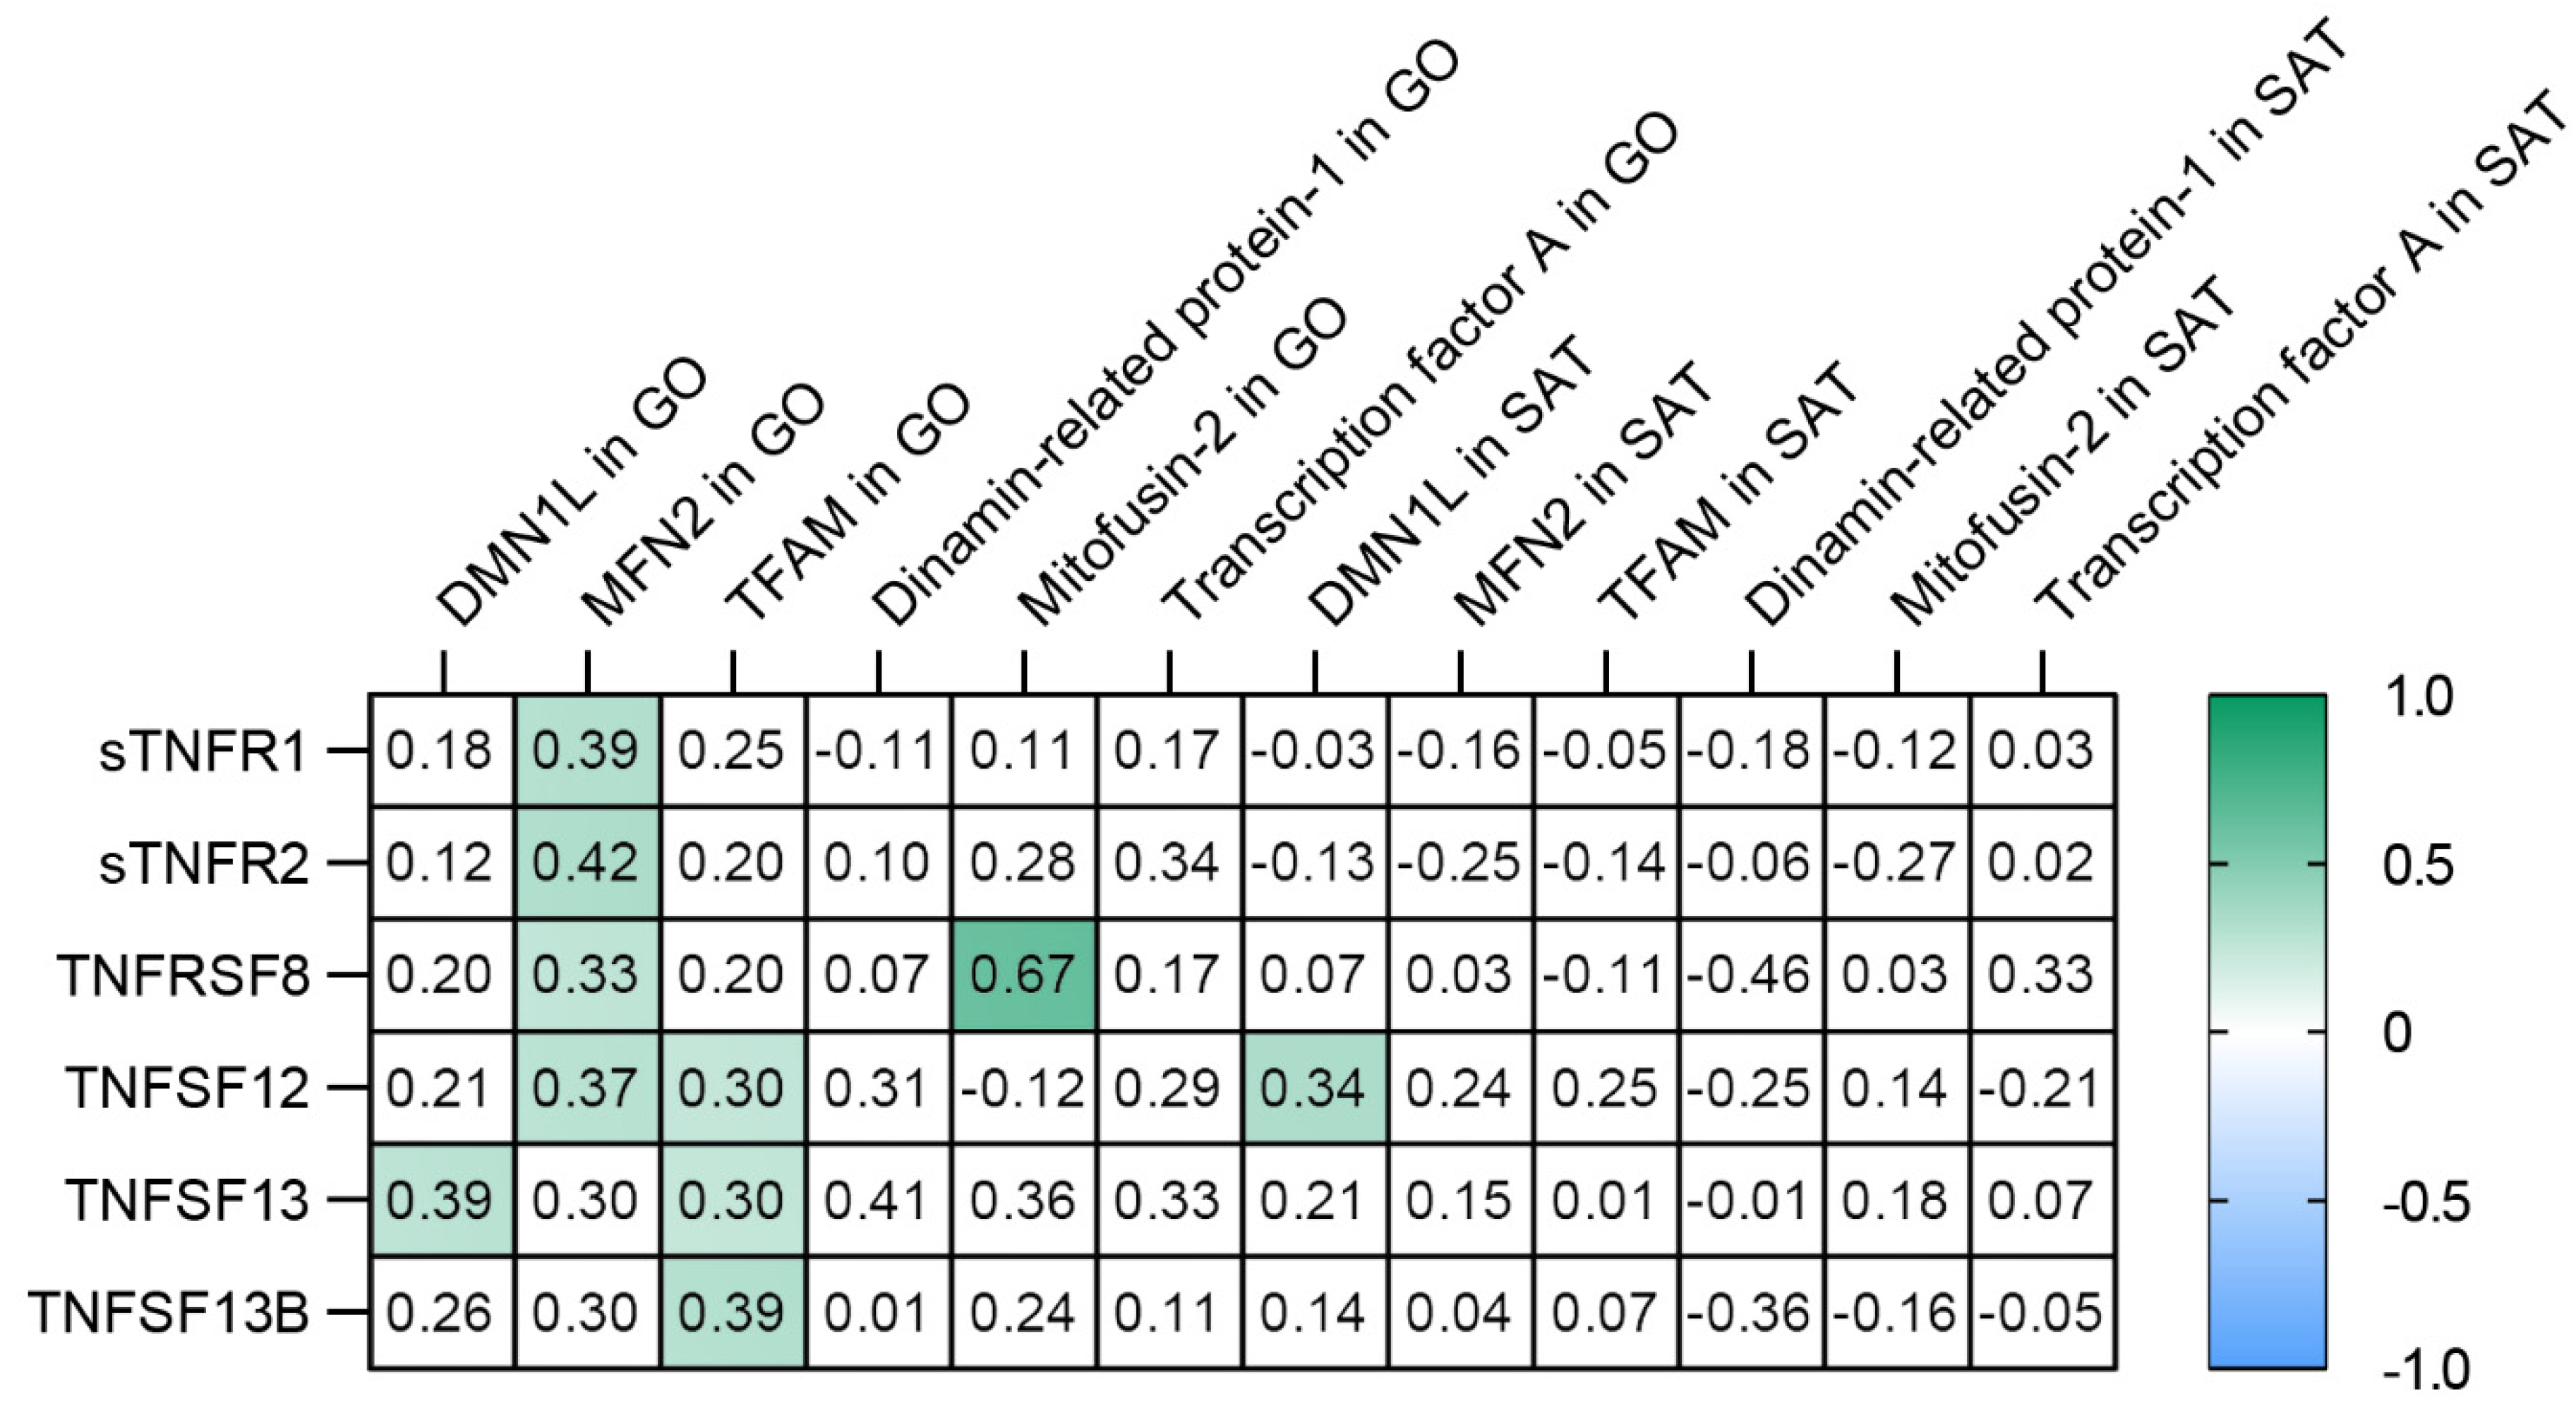
3.5. TNF Receptors and Ligands Levels Have Been Associated with Components of Mitochondrial Dynamics
3.6. TNF-a Level Was Associated with MFN2 Gene Expression in GO
4. Discussion
5. Conclusions
- Increased levels of receptors sTNF-R1, sTNF-R2, TNFRSF8, and ligands TNFSF12, TNFSF13, TNFSF13B are signs of obese patients without T2DM.
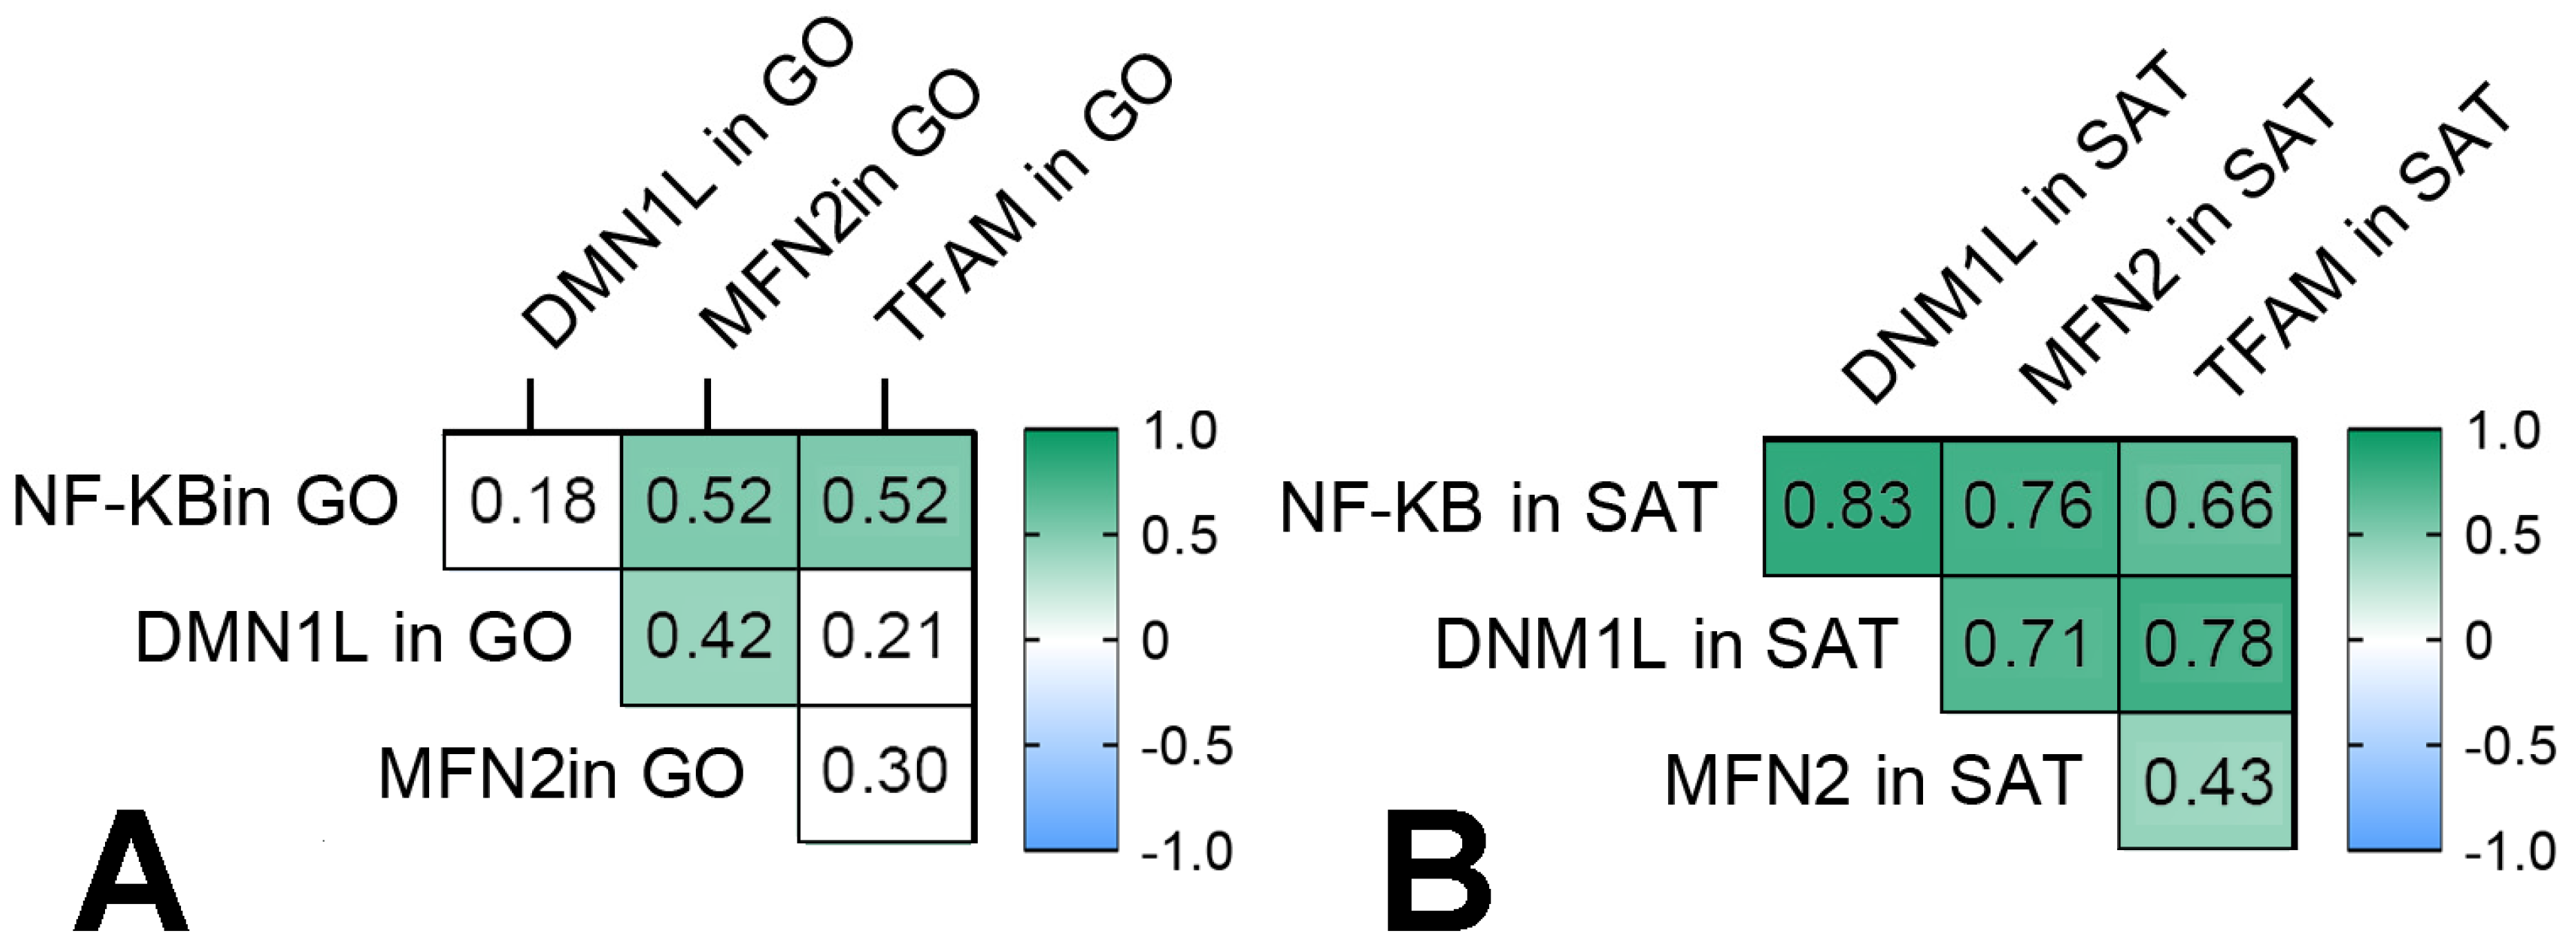
- The TNFSF12 and TNFSF13B levels were associated with NFkB1 gene expression in GO in obese patients, and NFkB1 gene expression increased in GO and SAT in obese patients without T2DM compared with the control group. The NFkB1 gene expression was associated with components of mitochondrial dynamic—DNM1L, MFN2, and TFAM gene expression in GO and SAT in all obese patients.
- The DNM1L, MFN2, and TFAM gene expression levels in GO and SAT responsible for regulating mitochondrial dynamics were increased in obese patients without T2DM, and DNM1L and TFAM proteins production were unbalanced in patients with obesity and T2DM.
- The TNFSF12 levels contributed to an increase in MFN2 gene expression in GO; TNFSF13 contributed to an increase in DNM1L gene expression in GO; TNFSF13B contributed to an increase in TFAM gene expression in GO.
- The TNF-a levels in blood plasma were associated with a decrease in MFN2 gene expression in GO and IL-10 in blood plasma.
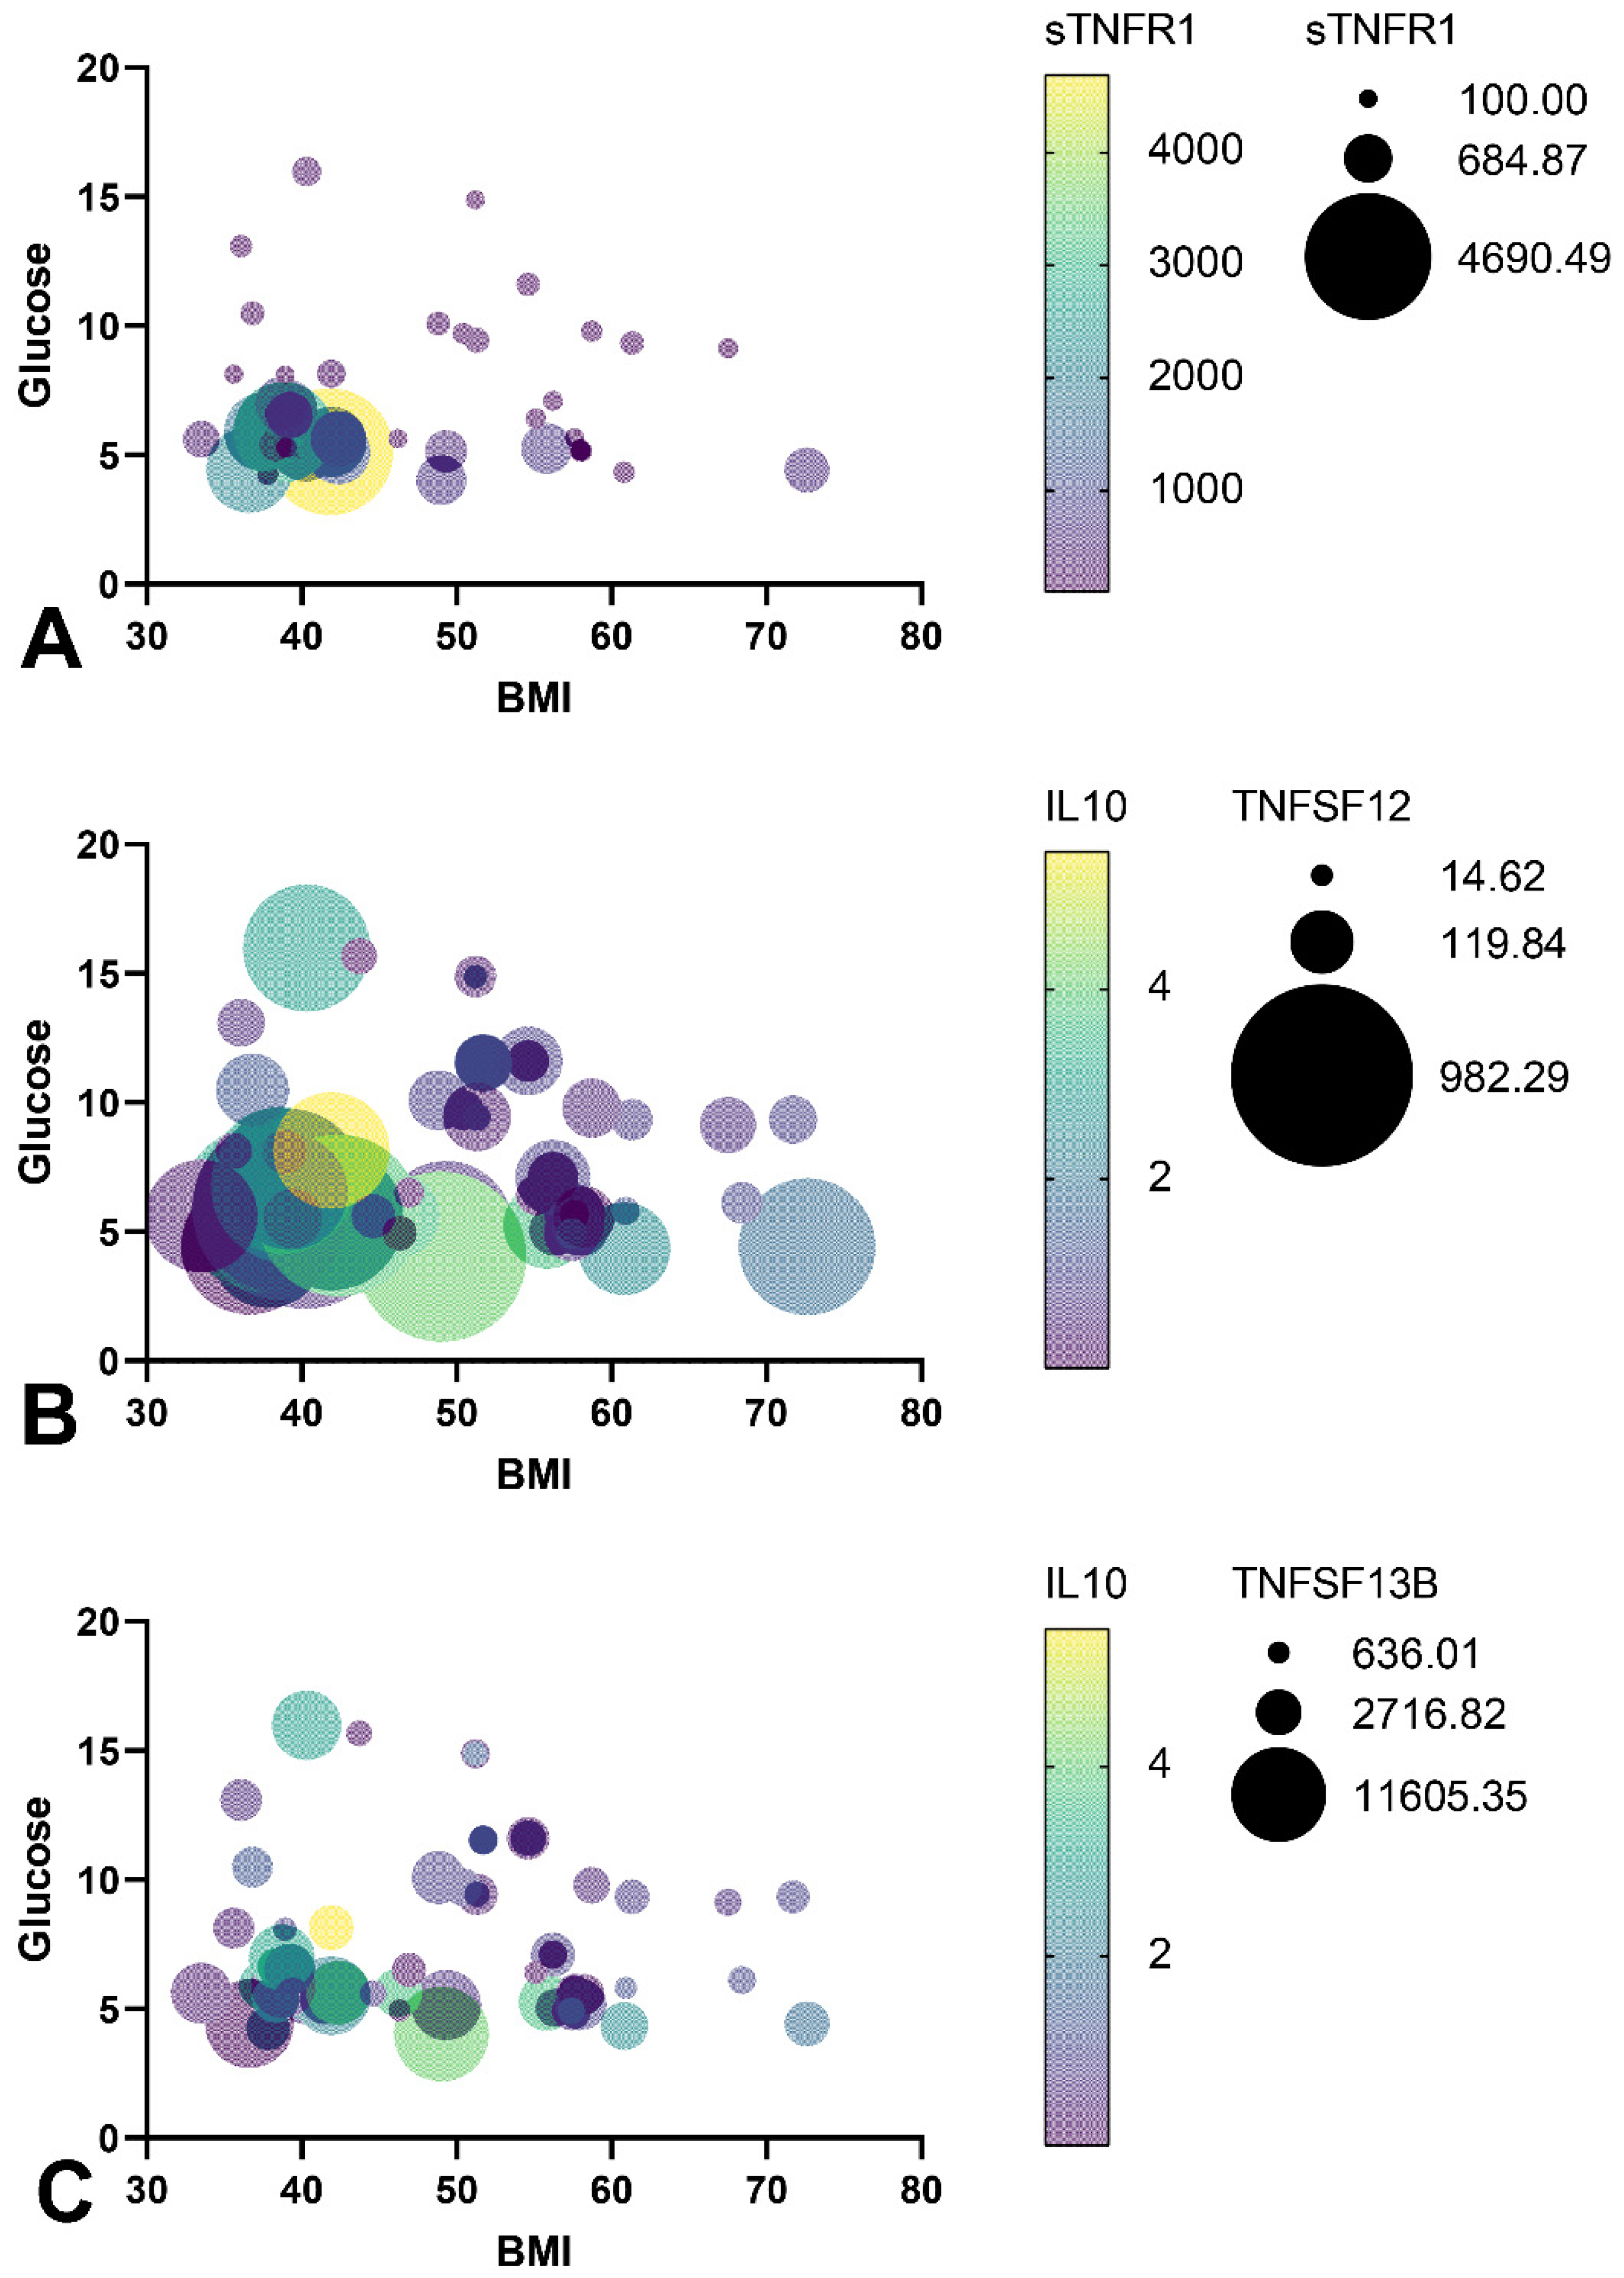
- The TNFSF12 levels contributed to a decrease in glucose levels, a decrease in BMI, and an increase in IL-10 levels by influencing the MFN2 gene expression in GO, which supports mitochondrial fusion.
Supplementary Materials
Author Contributions
Funding
Institutional Review Board Statement
Informed Consent Statement
Data Availability Statement
Acknowledgments
Conflicts of Interest
References
- Sonar, S.; Lal, G. Role of Tumor Necrosis Factor Superfamily in Neuroinflammation and Autoimmunity. Front. Immunol. 2015, 6, 364. [Google Scholar] [CrossRef] [PubMed] [Green Version]
- Niewczas, M.A.; Gohda, T.; Skupien, J.; Smiles, A.M.; Walker, W.H.; Rosetti, F.; Cullere, X.; Eckfeldt, J.H.; Doria, A.; Mayadas, T.N.; et al. Circulating TNF Receptors 1 and 2 Predict ESRD in Type 2 Diabetes. J. Am. Soc. Nephrol. 2012, 23, 507–515. [Google Scholar] [CrossRef]
- Rinaldi, I. The role of Reed-Sternberg CD30 receptor and lymphocytes in pathogenesis of disease and its implication for treatment. Acta Medica Indones. 2018, 50, 93–95. [Google Scholar]
- Acharya, A.B.; Chandrashekar, A.; Acharya, S.; Shettar, L.; Thakur, S. Serum STWEAK Levels in Chronic Periodontitis and Type 2 Diabetes Mellitus. Diabetes Metab. Syndr. 2019, 13, 1609–1613. [Google Scholar] [CrossRef] [PubMed]
- Croft, M.; Duan, W.; Choi, H.; Eun, S.-Y.; Madireddi, S.; Mehta, A. TNF Superfamily in Inflammatory Disease: Translating Basic Insights. Trends Immunol. 2012, 33, 144–152. [Google Scholar] [CrossRef] [Green Version]
- Zhang, Y.; Kent, J.W.; Olivier, M.; Ali, O.; Broeckel, U.; Abdou, R.M.; Dyer, T.D.; Comuzzie, A.; Curran, J.E.; Carless, M.A.; et al. QTL-Based Association Analyses Reveal Novel Genes Influencing Pleiotropy of Metabolic Syndrome (MetS). Obesity 2013, 21, 2099–2111. [Google Scholar] [CrossRef] [Green Version]
- Suryavanshi, S.V.; Kulkarni, Y.A. NF-Κβ: A potential target in the management of vascular complications of diabetes. Front. Pharmacol. 2017, 8, 798. [Google Scholar] [CrossRef] [Green Version]
- Morgan, M.J.; Liu, Z. Crosstalk of reactive oxygen species and NF-ΚB signaling. Cell Res. 2011, 21, 103–115. [Google Scholar] [CrossRef] [Green Version]
- Guzik, T.J.; Skiba, D.S.; Touyz, R.M.; Harrison, D.G. The role of infiltrating immune cells in dysfunctional adipose tissue. Cardiovasc. Res. 2017, 113, 1009–1023. [Google Scholar] [CrossRef] [Green Version]
- Lee, J.H.; Park, A.; Oh, K.-J.; Lee, S.C.; Kim, W.K.; Bae, K.-H. The role of adipose tissue mitochondria: Regulation of mitochondrial function for the treatment of metabolic diseases. Int. J. Mol. Sci. 2019, 20, 4924. [Google Scholar] [CrossRef] [Green Version]
- Heinonen, S.; Buzkova, J.; Muniandy, M.; Kaksonen, R.; Ollikainen, M.; Ismail, K.; Hakkarainen, A.; Lundbom, J.; Lundbom, N.; Vuolteenaho, K.; et al. Impaired mitochondrial biogenesis in adipose tissue in acquired obesity. Diabetes 2015, 64, 3135–3145. [Google Scholar] [CrossRef] [PubMed] [Green Version]
- Sivitz, W.I.; Yorek, M.A. Mitochondrial dysfunction in diabetes: From molecular mechanisms to functional significance and therapeutic opportunities. Antioxid. Redox Signal. 2010, 12, 537–577. [Google Scholar] [CrossRef] [PubMed] [Green Version]
- Shi, J.-H.; Sun, S.-C. Tumor necrosis factor receptor-associated factor regulation of nuclear factor ΚB and mitogen-activated protein kinase pathways. Front. Immunol. 2018, 9, 1849. [Google Scholar] [CrossRef]
- Hayden, M.S.; Ghosh, S. Regulation of NF-ΚB by TNF family cytokines. Semin. Immunol. 2014, 26, 253–266. [Google Scholar] [CrossRef] [PubMed] [Green Version]
- Bassols, J.; Moreno, J.M.; Ortega, F.; Ricart, W.; Fernandez-Real, J.M. Characterization of herpes virus entry mediator as a factor linked to obesity. Obesity 2010, 18, 239–246. [Google Scholar] [CrossRef] [PubMed]
- Livak, K.J.; Schmittgen, T.D. Analysis of relative gene expression data using real-time quantitative PCR and the 2(-Delta Delta C(T)) Method. Methods 2001, 4, 402–408. [Google Scholar] [CrossRef] [PubMed]
- So, T.; Ishii, N. The TNF-TNFR family of co-signal molecules. Adv. Exp. Med. Biol. 2019, 1189, 53–84. [Google Scholar] [CrossRef]
- Bora, K.; Pathak, M.S.; Borah, P.; Das, D. Association of decreased High-Density Lipoprotein Cholesterol (HDL-C) with obesity and risk estimates for decreased HDL-C attributable to obesity. J. Prim. Care Community Health 2017, 8, 26–30. [Google Scholar] [CrossRef] [PubMed]
- Mühl, H. Pro-inflammatory signaling by IL-10 and IL-22: Bad habit stirred up by interferons? Front. Immunol. 2013, 4, 18. [Google Scholar] [CrossRef] [PubMed] [Green Version]
- Wronska, A.; Kmiec, Z. Structural and biochemical characteristics of various white adipose tissue depots. Acta Physiol. 2012, 205, 194–208. [Google Scholar] [CrossRef]
- Ndisang, J.F.; Vannacci, A.; Rastogi, S. Insulin Resistance, Type 1 and Type 2 Diabetes, and Related Complications 2017. J. Diabetes Res. 2017, 2017, 1478294. [Google Scholar] [CrossRef]
- Tiller, G.; Laumen, H.; Fischer-Posovszky, P.; Finck, A.; Skurk, T.; Keuper, M.; Brinkmann, U.; Wabitsch, M.; Link, D.; Hauner, H. LIGHT (TNFSF14) inhibits adipose differentiation without affecting adipocyte metabolism. Int. J. Obes. 2011, 35, 208–216. [Google Scholar] [CrossRef] [Green Version]
- Yu, T.; Robotham, J.L.; Yoon, Y. Increased Production of Reactive Oxygen Species in Hyperglycemic Conditions Requires Dynamic Change of Mitochondrial Morphology. Proc. Natl. Acad. Sci. USA 2006, 103, 2653–2658. [Google Scholar] [CrossRef] [PubMed] [Green Version]
- Koh, J.-H.; Johnson, M.L.; Dasari, S.; LeBrasseur, N.K.; Vuckovic, I.; Henderson, G.C.; Cooper, S.A.; Manjunatha, S.; Ruegsegger, G.N.; Shulman, G.I.; et al. TFAM enhances fat oxidation and attenuates high-fat diet–induced insulin resistance in skeletal muscle. Diabetes 2019, 68, 1552–1564. [Google Scholar] [CrossRef]
- El-Hattab, A.W.; Craigen, W.J.; Scaglia, F. Mitochondrial DNA Maintenance Defects. Biochim. Biophys. Acta Mol. Basis Dis. 2017, 1863, 1539–1555. [Google Scholar] [CrossRef]
- Luan, G.; Li, G.; Ma, X.; Jin, Y.; Hu, N.; Li, J.; Wang, Z.; Wang, H. Dexamethasone-induced mitochondrial dysfunction and insulin resistance-study in 3T3-L1 adipocytes and mitochondria isolated from mouse liver. Molecules 2019, 24, 1982. [Google Scholar] [CrossRef] [PubMed] [Green Version]
- Litvinova, L.; Zatolokin, P.; Vulf, M.; Mazunin, I.; Skuratovskaia, D. The Relationship between the MtDNA Copy Number in Insulin-Dependent Tissues and Markers of Endothelial Dysfunction and Inflammation in Obese Patients. BMC Med. Genom. 2019, 12, 41. [Google Scholar] [CrossRef] [Green Version]
- Skuratovskaia, D.; Zatolokin, P.; Vulf, M.; Mazunin, I.; Litvinova, L. Interrelation of chemerin and TNF-α with MtDNA copy number in adipose tissues and blood cells in obese patients with and without type 2 diabetes. BMC Med. Genom. 2019, 12, 40. [Google Scholar] [CrossRef] [PubMed] [Green Version]
- Chandrasekaran, K.; Anjaneyulu, M.; Inoue, T.; Choi, J.; Sagi, A.R.; Chen, C.; Ide, T.; Russell, J.W. Mitochondrial Transcription Factor A Regulation of Mitochondrial Degeneration in Experimental Diabetic Neuropathy. Am. J. Physiol. Endocrinol. Metab. 2015, 309, E132–E141. [Google Scholar] [CrossRef] [Green Version]


| Gene Name | Sequences of Primers and Probes |
|---|---|
| RPLPO | F: 5′-GGCGACCTGGAAGTCCAACT-3′ R: 5′-CCATCAGCACCACAGCCTTC-3′ Bgl635-5′-ATCTGCTGCATCTGCTTGGAGCCCA-3′-BHQ-2 |
| NFkB1 | F: 5′-CAGGAAGATGTGGTGGAGGA-3′ R: 5′-TGGGGTGGTCAAGAAGTAGTG-3′ FAM-5′-CCTTCTGGACCGCTTGGGTAACTCTGT-3′-BHQ-1 |
| TFAM | F: 5′-CGCTCCCCCTTCAGTTTTGT-3′ R: 5′-TACCTGCCACTCCGCCCTAT-3′ FAM-5′-CGAGGTGGTTTTCATCTGTCTTGGCA-3′-BHQ-1 |
| DNM1L | F: 5′-TCTGGAGGTGGTGGGGTTG-3′ R: 5′-TGGGTTTTGATTTTTCTTCTGCTAAT-3′ FAM-5′-ACCAACCACAGGCAACTGGAGAGGA-3′-BHQ-1 |
| MFN2 | F: 5′-CCAGCGTCCCATCCCTCT-3′ R: 5′-TCCACACCACTCCTCCAACA-3′ FAM-5′-ACAGGGCTCGCTCACCCAGGAG-3′-BHQ-1 |
| Cytokine (pg/mL) | Control Group (n = 16) | Obese Patients without T2DM (n = 41) | Obese Patients with T2DM (n = 45) |
|---|---|---|---|
| TNF-a | 2.120 (1.56–3.120) | 14.71 (10.44–16.89) p1–2 < 0.001 * | 32.86 (20.15–34.42) p1–3 < 0.001 * p2–3 < 0.001 * |
| sTNF-R1 | 110.36 (89.41–229.08) | 591.57 (187.88–1229.37) p1–2 < 0.001 * | 96.1 (53.05–134.83) p1–3 = 0.021 * p2–3 < 0.001 * |
| sTNF-R2 | 59.39 (48.03–111.73) | 206.92 (107.19–288.66) p1–2 < 0.001 * | 86.10 (52.21–137.23) p2–3 < 0.001 * |
| sTNFRSF8 | 31.82 (22.61–50.17) | 65.13 (34.26–116.48) p1–2 < 0.001 * | 23.01 (14.51–35.53) p1–3 = 0.023 * p2–3 < 0.001 * |
| TNFSF12 | 347.33 (247.81–464.02) | 541.25 (278.36–691.23) p1–2 = 0.050* | 64.15 (39.54–103.46) p1–3 < 0.001 * p2–3 < 0.001 * |
| TNFSF13 | 20,872.63 (17,224.93–31,761.95) | 48,896.8 (28,910.78–80,400.51) p1–2 < 0.001 * | 14,131.77 (8361.43–20,974.42) p1–3 = 0.001 * p2–3 < 0.001 * |
| TNFSF13B | 2103.81 (1565.48–3381.11) | 3411.06 (2610.11–5571.37) p1–2 < 0.001 * | 1387.88 (921.86–2135.25) p1–3 = 0.001 * p2–3 < 0.001* |
| IL-10 | 0.64 (0.32–1.53) | 2.18 (1.11–3.44) p1–2 = 0.001 * | 0.75 (0.26–0.99) p2–3 < 0.001 * |
| Multiple Regression | Dependent Variable | Independent Variable | β | Standard Error | t-Value | p-Value |
|---|---|---|---|---|---|---|
| Multiple regression linear Model 1 Multiple R-squared = 0.167, Adjusted R-squared = 0.141, p-value = 0.0026 | sTNF-R1 | BMI | −0.297 | 0.105 | −2.819 | 0.0063 * |
| Glucose | −0.241 | 0.110 | −2.179 | 0.0329 * | ||
| Multiple regression linear Model 2 Multiple R-squared = 0.466, Adjusted R-squared = 0.438, p-value < 0.0001 | TNFSF12 | BMI | −0.325 | 0.082 | −3.927 | 0.0002 * |
| Glucose | −0.262 | 0.085 | −3.082 | 0.0031 * | ||
| IL10 | 0.439 | 0.122 | 3.585 | 0.0006 * | ||
| Multiple regression linear Model 3 Multiple R-squared = 0.290, Adjusted R-squared = 0.252, p-value = 0.0001 * | TNFSF13B | BMI | −0.251 | 0.093 | −2.693 | 0.0092 * |
| Glucose | −0.196 | 0.095 | −2.052 | 0.0447 * | ||
| IL10 | 0.341 | 0.137 | 2.479 | 0.0161 * |
| Multiple Regression | Dependent Variable | Independent Variable | β | Standard Error | t-Value | p-Value |
|---|---|---|---|---|---|---|
| Multiple regression linear Model 4 Multiple R-squared = 0.626 Adjusted R-squared = 0.574 p-value < 0.0001 * | TNFSF12 | BMI | −0.217 | 0.087 | −2.493 | 0.0186 * |
| Glucose | −0.208 | 0.094 | −2.204 | 0.0356 * | ||
| IL10 | 0.334 | 0.149 | 2.246 | 0.0324 * | ||
| MFN2 in GO | 0.359 | 0.103 | 3.478 | 0.0016 * |
| Multiple Regression | Dependent Variable | Independent Variable | β | Standard Error | t-Value | p-Value |
|---|---|---|---|---|---|---|
| Multiple regression linear Model 5 Multiple R-squared = 0.702, Adjusted R-squared = 0.665, p-value = 6.123 × 10⁻⁵ | TNF-a | IL10 | −0.576 | 0.239 | −2.404 | 0.0286 * |
| MFN2 in GO | −0.526 | 0.112 | −4.695 | 0.0001 * |
Publisher’s Note: MDPI stays neutral with regard to jurisdictional claims in published maps and institutional affiliations. |
© 2021 by the authors. Licensee MDPI, Basel, Switzerland. This article is an open access article distributed under the terms and conditions of the Creative Commons Attribution (CC BY) license (https://creativecommons.org/licenses/by/4.0/).
Share and Cite
Shunkina, D.; Komar, A.; Vulf, M.; Quang, H.V.; Shunkin, E.; Kirienkova, E.; Dakchnevich, A.; Malkov, D.; Zatolokin, P.; Litvinova, L. Tumor Necrosis Receptor Superfamily Interact with Fusion and Fission of Mitochondria of Adipose Tissue in Obese Patients without Type 2 Diabetes. Biomedicines 2021, 9, 1260. https://doi.org/10.3390/biomedicines9091260
Shunkina D, Komar A, Vulf M, Quang HV, Shunkin E, Kirienkova E, Dakchnevich A, Malkov D, Zatolokin P, Litvinova L. Tumor Necrosis Receptor Superfamily Interact with Fusion and Fission of Mitochondria of Adipose Tissue in Obese Patients without Type 2 Diabetes. Biomedicines. 2021; 9(9):1260. https://doi.org/10.3390/biomedicines9091260
Chicago/Turabian StyleShunkina (Skuratovskaia), Daria, Alexandra Komar, Maria Vulf, Hung Vu Quang, Egor Shunkin, Elena Kirienkova, Anastasiia Dakchnevich, Danil Malkov, Pavel Zatolokin, and Larisa Litvinova. 2021. "Tumor Necrosis Receptor Superfamily Interact with Fusion and Fission of Mitochondria of Adipose Tissue in Obese Patients without Type 2 Diabetes" Biomedicines 9, no. 9: 1260. https://doi.org/10.3390/biomedicines9091260
APA StyleShunkina, D., Komar, A., Vulf, M., Quang, H. V., Shunkin, E., Kirienkova, E., Dakchnevich, A., Malkov, D., Zatolokin, P., & Litvinova, L. (2021). Tumor Necrosis Receptor Superfamily Interact with Fusion and Fission of Mitochondria of Adipose Tissue in Obese Patients without Type 2 Diabetes. Biomedicines, 9(9), 1260. https://doi.org/10.3390/biomedicines9091260