
Local Experimental Intracerebral Hemorrhage in Rats

 and
and
Abstract
1. Introduction
2. Materials and Methods
2.1. Animals
2.2. Animal Model
- Intact—intact animals kept under equal conditions (n = 6).
- Sham—sham-operated animals (n = 8) underwent anesthesia and surgery with craniotomy without brain traumatization.
- Model—operated on animals with reproduced intracerebral hematoma (n = 16)
- (a)
- Animal not moving, unresponsive to stimulation, or in a lateral recumbent position.
- (b)
- Weight loss exceeding 20% beyond 48 h post-stroke despite all efforts to supplement fluid and diet.
- (c)
- Respiratory distress persisting beyond the first 48 h.
- (d)
- Intermittent abnormal motor activity, suggestive of seizure, tonic clonic seizures, persisting beyond first 72 h, presence of barrel rolling.
- (e)
- No recovery of weight towards the pre-stroke level 7 days post-stroke.
2.3. Neurological Deficit Assessment
2.4. Statistics
3. Results
3.1. Mortality
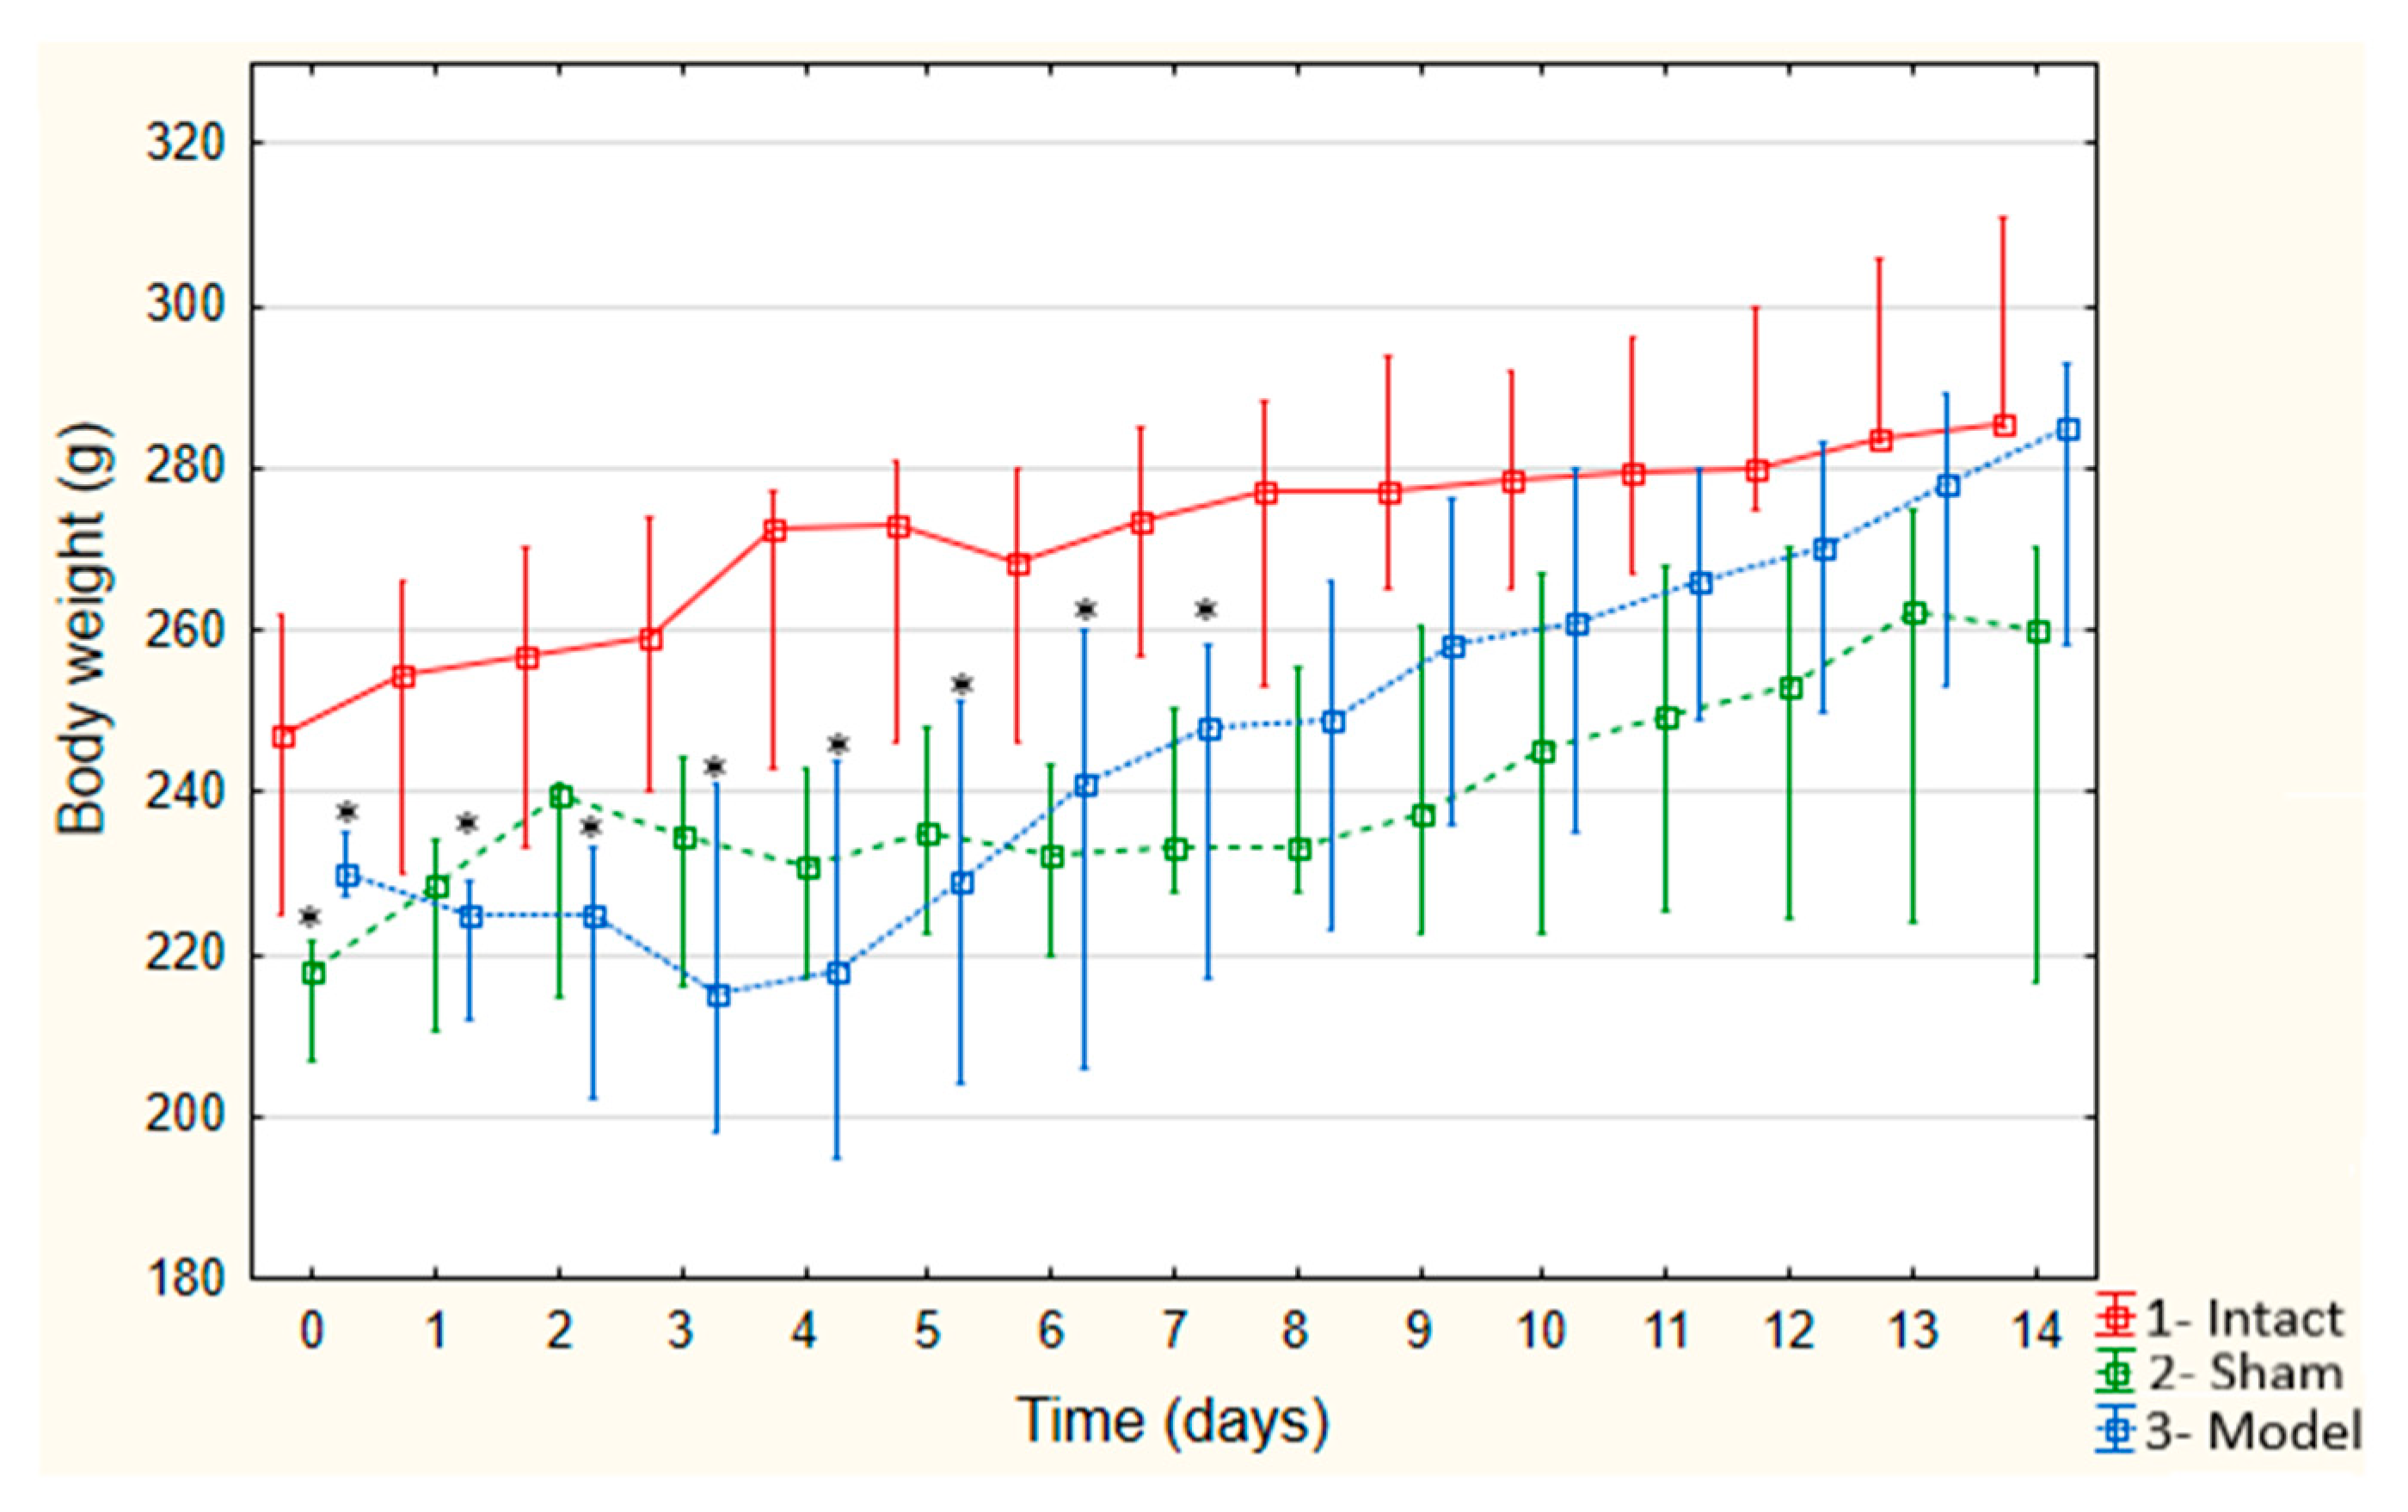
3.2. Weight
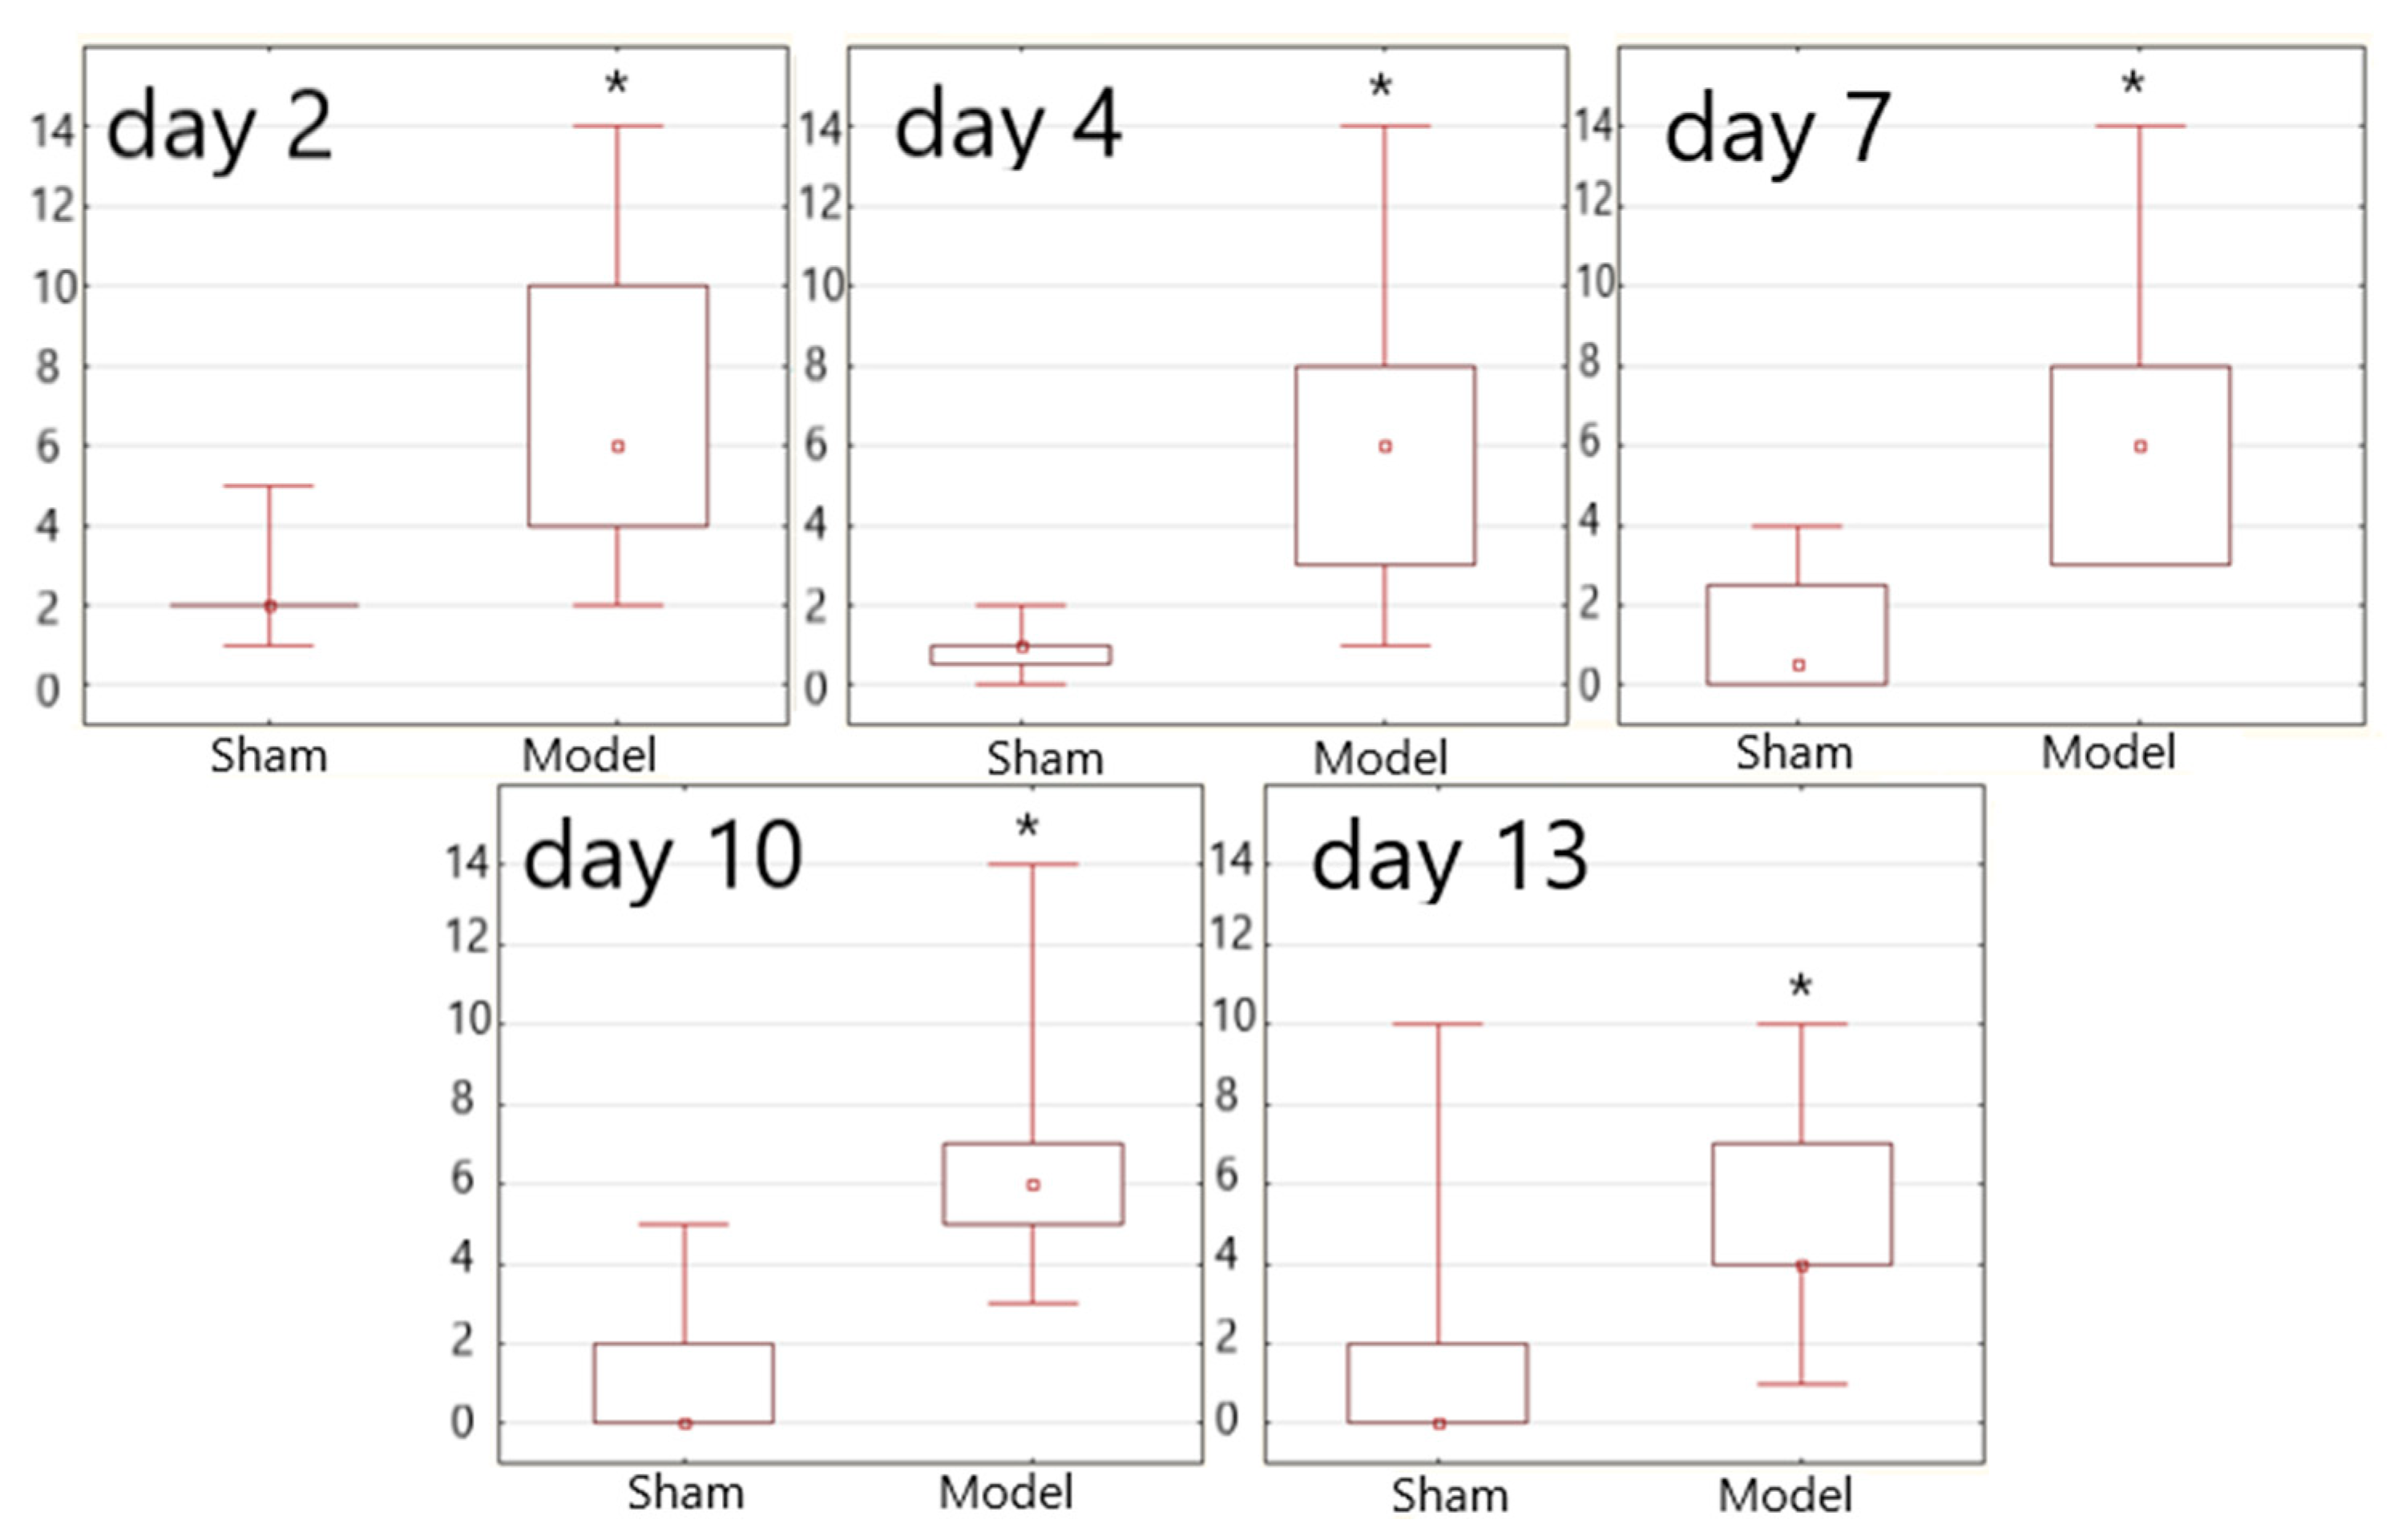
3.3. Neurological Assessment
3.4. Results of the Hematological and Biochemistry Analysis
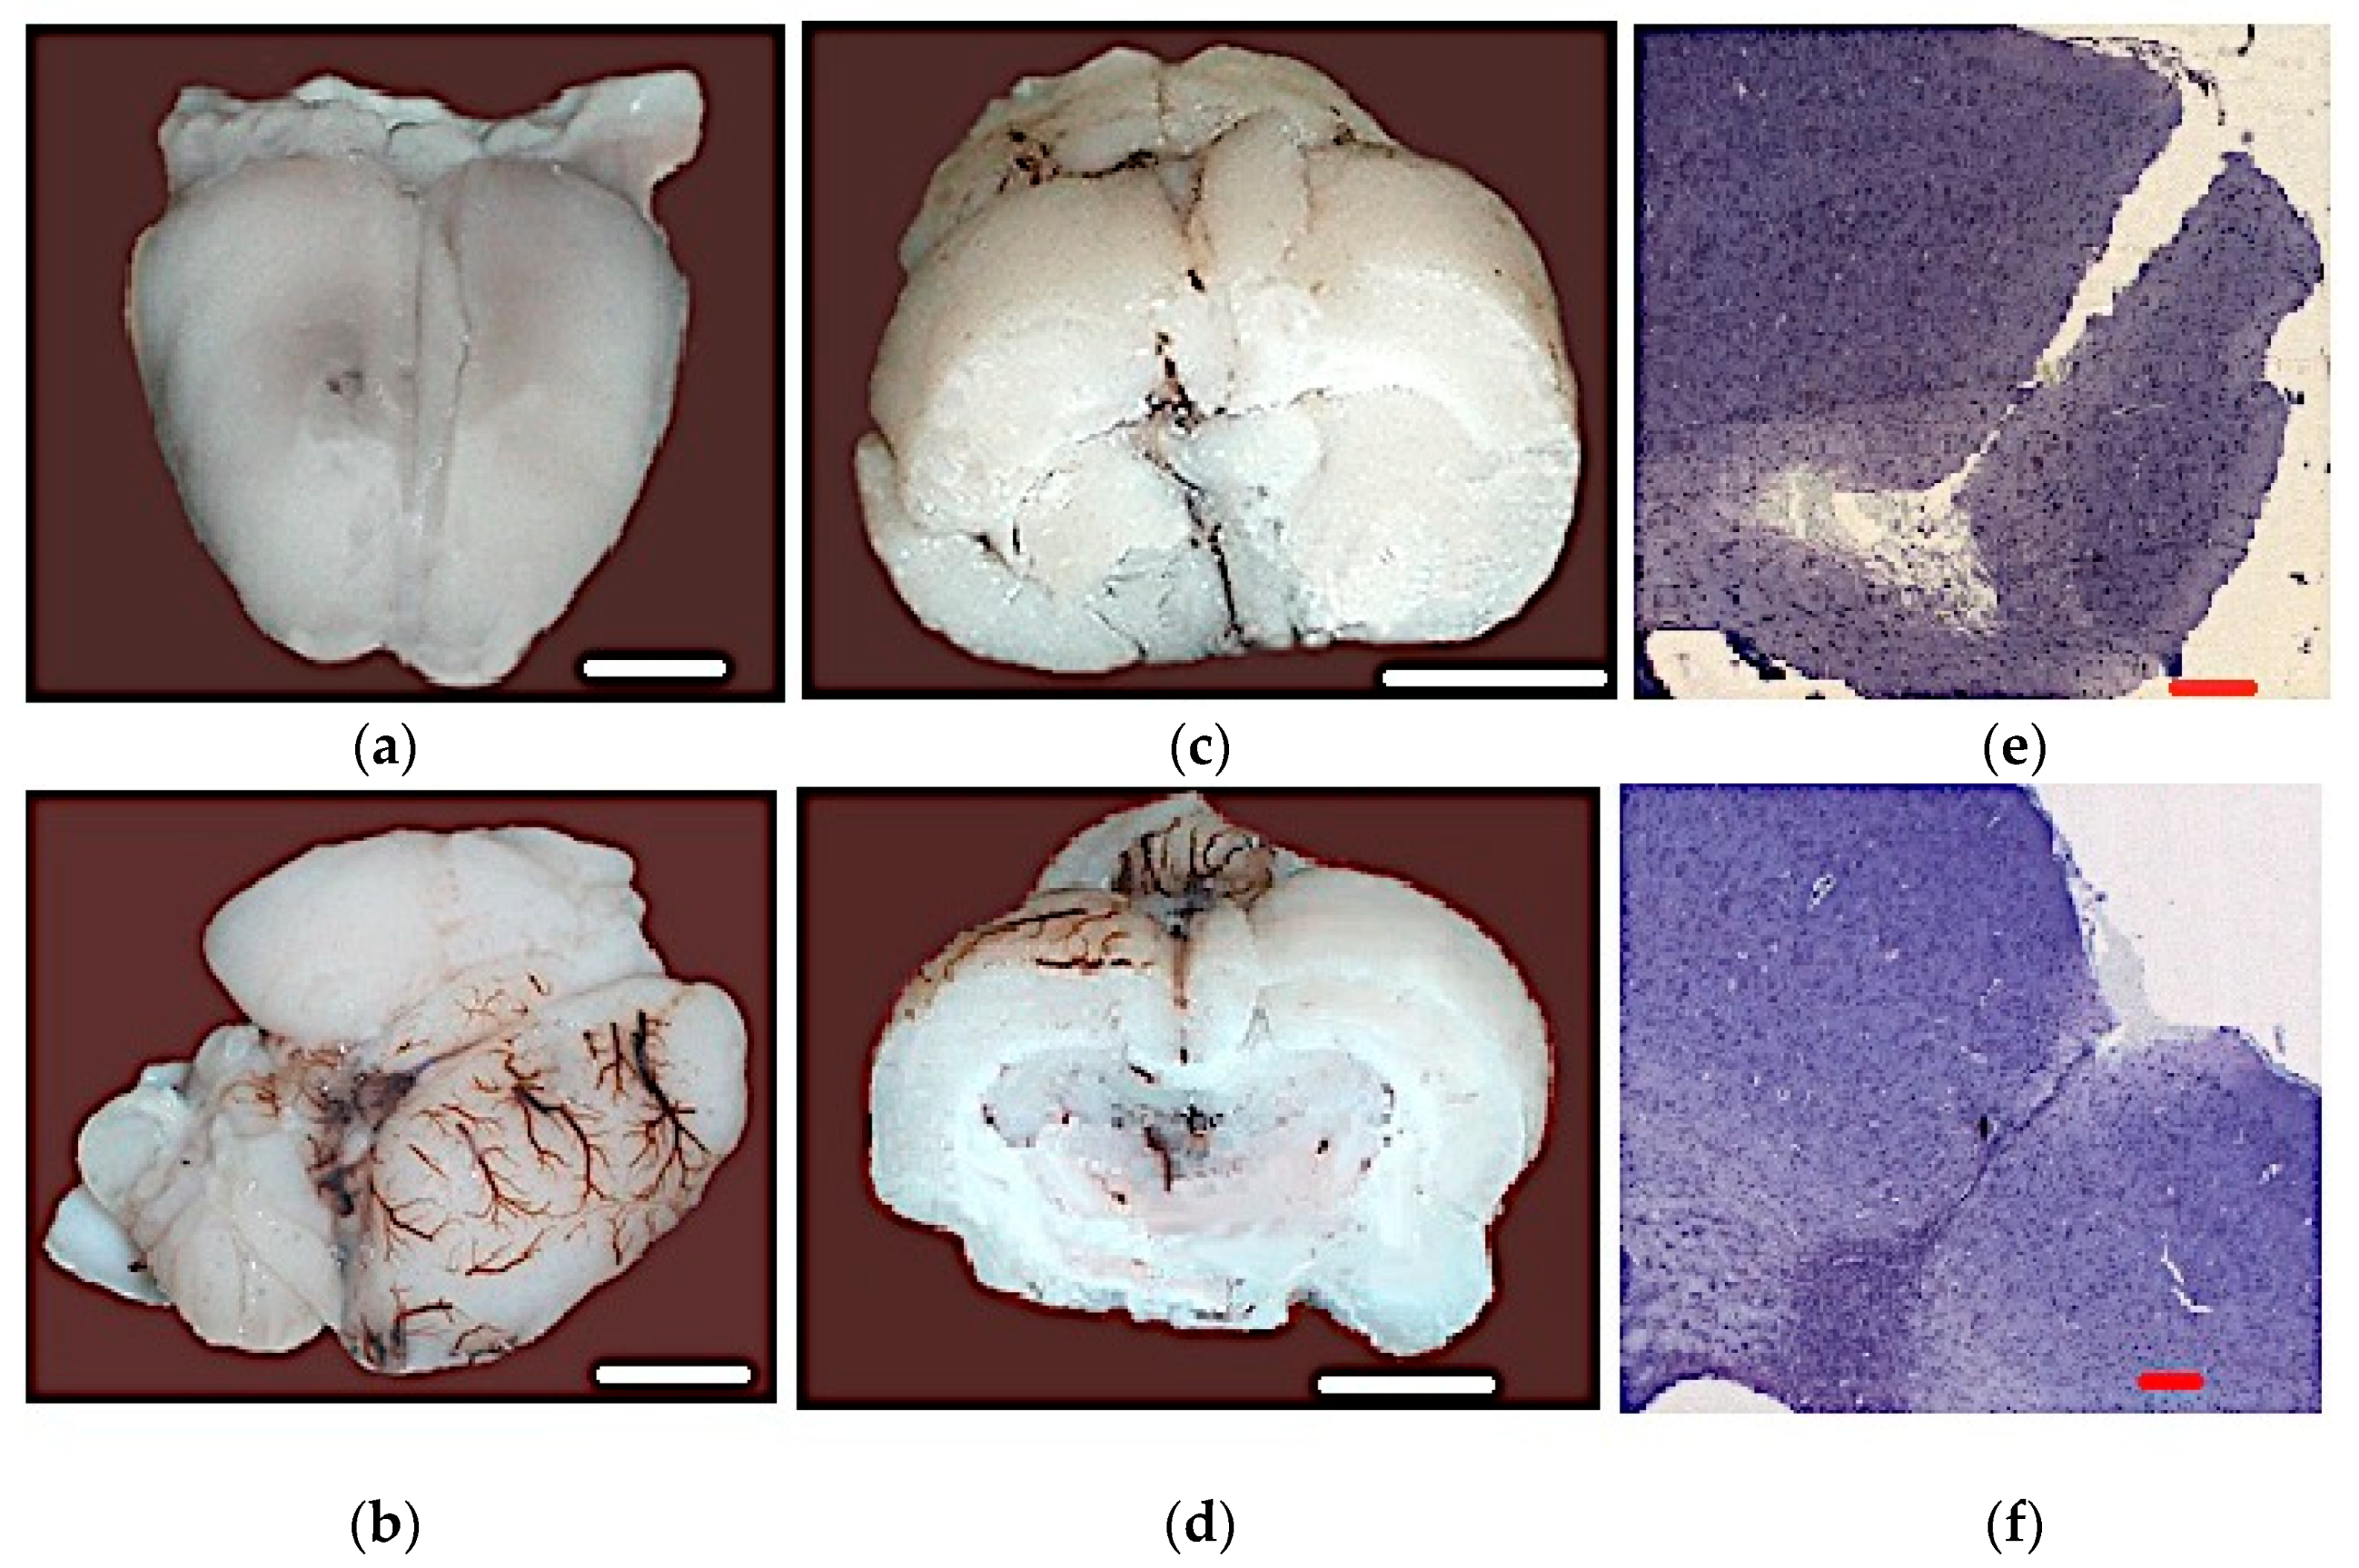
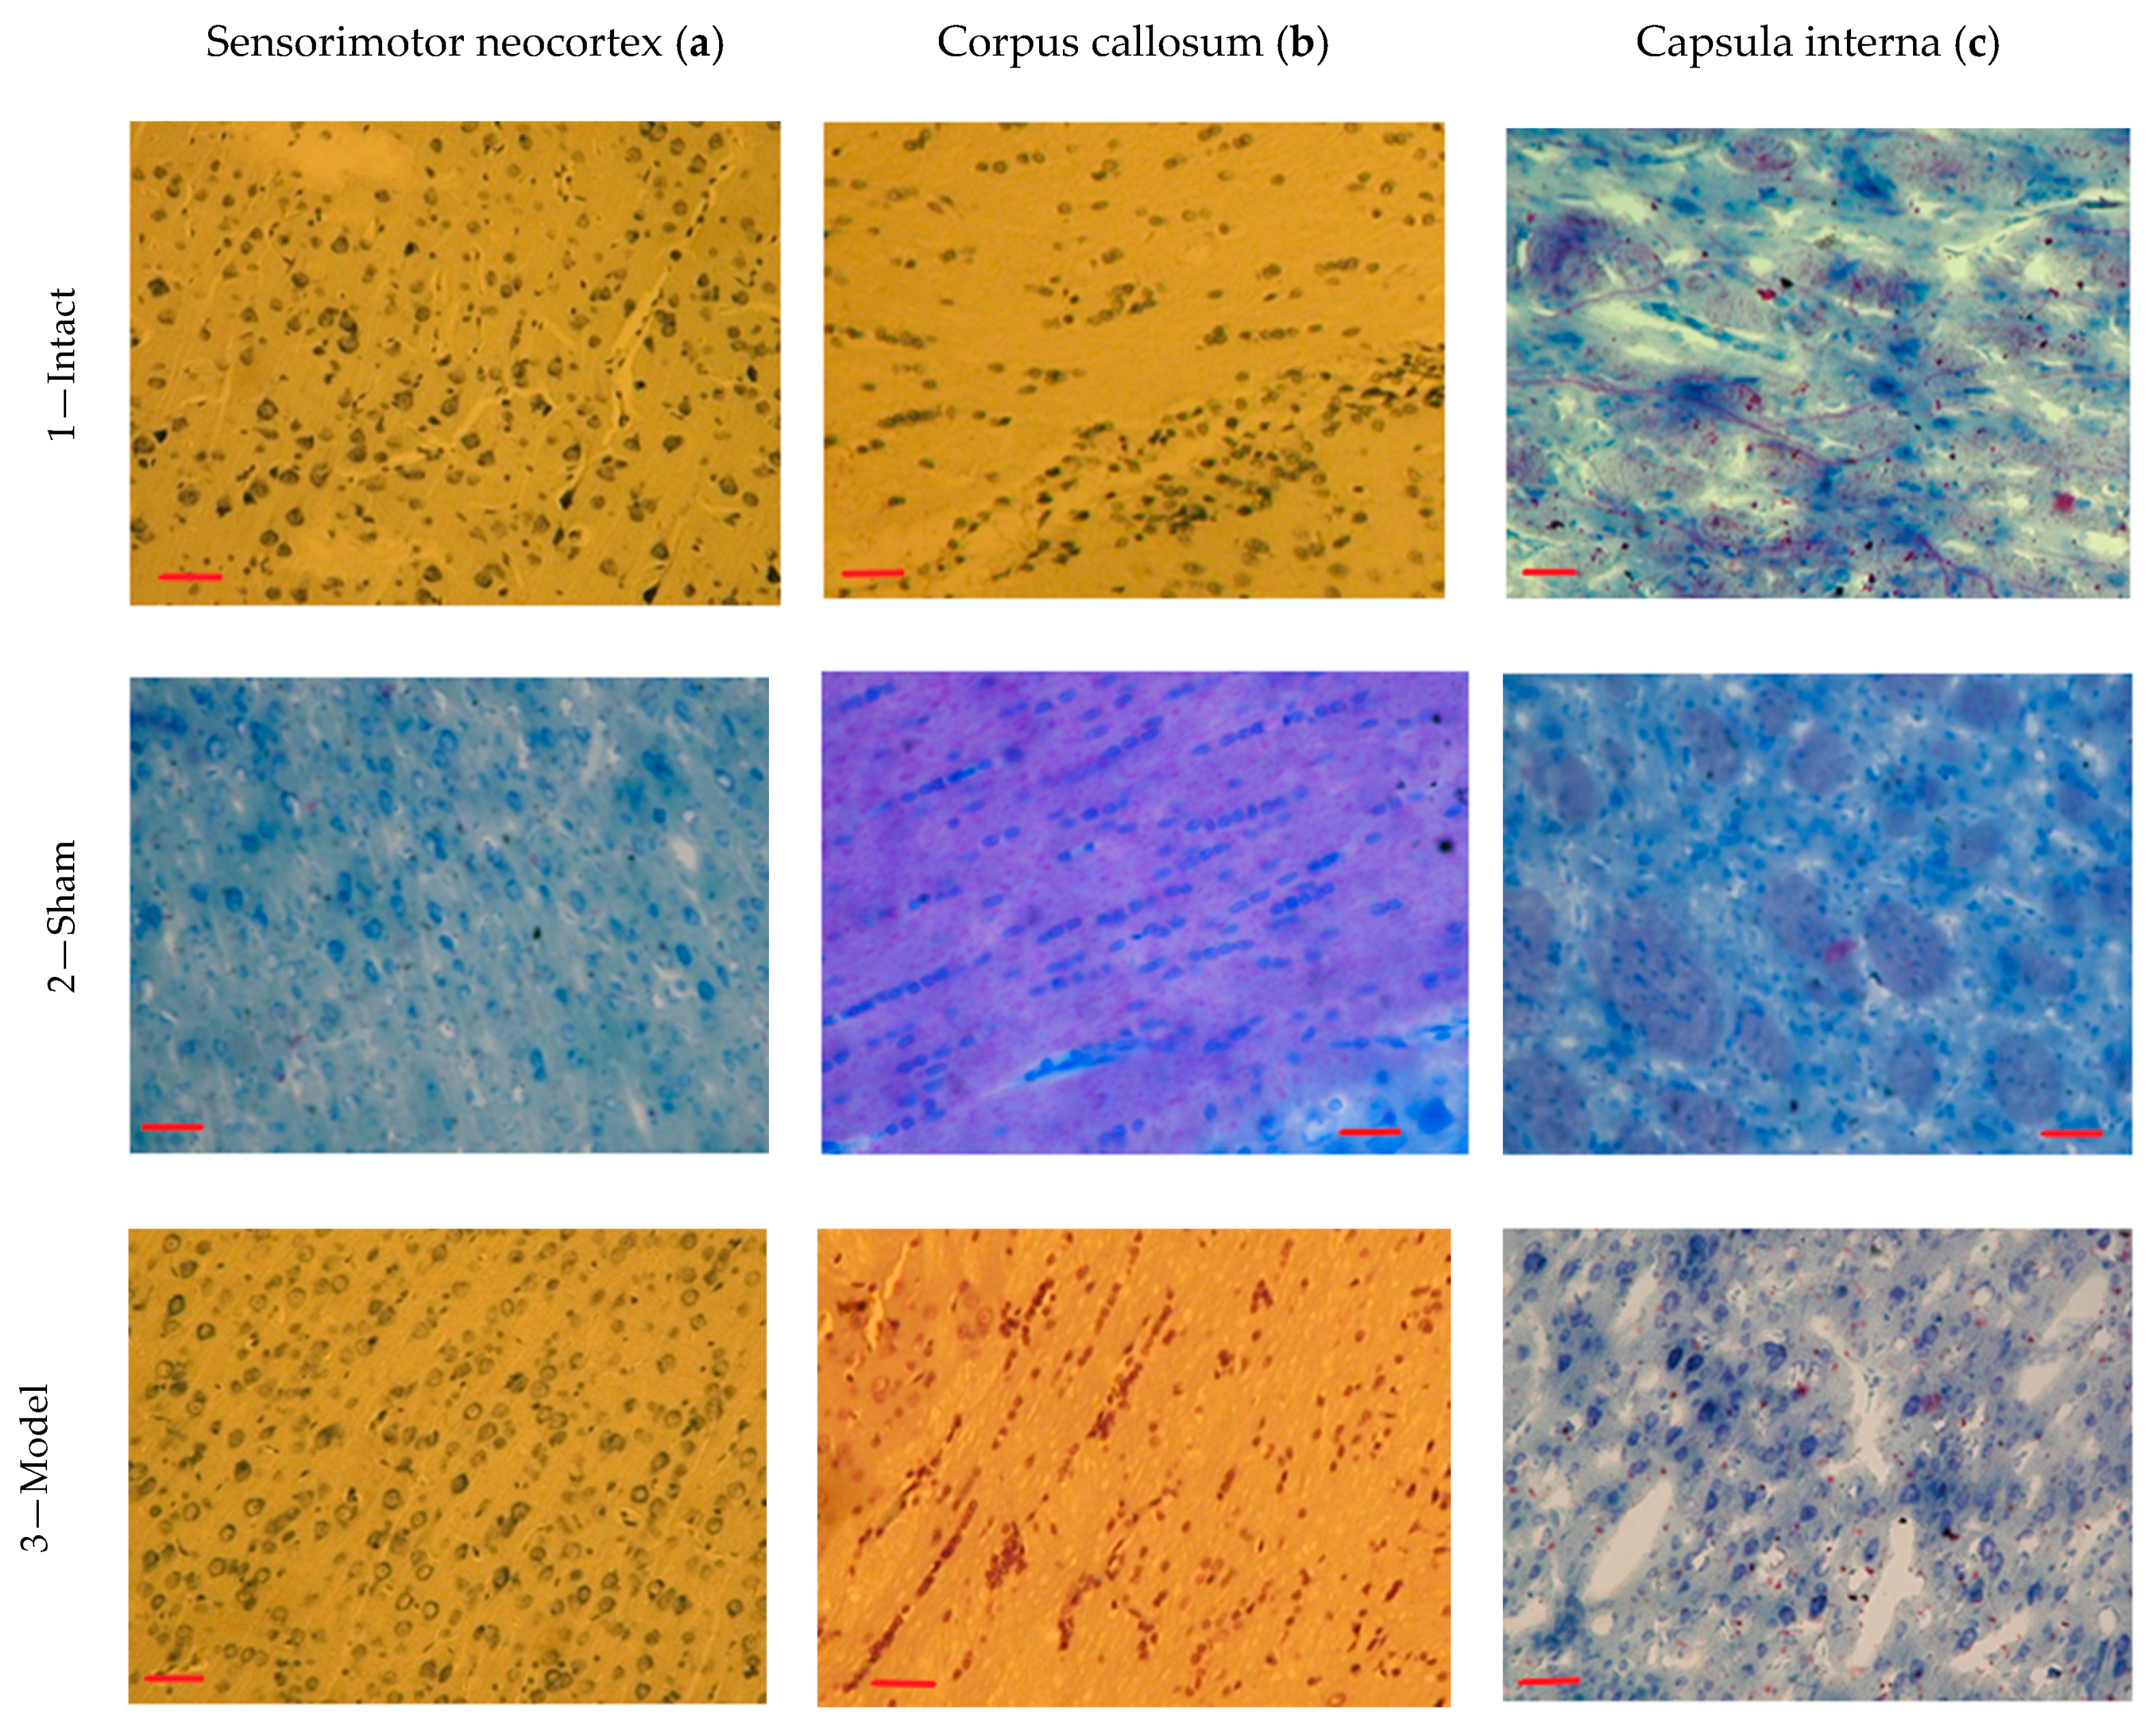
3.5. Results of the Histopathological Analysis
4. Discussion
5. Conclusions
Author Contributions
Funding
Institutional Review Board Statement
Informed Consent Statement
Data Availability Statement
Conflicts of Interest
References
- Imai, T.; Iwata, S.; Miyo, D.; Nakamura, S.; Shimazawa, M.; Hara, H. A novel free radical scavenger, NSP-116, ameliorated the brain injury in both ischemic and hemorrhagic stroke models. J. Pharmacol. Sci. 2019, 141, 119–126. [Google Scholar] [CrossRef] [PubMed]
- Tsymbalyuk, I.; Manuilov, A.; Popov, K.; Basov, A. Metabolic Correction of the Ischemia Reperfusive Injury with Sodium Dichloroacetate in Vascular Isolation of the Liver in Experiment. Novosti Khirurgii 2017, 25, 447–453. [Google Scholar] [CrossRef]
- Liu, H.; Sun, X.; Zou, W.; Leng, M.; Zhang, B.; Kang, X.; He, T.; Wang, H. Scalp acupuncture attenuates neurological deficits in a rat model of hemorrhagic stroke. Complement. Ther. Med. 2017, 32, 85–90. [Google Scholar] [CrossRef]
- Vahidinia, Z.; Tameh, A.A.; Nejati, M.; Beyer, C.; Talaei, S.A.; Moghadam, S.E.; Atlasi, M.A. The protective effect of bone marrow mesenchymal stem cells in a rat model of ischemic stroke via reducing the C-Jun N-terminal kinase expression. Pathol. Res. Pr. 2019, 215, 152519. [Google Scholar] [CrossRef]
- Basov, A.A.; Kozin, S.V.; Bikov, I.M.; Popov, K.A.; Moiseev, A.V.; Elkina, A.A.; Dzhimak, S.S. Changes in Prooxidant-Antioxidant System Indices in the Blood and Brain of Rats with Modelled Acute Hypoxia Which Consumed a Deuterium-Depleted Drinking Diet. Biol. Bull. 2019, 46, 531–535. [Google Scholar] [CrossRef]
- Krafft, P.R.; Bailey, E.L.; Lekic, T.; Rolland, W.B.; Altay, O.; Tang, J.; Wardlaw, J.M.; Zhang, J.H.; Sudlow, C.L.M. Etiology of Stroke and Choice of Models. Int. J. Stroke 2012, 7, 398–406. [Google Scholar] [CrossRef] [PubMed]
- Kjell, J.; Olson, L. Rat models of spinal cord injury: From pathology to potential therapies. Dis. Model. Mech. 2016, 9, 1125–1137. [Google Scholar] [CrossRef]
- Snyder, J.S.; Choe, J.S.; Clifford, M.A.; Jeurling, S.I.; Hurley, P.; Brown, A.; Kamhi, J.F.; Cameron, H.A. Adult-Born Hippocampal Neurons Are More Numerous, Faster Maturing, and More Involved in Behavior in Rats than in Mice. J. Neurosci. 2009, 29, 14484–14495. [Google Scholar] [CrossRef] [PubMed]
- Lazarov, O.; Hollands, C. Hippocampal neurogenesis: Learning to remember. Prog. Neurobiol. 2016, 138–140, 1–18. [Google Scholar] [CrossRef]
- Rubattu, S.; Stanzione, R.; Bianchi, F.; Cotugno, M.; Forte, M.; Della Ragione, F.; Fioriniello, S.; D’Esposito, M.; Marchitti, S.; Madonna, M.; et al. Reduced brain UCP2 expression mediated by microRNA-503 contributes to increased stroke susceptibility in the high-salt fed stroke-prone spontaneously hypertensive rat. Cell Death Dis. 2017, 8, e2891. [Google Scholar] [CrossRef]
- Yao, H.; Nabika, T. Standards and pitfalls of focal ischemia models in spontaneously hypertensive rats: With a systematic review of recent articles. J. Transl. Med. 2012, 10, 139. [Google Scholar] [CrossRef] [PubMed]
- Iida, S.; Baumbach, G.L.; Lavoie, J.L.; Faraci, F.M.; Sigmund, C.D.; Heistad, D.D. Spontaneous Stroke in a Genetic Model of Hypertension in Mice. Stroke 2005, 36, 1253–1258. [Google Scholar] [CrossRef]
- Ren, C.; Sy, C.; Gao, J.; Ding, Y.; Ji, X. Animal Stroke Model: Ischemia–Reperfusion and Intracerebral Hemorrhage. Methods Mol. Biol. 2016, 1462, 373–390. [Google Scholar] [CrossRef]
- James, M.L.; Warner, D.S.; Laskowitz, D.T. Preclinical Models of Intracerebral Hemorrhage: A Translational Perspective. Neurocritical Care 2007, 9, 139–152. [Google Scholar] [CrossRef] [PubMed]
- Durukan, A.; Tatlisumak, T. Rodent Models of Hemorrhagic Stroke. Curr. Pharm. Des. 2008, 14, 352–358. [Google Scholar] [CrossRef]
- MacLellan, C.L.; Silasi, G.; Auriat, A.M.; Colbourne, F. Rodent Models of Intracerebral Hemorrhage. Stroke 2010, 41, S95–S98. [Google Scholar] [CrossRef]
- Sansing, L.H.; Kasner, S.E.; McCullough, L.; Agarwal, P.; Welsh, F.A.; Kariko, K. Autologous Blood Injection to Model Spontaneous Intracerebral Hemorrhage in Mice. J. Vis. Exp. 2011, 54, e2618. [Google Scholar] [CrossRef]
- O’Lynnger, T.; Mao, S.; Hua, Y.; Xi, G. Blood Injection Intracerebral Hemorrhage Rat Model. In Cerebral Ischemic Reperfusion Injuries (CIRI); Springer: Cham, Switzerland, 2019; pp. 257–262. [Google Scholar]
- Marinkovic, I.; Strbian, D.; Mattila, O.; Abo-Ramadan, U.; Tatlisumak, T. A novel combined model of intracerebral and intraventricular hemorrhage using autologous blood-injection in rats. Neuroscience 2014, 272, 286–294. [Google Scholar] [CrossRef]
- Makarenko, A.N.; Kositsyn, N.S.; Pasikova, N.V.; Svinov, M.M. Simulation of local cerebral hemorrhage in different brain structures of experimental animals. Zhurnal Vysshei Nervnoi Deiatelnosti Imeni I P Pavlova 2003, 52, 765–768. [Google Scholar]
- Kaiser, E.E.; Waters, E.S.; Fagan, M.M.; Scheulin, K.M.; Platt, S.R.; Jeon, J.H.; Fang, X.; Kinder, H.A.; Shin, S.K.; Duberstein, K.J.; et al. Characterization of tissue and functional deficits in a clinically translational pig model of acute ischemic stroke. Brain Res. 2020, 1736, 146778. [Google Scholar] [CrossRef]
- Hawkins, P.; Golledge, H.D.R. The 9 to 5 Rodent−Time for Change? Scientific and animal welfare implications of circadian and light effects on laboratory mice and rats. J. Neurosci. Methods 2018, 300, 20–25. [Google Scholar] [CrossRef]
- Fish, R.E.; Brown, M.; Danneman, P.J.; Karas, A.Z. Anesthesia and Analgesia in Laboratory Animals; Academic Press: Cambridge, MA, USA, 2008; p. 672. [Google Scholar]
- Longchamp, A.; Harputlugil, E.; Corpataux, J.-M.; Ozaki, C.K.; Mitchell, J.R. Is Overnight Fasting before Surgery Too Much or Not Enough? How Basic Aging Research Can Guide Preoperative Nutritional Recommendations to Improve Surgical Outcomes: A Mini-Review. Gerontology 2017, 63, 228–237. [Google Scholar] [CrossRef] [PubMed]
- Lester, P.A.; Moore, R.M.; Shuster, K.A.; Myers, D.D. Anesthesia and Analgesia. In The Laboratory Rabbit, Guinea Pig, Hamster, and other Rodents; Academic Press: Cambridge, MA, USA, 2012; Chapter 2; pp. 33–56. [Google Scholar]
- Barth, A.; Guzman, R.; Andres, R.H.; Mordasini, P.; Barth, L.; Widmer, H.R. Experimental intracerebral hematoma in the rat. Restor. Neurol. Neurosci. 2007, 25, 1–7. [Google Scholar] [PubMed]
- Paxinos, G.; Watson, C. The Rat Brain in Stereotaxic Coordinates; Academic Press: Cambridge, MA, USA, 1998; p. 242. [Google Scholar]
- Du Sert, N.P.; Alfieri, A.; Allan, S.M.; Carswell, H.V.; Deuchar, G.A.; Farr, T.D.; Flecknell, P.; Gallagher, L.; Gibson, C.L.; Haley, M.J.; et al. The IMPROVE Guidelines (Ischaemia Models: Procedural Refinements of in vivo Experiments). Br. J. Pharmacol. 2017, 37, 3488–3517. [Google Scholar] [CrossRef]
- Recognition and Alleviation of Distress in Laboratory Animals, Committee on Recognition and Alleviation of Distress in Laboratory Animals, National Research Council. 2008; p. 132. Available online: https://grants.nih.gov/grants/olaw/NAS_distress_report.pdf (accessed on 8 November 2020).
- National Research Council (US) Committee on Pain and Distress in Laboratory Animals. Recognition and Alleviation of Pain and Distress in Laboratory Animals. Recognition and Assessment of Pain, Stress, and Distress; National Academies Press: Washington, DC, USA, 1992; Chapter 4; pp. 32–52.
- Philips, B.H.; Weisshaar, C.L.; Winkelstein, B.A. Use of the Rat Grimace Scale to Evaluate Neuropathic Pain in a Model of Cervical Radiculopathy. Comp. Med. 2017, 67, 34–42. [Google Scholar]
- Greene, S.A. Pros and cons of using α-2 agonists in small animal anesthesia practice. Clin. Tech. Small Anim. Pr. 1999, 14, 10–14. [Google Scholar] [CrossRef]
- Helgers, S.O.A.; Talbot, S.R.; Riedesel, A.-K.; Wassermann, L.; Wu, Z.; Krauss, J.K.; Häger, C.; Bleich, A.; Schwabe, K. Body weight algorithm predicts humane endpoint in an intracranial rat glioma model. Sci. Rep. 2020, 10, 9020. [Google Scholar] [CrossRef]
- Gannushkina, I.V.; Shafranova, V.P.; Ryasina, T.V. Functional Brain Angioarchitectonics; Meditsina: Moscow, Russia, 1977; p. 40. [Google Scholar]
- Leonidov, N.B.; Jakovlev, R.Y.; Rakita, D.R.; Lisichkin, G.V. Agent with Anti-Stroke Action, and Method for Preparing it. Russian Federation Patent RU 2521404 C1, 20 June 2006. Available online: https://patents.s3.yandex.net/RU2521404C1_20140627.pdf (accessed on 8 November 2020).
- Kulchikov, A.E.; Makarenko, A.N.; Novikova, Y.L.; Dobychina, E.E. Method of Neurologic Detection for Small Laboratory Animals Suffering From Cerebral Affections. Russian Federation Patent RU 2327227 C2, 20 June 2008. Available online: https://patents.s3.yandex.net/RU2327227C2_20080620.pdf (accessed on 8 November 2020).
- Zheng, H.; Chen, C.; Zhang, J.; Chunli, C. Mechanism and Therapy of Brain Edema after Intracerebral Hemorrhage. Cerebrovasc. Dis. 2016, 42, 155–169. [Google Scholar] [CrossRef] [PubMed]
- Chernukha, I.M.; Fedulova, L.V.; Kotenkova, E.A.; Takeda, S.; Sakata, R. Hypolipidemic and anti-inflammatory effects of aorta and heart tissues of cattle and pigs in the atherosclerosis rat model. Anim. Sci. J. 2018, 89, 784–793. [Google Scholar] [CrossRef]
- Belenichev, I.F.; Mazur, I.A.; Kolesnik, Y.M.; Abramov, A.V.; Bukhtiyarova, N.V.; Sidorova, I.V. Thiotriazonin influence on histomorphological changes of cortical and hippocampus neurons in the post-stroke period. News Med. Pharm. 2007, 5, 14–25. [Google Scholar]
- González-Pérez, A.; Gaist, D.; Wallander, M.-A.; McFeat, G.; García-Rodríguez, L.A. Mortality after hemorrhagic stroke: Data from general practice (The Health Improvement Network). Neurology 2013, 81, 559–565. [Google Scholar] [CrossRef]
- Altumbabic, M.; Peeling, J.; Del Bigio, M.R. Intracerebral Hemorrhage in the Rat: Effects of Hematoma Aspiration. Stroke 1998, 29, 1917–1923. [Google Scholar] [CrossRef] [PubMed][Green Version]
- Derugin, N.; Wendland, M.; Muramatsu, K.; Roberts, T.P.L.; Gregory, G.; Ferriero, D.M.; Vexler, Z.S. Evolution of Brain Injury After Transient Middle Cerebral Artery Occlusion in Neonatal Rats. Stroke 2000, 31, 1752–1761. [Google Scholar] [CrossRef] [PubMed]
- Di Napoli, M.; Slevin, M.; Popa-Wagner, A.; Singh, P.; Lattanzi, S.; Divani, A.A. Monomeric C-Reactive Protein and Cerebral Hemorrhage: From Bench to Bedside. Front. Immunol. 2018, 9, 1921. [Google Scholar] [CrossRef]
- Lattanzi, S.; Brigo, F.; Trinka, E.; Cagnetti, C.; Di Napoli, M.; Silvestrini, M. Neutrophil-to-Lymphocyte Ratio in Acute Cerebral Hemorrhage: A System Review. Transl. Stroke Res. 2019, 10, 137–145. [Google Scholar] [CrossRef] [PubMed]
- Lattanzi, S.; Di Napoli, M.; Ricci, S.; Divani, A.A. Matrix Metalloproteinases in Acute Intracerebral Hemorrhage. Neurotherapeutics 2020, 17, 484–496. [Google Scholar] [CrossRef] [PubMed]
- Intercollegiate Stroke Working Party. National Clinical Guideline for Stroke, 4th ed.; Royal College of Physicians: London, UK, 2016; Available online: http://citeseerx.ist.psu.edu/viewdoc/download?doi=10.1.1.476.6093&rep=rep1&type=pdf (accessed on 8 November 2020).
- Li, L.; Lou, X.; Zhang, K.; Yu, F.; Zhao, Y.; Jiang, P. Hydrochloride fasudil attenuates brain injury in ICH rats. Transl. Neurosci. 2020, 11, 75–86. [Google Scholar] [CrossRef]
- Nair, R.; Radhakrishnan, K.; Chatterjee, A.; Gorthi, S.P.; Prabhu, V.A. Serum Albumin as a Predictor of Functional Outcomes Following Acute Ischemic Stroke. J. Vasc. Interv. Neurol. 2018, 10, 65–68. [Google Scholar]
- Gao, F.; Chen, C.; Lu, J.; Zheng, J.; Ma, X.-C.; Yuan, X.-Y.; Huo, K.; Han, J.-F. De Ritis ratio (AST/ALT) as an independent predictor of poor outcome in patients with acute ischemic stroke. Neuropsychiatr. Dis. Treat. 2017, 13, 1551–1557. [Google Scholar] [CrossRef]
- Rogers, D.C.; Campbell, C.A.; Stretton, J.L.; Mackay, K.B. Correlation Between Motor Impairment and Infarct Volume After Permanent and Transient Middle Cerebral Artery Occlusion in the Rat. Stroke 1997, 28, 2060–2066. [Google Scholar] [CrossRef]
- Moore, E.; Bellomo, R.; Nichol, A. Biomarkers of acute kidney injury in anesthesia, intensive care and major surgery: From the bench to clinical research to clinical practice. Minerva Anestesiol. 2010, 76, 425–440. [Google Scholar] [PubMed]
- Gage, G.J.; Kipke, D.R.; Shain, W. Whole Animal Perfusion Fixation for Rodents. J. Vis. Exp. 2012, 65, e3564. [Google Scholar] [CrossRef] [PubMed]


| Manipulations | Neurological Status Assessment in Points |
|---|---|
| The animal was brought to the table, the back of the front legs should touch the edge of the table. | Normally, the animal puts both paws on the table, if the animal does not place the paralyzed limb on the table—1 point; does not put both limbs—2 points. |
| The animal was fixed by the tail above the table and gradually lowered so that the vibrissa touched the table. | Normally, the animal tries to grab the edge of the table with its front paws, if there is no reaction, 2 points are assigned. |
| The animal was fixed by the tail above the table and gradually lowered so that the vibrissa did not touch the edge of the table. | Normally, the animal tries to grab onto the edge of the table with its front paws, if there is no reaction, 2 points are assigned. |
| The animal was tested under standard “Open field” conditions. | If the animal makes circular movements in the direction of the paralyzed limb around itself, without going beyond the square—1 point; if circular movements in the direction opposite to the paralyzed limb—2 points |
| If the animal makes a circular motion within the central squares, then it is assigned 2 points. | |
| Examination of the eyeballs. | If, after modeling the pathology, ptosis of one eye occurs—1 point; if ptosis of both eyes—2 points; if exophthalmos develops—2 points. |
| The animal was fixed by the tail and gradually raised. | If the hind legs are crossed—2 points. |
| Holding on a horizontal rod. | Normally, the animal pulls itself up on the crossbar, if the animal does not pull up and falls—2 points. |
| Prick in the paw. | If the animal withdraws its paw with a defensive reaction—0 points; if there is no defensive reaction and there is a withdrawal—1 point; if both reactions are absent—2 points. |
| Animal Group | Day 1 | Day 5 | Day 10 | Day 12 | Day 13 | Day 14 | Total Mortality |
|---|---|---|---|---|---|---|---|
| 1—Intact | 0/6 | 0/6 | 0/6 | 0/6 | 0/6 | 0/6 | 0/6 |
| 2—Sham | 0/8 | 0/8 | 0/8 | 0/8 | 0/8 | 0/8 | 0/8 |
| 3—Model | 2/16 | 1/14 | 1/13 | 1/12 | 1/11 | 1/10 | 7/16 |
| Symptoms | Points | Day 2 | Day 4 | Day 7 | Day 10 | Day 13 | |||||
|---|---|---|---|---|---|---|---|---|---|---|---|
| Sham | Model | Sham | Model | Sham | Model | Sham | Model | Sham | Model | ||
| Lethargy, slowness of movement | 0.5 | 62 | 71 | 50 | 64 | 37 | 31 | 25 | 33 | 12 | 40 |
| Tremor | 1.0 | 12 | 28 | 12 | 14 | 12 | 15 | 12 | 17 | 12 | 10 |
| Unilateral partial ptosis | 1.0 | 0 | 50 | 0 | 50 | 0 | 38 | 0 | 33 | 0 | 20 |
| Bilateral partial ptosis | 1.5 | 12 | 0 | 12 | 0 | 12 | 8 | 12 | 8 | 12 | 0 |
| Inability to pull back a limb while holding it | 1.5 | 0 | 71 | 0 | 71 | 0 | 69 | 0 | 33 | 0 | 20 |
| Unilateral ptosis | 1.5 | 0 | 21 | 0 | 36 | 0 | 23 | 0 | 17 | 0 | 10 |
| Bilateral ptosis | 1.5 | 0 | 28 | 0 | 14 | 0 | 15 | 0 | 8 | 0 | 10 |
| Manage movements | 2.0 | 0 | 57 | 0 | 50 | 0 | 38 | 0 | 17 | 0 | 10 |
| 1 limb paresis | 2.0 | 0 | 0 | 0 | 0 | 0 | 0 | 0 | 0 | 0 | 0 |
| 2 limb paresis | 3.0 | 0 | 43 | 0 | 57 | 0 | 46 | 0 | 17 | 0 | 10 |
| 1 limb paralysis | 3.0 | 0 | 28 | 0 | 14 | 0 | 15 | 0 | 8 | 0 | 10 |
| 2 limb paralysis | 4.0 | 0 | 0 | 0 | 0 | 0 | 0 | 0 | 0 | 0 | 0 |
| Coma | 7.0 | 0 | 28 | 0 | 14 | 0 | 15 | 0 | 17 | 0 | 10 |
| Fatal outcome | 10.0 | 0 | 12 | 0 | 0 | 0 | 7 | 0 | 8 | 0 | 17 |
| Group average score | Me | 0.5 | 8.5 | 0.2 | 6.0 | 0.0 | 5.0 | 0.0 | 1.0 | 0.0 | 0.7 |
| P25 | 0.0 | 4.7 | 0.0 | 1.0 | 0.0 | 1.0 | 0.0 | 0.0 | 0.0 | 0.0 | |
| P75 | 0.5 | 11.6 | 0.5 | 8.5 | 0.1 | 8.7 | 0.0 | 9.5 | 0.0 | 7.7 | |
| Groups | Day 0 | Day 2 | Day 3 | Day 6 | Day 7 | Day 10 | Day 11 | Day 13 |
|---|---|---|---|---|---|---|---|---|
| Horizontal Activity, Number of Crossed Squares | ||||||||
| 1—Intact | 45.5 (32.8–55.3) | 35.0 (19.3–54.5) | 44.0 (32.8–54.5) | 20.5 (9.8–50.8) | 24.0 (16.8–32.0) | 19.0 (8.5–36.3) | 12.5 (5.8–17.8) | 15.5 (12.8–19.8) |
| 2—Sham | 36.0 (31.3–39.5) | 4.0 (2.0–9.3) | 5.0 * (2.8–7.0) | 9.5 (4.8–23.5) | 15.0 (10.3–29.5) | 16.5 (12.0–19.5) | 16.5 (9.3–26.5) | 37.0 (11.3–43.3) |
| 3—Model | 50.5 (32.3–53.5) | 0.5 * (0.0–4.0) | 5.5 * (0.0–23.0) | 17.0 (6.3 –40.8) | 17.0 (6.0–33.0) | 24.0 (12.0–54.0) | 40.0 * (26.0–43.0) | 22.0 (10.3–45.3) |
| Vertical Activity, Number of Racks. | ||||||||
| 1—Intact | 11.0 (5.8–12.5) | 12.0 (7.0–17.0) | 15.0 (10.8–17.8) | 12.5 (6.0–21.3) | 12.0 (8.3–13.5) | 7.5 (5.3–11.3) | 6.5 (4.5–7.0) | 5.0 (2.5–6.8) |
| 2—Sham | 5.0 (2.8–9.3) | 1.0 (0.8–1.0) | 1.0 * (0.8–1.3) | 2.5 (1.0–7.0) | 2.5 * (1.8–4.0) | 3.0 (1.5–6.0) | 3.0 (1.0–4.3) | 1.0 (0.0–3.3) |
| 3—Model | 12.5 (6.3–16.5) | 0.0 * (0.0–0.0) | 1.0 * (0.0–1.0) | 4.0 (1.0–6.0) | 4.0 * (1.0–7.0) | 3.0 (1.0–10.0) | 5.0 (3.0–11.0) | 3.5 (0.8–6.5) |
| Mink Reflex, Number of Examined Minks | ||||||||
| 1—Intact | 11.0 (8.8–12.5) | 13.5 (12.3–17.0) | 14.5 (13.3–15.8) | 7.0 (5.0–12.8) | 11.0 (6.8–14.5) | 6.5 (4.0–11.3) | 5.0 (4.3–5.0) | 4.0 (1.8–5.5) |
| 2—Sham | 9.5 (7.5–11.3) | 3.5 (1.0–5.5) | 1.5 * (1.0–2.3) | 3.0 (1.8–6.0) | 2.5 (1.0–6.8) | 3.0 (0.8–4.3) | 2.5 (0.0–4.3) | 4.5 (0.8–9.0) |
| 3—Model | 10.0 (8.5–18.0) | 0.0 * (0.0–2.0) | 0.0 * (0.0–2.0) | 4.0 (1.3–6.8) | 3.0 * (1.0–7.0) | 4.0 (1.0–7.0) | 3.0 (1.0–6.0) | 3.0 (0.8–6.0) |
| Grooming, Number of Acts | ||||||||
| 1—Intact | 5.0 (3.3–6.0) | 11.0 (6.5–12.5) | 6.5 (6.0–7.0) | 5.0 (2.5–6.8) | 6.0 (5.3–6.8) | 6.5 (4.5–7.8) | 3.5 (3.0–4.0) | 3.0 (3.0–3.8) |
| 2—Sham | 4.0 (3.0–5.0) | 0.0 * (0.0–1.0) | 0.5 * (0.0–1.0) | 4.0 (2.8–4.3) | 4.0 (3.0–4.3) | 3.5 (1.8–5.5) | 3.5 (1.8–5.3) | 2.0 (0.0–4.0) |
| 3—Model | 4.0 (2.0–4.8) | 0.5 * (0.0–4.8) | 1.0 * (0.0–4.0) | 4.0 (0.0 –5.8) | 4.0 (2.0–5.0) | 1.0 (0.0–8.0) | 1.0 (1.0–9.0) | 3.0 (0.8–4.3) |
| Parameters | Group of Animals | ||
|---|---|---|---|
| 1—Intact | 2—Sham | 3—Model | |
| LEU, 109/L | 7.45 (6.16–9.70) | 6.04 (5.22–7.50) | 7.90 (5.72–8.25) |
| LYM, 109/L | 7.00 (5.54–8.22) | 5.01 (4.47–6.03) | 6.02 (5.22–6.44) |
| Relative LYM, % | 91.25 (87.95–92.85) | 84.10 (77.95–87.78) | 78.80 (74.40–86.35) |
| MID, 109/L | 0.09 (0.08–0.13) | 0.04 (0.03–0.05) | 0.17 # (0.15–0.31) |
| Relative MID, % | 1.60 (0.90–2.00) | 0.60 (0.60–0.70) | 2.25 # (1.93–3.98) |
| GRAN, 109/L | 0.57 (0.33–1.03) | 0.95 (0.76–1.17) | 1.19 (0.56–1.86) |
| Relative GRAN, % | 6.55 (5.55–10.55) | 15.30 (10.30–21.90) | 17.00 (8.53–23.83) |
| RBC, 1012/L | 7.69 (7.65–8.17) | 7.82 (7.67–8.00) | 7.43 (7.25–8.00) |
| HGB, g/L | 130.50 (125.50–136.50) | 129.50 (127.25–144.25) | 131.00 (127.25–137.75) |
| HCT, % | 39.79 (38.16–41.15) | 39.16 (38.11–39.61) | 39.08 (38.32–39.95) |
| MCV, mkm3 | 50.00 (49.00–51.00) | 49.00 (48.75–50.25) | 52.00 # (51.00–52.00) |
| PLT, 109/L | 733.50 (709.00–809.50) | 751.50 (660.75–826.00) | 759.00 (719.00–829.25) |
| PCT, % | 0.51 (0.47–0.56) | 0.48 (0.43–0.54) | 0.50 (0.48–0.55) |
| Parameters | Group of Animals | ||
|---|---|---|---|
| 1—Intact | 2—Sham | 3—Model | |
| Total protein, g/L | 65.30 (64.65–66.90) | 63.15 (62.20–65.25) | 68.10 (66.30–68.75) |
| Albumin, g/L | 45.20 (43.70–45.60) | 43.25 (42.38–43.95) | 41.60 * (41.40–41.85) |
| Glucose, mmol/L | 10.80 (9.10–13.58) | 16.55 * (16.00–17.60) | 17.97 # (14.05–19.3) |
| Bilirubin indirect, μmol/L | 3.20 (2.90–3.40) | 3.28 (3.15–4.25) | 3.50 (3.10–3.80) |
| Bilirubin direct, μmol/L | 1.80 (1.65–1.90) | 1.75 (1.68–1.95) | 1.90 (1.85–2.15) |
| Creatinine, μmol/L | 54.50 (51.75–56.50) | 42.38 * (42.00–47.33) | 46.00 (44.75–48.25) |
| Urea, mmol/L | 6.15 (5.62–6.57) | 6.60 (5.53–7.56) | 6.07 (5.91–6.64) |
| AST, E/L | 132.65 (130.17–133.97) | 128.34 (117.39–149.97) | 136.20 (115.24–143.12) |
| ALT, E/L | 31.00 (26.50–34.00) | 31.50 (28.00–33.18) | 17.30 *, # (16.00–25.00) |
| ALP, E/L | 175.50 (158.40–199.50) | 146.05 (131.05–173.55) | 166.90 (154.85–177.40) |
| GGT, E/L | 2.65 (2.52–2.84) | 2.03 (1.87–2.26) | 2.43 (2.23–2.70) |
| LDH, E/L | 404.56 (383.39–461.42) | 521.34 (456.84–624.32) | 556.00 (328.13–595.01) |
| Cholesterol, mmol/L | 1.57 (1.47–1.67) | 1.79 (1.71–1.92) | 1.85 * (1.70–2.21) |
| Triglycerides, mmol/L | 1.20 (0.85–1.55) | 1.25 (1.08–1.41) | 1.40 (1.34–1.55) |
| Parameters | Group of Animals | |||||
|---|---|---|---|---|---|---|
| 1—Intact | 2—Sham | 3—Model | ||||
| Ipsi | Contr | Ipsi | Contr | |||
| Area of the pyramidal neurons, μm | Mean | 347.39 | 351.54 | 337.45 | 447.46 * | 388.85 |
| SEM | 6.94 | 5.52 | 5.21 | 11.45 | 9.72 | |
| Area of the nuclei, μm | Mean | 159.13 | 139.37 | 121.53 | 237.49 * | 171.95 |
| SEM | 2.65 | 2.11 | 3.41 | 5.50 | 3.59 | |
| Neuroglial index | Mean | 0.82 | 0.85 | 0.83 | 0.92 | 0.96 |
| SEM | 0.05 | 0.02 | 0.02 | 0.01 | 0.02 | |
Publisher’s Note: MDPI stays neutral with regard to jurisdictional claims in published maps and institutional affiliations. |
© 2021 by the authors. Licensee MDPI, Basel, Switzerland. This article is an open access article distributed under the terms and conditions of the Creative Commons Attribution (CC BY) license (https://creativecommons.org/licenses/by/4.0/).
Share and Cite
Vasilevskaya, E.; Makarenko, A.; Tolmacheva, G.; Chernukha, I.; Kibitkina, A.; Fedulova, L. Local Experimental Intracerebral Hemorrhage in Rats. Biomedicines 2021, 9, 585. https://doi.org/10.3390/biomedicines9060585
Vasilevskaya E, Makarenko A, Tolmacheva G, Chernukha I, Kibitkina A, Fedulova L. Local Experimental Intracerebral Hemorrhage in Rats. Biomedicines. 2021; 9(6):585. https://doi.org/10.3390/biomedicines9060585
Chicago/Turabian StyleVasilevskaya, Ekaterina, Aleksandr Makarenko, Galina Tolmacheva, Irina Chernukha, Anastasiya Kibitkina, and Liliya Fedulova. 2021. "Local Experimental Intracerebral Hemorrhage in Rats" Biomedicines 9, no. 6: 585. https://doi.org/10.3390/biomedicines9060585
APA StyleVasilevskaya, E., Makarenko, A., Tolmacheva, G., Chernukha, I., Kibitkina, A., & Fedulova, L. (2021). Local Experimental Intracerebral Hemorrhage in Rats. Biomedicines, 9(6), 585. https://doi.org/10.3390/biomedicines9060585