
Predict Score: A New Biological and Clinical Tool to Help Predict Risk of Intensive Care Transfer for COVID-19 Patients

 ,
,  and
and 
Abstract
1. Introduction
2. Materials and Methods
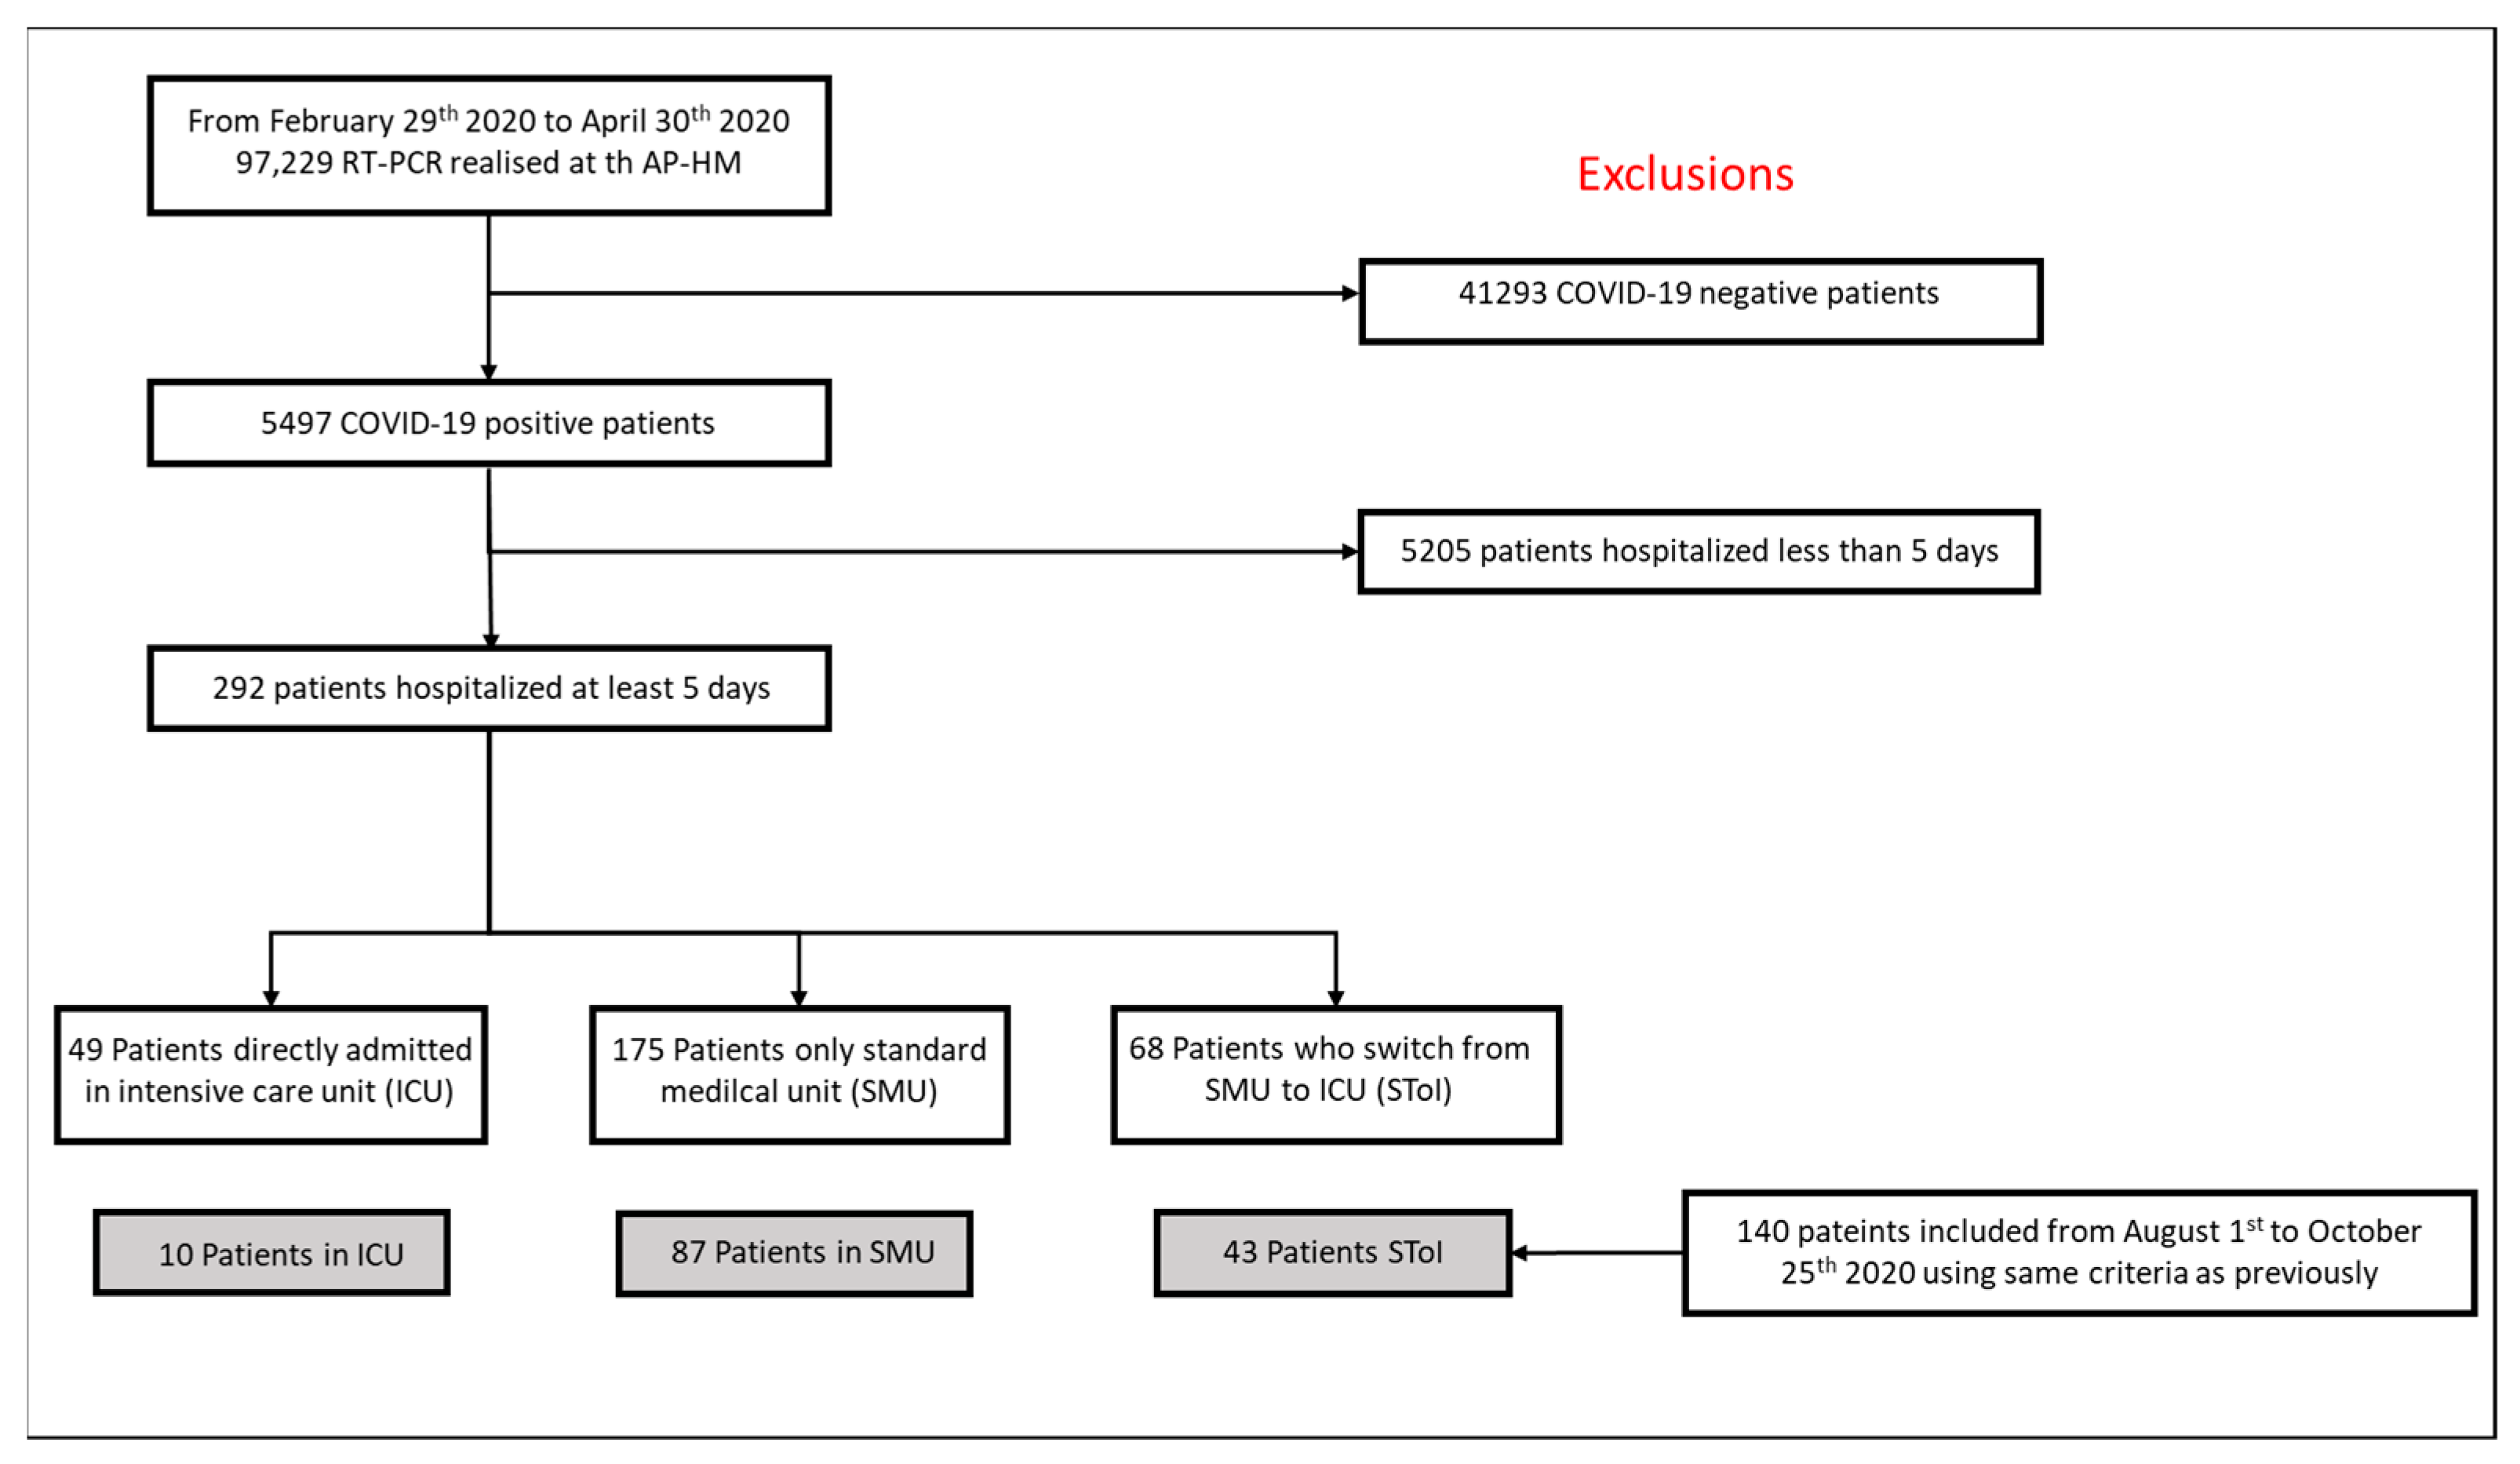
2.1. Study Design and Patient Selection
- Patients admitted to the Standard Medical Unit were included in the SMU group;
- Patients admitted directly into the Intensive Care Unit directly were included in the ICU group;
- Patients that initially were admitted to the Standard Medical Unit for at least 24 h, but subsequently needed to be transferred to the Intensive Care Unit were included in a third group, named Standard to Intensive Care (STol) group.
2.2. Exclusion Criteria
2.3. Clinical, Imaging and Laboratory Data Collection
2.4. Laboratory Findings
2.5. Definitions
2.6. Statistical Analysis
3. Results
3.1. Patient Characteristics
3.2. Patient Vital Signs
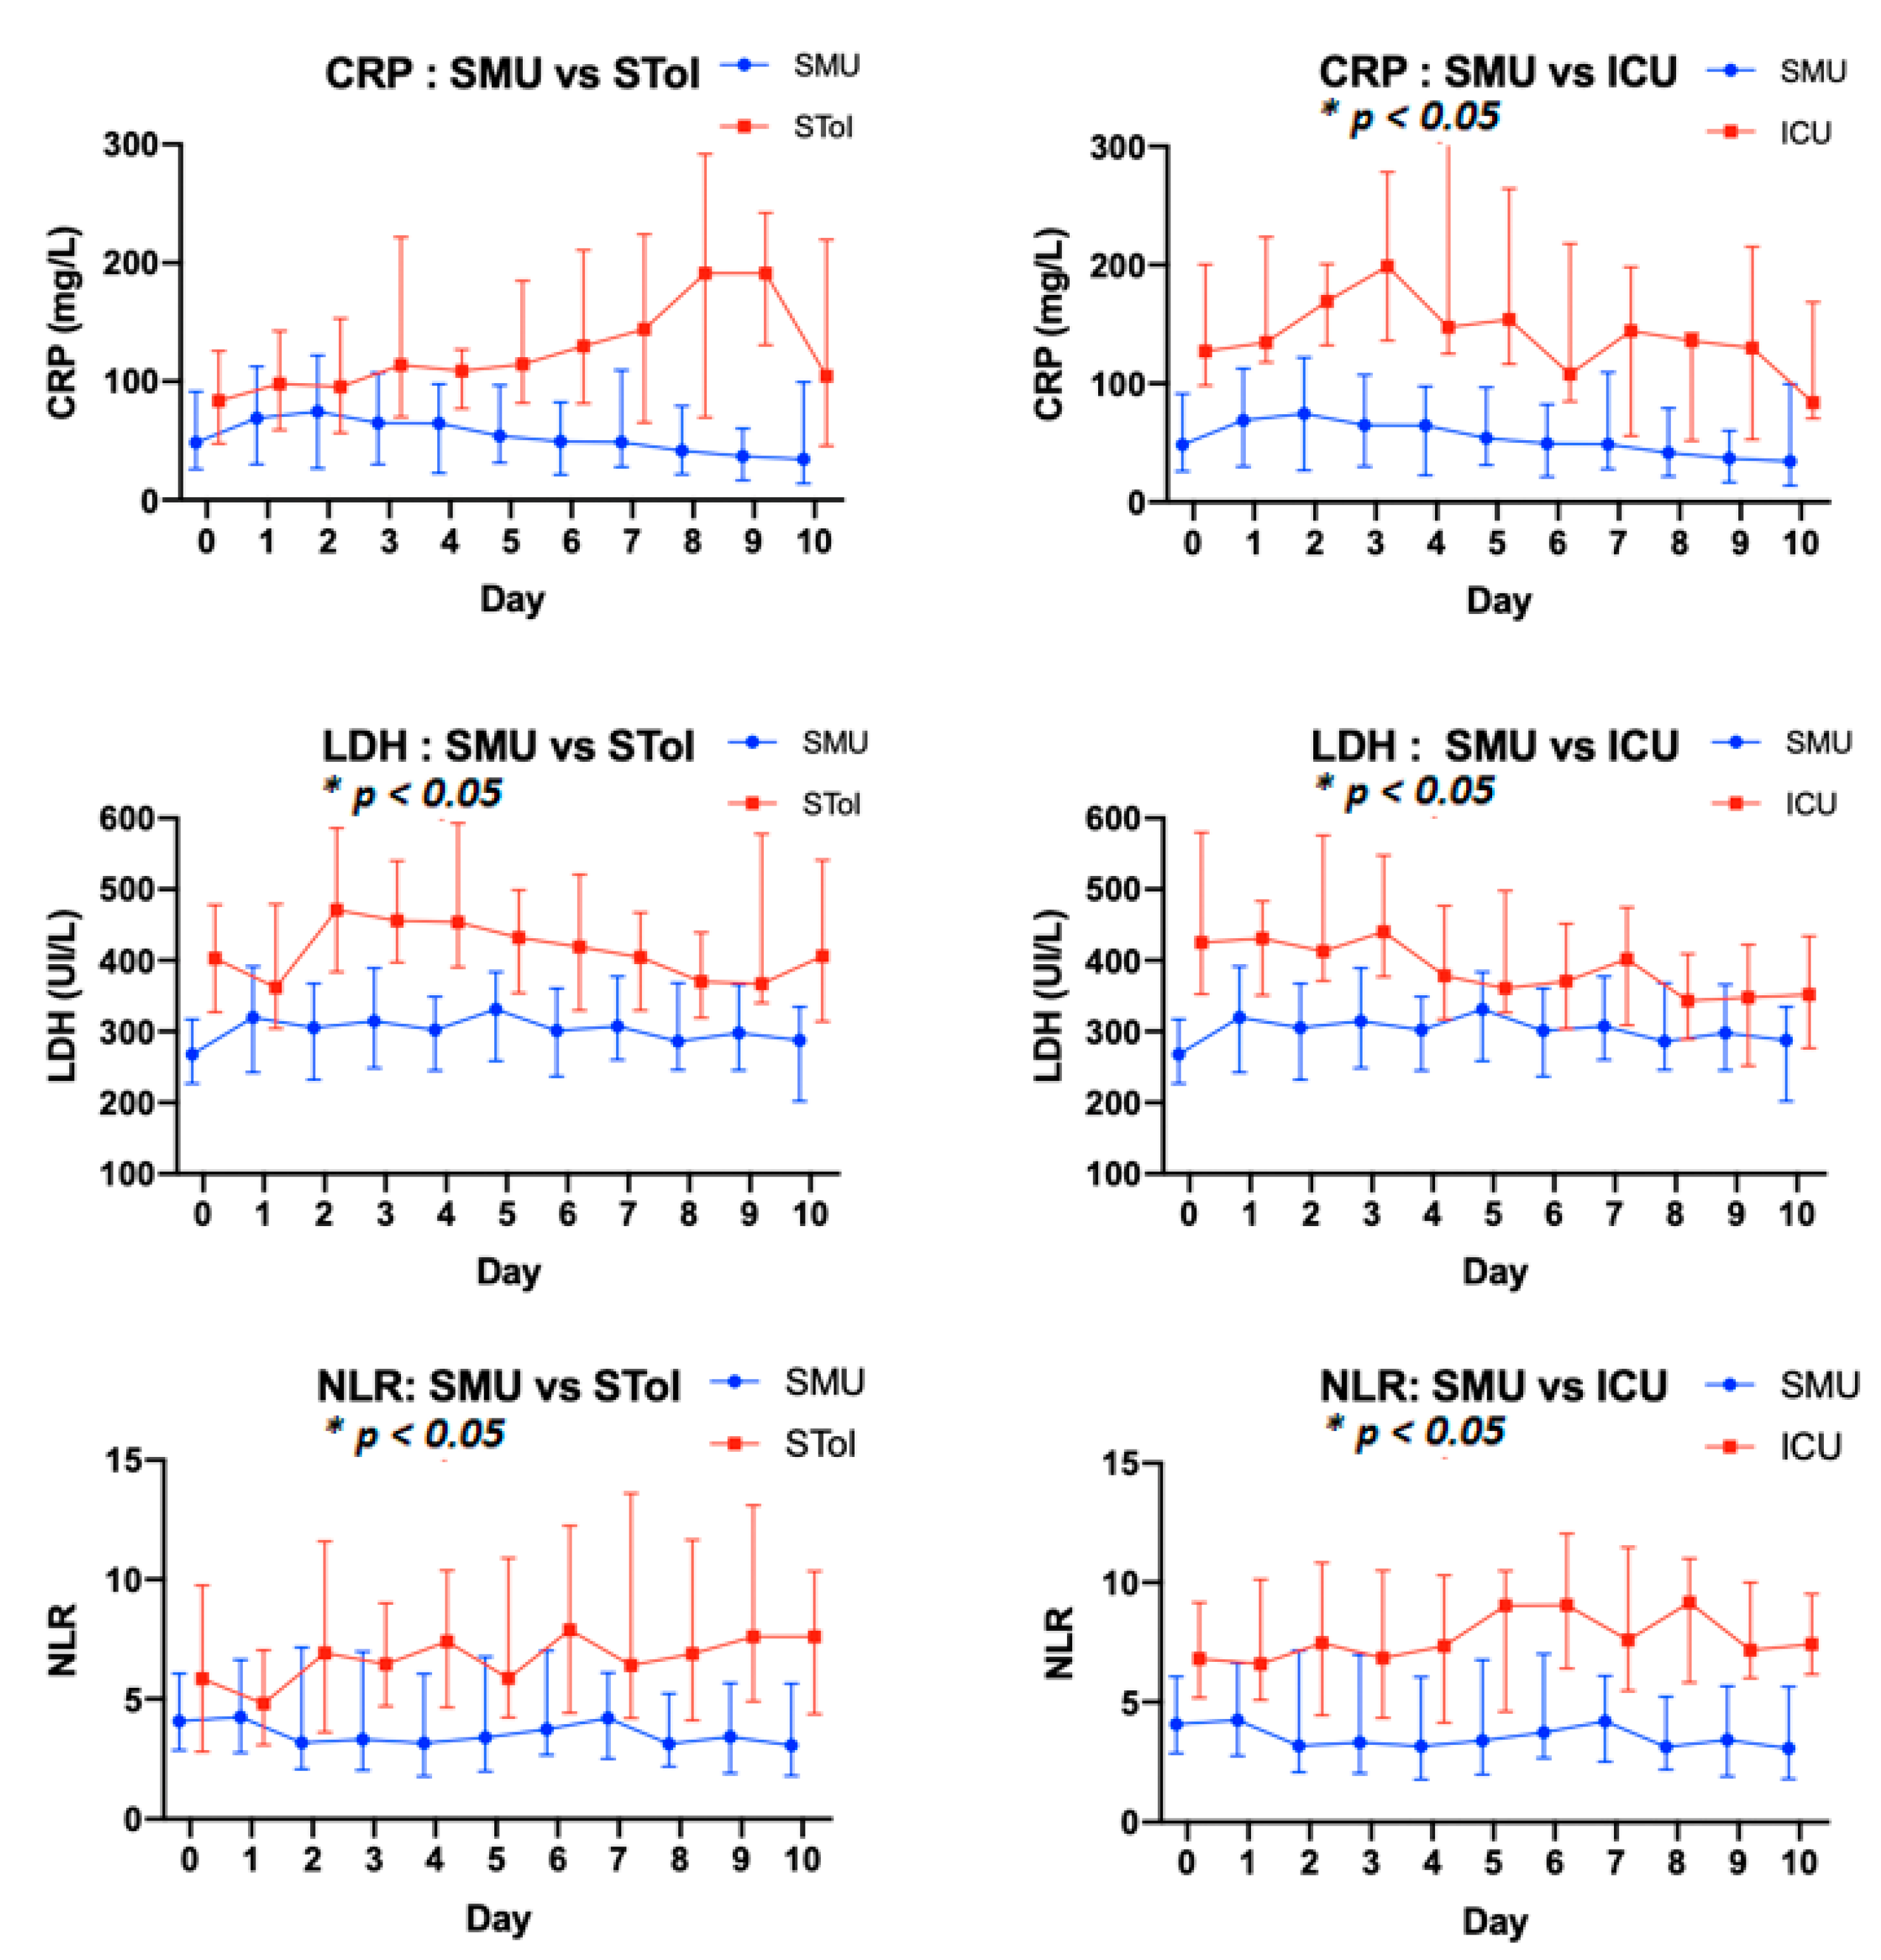
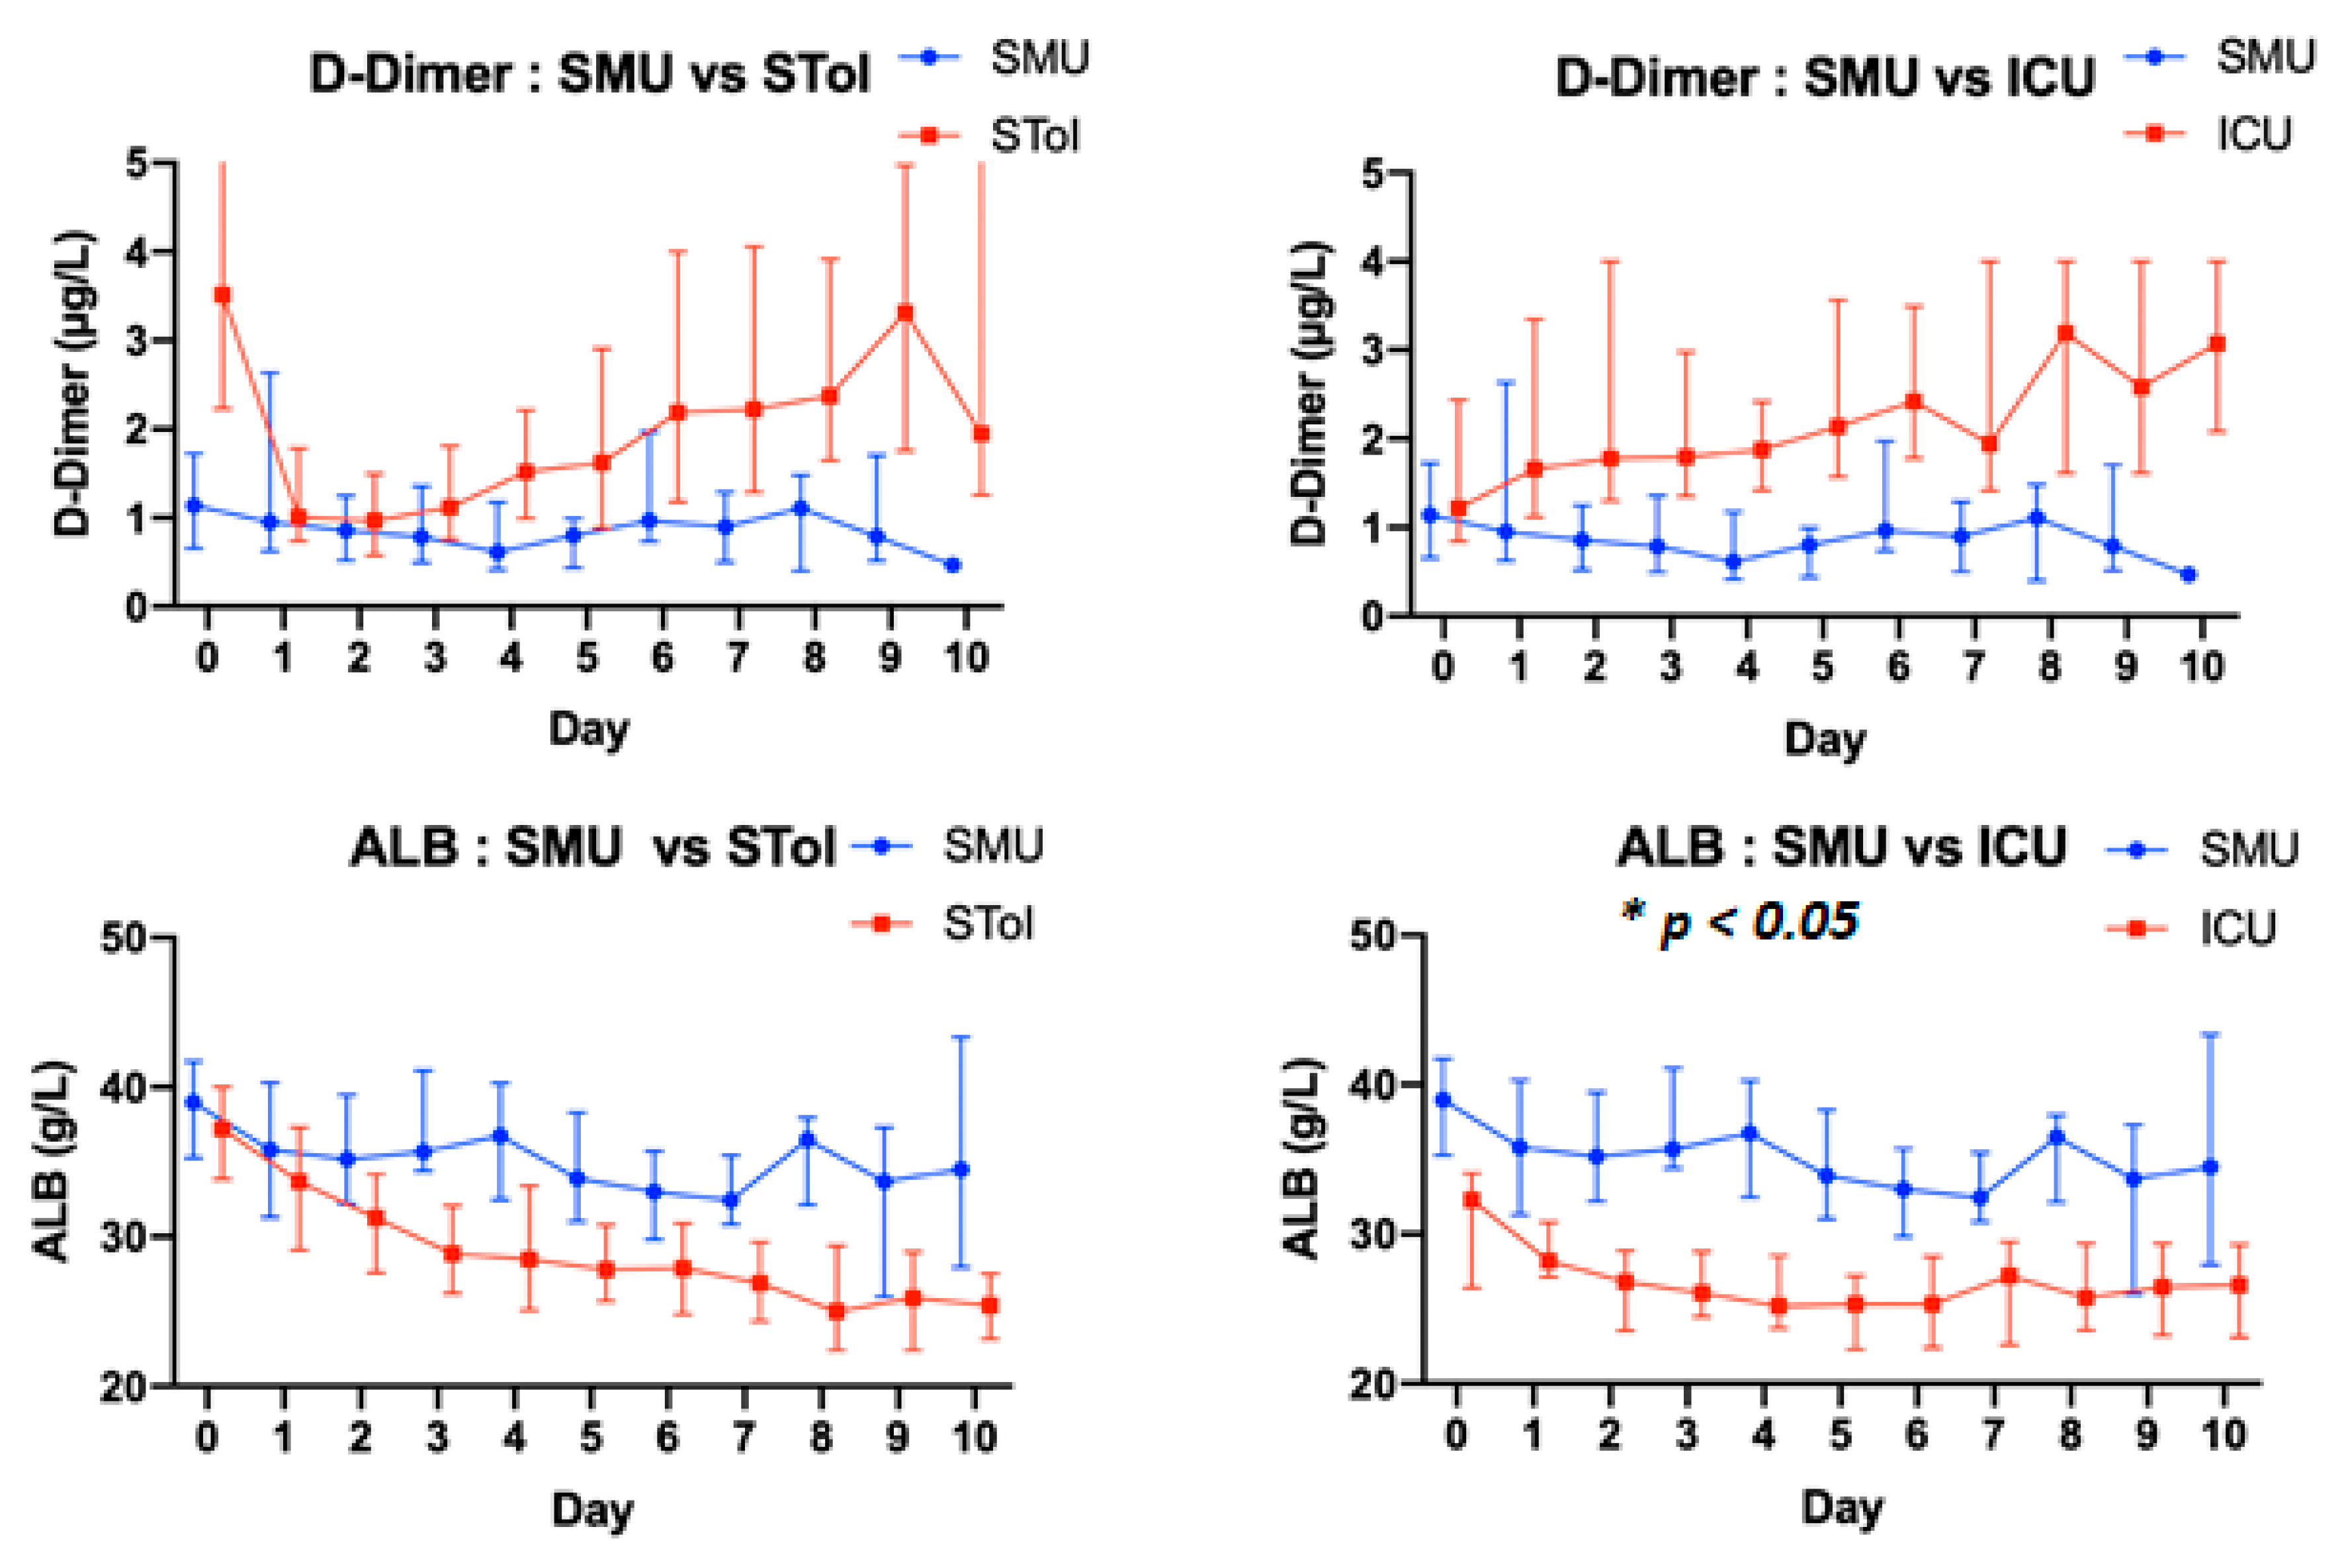
3.3. Patient Biological Parameters
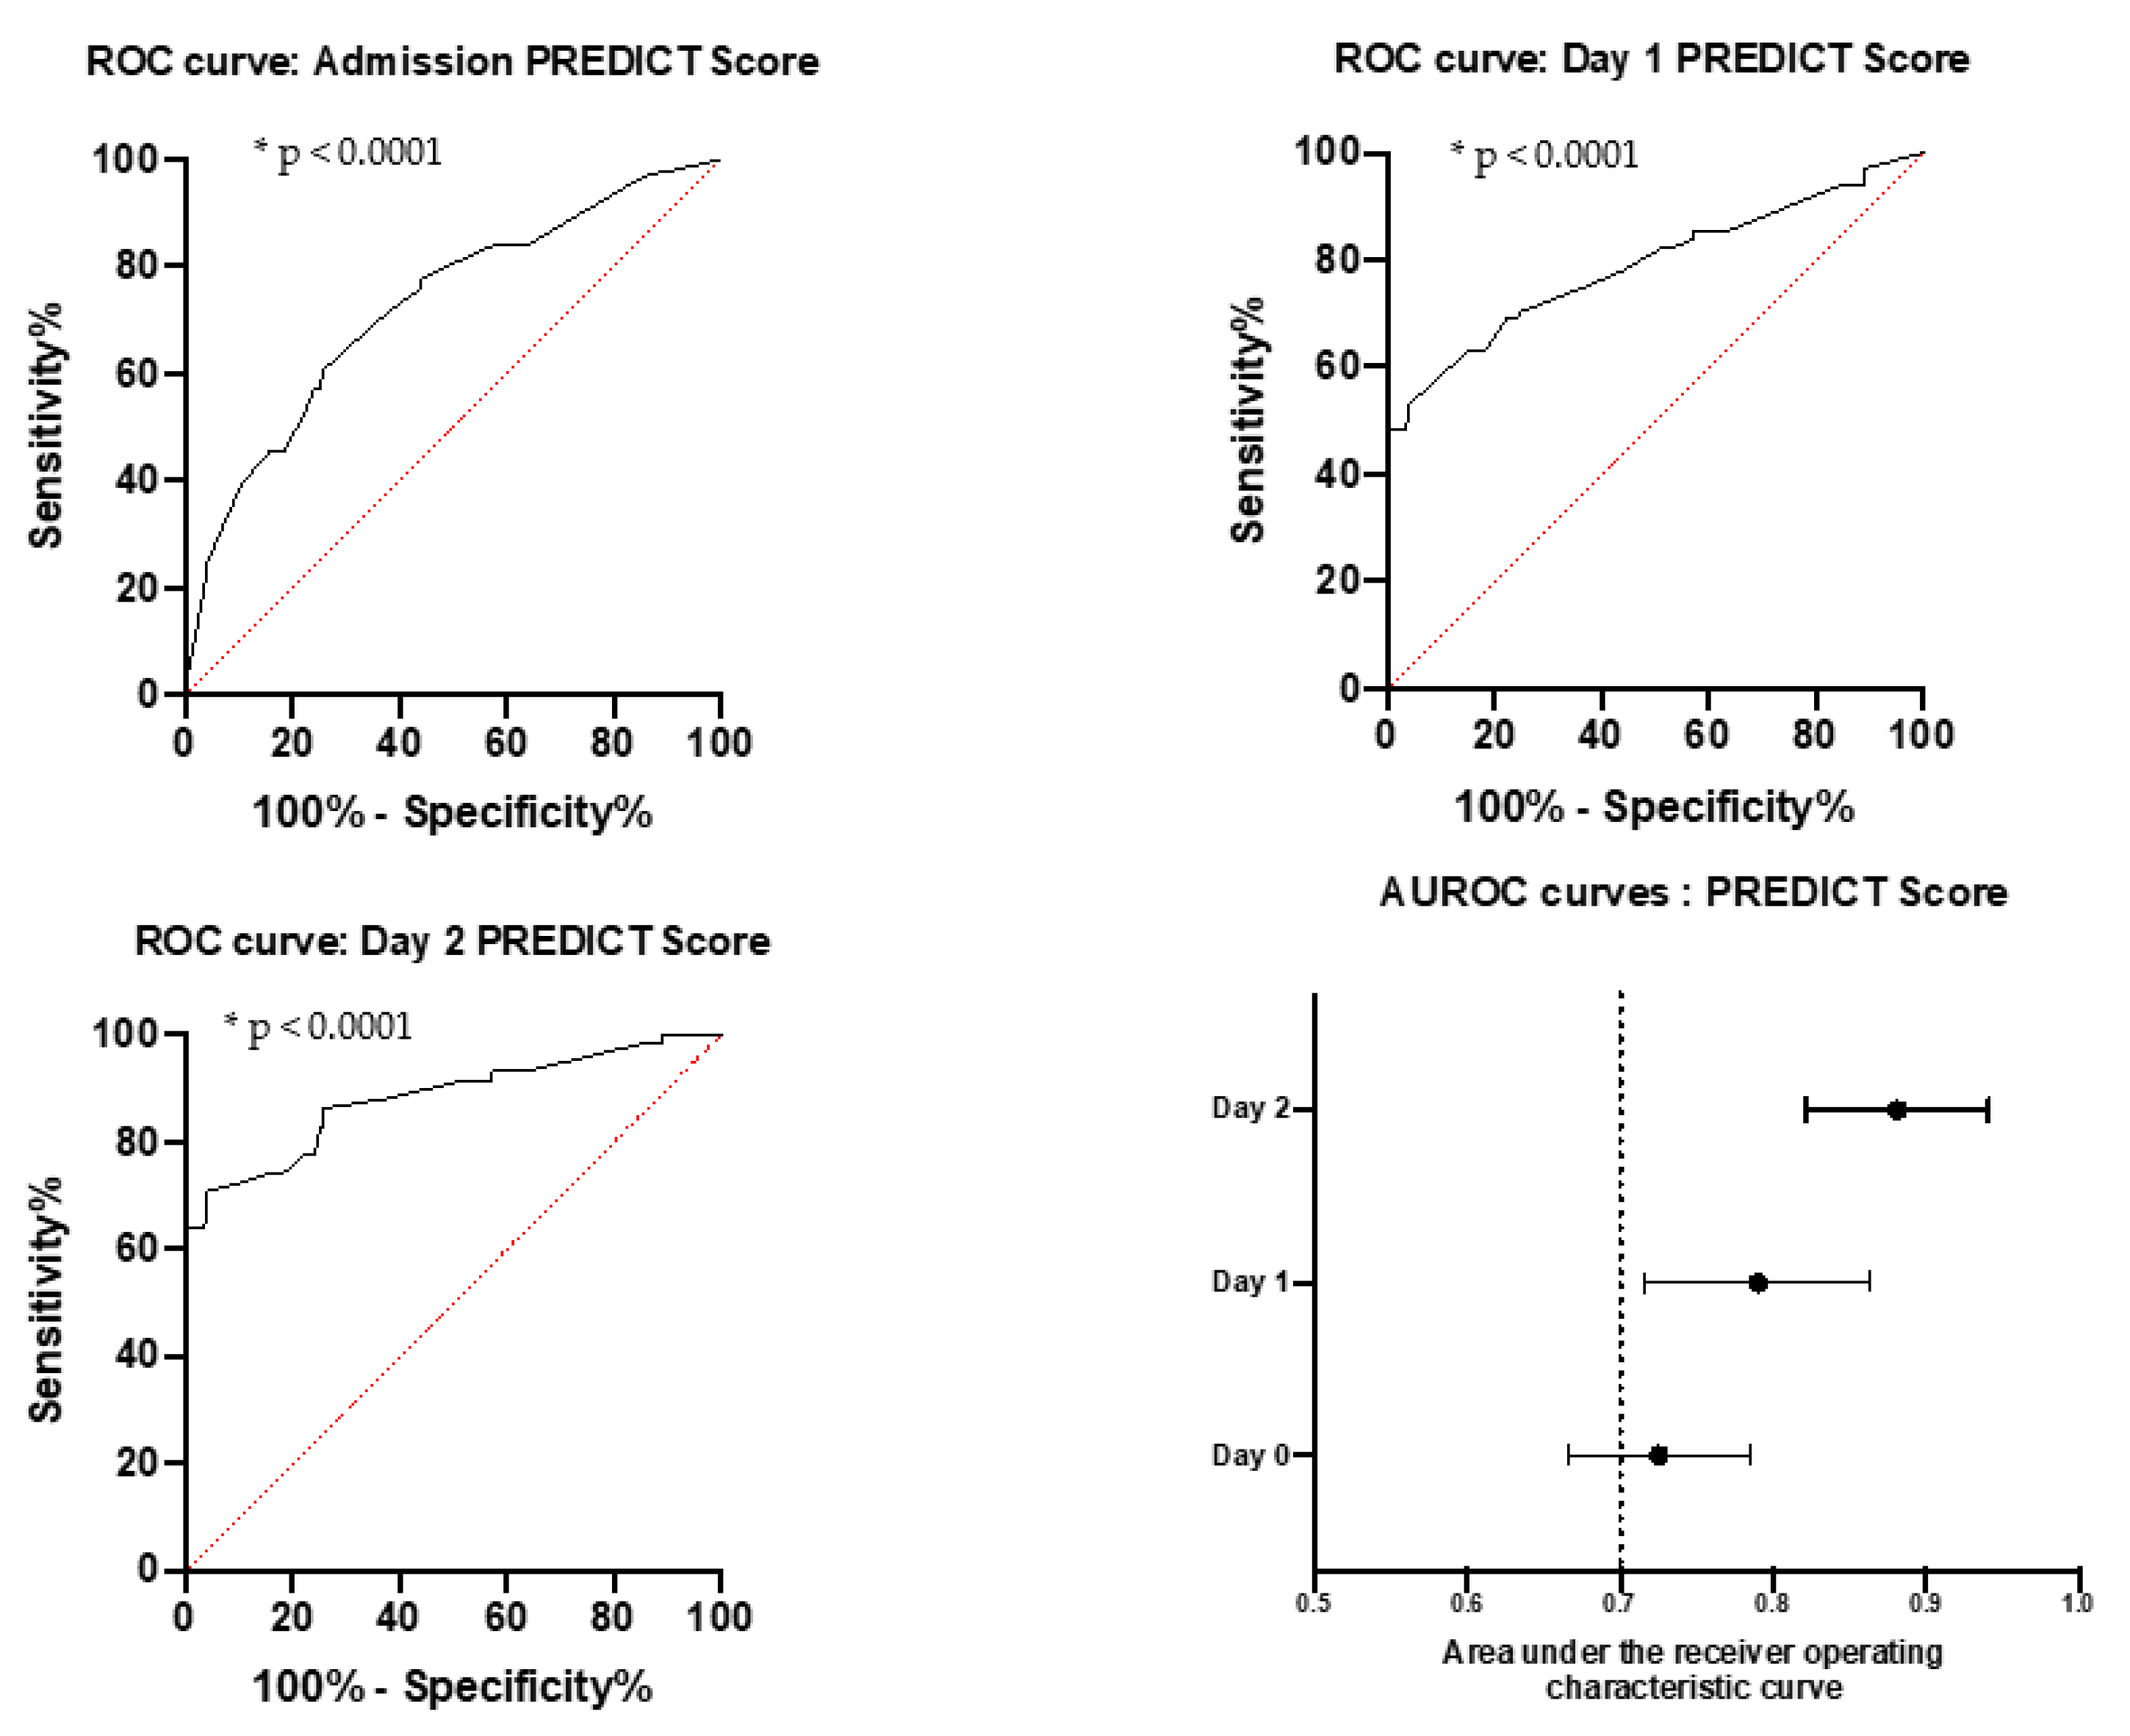
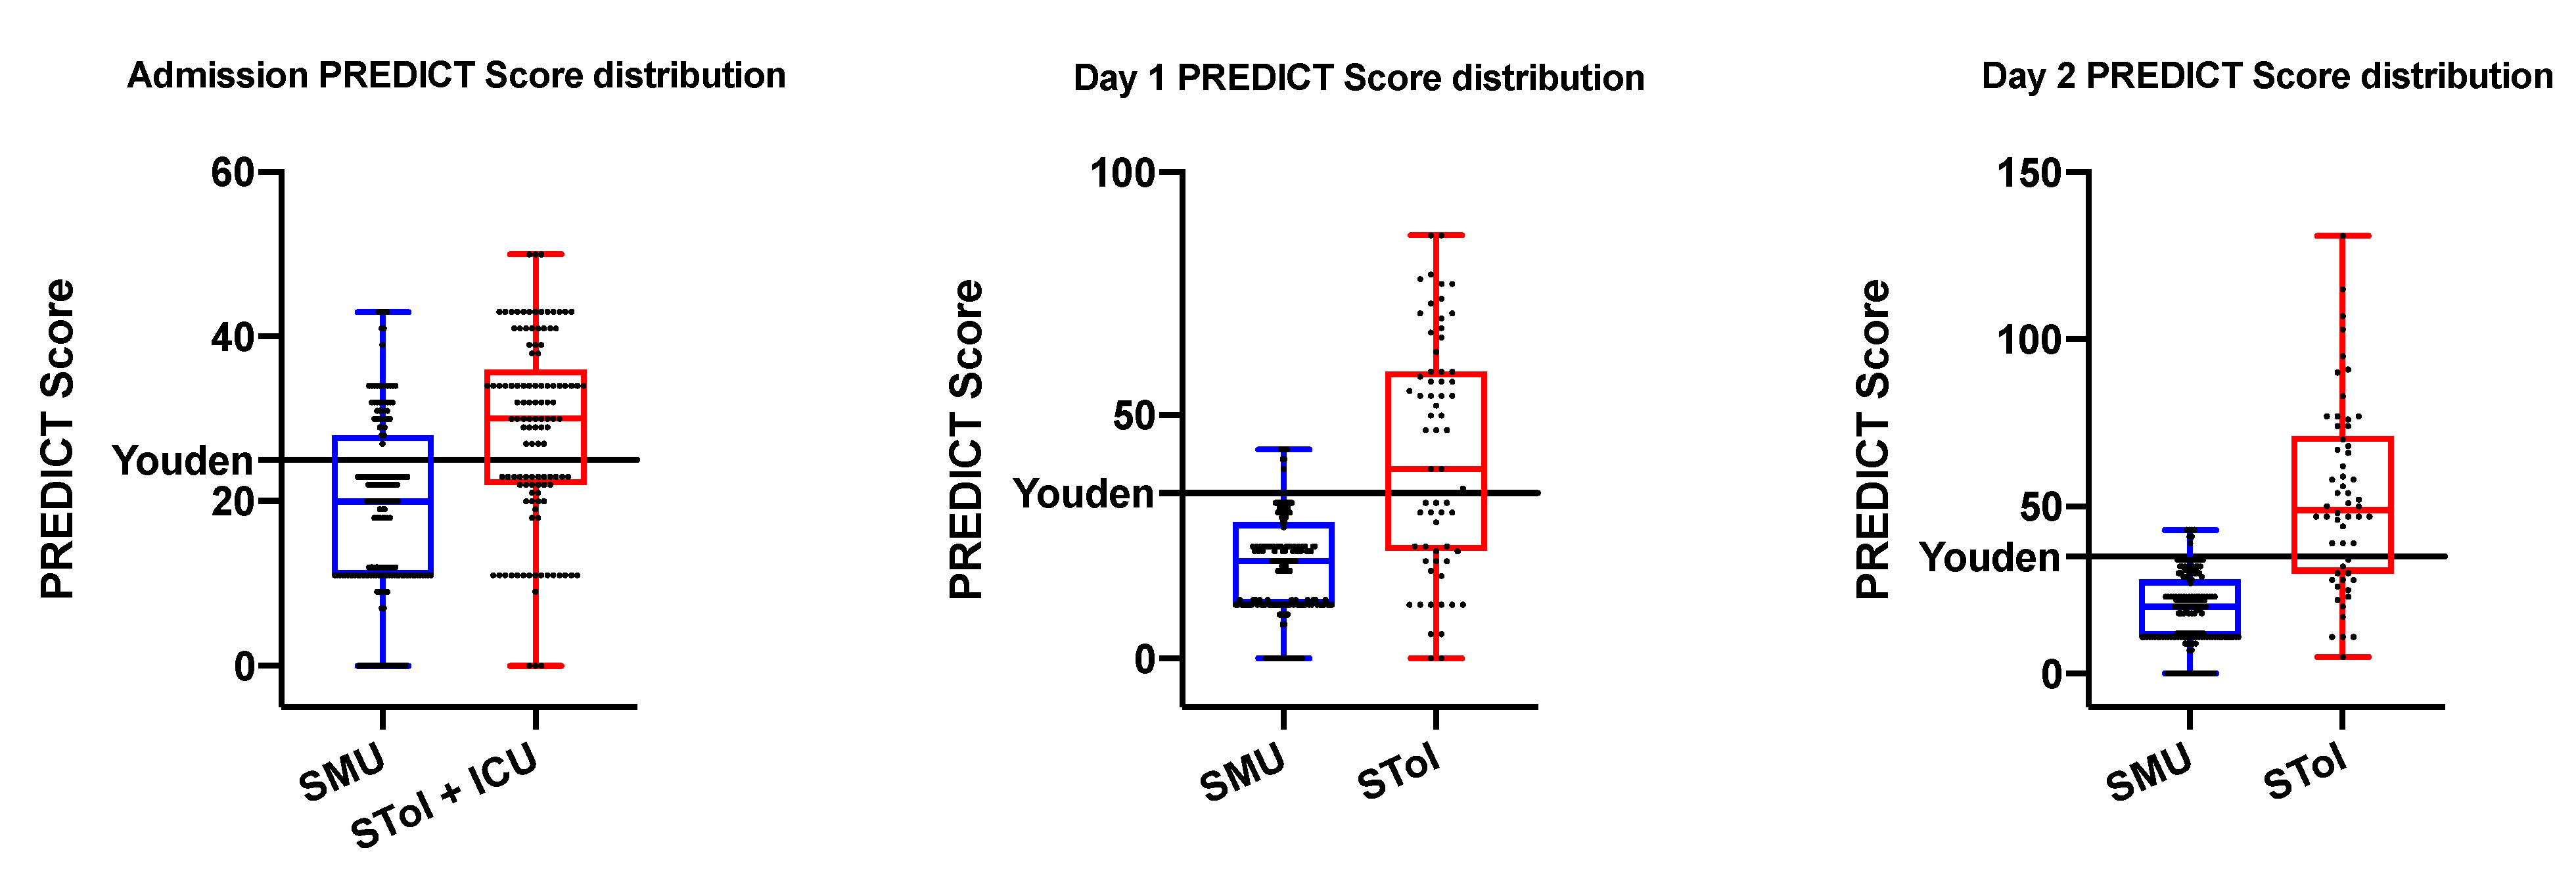
3.4. Clinical-Biological Score for Predicting Intensive Care Risk
4. Discussion
5. Conclusions
Supplementary Materials
Author Contributions
Funding
Institutional Review Board Statement
Data Availability Statement
Acknowledgments
Conflicts of Interest
Abbreviations
| ICU | Intensive Care Unit |
| SMU | Standard Medical Unit |
| STol | Standard to Intensive Care |
| PREDICT score | Predicting Risk factors for Early Determination of ICU Transfer |
| AP-HM | Assistance Publique des Hôpitaux de Marseille (Public Assistance Hospital of Marseille) |
| Na | natremia |
| CRP | C-reactive protein |
| FRT | ferritinemia |
| LDH | lactate dehydrogenase |
| CREAT | creatinine |
| BILI | total bilirubin |
| ASAT | aspartate aminotransferase |
| ALAT | alanine aminotransferase |
| LY | lymphocyte count |
| NEU | neutrophils cells count |
| NLR | neutrophil–lymphocyte ratio |
| WHO | World Health Organization |
| RT-PCR | real time polymerase chain reaction |
| SpO2 | arterial oxygen saturation |
| ROC | receiver operating characteristic |
| RR | respiratory rate |
| T °C | temperature |
| IQR | interquartile range |
References
- Huang, C.; Wang, Y.; Li, X.; Ren, L.; Zhao, J.; Hu, Y.; Zhang, L.; Fan, G.; Xu, J.; Gu, X.; et al. Clinical features of patients infected with 2019 novel coronavirus in Wuhan, China. Lancet 2020, 395, 497–506. [Google Scholar] [CrossRef]
- World Health Organization. Novel Coronavirus (2019-nCoV): Situation Report 3. 2020. Available online: https://apps.who.int/iris/handle/10665/330762 (accessed on 7 June 2020).
- Ji, Y.; Ma, Z.; Peppelenbosch, M.P.; Pan, Q. Potential association between COVID-19 mortality and health-care resource availa-bility. Lancet Glob. Health 2020, 8, 480. [Google Scholar] [CrossRef]
- Santé Publique France. COVID-19: Point Epidémiologique du 30 Avril 2020. Available online: https://maladies-et-traumatismes/maladies-et-infections-respiratoires/infection-a-coronavirus/documents/bulletin-national/covid-19-point-epidemiologique-du-30-avril-2020 (accessed on 22 May 2020).
- Semaine du 30 Mars 2020—CRES Paca. Available online: http://www.cres-paca.org/a/885/semaine-du-30-mars-2020/ (accessed on 25 May 2020).
- Plebani, M.; Laposata, M.; Lippi, G. A manifesto for the future of laboratory medicine professionals. Clin. Chim. Acta 2019, 489, 49–52. [Google Scholar] [CrossRef] [PubMed]
- Lippi, G.; Plebani, M. The novel coronavirus (2019-nCoV) outbreak: Think the unthinkable and be prepared to face the chal-lenge. Diagnosis 2020, 7, 79–81. [Google Scholar] [CrossRef] [PubMed]
- Lippi, G.; Plebani, M. A modern and pragmatic definition of Laboratory Medicine. Clin. Chem. Lab. Med. CCLM 2020. [Google Scholar] [CrossRef]
- Gao, Y.; Li, T.; Han, M.; Li, X.; Wu, D.; Xu, Y.; Zhu, Y.; Liu, Y.; Wang, X.; Wang, L. Diagnostic utility of clinical laboratory data determinations for patients with the severe COVID-19. J. Med. Virol. 2020, 92, 791–796. [Google Scholar] [CrossRef]
- Liang, W.; Liang, H.; Ou, L.; Chen, B.; Chen, A.; Li, C.; Li, Y.; Guan, W.; Sang, L.; Lu, J.; et al. Development and validation of a clinical risk score to predict the occurrence of critical illness in hospitalized patients with COVID-19. JAMA Intern. Med. 2020, 180, 1081–1089. [Google Scholar] [CrossRef]
- Allenbach, Y.; Saadoun, D.; Maalouf, G.; Vieira, M.; Hellio, A.; Boddaert, J.; Gros, H.; Salem, J.E.; Rigon, M.R.; Menyssa, C.; et al. Development of a multivariate prediction model of intensive care unit transfer or death: A French prospective cohort study of hospitalized COVID-19 patients. PLoS ONE 2020, 15. [Google Scholar] [CrossRef]
- Gidari, A.; Socio, G.V.D.; Sabbatini, S.; Francisci, D. Predictive value of National Early Warning Score 2 (NEWS2) for intensive care unit admission in patients with SARS-CoV-2 infection. Infect. Dis. 2020, 52, 698–704. [Google Scholar] [CrossRef]
- World Health Organization. Laboratory Testing for 2019 Novel Coronavirus (2019-nCoV) in Suspected Human Cases. Available online: https://www.who.int/publications-detail/laboratory-testing-for-2019-novel-coronavirus-in-suspected-human-cases-20200117 (accessed on 27 May 2020).
- Niederman, M.S.; Mandell, L.A.; Anzueto, A.; Bass, J.B.; Broughton, W.A.; Campbell, G.D.; Dean, N.; File, T.; Fine, M.J.; Gross, P.A.; et al. Guidelines for the management of adults with community-acquired pneu-monia. Am. J. Respir. Crit. Care Med. 2001, 163, 1730–1754. [Google Scholar] [CrossRef]
- Metlay, J.P.; Waterer, G.W.; Long, A.C.; Anzueto, A.; Brozek, J.; Crothers, K.; Cooley, L.A.; Dean, N.C.; Fine, M.J.; Flanders, S.A.; et al. Diagnosis and treatment of adults with community-acquired pneumonia. An official clinical practice guideline of the american thoracic society and infectious diseases society of America. Am. J. Respir. Crit. Care Med. 2019, 200, 45–67. [Google Scholar] [CrossRef]
- Lui, G. Viral dynamics of SARS-CoV-2 across a spectrum of disease severity in COVID-19. J. Infect. 2020, 1, 1–11. [Google Scholar] [CrossRef] [PubMed]
- RCP London. National Early Warning Score (NEWS) 2. Available online: https://www.rcplondon.ac.uk/projects/outputs/national-early-warning-score-news-2 (accessed on 27 May 2020).
- Martinez, L.; Cheng, W.; Wang, X.; Ling, F.; Mu, L.; Li, C.; Huo, X.; Ebell, M.H.; Huang, H.; Zhu, L.; et al. A risk classification model to predict mortality among laboratory-confirmed avian influenza a H7N9 patients: A population-based observational cohort study. J. Infect. Dis. 2019, 220, 1780–1789. [Google Scholar] [CrossRef] [PubMed]
- Redfern, O.C.; Smith, G.B.; Prytherch, D.R.; Meredith, P.; Inada-Kim, M.; Schmidt, P.E. A comparison of the quick sequential (sep-sis-related) organ failure assessment score and the national early warning score in non-ICU patients with/without infec-tion. Crit. Care Med. 2018, 46, 1923–1933. [Google Scholar] [CrossRef] [PubMed]
- Force, A.D.T.; Ranieri, V.M.; Rubenfeld, G.D.; Thompson, B.; Ferguson, N.; Caldwell, E. Acute respiratory distress syndrome. JAMA 2012, 307, 2526–2533. [Google Scholar]
- Simonnet, A.; Chetboun, M.; Poissy, J.; Raverdy, V.; Noulette, J.; Duhamel, A.; Labreuche, J.; Mathieu, D.; Pattou, F.; Jourdain, M.; et al. High prevalence of obesity in severe acute respiratory syndrome coronavirus-2 (SARS-CoV-2) requiring invasive mechanical ventilation. Obesity 2020, 28, 1195–1199. [Google Scholar] [CrossRef]
- Grasselli, G.; Zangrillo, A.; Zanella, A.; Antonelli, M.; Cabrini, L.; Castelli, A.; Cereda, D.; Coluccello, A.; Foti, G.; Fumagalli, R.; et al. Baseline characteristics and outcomes of 1591 patients infected with SARS-CoV-2 admitted to ICUs of the Lombardy Region, Italy. JAMA 2020, 323, 1574–1581. [Google Scholar] [CrossRef] [PubMed]
- Guan, W.J.; Liang, W.H.; Zhao, Y.; Liang, H.-R.; Chen, Z.-S.; Li, Y.-M.; Liu, X.-Q.; Chen, R.-C.; Tang, C.-L.; Wang, T.; et al. Comorbidity and its impact on 1590 patients with COVID-19 in China: A nationwide analysis. Eur. Respir. J. 2020, 55, 2000547. [Google Scholar] [CrossRef]
- Williams, B.; Mancia, G.; Spiering, W.; Agabiti Rosei, E.; Azizi, M.; Burnier, M.; Clement, D.L.; Coca, A.; De Simone, G.; Dominiczak, A.; et al. 2018 ESC/ESH Guidelines for the management of arterial hypertension: The task force for the management of arterial hypertension of the European Society of Cardiology (ESC) and the European Society of Hy-pertension (ESH). Eur. Heart J. 2018, 39, 3021–3104. [Google Scholar] [CrossRef]
- Richardson, S.; Hirsch, J.S.; Narasimhan, M.; Crawford, J.M.; McGinn, T.; Davidson, K.W.; Barnaby, D.P.; Becker, L.B.; Chelico, J.D.; Cohen, S.L.; et al. Presenting characteristics, comorbidities, and outcomes among 5700 patients hospitalized with COVID-19 in the New York City Area. JAMA 2020, 323, 2052–2059. [Google Scholar] [CrossRef]
- Yang, J.; Zheng, Y.; Gou, X.; Pu, K.; Chen, Z.; Guo, Q.; Ji, R.; Wang, H.; Wang, Y.; Zhou, Y. Prevalence of comorbidities and its effects in patients infected with SARS-CoV-2: A systematic review and meta-analysis. Int. J. Infect. Dis. 2020, 94, 91–95. [Google Scholar] [CrossRef] [PubMed]
- Zhou, F.; Yu, T.; Du, R.; Fan, G.; Liu, Y.; Liu, Z.; Xiang, J.; Wang, Y.; Song, B.; Gu, X.; et al. Clinical course and risk factors for mortality of adult inpatients with COVID-19 in Wuhan, China: A retrospective cohort study. Lancet 2020, 395, 1054–1062. [Google Scholar] [CrossRef]
- Paton, J.F.R.; Felippe, I.; Paterson, D.J.; Donnelly, J. What Should We Add to the Intensivists Mask to Relieve “Hypoxic Happiness” in COVID-19 Patients? The Physiological Society. Available online: https://www.physoc.org/blog/hypoxic-happiness-covid19/ (accessed on 14 September 2020).
- Velavan, T.P.; Meyer, C.G. Mild versus severe COVID-19: Laboratory markers. Int. J. Infect. Dis. 2020, 95, 304–307. [Google Scholar] [CrossRef] [PubMed]
- Mueller, A.A.; Tamura, T.; Crowley, C.P.; DeGrado, J.R.; Haider, H.; Jezmir, J.L.; Keras, G.; Penn, E.H.; Massaro, A.F.; Kim, E.Y. Inflammatory biomarker trends predict respiratory decline in COVID-19 patients. Cell Rep. Med. 2020, 1, 100144. [Google Scholar] [CrossRef] [PubMed]
- Bertin, D.; Brodovitch, A.; Beziane, A.; Hug, S.; Bouamri, A.; Mege, J.L.; Heim, X.; Bardin, N. Anticardiolipin IgG autoantibody level is an independent risk factor for COVID-19 severity. Arthritis Rheumatol. 2020, 72, 1953–1955. [Google Scholar] [CrossRef] [PubMed]
- Hoeboer, S.H.; Straaten, H.M.O.-V.; Groeneveld, A.B.J. Albumin rather than C-reactive protein may be valuable in predicting and monitoring the severity and course of acute respiratory distress syndrome in critically ill patients with or at risk for the syndrome after new onset fever. BMC Pulm. Med. 2015, 15, 1–13. [Google Scholar] [CrossRef] [PubMed]
- Huang, J.; Cheng, A.; Kumar, R.; Fang, Y.; Chen, G.; Zhu, Y.; Lin, S. Hypoalbuminemia predicts the outcome of COVID-19 independent of age and co-morbidity. J. Med. Virol. 2020, 92, 2152–2158. [Google Scholar] [CrossRef]
- Ritter, M.; Ott, D.V.M.; Paul, F.; Haynes, J.-D.; Ritter, K. COVID-19: A simple statistical model for predicting intensive care unit load in exponential phases of the disease. Sci. Rep. 2021, 11, 1–12. [Google Scholar] [CrossRef]
- Heo, J.; Han, D.; Kim, H.J.; Kim, D.; Lee, Y.K.; Lim, D.; Hong, S.O.; Park, M.J.; Ha, B.; Seog, W. Prediction of patients requiring intensive care for COVID-19: Development and validation of an integer-based score using data from Centers for Disease Control and Pre-vention of South Korea. J. Intensive Care 2021, 29, 16. [Google Scholar] [CrossRef]


| All (n = 292) | SMU Group † (n = 175) | ICU Group † (n = 49) | SToI Group † (n = 68) | SMU vs SToI (p-Value) | SMU vs ICU (p-Value) | SToI vs ICU (p-Value) | |
|---|---|---|---|---|---|---|---|
| Demographics characteristics | |||||||
| Age. years. median [IQR] | 68 [57–81] | 74 [59–85] | 62 [55–70] | 67 [57–76] | ** 0.004 | *** <0.001 | 0.090 |
| Age ≥ 75 years (%) | 39.0 | 49.1 | 16.3 | 29.4 | ** 0.005 | *** <0.001 | 0.102 |
| Medically assisted nursing home | 12 | 19.4 | 0.0 | 1.5 | *** <0.001 | ** 0.001 | 1 |
| Gender Male (%) | 63.7 | 57.7 | 71.4 | 73.5 | * 0.023 | 0.082 | 0.801 |
| Timeline (day) | |||||||
| Time between first symptoms and hospitalization. median [IQR] | 5 [3–8] | 5 [3–8] | 7 [5–10] | 5 [3–7] | 0.931 | ** 0.004 | ** 0.004 |
| Time between SMU and ICU. median [IQR] | 4 [2–5] | ||||||
| Time in SMU. median [IQR] | 10 [7–14] | ||||||
| Time in ICU. median [IQR] | 22 [9–34] | 8 [5–22] | |||||
| Initial clinical characteristics | |||||||
| Body Mass Index (kg/m2) | |||||||
| <18.5 (%) | 1.4 | 1.7 | 0.0 | 1.5 | 0.44 | *** <0.001 | ** 0.009 |
| 18.5–24.99 (%) | 49.7 | 56.6 | 26.5 | 48.5 | |||
| 25–29.99 (%) | 21.9 | 18.9 | 24.5 | 27.9 | |||
| ≥30 (%) | 27.1 | 22.9 | 49.0 | 22.1 | |||
| Comorbidities | |||||||
| Diabete (%) | 34.5 | 32.2 | 43.8 | 33.8 | 0.807 | 0.136 | 0.278 |
| Hypertension (%) | 54.8 | 52.3 | 58.3 | 58.8 | 0.360 | 0.458 | 0.958 |
| Cardio-Vascular diseases (%) | 25.9 | 26.4 | 31.3 | 20.6 | 0.344 | 0.508 | 0.192 |
| Dyslipidemia (%) | 18.3 | 13.2 | 25 | 26.5 | * 0.014 | * 0.047 | 0.859 |
| Chronic obstrucitve pulmonary disease (%) | 6.2 | 5.2 | 6.3 | 8.8 | 0.372 | 0.725 | 0.734 |
| Asthma (%) | 7.2 | 8 | 10.4 | 2.9 | 0.248 | 0.569 | 0.124 |
| Tobacco (%) | 20 | 14.4 | 27.1 | 29.4 | ** 0.007 | * 0.038 | 0.784 |
| Active cancer (%) | 7.6 | 9.2 | 6.3 | 4.4 | 0.214 | 0.771 | 0.690 |
| Remission cancer (%) | 4.5 | 5.2 | 4.2 | 2.9 | 0.733 | 1 | 1 |
| Kidney disease (%) | 6.9 | 6.9 | 6.3 | 7.4 | 1 | 1 | 1 |
| Symptoms on admission | |||||||
| Dyspnea (%) | 52.9 | 37.4 | 95.9 | 61.8 | ** 0.001 | *** <0.001 | *** <0.001 |
| Fever (%) | 74.6 | 70.7 | 75.5 | 83.8 | * 0.035 | 0.508 | 0.264 |
| Cough (%) | 55,0 | 51.7 | 51.0 | 66.2 | * 0.042 | 0.931 | 0.099 |
| Ageusia—Anosmia (%) | 16.2 | 14.9 | 10.2 | 23.5 | 0.113 | 0.397 | 0.064 |
| Diarrhea (%) | 19.2 | 16.7 | 16.3 | 27.9 | * 0.048 | 0.955 | 0.141 |
| Initial Vital signs | |||||||
| Heart rate. median [IQR] | 90 [79–101] | 89 [78–100] | 94 [81–102] | 90 [79–102] | 0.344 | 0.126 | 0.511 |
| Respiratory rate. median [IQR] | 24 [19–28] | 22 [18–26] | 30 [25–35] | 24 [20–30] | * 0.021 | *** <0.001 | *** <0.001 |
| Systolic blood pressure. median [IQR] | 132 [120–150] | 133 [120–150] | 126 [119–143] | 130 [114–145] | 0.23 | 0.132 | 0.678 |
| Distolic blood pressure. median [IQR] | 74 [63–83] | 74 [64–82] | 70 [61–83] | 75 [63–87] | 0.677 | 0.291 | 0.261 |
| Temperature. median [IQR] | 37.4 [36.8–38.3] | 37.1 [36.7–38] | 38.1 [37.1–38.8] | 37.9 [37–38.5] | * 0.04 | *** <0.001 | 0.265 |
| Oxygen saturation (Sp O2) median [IQR] | 95 [93–97] | 96 [93–97] | 94 [89–95] | 95 [93–96] | * 0.036 | *** <0.001 | *** <0.001 |
| NEWS-2. median [IQR] | 5 [2–7] | 4 [2–5] | 7 [6–8] | 5 [3–7] | ** 0.002 | *** <0.001 | *** <0.001 |
| Low risk (%) | 48.1 | 61,0 | 5 | 43.1 | ** 0.002 | *** <0.001 | *** <0.001 |
| Medium risk (%) | 28 | 27.7 | 32.5 | 26.2 | |||
| High risk (%) | 23.9 | 11.3 | 62.5 | 30.8 |
| All (n = 292) | SMU Group † (n = 175) | ICU Group † (n = 49) | SToI Group † (n = 68) | SMU vs SToI (p-Value) | SMU vs ICU (p-Value) | SToI vs ICU (p-Value) | |
|---|---|---|---|---|---|---|---|
| Initial O2 needed | |||||||
| Yes (%) | 36.5 | 35.8 | 73.8 | 42.6 | ** 0.008 | *** <0.001 | ** 0.001 |
| Volume. median [IQR] | 4 [3–9] | 3 [2–5] | 12 [5–15] | 3 [2–6] | 0.443 | *** <0.001 | *** <0.001 |
| Computed tomography (CT) low dose COVID-19 | |||||||
| Yes (%) | 94.2 | 98.3 | 75.5 | 97.1 | 0,622 | *** <0.001 | *** <0.001 |
| †† Lung damages | |||||||
| Absence (%) | 6.9 | 10.4 | 0.0 | 1.6 | *** <0.001 | *** <0.001 | *** <0.001 |
| Minor (%) | 22.5 | 29.9 | 2.9 | 14.1 | |||
| Intermediary (%) | 39.3 | 42.7 | 11.8 | 45.3 | |||
| Severe (%) | 31.4 | 17.1 | 85.3 | 39.1 | |||
| Outcomes | |||||||
| Pulmonary embolism (%) | 4.8 | 2.3 | 8.2 | 8.8 | * 0.031 | 0.071 | 1 |
| Cerbebral strocke (%) | 1.7 | 0.6 | 6.1 | 1.5 | 0.482 | * 0.034 | 0.307 |
| Deep vein thrombosis (%) | 7.2 | 1.7 | 22.4 | 10.3 | * 0.06 | *** <0.001 | 0.072 |
| Total vascular insident (%) | 12.7 | 4 | 32.7 | 20.6 | *** <0.001 | *** <0.001 | 0.140 |
| Azithomycin (%) | 91.4 | 94.3 | 79.6 | 92.6 | 0.767 | ** 0.003 | * 0.037 |
| Hydroxychloroquine (%) | 56.2 | 49.1 | 61.2 | 70.6 | ** 0.003 | 0.135 | 0.289 |
| ††† Acute repiratory failure (%) | 47.3 | 12.6 | 100 | 98.5 | *** <0.001 | *** <0.001 | 1 |
| †††† Acute respiratory distress syndrome [ARDS] (%) | 37.7 | 5.1 | 98 | 77.9 | *** <0.001 | *** <0.001 | ** 0.002 |
| Death (%) | 16.8 | 14.3 | 20.4 | 20.6 | 0.230 | 0.297 | 0.981 |
| Maximum O2 help | |||||||
| High-concentration mask | |||||||
| Yes (%) | 9.6 | 0 | 16.3 | 30.9 | *** <0.001 | *** <0.001 | |
| O2 Volume (L/min). Median [IQR] | 30 [15–50] | NA | 40 [28–50] | 30 [15–50] | *** <0.001 | *** <0.001 | 0.518 |
| Oro-tracheal intubation | |||||||
| Yes (%) | 25 | 0 | 79.6 | 50 | *** <0.001 | *** <0.001 | ** 0.001 |
| All (n = 140) | SMU Group † (n = 87) | ICU Group † (n = 10) | SToI Group † (n = 43) | SMU vs SToI (p-Value) | SMU vs ICU (p-Value) | SToI vs ICU (p-Value) | |
|---|---|---|---|---|---|---|---|
| Demographics characteristics | |||||||
| Age. years. median [IQR] | 71 [61–81] | 75 [62–85] | 67 [59–74] | 67 [59–72] | ** 0.001 | 0.112 | 0.641 |
| Age ≥ 75 years (%) | 39.3 | 52.9 | 20.0 | 16.3 | *** <0.001 | *** <0.001 | 1 |
| Medically assisted nursing home | 7.9 | 11.5 | 10.0 | 0.0 | * 0.03 | * 0.043 | 0.189 |
| Gender Male (%) | 61.4 | 55.2 | 80 | 69.8 | 0.110 | 0.154 | 0.706 |
| Timeline (day) | |||||||
| Time between first symptoms and hospitalisation. median [IQR] | 5 [3–7] | 5 [3–7] | 7 [2–13] | 5 [3–7] | 0.931 | 0.177 | 0.231 |
| Time between SMU and ICU. median [IQR] | 4 [2–6] | ||||||
| Time in SMU. median [IQR] | 8 [6–12] | ||||||
| Time in ICU. median [IQR] | 11 [6–17] | 7 [3–20] | |||||
| Initial clinical characteristics | |||||||
| Body Mass Index (kg/m2) | |||||||
| <18.5 (%) | 0,0 | 0.0 | 0.0 | 0.0 | ** 0.001 | ** 0.005 | 0.286 |
| 18.5–24.99 (%) | 52.9 | 63.2 | 50.0 | 32.6 | |||
| 25–29.99 (%) | 20.0 | 18.4 | 30.0 | 20.9 | |||
| ≥30 (%) | 27.1 | 18.4 | 20.0 | 46.5 | |||
| Comorbidities | |||||||
| Diabete (%) | 42.1 | 35.6 | 50 | 53.5 | 0.059 | 0.174 | 1 |
| Hypertension (%) | 60 | 56.3 | 60 | 67.4 | 0.183 | 0.492 | 0.719 |
| Cardio-Vascular diseases (%) | 26.4 | 27.6 | 20 | 25.6 | 0.808 | 1 | 1 |
| Dyslipidemia (%) | 13.6 | 8 | 20 | 23.3 | * 0.016 | * 0.038 | 1 |
| Chronic obstrucitve pulmonary disease (%) | 8.6 | 8 | 0.0 | 11.6 | 0.530 | 0.616 | 0.570 |
| Asthma (%) | 5.0 | 2.3 | 10 | 9.3 | 0.092 | 0.134 | 1 |
| Tobacco (%) | 22.9 | 18.4 | 30 | 30.2 | 0.127 | 0.268 | 1 |
| Active cancer (%) | 13.6 | 12.6 | 0.0 | 18.6 | 0.365 | 0.370 | 0.327 |
| Remission cancer (%) | 7.1 | 6.9 | 0.0 | 9.3 | 0.729 | 0.874 | 0.473 |
| Kidney disease (%) | 8.6 | 10.3 | 10 | 4.7 | 0.336 | 0.472 | 0.345 |
| Symptoms on admission | |||||||
| Dyspnea (%) | 65.7 | 60.9 | 90.0 | 69.8 | 0.323 | 0.146 | 0.258 |
| Fever (%) | 55.7 | 56.3 | 60.0 | 53.5 | 0.760 | 0.963 | 1 |
| Cough (%) | 37.1 | 40.2 | 20.0 | 34.9 | 0.556 | 0.462 | 0.471 |
| Ageusia—Anosmia (%) | 10.7 | 8.0 | 0.0 | 18.6 | 0.087 | 0.140 | 0.327 |
| Diarrhea (%) | 15.0 | 13.8 | 10.0 | 18.6 | 0.474 | 0.801 | 1 |
| Initial Vital signs | |||||||
| Heart rate. median [IQR] | 88 [78–97] | 84 [74–92] | 99 [85–108] | 91 [82–99] | ** 0.008 | * 0.033 | 0.301 |
| Respiratory rate. median [IQR] | 22 [18–28] | 20 [18–25] | 26 [24–31] | 25 [20–28] | ** 0.002 | ** 0.005 | 0.213 |
| Systolic blood pressure. median [IQR] | 130 [116–142] | 130 [110–141] | 132 [119–150] | 130 [118–143] | 0.577 | 0.525 | 0.724 |
| Distolic blood pressure. median [IQR] | 70 [61–79] | 70 [60–79] | 64 [50–84] | 70 [63–80] | 0.356 | 0.844 | 0.707 |
| Temperature. median [IQR] | 37.4 [36.8–38.3] | 37 [36.6–38] | 38 [37–39] | 37.9 [36.9–38.5] | * 0.011 | 0.223 | 0.909 |
| Oxygen saturation (Sp O2) median [IQR] | 95 [92–96] | 95 [93–97] | 88 [80–95] | 94 [92–96] | 0.081 | ** 0.002 | * 0.028 |
| NEWS-2. median [IQR] | 4 [2–6] | 3 [1–5] | 7 [5–9] | 6 [4–7] | ** 0.002 | ** 0.002 | 0.121 |
| Low risk (%) | 48.1 | 62.1 | 20 | 39.5 | ** 0.001 | *** <0.001 | 0.331 |
| Medium risk (%) | 28 | 26.4 | 10.0 | 20.9 | |||
| Hight risk (%) | 23.9 | 11.5 | 70.0 | 39.5 |
| All (n = 140) | SMU Group † (n = 87) | ICU Group † (n = 10) | SToI Group † (n = 43) | SMU vs SToI (p-Value) | SMU vs ICU (p-Value) | SToI vs ICU (p-Value) | |
|---|---|---|---|---|---|---|---|
| Initial O2 needed | |||||||
| Yes (%) | 34.3 | 32.2 | 30 | 39.5 | 0.407 | 0.714 | 0.725 |
| Volume. median [IQR] | 3 [2–5] | 3 [2–5] | NA | 3 [2–4] | 0.885 | * 0.019 | |
| Computed tomography (CT) low dose COVID-19 | |||||||
| Yes (%) | 96.4 | 95.4 | 88.9 | 100 | 0.301 | 0.140 | 0.173 |
| Lung damages †† | |||||||
| Absence (%) | 5.7 | 8.4 | 0.0 | 2.4 | 0.1 | 0.070 | 0.496 |
| Minor (%) | 25.7 | 30.1 | 12.5 | 23.8 | |||
| Intermediary (%) | 32.1 | 38.6 | 12.5 | 28.6 | |||
| Severe (%) | 31.4 | 22.9 | 75.0 | 45.2 | |||
| Outcomes | |||||||
| Pulmonary embolism (%) | 2.9 | 1.1 | 10.0 | 4.7 | 0.254 | 0.093 | 0.473 |
| Cerbebral strocke (%) | 0 | 0 | 0.0 | 0.0 | |||
| Deep vein thrombosis (%) | 0.7 | 0 | 0.0 | 2.3 | 0.331 | 0.379 | 1 |
| Total vascular insident (%) | 2.9 | 1.1 | 10.0 | 7 | 0.105 | 0.232 | 1 |
| Azithomycin (%) | 42.9 | 96.6 | 70.0 | 79.1 | ** 0.002 | ** 0.001 | 0.677 |
| Hydroxychloroquine (%) | 89.3 | 44.8 | 10.0 | 46.5 | 0.856 | 0.096 | 0.069 |
| Acute repiratory failure ††† (%) | 50.7 | 23 | 90.0 | 97.7 | *** <0.001 | *** <0.001 | 1 |
| Acute respiratory distress syndrome [ARDS] †††† (%) | 40.7 | 9.2 | 90.0 | 93 | *** <0.001 | *** <0.001 | 1 |
| Death (%) | 13 | 9.2 | 20.0 | 26.2 | * 0.011 | * 0.026 | 1 |
| Maximum O2 help | |||||||
| High-concentration mask | |||||||
| Yes (%) | 19.3 | 10.3 | 41.9 | ** 0.004 | ** 0.006 | 0.345 | |
| O2 Volume (l /min). median [IQR] | 40 [28–50] | 15 [15–25] | NA | 45 [35–50] | *** <0.001 | ||
| Oro-tracheal intubation | |||||||
| Yes (%) | 20.7 | 0 | 80.0 | 48.8 | *** <0.001 | *** <0.001 | 0.091 |
| Physiological Parameter | Score | ||||||
| +3 | +2 | +1 | 0 | +1 | +2 | +3 | |
| Respiration rate (per min ute) | ≤8 | 9–11 | 12–20 | 21–24 | ≥25 | ||
| SpO2 scale 1 (%) * | ≤91 | 92–93 | 94–95 | ≥96 | |||
| SpO2 scale 2 (%) * | ≤83 | 84–85 | 86-87 | 88–92 ≥93 on air | 93–94 on oxygen | 95–96 on oxygen | ≥97 on oxygen |
| Air or oxygen? | Oxygen | Air | |||||
| Systolic blood pressure (mmHg) | ≤90 | 91–100 | 101–110 | 111–219 | ≥220 | ||
| Heart rate (per minute) | ≤40 | 41–50 | 51–90 | 91–110 | 111–130 | ≥131 | |
| Consciousness | Alert | New-onset confusion (or disorientation/agitation) | |||||
| Temperature (°C) | ≤35.0 | 35.1–36.0 | 36.1–38.0 | 38.1–39.0 | ≥39.1 | ||
| NEWS2 interpretation | Aggregate score = 0–4: Low clinical risk Aggregate score = 5–6: Medium clinical risk Aggregate score = 7 or above: High clinical risk | ||||||
| Odd Ratio | Confidence Interval (95%) | p-Value | |||||
|---|---|---|---|---|---|---|---|
| Day 0 | Day 0 | Day 0 | |||||
| Admission parameters | SMU Group | SToI + ICU Groups | SMU Vs (SToI + ICU) | ||||
| Age < 75 years | 50.8% | 76% | 231.2 | [8.1; 6,611.4] | ** 0.001 | ||
| Body Mass Index ≥ 30 kg/m² | 22.9% | 29.1% | 96.4 | [4.8; 1,928.1] | ** 0.003 | ||
| Respiratory rate ≥ 23 breaths/min | 40% | 64.1% | 348.7 | [10. ; 11,567.9] | ** 0.001 | ||
| Oxygen saturation ≤ 95% (room air) | 46.3% | 64.1% | 244.6 | [9.2; 6,490.1] | ** 0.001 | ||
| Neutrophil-to-Lymphocyte Ratio ≥ 4 | 51.8% | 80.6% | 36.9 | [1.1; 1,258.9] | * 0.045 | ||
| Day 1 | Day 2 | Day 1 and 2 | |||||
| Following parameters | SMU Group | SToI Group | SMU Group | SToI Group | SMU Vs SToI | ||
| Neutrophil–lymphocyte Ratio ≥ 6 | 32.4% | 41.7% | 29.7% | 60% | 61.9 | [1.7; 2,192.3] | * 0.023 |
| C- Reactive protein ≥ 53 mg/L | 61.3% | 80% | 65.8% | 85.2% | 2987.5 | [10.7; 836,567.9] | ** 0.005 |
| Lactate Dehydrogenase ≥ 450 UI/L | 15.5% | 35.5% | 6.3% | 64% | 60.6 | [3.1; 1,174.4] | ** 0.007 |
| PREDICT Score (Predicting risk factors for Early Determination of ICU Transfer) | Day in Standard Medical Unit | ||
|---|---|---|---|
| 5 Criteria on admission | Day 0 | Day 1 | Day 2 |
| 1. Age < 75 years | +11 | ||
| 2. Body Mass Index ≥ 30kg/m² | +9 | ||
| 3. Respiratory Rate ≥ 23 breaths/min | +12 | ||
| 4. Oxygen saturation (SpO2) ≤ 95% (room air) | +11 | ||
| 5. Neutrophil–lymphocyte Ratio ≥ 6 | +7 | ||
| PREDICT score for high risk of ICU transfer | Score ≥ 25/50 | ||
| Take score of THE previous Day and add the 5 next criteria | Day 0 score plus | Day 1 score plus | |
| 1. Neutrophil–lymphocyte Ratio (NLR) ≥ 4 | +8 | +8 | |
| 2. C-Reactive protein (CRP) ≥ 53 mg/L | +16 | +16 | |
| 3. Lactate dehydrogenase (LDH) ≥ 450 UI/L | +8 | +8 | |
| 4. * following adjustment 1: At least one of those 3 parameters is over its cut-off | +12 | +12 | |
| 5. ** following adjustment 2: None of those 3 parameters is over its cut-off | −6 | −6 | |
| PREDICT score for high risk of ICU transfer | Score ≥ 34/94 | Score ≥ 35/138 | |
| Training Cohort | |||||
|---|---|---|---|---|---|
| NEWS | D0 | Se | 71.4% | Sp | 61.0% |
| Threshold | 5 | PPV | 54.7% | NPV | 76.4% |
| PREDICT | D0 | Se | 60.7% | Sp | 74.3% |
| Youden | 25 | PPV | 61.2% | NPV | 73.9% |
| D1 | Se | 58.8% | Sp | 65.7% | |
| Youden | 34 | PPV | 40.0% | NPV | 80.4% |
| D2 | Se | 70.7% | Sp | 54.9% | |
| Youden | 35 | PPV | 34.2% | NPV | 85.0% |
| Validation Cohort | |||||
|---|---|---|---|---|---|
| NEWS | D0 | Se | 79.1% | Sp | 62.1% |
| Threshold | 5 | PPV | 50.7% | NPV | 85.7% |
| PREDICT | D0 | Se | 54.7% | Sp | 80.5% |
| Youden | 25 | PPV | 63.0% | NPV | 74.5% |
| D1 | Se | 51.2% | Sp | 59.8% | |
| Youden | 34 | PPV | 38.6% | NPV | 71.2% |
| D2 | Se | 70.3% | Sp | 48.3% | |
| Youden | 35 | PPV | 36.6 | NPV | 79.2% |
| Training Cohort | ||||||
|---|---|---|---|---|---|---|
| Groups | PREDICT (% of Patients with at Least 1 Occurrence Positive before Switch) | NEWS (Admission) | ||||
| Day of switch to ICU | Day 0 | Day 1 | Day 2 | >Day 2 | Total | Total |
| SToI | 100.0% | 100.0% | 77.1% | 83.8% | 56.9% | |
| ICU | 77.6% | 77.6% | 95.0% | |||
| SMU | 56.0% | 35.4% | ||||
| Validation Cohort | ||||||
|---|---|---|---|---|---|---|
| Groups | PREDICT (% of Patients with at Least 1 Occurrence Positive before Switch) | NEWS (Admission) | ||||
| Day of switch to ICU | Day 0 | Day 1 | Day 2 | >Day 2 | Total | Total |
| SToI | 83.3% | 100.0% | 81.3% | 86.0% | 60.5% | |
| ICU | 50.0% | 50.0% | 80.0% | |||
| SMU | 52.9% | 37.9% | ||||
Publisher’s Note: MDPI stays neutral with regard to jurisdictional claims in published maps and institutional affiliations. |
© 2021 by the authors. Licensee MDPI, Basel, Switzerland. This article is an open access article distributed under the terms and conditions of the Creative Commons Attribution (CC BY) license (https://creativecommons.org/licenses/by/4.0/).
Share and Cite
Gette, M.; Fernandes, S.; Marlinge, M.; Duranjou, M.; Adi, W.; Dambo, M.; Simeone, P.; Michelet, P.; Bruder, N.; Guieu, R.; et al. Predict Score: A New Biological and Clinical Tool to Help Predict Risk of Intensive Care Transfer for COVID-19 Patients. Biomedicines 2021, 9, 566. https://doi.org/10.3390/biomedicines9050566
Gette M, Fernandes S, Marlinge M, Duranjou M, Adi W, Dambo M, Simeone P, Michelet P, Bruder N, Guieu R, et al. Predict Score: A New Biological and Clinical Tool to Help Predict Risk of Intensive Care Transfer for COVID-19 Patients. Biomedicines. 2021; 9(5):566. https://doi.org/10.3390/biomedicines9050566
Chicago/Turabian StyleGette, Mickael, Sara Fernandes, Marion Marlinge, Marine Duranjou, Wijayanto Adi, Maelle Dambo, Pierre Simeone, Pierre Michelet, Nicolas Bruder, Regis Guieu, and et al. 2021. "Predict Score: A New Biological and Clinical Tool to Help Predict Risk of Intensive Care Transfer for COVID-19 Patients" Biomedicines 9, no. 5: 566. https://doi.org/10.3390/biomedicines9050566
APA StyleGette, M., Fernandes, S., Marlinge, M., Duranjou, M., Adi, W., Dambo, M., Simeone, P., Michelet, P., Bruder, N., Guieu, R., & Fromonot, J. (2021). Predict Score: A New Biological and Clinical Tool to Help Predict Risk of Intensive Care Transfer for COVID-19 Patients. Biomedicines, 9(5), 566. https://doi.org/10.3390/biomedicines9050566