TCox: Correlation-Based Regularization Applied to Colorectal Cancer Survival Data


Abstract
1. Introduction
2. Materials and Methods
2.1. Datasets
2.2. Survival Analysis
2.2.1. Cox Regression
2.2.2. TCox
2.3. Model Evaluation and Comparison
2.4. Availability of Data
3. Results and Discussion
4. Conclusions
Author Contributions
Funding
Acknowledgments
Conflicts of Interest
Abbreviations
| CHAT | Cancer Hallmarks Analytics Tool |
| COAD | Colon Adenocarcinoma |
| CRC | Colorectal Cancer |
| EN | Elastic Net |
| FPKM | Fragments Per Kilobase per Million |
| GDC | Genomic Data Commons |
| READ | Rectum Adenocarcinoma |
| RNA-seq | RNA sequencing |
| TCGA | The Cancer Genome Atlas |
References
- Global Cancer Observatory. Available online: http://gco.iarc.fr/ (accessed on 1 July 2020).
- Grady, W.M.; Markowitz, S.D. The molecular pathogenesis of colorectal cancer and its potential application to colorectal cancer screening. Dig. Dis. Sci. 2015, 60, 762–772. [Google Scholar] [CrossRef] [PubMed]
- Markowitz, S.D.; Bertagnolli, M.M. Molecular basis of colorectal cancer. N. Engl. J. Med. 2009, 361, 2449–2460. [Google Scholar] [CrossRef] [PubMed]
- Yamagishi, H.; Kuroda, H.; Imai, Y.; Hiraishi, H. Molecular pathogenesis of sporadic colorectal cancers. Chin. J. Cancer 2016, 35, 4. [Google Scholar] [CrossRef]
- Molinari, C.; Marisi, G.; Passardi, A.; Matteucci, L.; De Maio, G.; Ulivi, P. Heterogeneity in Colorectal Cancer: A Challenge for Personalized Medicine? Int. J. Mol. Sci. 2018, 19, 3733. [Google Scholar] [CrossRef] [PubMed]
- Sagaert, X.; Vanstapel, A.; Verbeek, S. Tumor Heterogeneity in Colorectal Cancer: What Do We Know So Far? Pathobiology 2018, 85, 72–84. [Google Scholar] [CrossRef]
- Wang, Z.; Gerstein, M.; Snyder, M. RNA-Seq: A revolutionary tool for transcriptomics. Nat. Rev. Genet. 2009, 10, 57. [Google Scholar] [CrossRef]
- Yegnasubramanian, S.; Isaacs, W.B. Modern Molecular Biology: Approaches for Unbiased Discovery in Cancer Research; Springer Science & Business Media: New York, NY, USA, 2010. [Google Scholar]
- AZIM, F.S.; Houri, H.; Ghalavand, Z.; Nikmanesh, B. Next Generation Sequencing in Clinical Oncology: Applications, Challenges and Promises: A Review Article. Iran. J. Public Health 2018, 47, 1453. [Google Scholar]
- Lopes, M.B.; Veríssimo, A.; Carrasquinha, E.; Casimiro, S.; Beerenwinkel, N.; Vinga, S. Ensemble outlier detection and gene selection in triple-negative breast cancer data. BMC Bioinform. 2018, 19, 168. [Google Scholar] [CrossRef]
- Marx, V. The big challenges of big data. Nature 2013, 498, 255–260. [Google Scholar] [CrossRef]
- Veríssimo, A.; Carrasquinha, E.; Lopes, M.B.; Oliveira, A.L.; Sagot, M.F.; Vinga, S. Sparse network-based regularization for the analysis of patientomics high-dimensional survival data. bioRxiv 2018, 403402. [Google Scholar] [CrossRef]
- Lopes, M.B.; Casimiro, S.; Vinga, S. Twiner: Correlation-based regularization for identifying common cancer gene signatures. BMC Bioinform. 2019, 20, 356. [Google Scholar] [CrossRef] [PubMed]
- Friedman, J.; Hastie, T.; Tibshirani, R. Regularization paths for generalized linear models via coordinate descent. J. Stat. Softw. 2010, 33, 1. [Google Scholar] [CrossRef] [PubMed]
- Tibshirani, R. Regression shrinkage and selection via the Lasso. J. R. Stat. Soc. Ser. B (Methodological) 1996, 58, 267–288. [Google Scholar] [CrossRef]
- Veríssimo, A.; Oliveira, A.L.; Sagot, M.F.; Vinga, S. DegreeCox–a network-based regularization method for survival analysis. BMC Bioinform. 2016, 17, 449. [Google Scholar] [CrossRef] [PubMed]
- Zhang, W.; Ota, T.; Shridhar, V.; Chien, J.; Wu, B.; Kuang, R. Network-based survival analysis reveals subnetwork signatures for predicting outcomes of ovarian cancer treatment. PLoS Comput. Biol. 2013, 9, e1002975. [Google Scholar] [CrossRef]
- Lopes, M.B.; Vinga, S. Tracking intratumoral heterogeneity in glioblastoma via regularized classification of single-cell RNA-Seq data. BMC Bioinform. 2020, 21, 59. [Google Scholar] [CrossRef]
- Hall, M.A. Correlation-based Feature Selection for Discrete and Numeric Class Machine Learning. In Proceedings of the 17th International Conference on Machine Learning (ICML-2000), Stanford, CA, USA, 29 June–2 July 2000; pp. 359–366. [Google Scholar]
- Yu, L.; Liu, H. Feature selection for high-dimensional data: A fast correlation-based filter solution. In Proceedings of the 20th International Conference on Machine Learning (ICML-03), Washington, DC, USA, 21–24 August 2003; pp. 856–863. [Google Scholar]
- Ling, B.; Chen, L.; Liu, Q.; Yang, J. Gene expression correlation for cancer diagnosis: A pilot study. Biomed Res. Int. 2014, 2014, 253804. [Google Scholar] [CrossRef]
- Rahmatallah, Y.; Emmert-Streib, F.; Glazko, G. Gene Sets Net Correlations Analysis (GSNCA): A multivariate differential coexpression test for gene sets. Bioinformatics 2014, 30, 360–368. [Google Scholar] [CrossRef]
- Li, S.; Liu, X.; Liu, T.; Meng, X.; Yin, X.; Fang, C.; Huang, D.; Cao, Y.; Weng, H.; Zeng, X.; et al. Identification of biomarkers correlated with the TNM staging and overall survival of patients with bladder cancer. Front. Physiol. 2017, 8, 947. [Google Scholar] [CrossRef]
- Liu, R.; Zhang, W.; Liu, Z.Q.; Zhou, H.H. Associating transcriptional modules with colon cancer survival through weighted gene co-expression network analysis. BMC Genom. 2017, 18, 361. [Google Scholar] [CrossRef]
- Grossman, R.L.; Heath, A.P.; Ferretti, V.; Varmus, H.E.; Lowy, D.R.; Kibbe, W.A.; Staudt, L.M. Toward a shared vision for cancer genomic data. N. Engl. J. Med. 2016, 375, 1109–1112. [Google Scholar] [CrossRef] [PubMed]
- Samur, M.K. RTCGAToolbox: A new tool for exporting TCGA Firehose data. PLoS ONE 2014, 9, e106397. [Google Scholar] [CrossRef] [PubMed]
- Christensen, E. Multivariate survival analysis using Cox’s regression model. Hepatology 1987, 7, 1346–1358. [Google Scholar] [CrossRef] [PubMed]
- Walters, S.J. What is a Cox Model? Citeseer: Princeton, NJ, USA, 1999. [Google Scholar]
- Jager, K.J.; Van Dijk, P.C.; Zoccali, C.; Dekker, F.W. The analysis of survival data: The Kaplan–Meier method. Kidney Int. 2008, 74, 560–565. [Google Scholar] [CrossRef] [PubMed]
- Cox, D.R. Regression models and life-tables. J. R. Stat. Soc. Ser. B (Methodological) 1972, 34, 187–202. [Google Scholar] [CrossRef]
- Kleinbaum, D.G.; Klein, M. Survival Analysis: A Self-Learning Text, 3rd ed.; Statistics for Biology and Health; Springer: New York, NY, USA, 2012; 700p. [Google Scholar]
- Simon, N.; Friedman, J.; Hastie, T.; Tibshirani, R. Regularization Paths for Cox’s Proportional Hazards Model via Coordinate Descent. J. Stat. Softw. 2011, 39, 1–13. [Google Scholar] [CrossRef]
- Baker, S.; Ali, I.; Silins, I.; Pyysalo, S.; Guo, Y.; Högberg, J.; Stenius, U.; Korhonen, A. Cancer Hallmarks Analytics Tool (CHAT): A text mining approach to organize and evaluate scientific literature on cancer. Bioinformatics 2017, 33, 3973–3981. [Google Scholar] [CrossRef]
- Wickham, H.; Francois, R.; Henry, L.; Müller, K. Dplyr: A Grammar of Data Manipulation. R Package Version 0.4.3. 2015. Available online: https://CRAN.Rproject.org/package=dplyr (accessed on 1 July 2020).
- Yin, T.; Cook, D.; Lawrence, M. ggbio: An R package for extending the grammar of graphics for genomic data. Genome Biol. 2012, 13, R77. [Google Scholar] [CrossRef]
- Kassambara, A.; Kosinski, M.; Biecek, P.; Fabian, S. Survminer: Drawing Survival Curves Using ’Ggplot2’; R Package Version 0.4.8. 2020. Available online: https://CRAN.R-project.org/package=survminer (accessed on 1 July 2020).
- Robinson, M.D.; McCarthy, D.J.; Smyth, G.K. edgeR: A Bioconductor package for differential expression analysis of digital gene expression data. Bioinformatics 2010, 26, 139–140. [Google Scholar] [CrossRef]
- Therneau, T.M. A Package for Survival Analysis in R; R Package Version 3.2-7. 2020. Available online: https://CRAN.R-project.org/package=survival (accessed on 1 July 2020).
- Ternès, N.; Rotolo, F.; Michiels, S. biospear: An R package for biomarker selection in penalized Cox regression. Bioinformatics 2018, 34, 112–113. [Google Scholar] [CrossRef]
- Simon, R.M.; Subramanian, J.; Li, M.C.; Menezes, S. Using cross-validation to evaluate predictive accuracy of survival risk classifiers based on high-dimensional data. Briefings Bioinform. 2011, 12, 203–214. [Google Scholar] [CrossRef] [PubMed]
- Lei, R.; Feng, L.; Hong, D. ELFN1-AS1 accelerates the proliferation and migration of colorectal cancer via regulation of miR-4644/TRIM44 axis. Cancer Biomark. 2020, 27, 433–443. [Google Scholar] [CrossRef] [PubMed]
- Guinney, J.; Dienstmann, R.; Wang, X.; De Reyniès, A.; Schlicker, A.; Soneson, C.; Marisa, L.; Roepman, P.; Nyamundanda, G.; Angelino, P.; et al. The consensus molecular subtypes of colorectal cancer. Nat. Med. 2015, 21, 1350–1356. [Google Scholar] [CrossRef] [PubMed]


| Models | TCox | EN | HubCox | OrphanCox | ||||||||
|---|---|---|---|---|---|---|---|---|---|---|---|---|
| Runs Test set | NA | S | NS | NA | S | NS | NA | S | NS | NA | S | NS |
| # | 33 | 7 | 60 | 31 | 4 | 65 | 43 | 3 | 54 | 32 | 2 | 66 |
| Mean p-value | – | 0.0164 | 0.4985 | – | 0.0251 | 0.5354 | – | 0.0137 | 0.5168 | – | 0.0160 | 0.4997 |
| Survival Models | Selected Variables | p-Value | ||
|---|---|---|---|---|
| Train | Test | |||
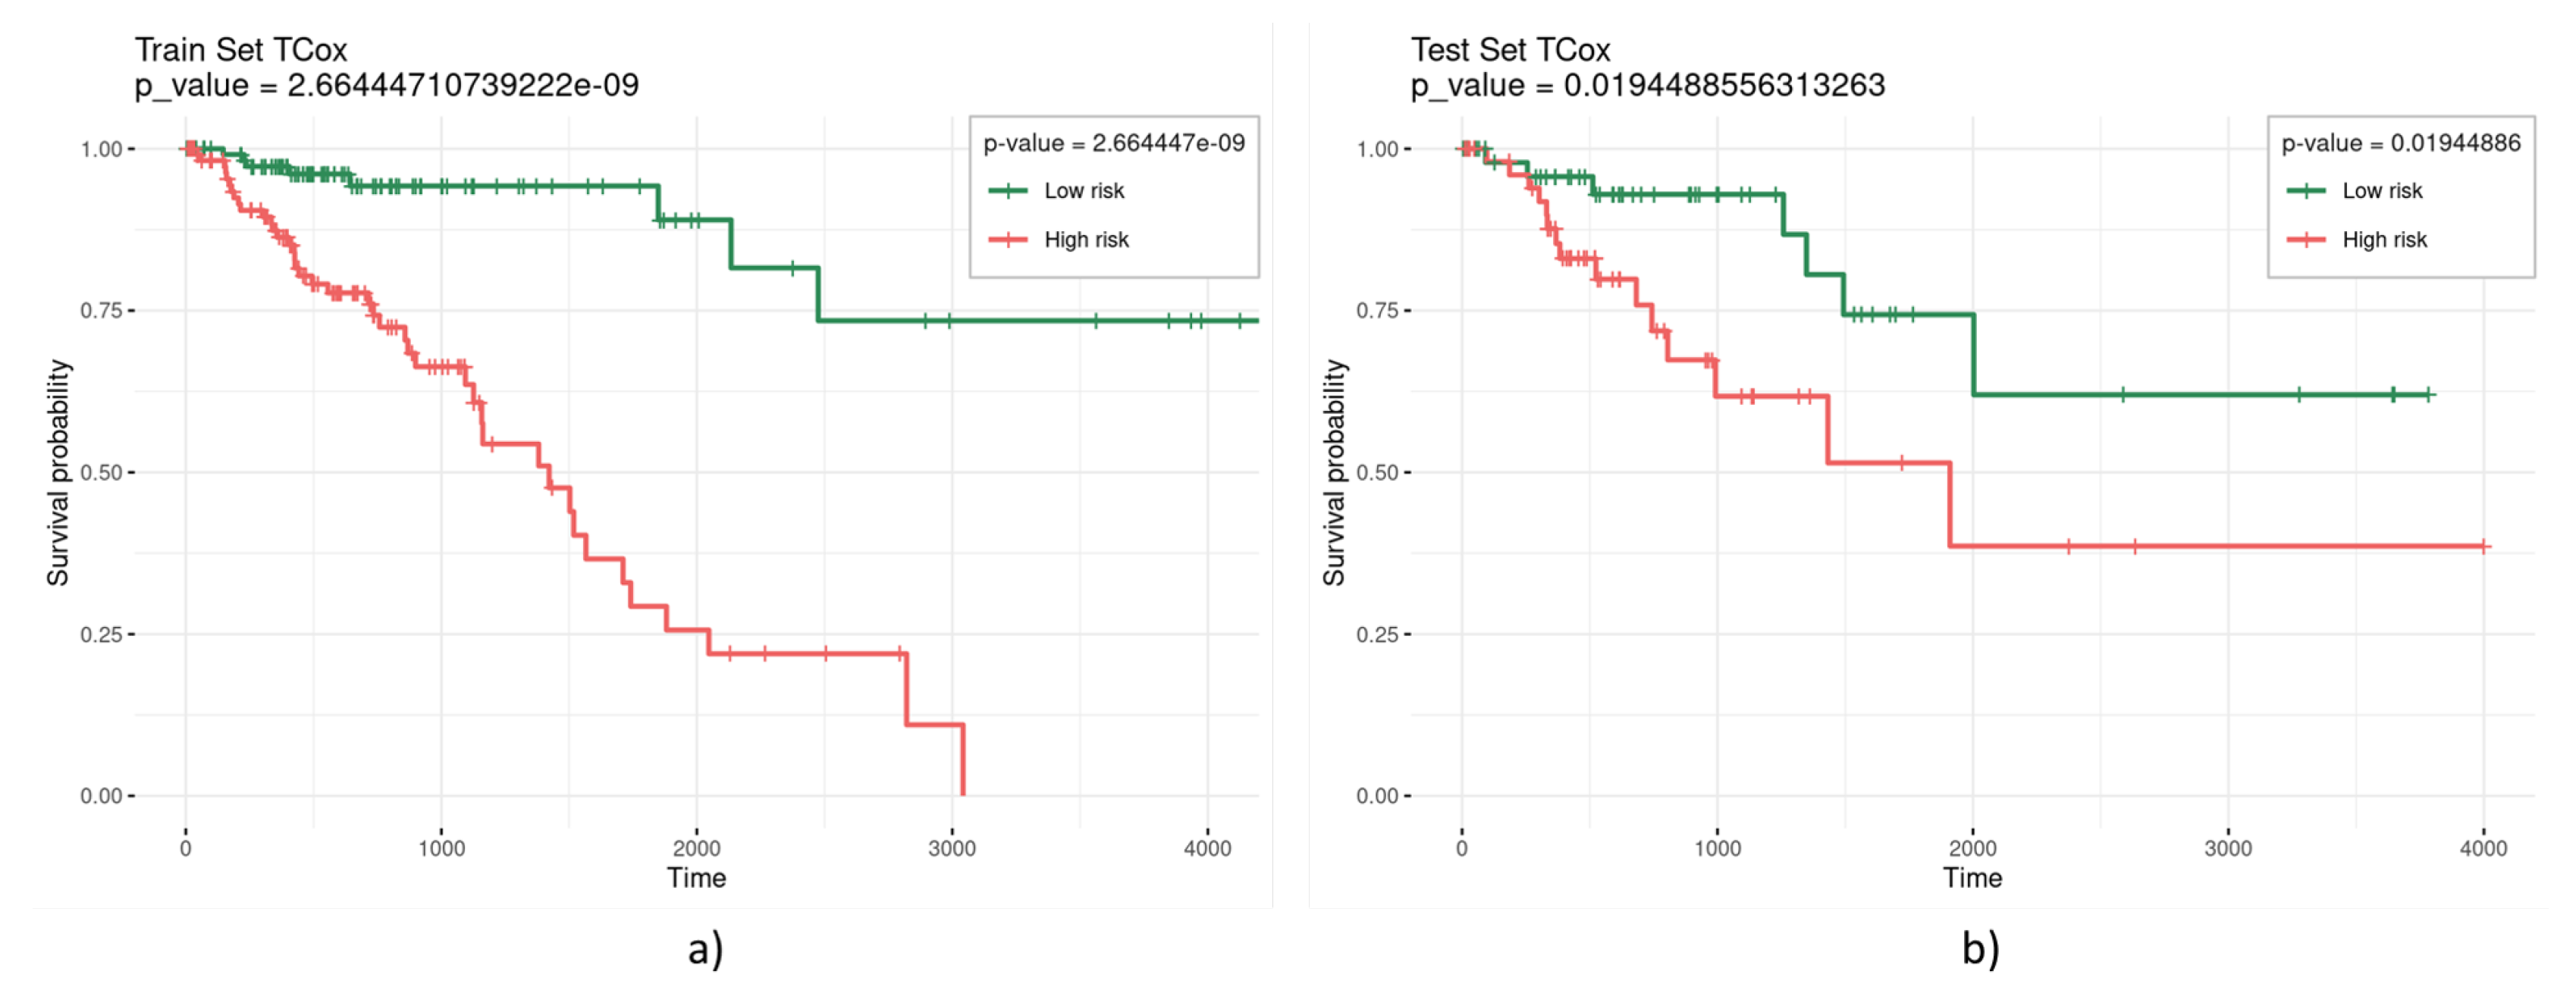
| TCox () | 0.3 | 10 | 0.002401583 | 0.0757 |
| 0.2 | 11 | 0.000588251 | 0.0665 | |
| 0.1 | 53 | 2.66444 × 10⁻⁹ | 0.0194 | |
| EN | 0.3 | 18 | 8.38703 × 10⁻⁷ | 0.0088 |
| 0.2 | 47 | 2.47428 × 10⁻⁸ | 0.0717 | |
| 0.1 | 88 | 5.28787 × 10⁻⁹ | 0.0492 | |
| HubCox | 0.3 | 26 | 1.78804 × 10⁻⁸ | 0.0138 |
| 0.2 | 47 | 1.18224 × 10⁻⁸ | 0.0129 | |
| 0.1 | 90 | 2.74104 × 10⁻⁹ | 0.0418 | |
| OrphanCox | 0.3 | 8 | 2.48965 × 10⁻⁵ | 0.1519 |
| 0.2 | 44 | 1.20494 × 10⁻⁷ | 0.0327 | |
| 0.1 | 67 | 6.80248 × 10⁻⁹ | 0.0632 | |
| Runs | TCox | EN | HubCox | OrphanCox | |
|---|---|---|---|---|---|
| 75% | # | 3 | 2 | 2 | 1 |
| genes | GABRD, NKAIN4, ZIC3 | ELFN1, LOC646498 | ELFN1, LOC646498 | LOC646498 | |
| 50% | # | 16 | 16 | 16 | 1 |
| genes | ASB10, ASPHD1, CST2, CT45A3, CYP19A1, DAD1L, ELFN1, FOXS1, GABRD, GH2, HIST1H2BG, HIST1H4H, NKAIN4, RHOXF2B, ZIC3, ZNF676 | CLEC18C, EEPD1, ELFN1, HIST2H2BA, HIST2H2BE, KCNMB3, LOC100270710, LOC220930, LOC646498, NELF, ONECUT1, PRRX2, PRSSL1, RFPL4B, SIX2, TAS2R20 | EEPD1, ELFN1, HIST1H2AE, HIST2H2BA, HIST2H2BE, KCNMB3, LOC100270710, LOC220930, LOC338758, LOC646498, NELF, ONECUT1, PRRX2, PRSSL1, TAS2R20, ZNF676 | LOC646498 | |
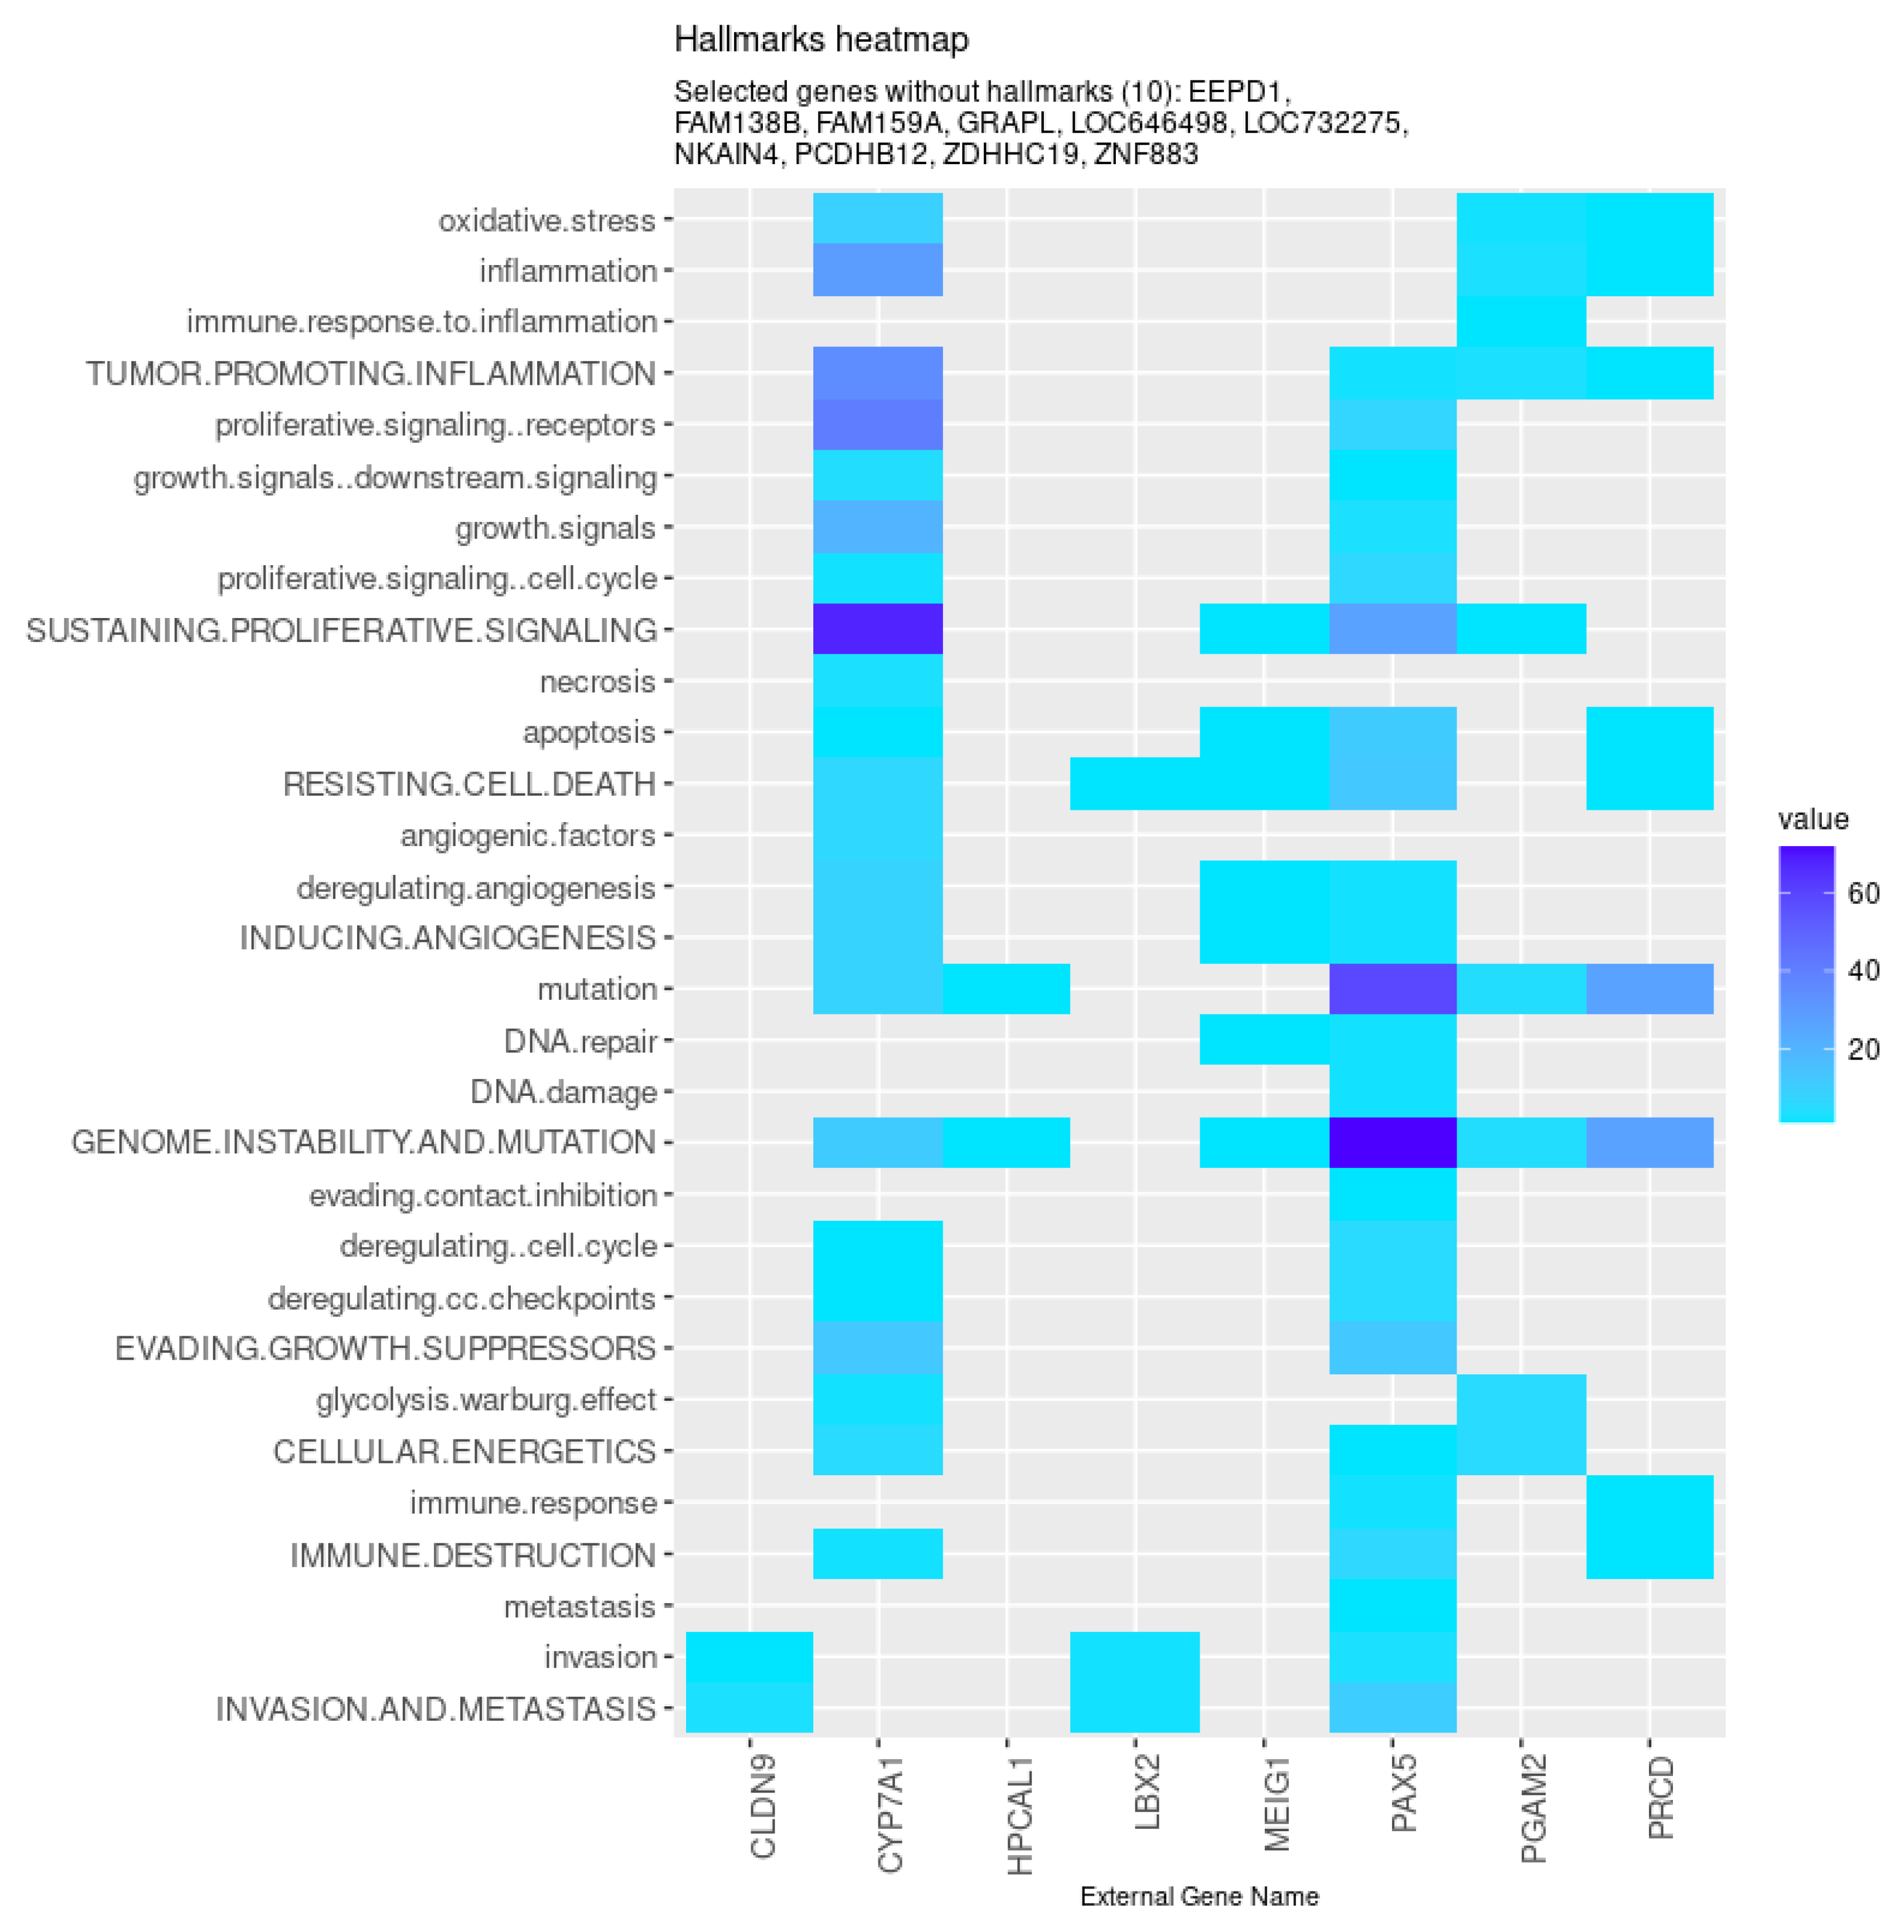
| All models | CYP7A1 (↓), FAM159A (↓), ZNF883, CLDN9 (↑), LBX2 (↑), MEIG1, PAX5 (↓), |
| NKAIN4 (↓), ZDHHC19 (↓), GRAPL, PCDHB12 (↓), EEPD1 (↑), HPCAL1, | |
| PGAM2 (↓), LOC732275, FAM138B (↓), LOC646498, PRCD (↓) | |
| EN | HOTAIR (↑), GJA3 (↑), LOC283663 (↓), DNAI2 (↓), NELF (↑), GUCA1B |
| HubCox | CYGB (↓), UNC13B, LIPT2 (↑), RFT1 (↑), BEND4 (↓), FAM24B (↑), SLFN11, RASGRP2 (↓) |
| TCox | ANKRD26P1 (↑), CARKD, IGLON5, OSTN (↓), RAB20, TXNL4B (↑), AOX2P, |
| DCLK3 (↑), FCRL2 (↓), SEPT7P2 (↑), ASPHD1 (↑), COL19A1 (↓), DCP1A, | |
| FLJ16779 (↑), LOC100303728 (↓), PCDHA7, SNTG1, COX4I2, NXF2B (↑), | |
| TAC3 (↓), C20orf106, LOC285780 (↓), OR2T5, TERF2IP, CAPN7, OSBPL3 (↑), TRIM67 (↓) |
Publisher’s Note: MDPI stays neutral with regard to jurisdictional claims in published maps and institutional affiliations. |
© 2020 by the authors. Licensee MDPI, Basel, Switzerland. This article is an open access article distributed under the terms and conditions of the Creative Commons Attribution (CC BY) license (http://creativecommons.org/licenses/by/4.0/).
Share and Cite
Peixoto, C.; Lopes, M.B.; Martins, M.; Costa, L.; Vinga, S. TCox: Correlation-Based Regularization Applied to Colorectal Cancer Survival Data. Biomedicines 2020, 8, 488. https://doi.org/10.3390/biomedicines8110488
Peixoto C, Lopes MB, Martins M, Costa L, Vinga S. TCox: Correlation-Based Regularization Applied to Colorectal Cancer Survival Data. Biomedicines. 2020; 8(11):488. https://doi.org/10.3390/biomedicines8110488
Chicago/Turabian StylePeixoto, Carolina, Marta B. Lopes, Marta Martins, Luís Costa, and Susana Vinga. 2020. "TCox: Correlation-Based Regularization Applied to Colorectal Cancer Survival Data" Biomedicines 8, no. 11: 488. https://doi.org/10.3390/biomedicines8110488
APA StylePeixoto, C., Lopes, M. B., Martins, M., Costa, L., & Vinga, S. (2020). TCox: Correlation-Based Regularization Applied to Colorectal Cancer Survival Data. Biomedicines, 8(11), 488. https://doi.org/10.3390/biomedicines8110488