Genetic Association and Altered Gene Expression of CYBB in Multiple Sclerosis Patients

 ,
, 
Abstract
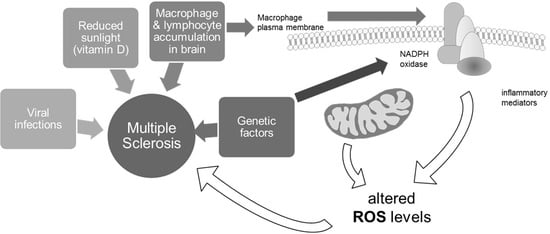
1. Introduction
2. Results
2.1. NCF1 and CYBB Are Associated with MS in the Finnish Population
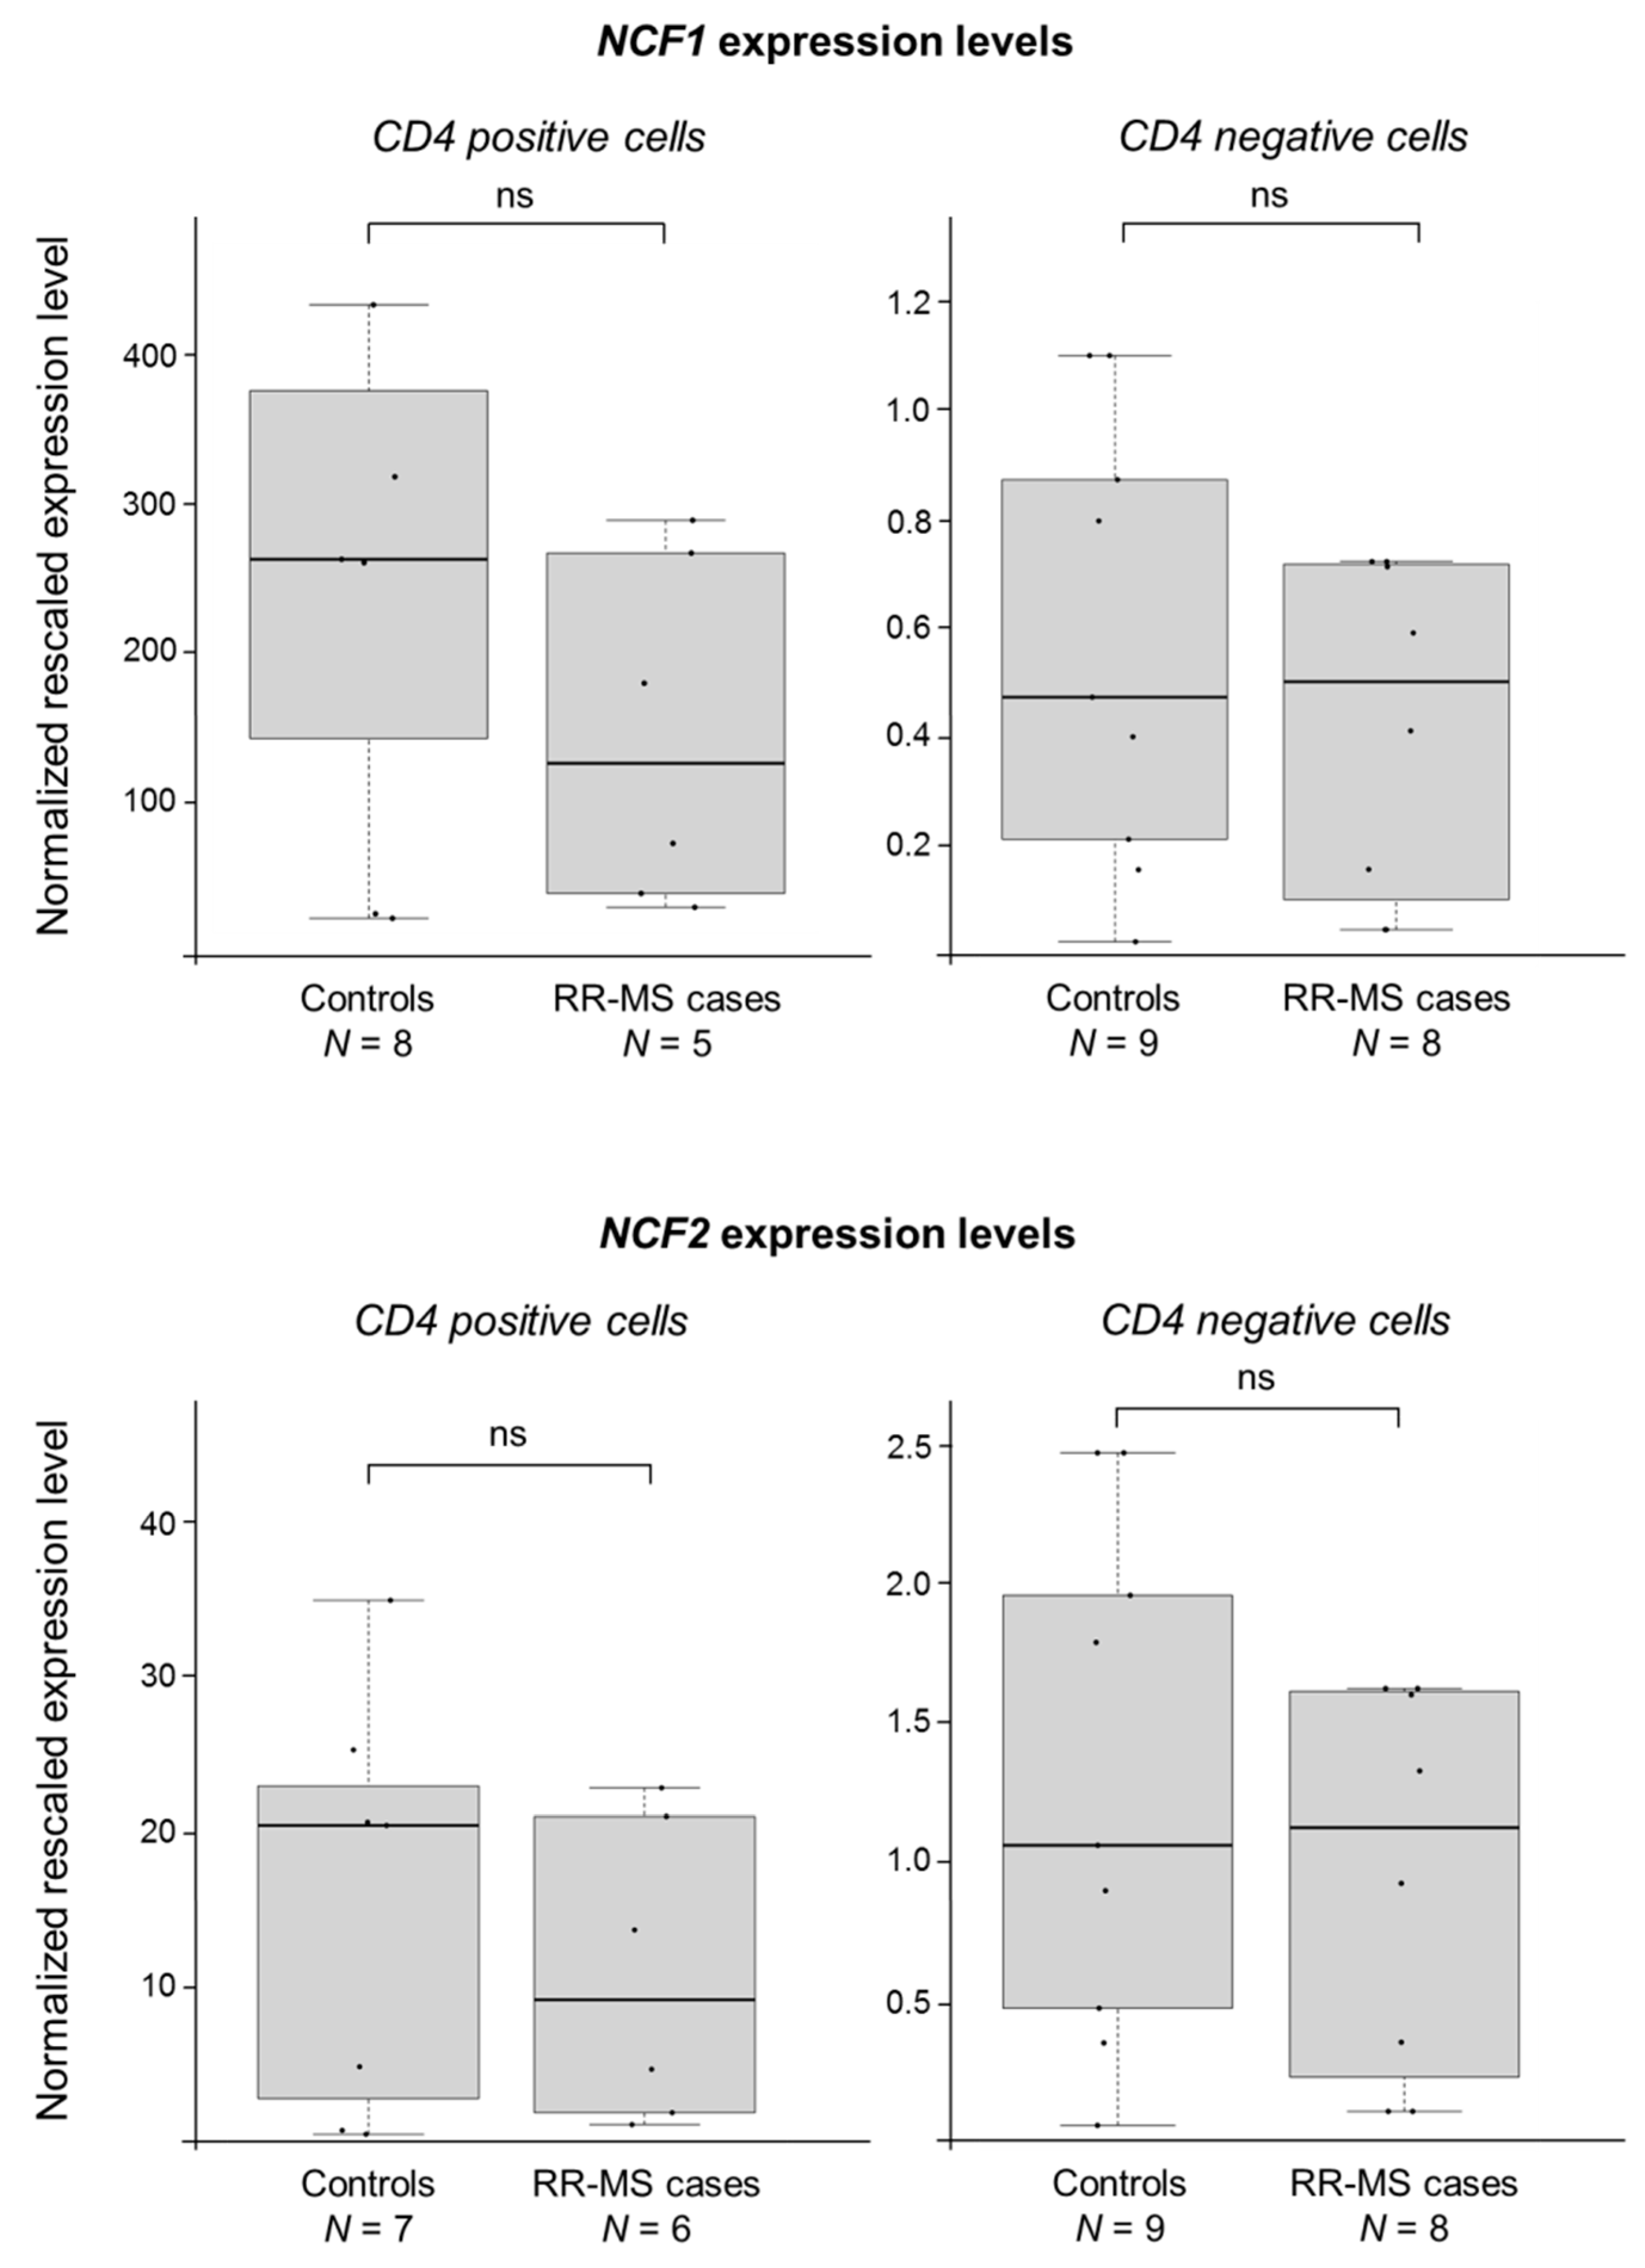
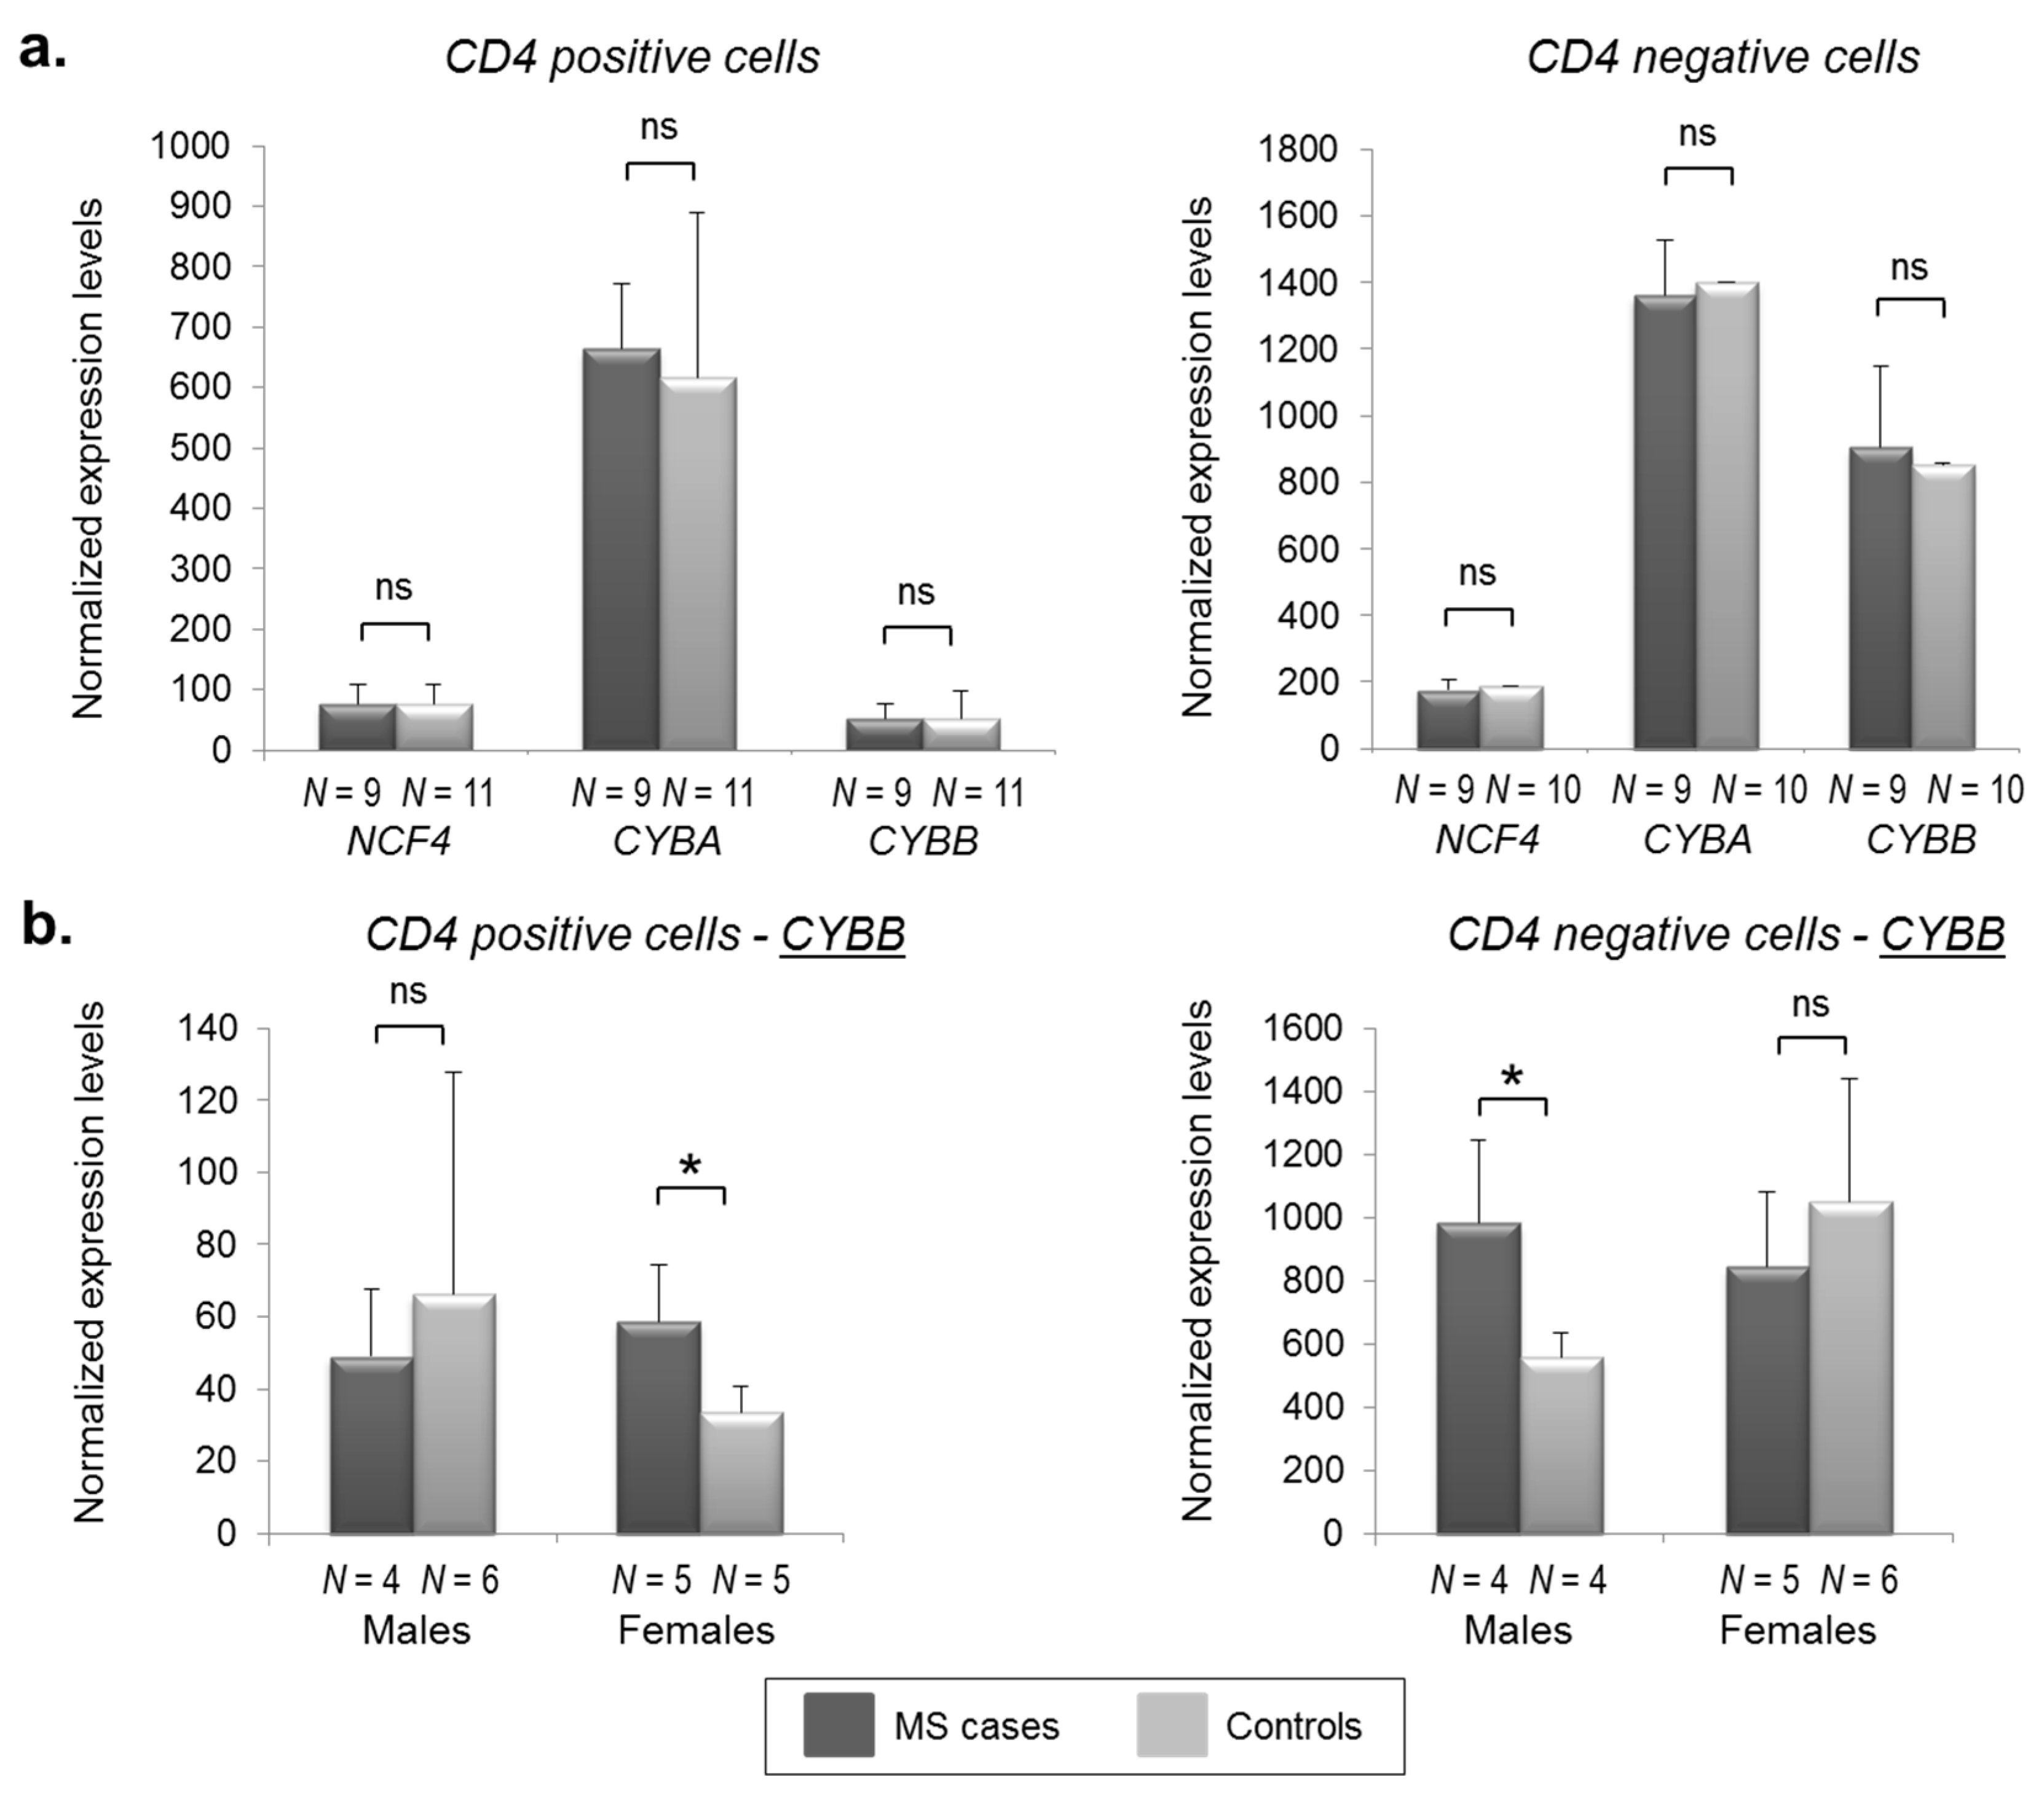
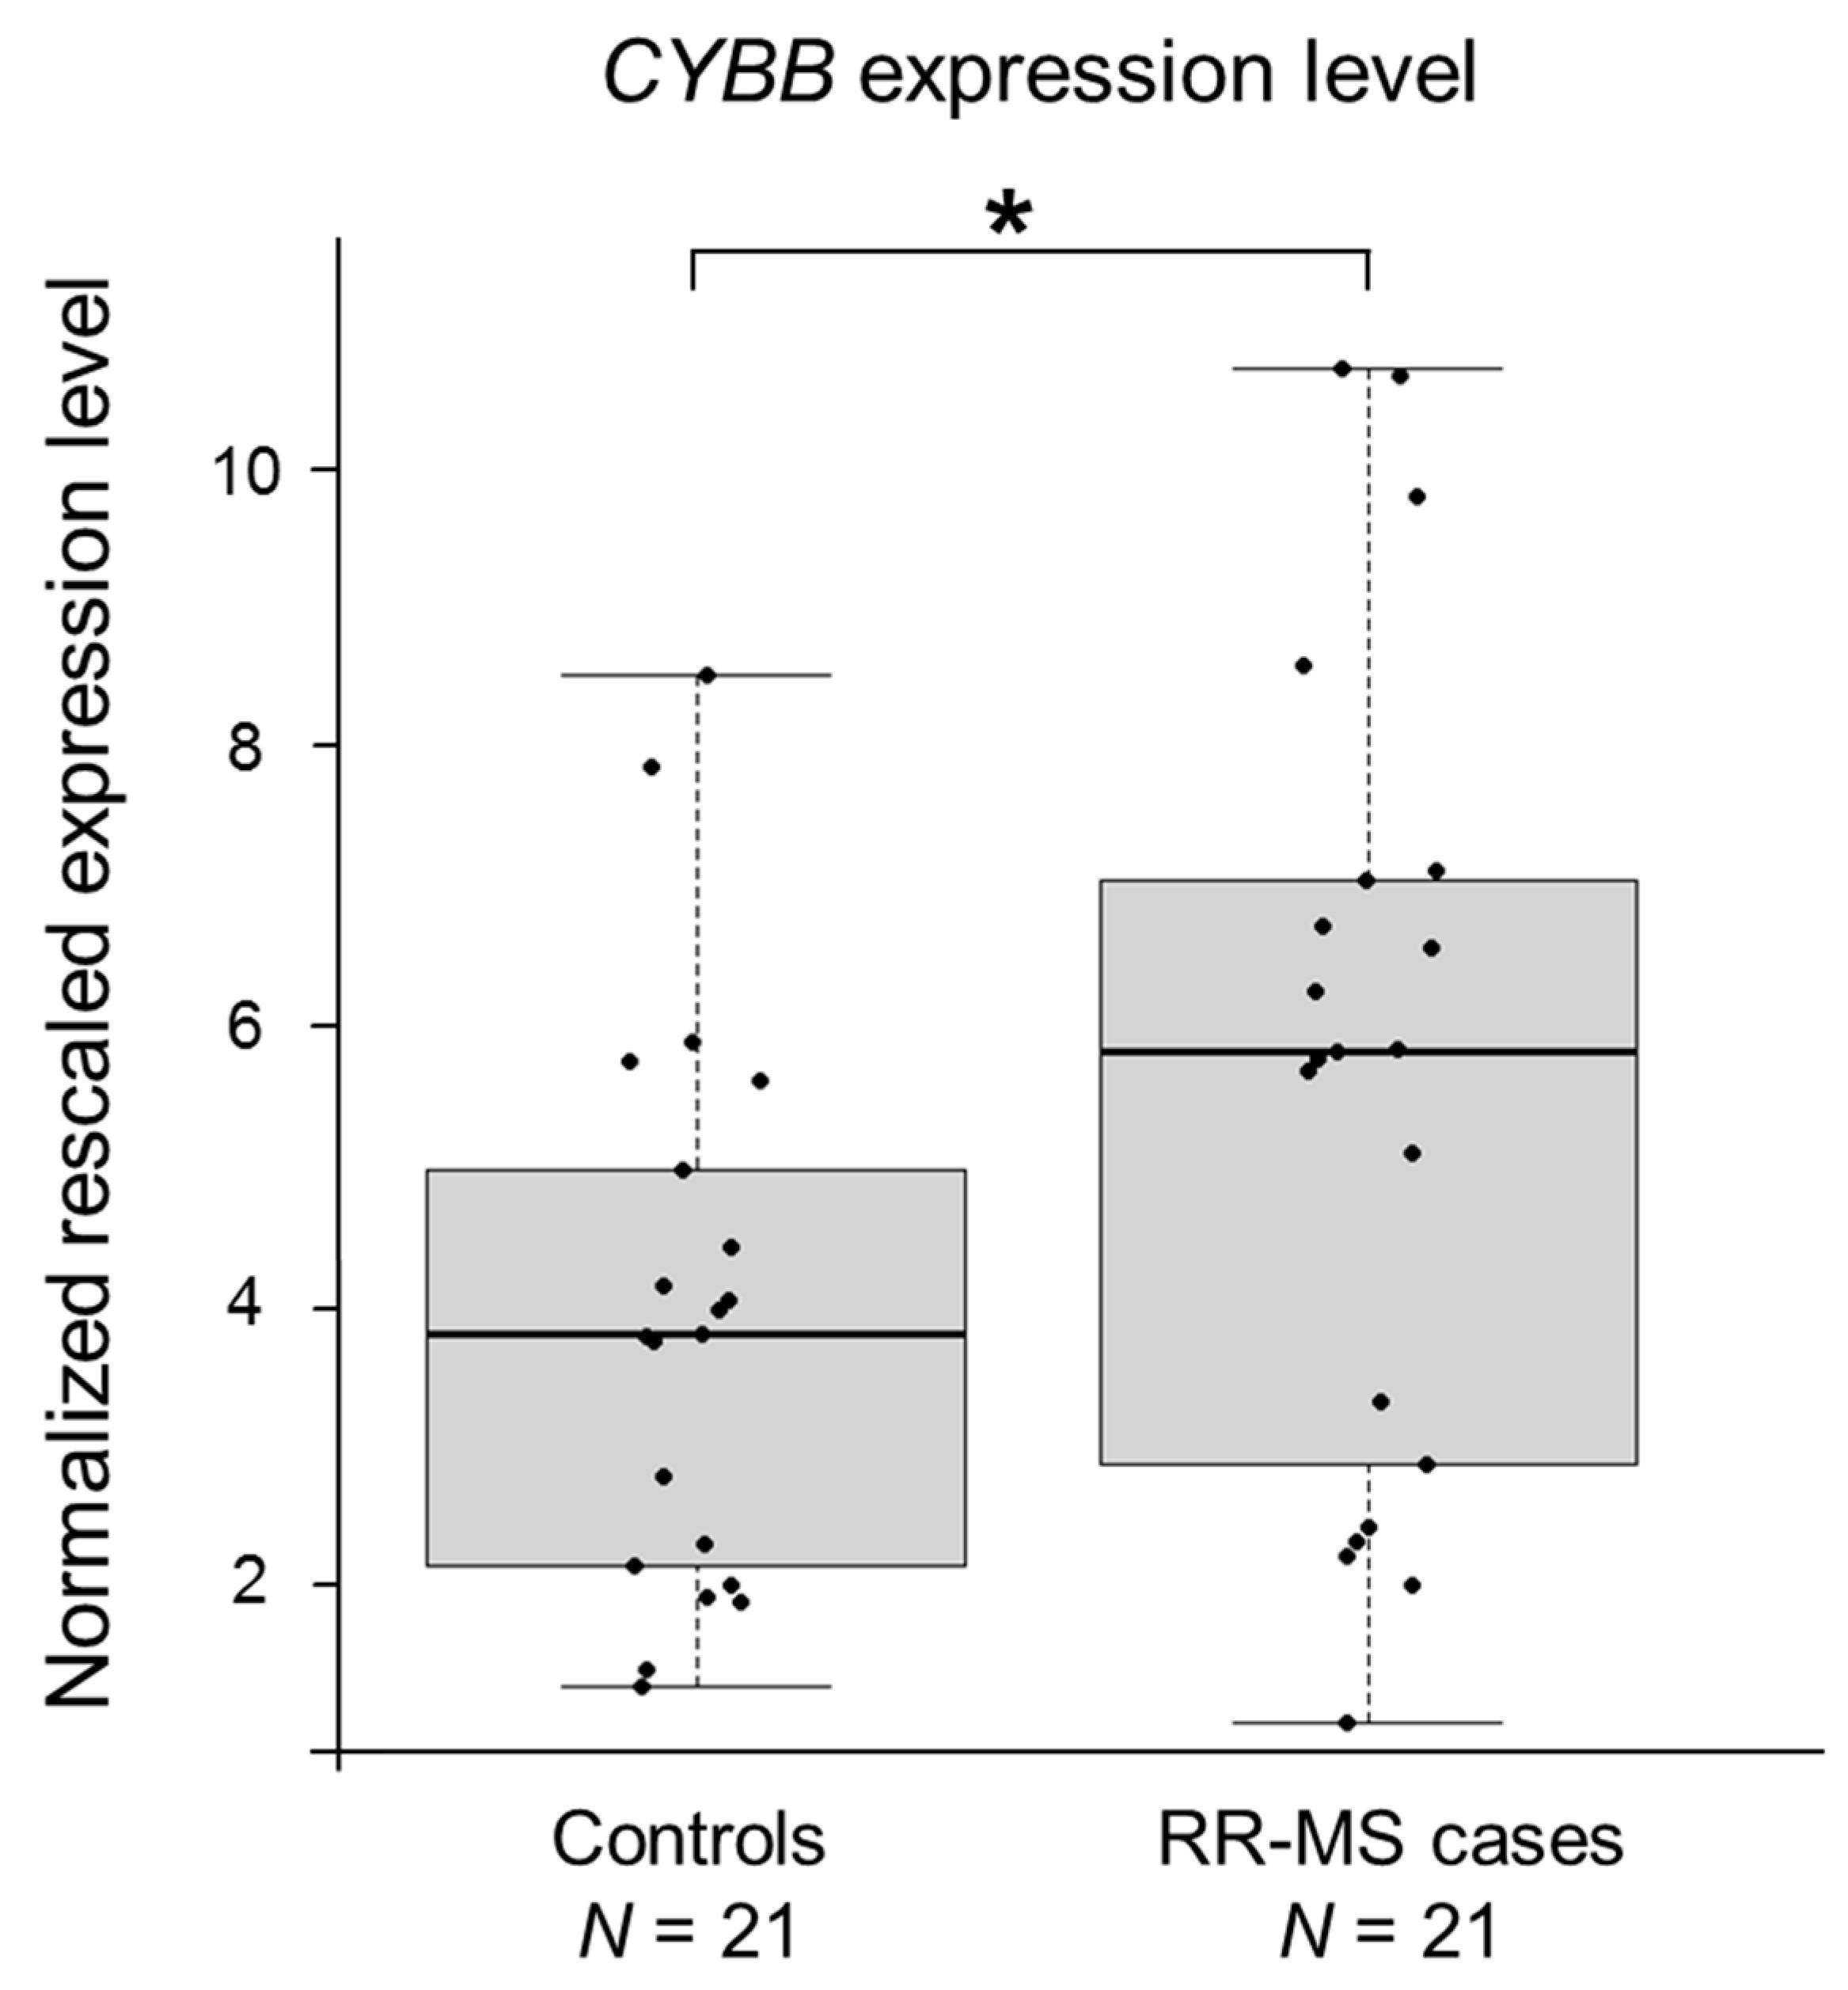
2.2. CYBB Is Differentially Expressed in MS Cases
3. Discussion
4. Materials and Methods
4.1. Materials
4.2. MS Pedigrees
4.3. Genotyping
4.4. Statistical Analyses
4.5. RNA Samples
4.6. Sample Preparation, Microarray Processing, and Data Analysis
4.7. Semi-Quantitative Real-Time RT-PCRs
Supplementary Materials
Author Contributions
Funding
Acknowledgments
Conflicts of Interest
Abbreviations
| ACTB | β-actin |
| CD4+ | Cluster of differentiation 4 positive |
| CD4− | Cluster of differentiation 4 negative |
| CGD | Chronic granulomatous disease |
| CI | Confidence interval |
| CNS | Central nervous system |
| CYBA | Cytochrome B-245 alpha chain, coding for the p22phox subunit of the NOX2 system |
| CYBB | Cytochrome B-245 beta chain, coding for the gp91phox subunit of the NOX2 system |
| GC-RMA | GC Robust Multi-array Average |
| GWAS | Genome-wide association study |
| HLA | Human leukocyte antigen |
| HMBS | Hydroxymethylbilane synthase gene |
| HRR | Haplotype relative risk |
| HWE | Hardy-Weinberg equilibrium |
| MMLV | Moloney Murine Leukemia Virus |
| MS | Multiple sclerosis |
| NADPH | nicotinamide adenine dinucleotide phosphate |
| NCF1 | Neutrophil cytosolic factor 1, coding for the p47phox subunit of the NOX2 system |
| NCF2 | Neutrophil cytosolic factor 2, coding for the p67phox subunit of the NOX2 system |
| NCF4 | Neutrophil cytosolic factor 4, coding for the p40phox subunit of the NOX2 system |
| NOX | NADPH oxidase system |
| NOX2 | NADPH oxidase system 2 (isoform 2 of the complex) |
| OMIM | Online Mendelian Inheritance in Men |
| OR | Odds ratio |
| OS | Oxidative stress |
| PBMCs | Peripheral blood mononuclear cells |
| RA | Rheumatoid arthritis |
| ROS | Reactive oxygen species |
| RR | Relapsing-remitting |
| RT-PCR | Reverse-transcription polymerase chain reactions |
| SD | Standard deviation |
| SLE | Systemic lupus erythematosus |
| SNP | Single nucleotide polymorphism |
| TDT | Transmission/disequilibrium test |
References
- Trapp, B.D.; Peterson, J.; Ransohoff, R.M.; Rudick, R.; Mörk, S.; Bö, L. Axonal transection in the lesions of multiple sclerosis. N. Engl. J. Med. 1998, 338, 278–285. [Google Scholar] [CrossRef] [PubMed]
- Hauser, S.L.; Oksenberg, J.R. The neurobiology of multiple sclerosis: Genes, inflammation, and neurodegeneration. Neuron 2006, 52, 61–76. [Google Scholar] [CrossRef] [PubMed]
- Thompson, A.J. Multiple sclerosis—A global disorder and still poorly managed. Lancet Neurol. 2008, 7, 1078–1079. [Google Scholar] [CrossRef]
- Kingwell, E.; Marriott, J.J.; Jetté, N.; Pringsheim, T.; Makhani, N.; Morrow, S.A.; Fisk, J.D.; Evans, C.; Béland, S.G.; Kulaga, S.; et al. Incidence and prevalence of multiple sclerosis in Europe: A systematic review. BMC Neurol. 2013, 13, 128. [Google Scholar] [CrossRef] [PubMed]
- Sumelahti, M.L.; Tienari, P.J.; Wikström, J.; Palo, J.; Hakama, M. Regional and temporal variation in the incidence of multiple sclerosis in Finland 1979–1993. Neuroepidemiology 2000, 19, 67–75. [Google Scholar] [CrossRef] [PubMed]
- International Multiple Sclerosis Genetics Consortium; Hafler, D.A.; Compston, A.; Sawcer, S.; Lander, E.S.; Daly, M.J.; De Jager, P.L.; de Bakker, P.I.; Gabriel, S.B.; Mirel, D.B.; et al. Risk alleles for multiple sclerosis identified by a genomewide study. N. Engl. J. Med. 2007, 357, 851–862. [Google Scholar] [CrossRef] [PubMed]
- Sawcer, S.; Hellenthal, G.; Pirinen, M.; Spencer, C.C.; Patsopoulos, N.A.; Moutsianas, L.; Dilthey, A.; Su, Z.; Freeman, C.; Hunt, S.E.; et al. Genetic risk and a primary role for cell-mediated immune mechanisms in multiple sclerosis. Nature 2011, 476, 214–219. [Google Scholar] [CrossRef] [PubMed]
- International Multiple Sclerosis Genetics Consortium (IMSGC); Beecham, A.H.; Patsopoulos, N.A.; Xifara, D.K.; Davis, M.F.; Kemppinen, A.; Cotsapas, C.; Shah, T.S.; Spencer, C.; Booth, D.; et al. Analysis of immune-related loci identifies 48 new susceptibility variants for multiple sclerosis. Nat. Genet. 2013, 45, 1353–1360. [Google Scholar] [CrossRef] [PubMed]
- Bos, S.D.; Berge, T.; Celius, E.G.; Harbo, H.F. From genetic associations to functional studies in multiple sclerosis. Eur. J. Neurol. 2016, 23, 847–853. [Google Scholar] [CrossRef] [PubMed]
- Patsopoulos, N.; Baranzini, S.E.; Santaniello, A.; Shoostari, P.; Cotsapas, C.; Wong, G.; Beecham, A.H.; James, T.; Replogle, J.; Vlachos, I.; et al. The Multiple Sclerosis Genomic Map: Role of peripheral immune cells and resident microglia in susceptibility. bioRxiv 2017. [Google Scholar] [CrossRef]
- Linker, R.A.; Kieseier, B.C.; Gold, R. Identification and development of new therapeutics for multiple sclerosis. Trends Pharm. Sci. 2008, 29, 558–565. [Google Scholar] [CrossRef] [PubMed]
- Broux, B.; Stinissen, P.; Hellings, N. Which immune cells matter? The immunopathogenesis of multiple sclerosis. Crit. Rev. Immunol. 2013, 33, 283–306. [Google Scholar] [CrossRef] [PubMed]
- Salou, M.; Nicol, B.; Garcia, A.; Laplaud, D.A. Involvement of CD8(+) T Cells in Multiple Sclerosis. Front. Immunol. 2015, 6, 604. [Google Scholar] [CrossRef] [PubMed]
- Jones, A.P.; Kermode, A.G.; Lucas, R.M.; Carroll, W.M.; Nolan, D.; Hart, P.H. Circulating immune cells in multiple sclerosis. Clin. Exp. Immunol. 2017, 187, 193–203. [Google Scholar] [CrossRef] [PubMed]
- Gilgun-Sherki, Y.; Melamed, E.; Offen, D. The role of oxidative stress in the pathogenesis of multiple sclerosis: The need for effective antioxidant therapy. J. Neurol. 2004, 251, 261–268. [Google Scholar] [CrossRef] [PubMed]
- Fischer, M.T.; Sharma, R.; Lim, J.L.; Haider, L.; Frischer, J.M.; Drexhage, J.; Mahad, D.; Bradl, M.; van Horssen, J.; Lassmann, H. NADPH oxidase expression in active multiple sclerosis lesions in relation to oxidative tissue damage and mitochondrial injury. Brain 2012, 135, 886–899. [Google Scholar] [CrossRef] [PubMed]
- Adamczyk, B.; Adamczyk-Sowa, M. New Insights into the Role of Oxidative Stress Mechanisms in the Pathophysiology and Treatment of Multiple Sclerosis. Oxidative Med. Cell. Longev. 2016, 2016, 1973834. [Google Scholar] [CrossRef] [PubMed]
- Van der Goes, A.; Brouwer, J.; Hoekstra, K.; Roos, D.; van den Berg, T.K.; Dijkstra, C.D. Reactive oxygen species are required for the phagocytosis of myelin by macrophages. J. Neuroimmunol. 1998, 92, 67–75. [Google Scholar] [CrossRef]
- Nikić, I.; Merkler, D.; Sorbara, C.; Brinkoetter, M.; Kreutzfeldt, M.; Bareyre, F.M.; Brück, W.; Bishop, D.; Misgeld, T.; Kerschensteiner, M. A reversible form of axon damage in experimental autoimmune encephalomyelitis and multiple sclerosis. Nat. Med. 2011, 17, 495–499. [Google Scholar] [CrossRef] [PubMed]
- Friese, M.A.; Schattling, B.; Fugger, L. Mechanisms of neurodegeneration and axonal dysfunction in multiple sclerosis. Nat. Rev. Neurol. 2014, 10, 225–238. [Google Scholar] [CrossRef] [PubMed]
- Barnes, P.J.; Karin, M. Nuclear factor-kappaB: A pivotal transcription factor in chronic inflammatory diseases. N. Engl. J. Med. 1997, 336, 1066–1071. [Google Scholar] [CrossRef] [PubMed]
- Srinivasan, M.; Lahiri, D.K. Significance of NF-κB as a pivotal therapeutic target in the neurodegenerative pathologies of Alzheimer’s disease and multiple sclerosis. Expert Opin. Ther. Targets 2015, 19, 471–487. [Google Scholar] [CrossRef] [PubMed]
- Romanic, A.M.; Madri, J.A. Extracellular matrix-degrading proteinases in the nervous system. Brain Pathol. 1994, 4, 145–156. [Google Scholar] [CrossRef] [PubMed]
- Merrill, J.E.; Murphy, S.P. Inflammatory events at the blood brain barrier: Regulation of adhesion molecules, cytokines, and chemokines by reactive nitrogen and oxygen species. Brain Behav. Immun. 1997, 11, 245–263. [Google Scholar] [CrossRef] [PubMed]
- Chiurchiù, V.; Orlacchio, A.; Maccarrone, M. Is Modulation of Oxidative Stress an Answer? The State of the Art of Redox Therapeutic Actions in Neurodegenerative Diseases. Oxidative Med. Cell. Longev. 2016, 2016, 7909380. [Google Scholar] [CrossRef] [PubMed]
- Vladimirova, O.; Lu, F.M.; Shawver, L.; Kalman, B. The activation of protein kinase C induces higher production of reactive oxygen species by mononuclear cells in patients with multiple sclerosis than in controls. Inflamm. Res. 1999, 48, 412–416. [Google Scholar] [CrossRef] [PubMed]
- Lu, F.; Selak, M.; O’Connor, J.; Croul, S.; Lorenzana, C.; Butunoi, C.; Kalman, B. Oxidative damage to mitochondrial DNA and activity of mitochondrial enzymes in chronic active lesions of multiple sclerosis. J. Neurol. Sci. 2000, 177, 95–103. [Google Scholar] [CrossRef]
- Van Horssen, J.; Witte, M.E.; Schreibelt, G.; de Vries, H.E. Radical changes in multiple sclerosis pathogenesis. Biochim. Biophys. Acta 2011, 1812, 141–150. [Google Scholar] [CrossRef] [PubMed]
- Babior, B.M. NADPH Oxidase: An update. Blood 1999, 93, 1464–1476. [Google Scholar] [PubMed]
- Vignais, P.V. The superoxide-generating NADPH oxidase: Structural aspects and activation mechanism. Cell. Mol. Life Sci. 2002, 59, 1428–1459. [Google Scholar] [CrossRef] [PubMed]
- Trapp, B.D.; Nave, K.A. Multiple sclerosis: An immune or neurodegenerative disorder? Annu. Rev. Neurosci. 2008, 31, 247–269. [Google Scholar] [CrossRef] [PubMed]
- Kleiveland, C.R. Peripheral Blood Mononuclear Cells. In The Impact of Food Bioactives on Health; Verhoeckx, K., Cotter, P., López-Expósito, I., Kleiveland, C., Lea, T., Mackie, A., Requena, T., Swiateck, D., Wicher, H., Eds.; Springer: Cham, Switzerland, 2015. [Google Scholar] [CrossRef]
- Wu, J.; Wang, W.F.; Zhang, Y.D.; Chen, T.X. Clinical Features and Genetic Analysis of 48 Patients with Chronic Granulomatous Disease in a Single Center Study from Shanghai, China (2005–2015): New Studies and a Literature Review. J. Immunol. Res. 2017, 2017, 8745254. [Google Scholar] [CrossRef] [PubMed]
- Zhao, J.; Ma, J.; Deng, Y.; Kelly, J.A.; Kim, K.; Bang, S.Y.; Lee, H.S.; Li, Q.Z.; Wakeland, E.K.; Qiu, R.; et al. A missense variant in NCF1 is associated with susceptibility to multiple autoimmune diseases. Nat. Genet. 2017, 49, 433–437. [Google Scholar] [CrossRef] [PubMed]
- Armstrong, D.L.; Eisenstein, M.; Zidovetzki, R.; Jacob, C.O. Systemic lupus erythematosus-associated neutrophil cytosolic factor 2 mutation affects the structure of NADPH oxidase complex. J. Biol. Chem. 2015, 290, 12595–12602. [Google Scholar] [CrossRef] [PubMed]
- Olsson, L.M.; Lindqvist, A.K.; Källberg, H.; Padyukov, L.; Burkhardt, H.; Alfredsson, L.; Klareskog, L.; Holmdahl, R. A case-control study of rheumatoid arthritis identifies an associated single nucleotide polymorphism in the NCF4 gene, supporting a role for the NADPH-oxidase complex in autoimmunity. Arthritis Res. Ther. 2007, 9, R98. [Google Scholar] [CrossRef] [PubMed]
- Rioux, J.D.; Xavier, R.J.; Taylor, K.D.; Silverberg, M.S.; Goyette, P.; Huett, A.; Green, T.; Kuballa, P.; Barmada, M.M.; Datta, L.W.; et al. Genome-wide association study identifies new susceptibility loci for Crohn disease and implicates autophagy in disease pathogenesis. Nat. Genet. 2007, 39, 596–604. [Google Scholar] [CrossRef] [PubMed]
- Amberger, J.; Bocchini, C.A.; Scott, A.F.; Hamosh, A. McKusick’s Online Mendelian Inheritance in Man (OMIM). Nucleic Acids Res. 2009, 37, D793–D796. [Google Scholar] [CrossRef] [PubMed]
- MacArthur, J.; Bowler, E.; Cerezo, M.; Gil, L.; Hall, P.; Hastings, E.; Junkins, H.; McMahon, A.; Milano, A.; Morales, J.; et al. The new NHGRI-EBI Catalog of published genome-wide association studies (GWAS Catalog). Nucleic Acids Res. 2017, 45, D896–D901. [Google Scholar] [CrossRef] [PubMed]
- Wise, A.L.; Gyi, L.; Manolio, T.A. eXclusion: Toward integrating the X chromosome in genome-wide association analyses. Am. J. Hum. Genet. 2013, 92, 643–647. [Google Scholar] [CrossRef] [PubMed]
- Gershoni, M.; Pietrokovski, S. The landscape of sex-differential transcriptome and its consequent selection in human adults. BMC Biol. 2017, 15, 7. [Google Scholar] [CrossRef] [PubMed]
- Mateen, S.; Moin, S.; Khan, A.Q.; Zafar, A.; Fatima, N. Increased Reactive Oxygen Species Formation and Oxidative Stress in Rheumatoid Arthritis. PLoS ONE 2016, 11, e0152925. [Google Scholar] [CrossRef] [PubMed]
- Kondo, Y.; Yokosawa, M.; Kaneko, S.; Furuyama, K.; Segawa, S.; Tsuboi, H.; Matsumoto, I.; Sumida, T. Review: Transcriptional Regulation of CD4+ T Cell Differentiation in Experimentally Induced Arthritis and Rheumatoid Arthritis. Arthritis Rheumatol. 2018, 70, 653–661. [Google Scholar] [CrossRef] [PubMed]
- Olsson, L.M.; Nerstedt, A.; Lindqvist, A.K.; Johansson, S.C.; Medstrand, P.; Olofsson, P.; Holmdahl, R. Copy number variation of the gene NCF1 is associated with rheumatoid arthritis. Antioxid Redox Signal 2012, 16, 71–78. [Google Scholar] [CrossRef] [PubMed]
- Olofsson, P.; Holmberg, J.; Tordsson, J.; Lu, S.; Akerström, B.; Holmdahl, R. Positional identification of Ncf1 as a gene that regulates arthritis severity in rats. Nat. Genet. 2003, 33, 25–32. [Google Scholar] [CrossRef] [PubMed]
- Hultqvist, M.; Olofsson, P.; Holmberg, J.; Bäckström, B.T.; Tordsson, J.; Holmdahl, R. Enhanced autoimmunity, arthritis, and encephalomyelitis in mice with a reduced oxidative burst due to a mutation in the Ncf1 gene. Proc. Natl. Acad. Sci. USA 2004, 101, 12646–12651. [Google Scholar] [CrossRef] [PubMed]
- Kienhöfer, D.; Boeltz, S.; Hoffmann, M.H. Reactive oxygen homeostasis—The balance for preventing autoimmunity. Lupus 2016, 25, 943–954. [Google Scholar] [CrossRef] [PubMed]
- Di Dalmazi, G.; Hirshberg, J.; Lyle, D.; Freij, J.B.; Caturegli, P. Reactive oxygen species in organ-specific autoimmunity. Autoimmun. Highlights 2016, 7, 11. [Google Scholar] [CrossRef] [PubMed]
- Saarela, J.; Kallio, S.P.; Chen, D.; Montpetit, A.; Jokiaho, A.; Choi, E.; Asselta, R.; Bronnikov, D.; Lincoln, M.R.; Sadovnick, A.D.; et al. PRKCA and multiple sclerosis: Association in two independent populations. PLoS Genet. 2006, 2, e42. [Google Scholar] [CrossRef] [PubMed]
- Poser, C.M.; Paty, D.W.; Scheinberg, L.; McDonald, W.I.; Davis, F.A.; Ebers, G.C.; Johnson, K.P.; Sibley, W.A.; Silberberg, D.H.; Tourtellotte, W.W. New diagnostic criteria for multiple sclerosis: Guidelines for research protocols. Ann. Neurol. 1983, 13, 227–231. [Google Scholar] [CrossRef] [PubMed]
- Pastinen, T.; Raitio, M.; Lindroos, K.; Tainola, P.; Peltonen, L.; Syvänen, A.C. A system for specific, high-throughput genotyping by allele-specific primer extension on microarrays. Genome Res. 2000, 10, 1031–1042. [Google Scholar] [CrossRef] [PubMed]
- O’Connell, J.R.; Weeks, D.E. PedCheck: A program for identification of genotype incompatibilities in linkage analysis. Am. J. Hum. Genet. 1998, 63, 259–266. [Google Scholar] [CrossRef] [PubMed]
- Raymond, M.; Rousset, F. GENEPOP (version 1.2): Population genetics software for exact tests and ecumenicism. J. Hered. 1995, 86, 248–249. [Google Scholar] [CrossRef]
- Spielman, R.S.; McGinnis, R.E.; Ewens, W.J. Transmission test for linkage disequilibrium: The insulin gene region and insulin-dependent diabetes mellitus (IDDM). Am. J. Hum. Genet. 1993, 52, 506–516. [Google Scholar] [PubMed]
- Terwilliger, J.D.; Ott, J. A haplotype-based ‘haplotype relative risk’ approach to detecting allelic associations. Hum. Hered. 1992, 42, 337–346. [Google Scholar] [CrossRef] [PubMed]
- Kuokkanen, S.; Sundvall, M.; Terwilliger, J.D.; Tienari, P.J.; Wikström, J.; Holmdahl, R.; Pettersson, U.; Peltonen, L. A putative vulnerability locus to multiple sclerosis maps to 5p14-p12 in a region syntenic to the murine locus Eae2. Nat. Genet. 1996, 13, 477–480. [Google Scholar] [CrossRef] [PubMed]
- Purcell, S.; Neale, B.; Todd-Brown, K.; Thomas, L.; Ferreira, M.A.; Bender, D.; Maller, J.; Sklar, P.; de Bakker, P.I.; Daly, M.J.; et al. PLINK: A tool set for whole-genome association and population-based linkage analyses. Am. J. Hum. Genet. 2007, 8, 559–575. [Google Scholar] [CrossRef] [PubMed]
- Purcell, S.; Sham, P.; Daly, M.J. Parental phenotypes in family-based association analysis. Am. J. Hum. Genet. 2005, 76, 249–259. [Google Scholar] [CrossRef] [PubMed]
- Vandesompele, J.; De Preter, K.; Pattyn, F.; Poppe, B.; Van Roy, N.; De Paepe, A.; Speleman, F. Accurate normalization of real-time quantitative RT-PCR data by geometric averaging of multiple internal control genes. Genome Biol. 2002, 3, RESEARCH0034. [Google Scholar] [CrossRef] [PubMed]


| Gene | Marker | ANALYZE Analyses 1 | PLINK Analyses | |||||||
|---|---|---|---|---|---|---|---|---|---|---|
| HRR p Value | TDT p Value | Minor Allele 2 | MAF | Transmitted/Untransmitted 3 | TDT p Value | OR [95% CI] | p Par 4 | p Comb 4 | ||
| NCF1 | D7S1870 | 0.0491 | 0.0383 | 20 repeats | 0.4533 | Untransmitted | 0.330 | 0.727 [0.38–1.385] | 0.157 | 0.206 |
| D7S2518 | 0.376 | 0.431 | 7 repeats | 0.3986 | / | 1 | 1 [0.351–2.851] | 0.414 | 0.655 | |
| NCF2 | rs796860 | 0.895 | 0.500 | C | 0.06548 | / | 1 | 1 [0.250–3.998] | 1 | 1 |
| rs2296164 | 0.568 | 0.399 | T | 0.4861 | Untransmitted | 0.297 | 0.643 [0.278–1.485] | 0.564 | 0.239 | |
| rs3818364 | 0.604 | 0.500 | T | 0.4688 | Transmitted | 0.847 | 1.0770 [0.506–2.291] | 0.564 | 0.715 | |
| rs789192 | 0.183 | 0.253 | G | 0.4268 | Transmitted | 0.144 | 1.727 [0.822–3.630] | 0.317 | 0.423 | |
| rs2274065 | 0.293 | 0.500 | C | 0.0974 | Transmitted | 0.180 | 4 [0.447–35.790] | 0.317 | 0.414 | |
| NCF4 | rs1883112 | 0.991 | 0.500 | A | 0.3861 | Transmitted | 0.353 | 1.417 [0.677–2.966] | 0.257 | 0.182 |
| rs741999 | 0.680 | 0.444 | A | 0.4444 | Transmitted | 0.336 | 1.455 [0.675–3.134] | 0.479 | 0.237 | |
| CYBA | rs4673 | 0.319 | 0.199 | T | 0.1795 | Untransmitted | 0.317 | 0.600 [0.218–1.651] | 0.564 | 0.251 |
| rs2306422 | 0.661 | 0.500 | T | 0.494 | Transmitted | 0.739 | 1.118 [0.581–2.150] | 0.655 | 0.876 | |
| CYBB | rs5963310 | 0.239 | 0.0274 | A | 0.09848 | Untransmitted | 0.0578 | 0.250 [0.0531–1.177] | 0.0833 | 0.0126 |
| rs9330580 | 0.663 | 0.206 | A | 0.1203 | Untransmitted | 0.366 | 0.571 [0.167–1.952] | 0.0833 | 0.109 | |
© 2018 by the authors. Licensee MDPI, Basel, Switzerland. This article is an open access article distributed under the terms and conditions of the Creative Commons Attribution (CC BY) license (http://creativecommons.org/licenses/by/4.0/).
Share and Cite
Cardamone, G.; Paraboschi, E.M.; Soldà, G.; Duga, S.; Saarela, J.; Asselta, R. Genetic Association and Altered Gene Expression of CYBB in Multiple Sclerosis Patients. Biomedicines 2018, 6, 117. https://doi.org/10.3390/biomedicines6040117
Cardamone G, Paraboschi EM, Soldà G, Duga S, Saarela J, Asselta R. Genetic Association and Altered Gene Expression of CYBB in Multiple Sclerosis Patients. Biomedicines. 2018; 6(4):117. https://doi.org/10.3390/biomedicines6040117
Chicago/Turabian StyleCardamone, Giulia, Elvezia Maria Paraboschi, Giulia Soldà, Stefano Duga, Janna Saarela, and Rosanna Asselta. 2018. "Genetic Association and Altered Gene Expression of CYBB in Multiple Sclerosis Patients" Biomedicines 6, no. 4: 117. https://doi.org/10.3390/biomedicines6040117
APA StyleCardamone, G., Paraboschi, E. M., Soldà, G., Duga, S., Saarela, J., & Asselta, R. (2018). Genetic Association and Altered Gene Expression of CYBB in Multiple Sclerosis Patients. Biomedicines, 6(4), 117. https://doi.org/10.3390/biomedicines6040117