Abstract
Background/Objectives: Propolis is a complex natural product with long-standing traditional use as an antimicrobial remedy. Several studies suggest that Brazilian varieties of propolis may promote wound healing and protect the skin from UV damage, most likely due to antioxidant and anti-inflammatory mechanisms. However, the literature provides limited support for this topic. The present work aimed at characterizing the polyphenolic profile of two Brazilian propolis samples, investigating their biological activity. Methods: Biological experiments were conducted in human keratinocytes (HaCaT) and fibroblasts (HDF) stimulated by cytokines involved in skin inflammation and remodeling (TNF-α and IL-1β), while phytochemical analyses were conducted by LC-MS techniques. Results: Our findings indicate that artepillin C and drupanin were the principal phytochemicals of green propolis, while vestitol, medicarpin, and neovestitol were the most abundant in red propolis. The presence of phenolic compounds was correlated with the antioxidant activity demonstrated by ORAC and intracellular ROS assays. Accordingly, both Brazilian propolis samples impaired NF-κB activity, while only red propolis hindered IL-8 release in both cell lines with an IC50 lower than 25 μg/mL. Surprisingly, both propolis samples at the same concentrations enhanced the production of IL-6 and VEGF, thus suggesting the coexistence of anti-inflammatory, antioxidant, and trophic mechanisms contributing to skin repair. In line with this hypothesis, propolis also induced the stabilization of HIF-1α, paralleling the biological effect of a well-known synthetic HIF stabilizer (DMOG). Conclusions: This work supports the investigation of Brazilian red and green propolis as potential modulators of the inflammatory phase in wound healing.
1. Introduction
Propolis is a complex resinous mixture composed of exudates gathered by honeybees (Apis mellifera Linnaeus, 1758) from buds, twigs, sprouts, vegetal apices, sap flows, or other botanical sources and elaborated with beeswax and salivary secretions [1], traditionally used for the topical treatment of burns and minor injuries [2] due to its renowned antimicrobial [3], antioxidant [4], and anti-inflammatory properties [5]. In 2007, this classification was further expanded with the discovery of a thirteenth variety native to the states of Sergipe, Alagoas, Paraíba, Pernambuco, and Bahia known as red propolis [6]. The main source of type-12 green propolis, the most widespread and best-selling variety, is represented by the buds and non-expanded leaves of Baccharis dracunculifolia DC. belonging to the family Asteraceae [7], whereas the main botanical source of red propolis is Dalbergia ecastaphyllum (L.) Taub., a leguminous plant known for the presence of red pigments composed of cationic C30 isoflavans [8].
The chemical profile of propolis has been recently defined by the International Organization for Standardization (INTERNATIONAL STANDARD, ISO 24381:2023, Bee propolis – specifications; 2023). The most abundant components of green propolis are members of the phenylpropanoid class, such as cinnamic acid, coumaric acid, and caffeic and caffeoylquinic acids [9]. The presence of prenylated phenylpropanoids is noteworthy, in particular, 4-hydroxycinnamic acid prenylated derivatives [10], which can be distinguished between cyclized chromenes, such as 2,2-dimethyl-8-prenylchromene, and compounds that do not cyclize such as artepillin C and drupanin [11]. Artepillin C (3,5-diprenyl-4-hydroxycinnamic acid) stands out due to its abundance and important biological activities [12]. Flavonoids are minor components of green propolis, whereas they are undoubtedly predominant in red propolis [13], in particular, in the subclass of isoflavonoids. The principal molecules identified in red propolis belong to the classes of flavonols (quercetin and rutin), flavanonols (pinobanksin), flavones (luteolin), flavanones (liquiritigenin and pinocembrin-3-acetate), isoflavones (daidzein), the neoflavone dalbergin, and the chalcone isoliquiritigenin [6]. Other compounds identified include vestitol and neovestitol, formononetin, biochanin A, pinocembrin, and medicarpin, which are characteristic markers used to identify red propolis samples [14].
Propolis has demonstrated antimicrobial [3], antiviral [15], antioxidant, anti-inflammatory, and immunostimulant properties [5]. Propolis can regulate the synthesis and release of the principal pro-inflammatory cytokines, including IL-8, IL-6, IL-1β, and IL-12, while increasing the expression of anti-inflammatory cytokines such as IL-4 and IL-10 [16,17]. Many of the major anti-inflammatory mechanisms of action are related to the modulation of NF-κB and AP-1 signaling [18].
Several in vitro and in vivo studies suggest that Brazilian propolis may promote wound healing [19,20,21] and protect the skin from UV damage [22,23]. Nevertheless, the mechanisms and the putative compounds responsible for the biological effects at the skin level were poorly investigated. Besides classical inflammatory pathways, such as NF-κB, polyphenols are known to interfere with multiple pathways involved in cell metabolism, including HIF-1 [24,25].
The role of HIF-1 as a potential target in epithelial barrier defects, as is the case in skin and intestinal inflammatory diseases, has been a topic of discussion in recent research [26,27]. Inflammation and hypoxia signaling are mutually interdependent: inflammatory states are frequently characterized by tissue hypoxia, or otherwise by the stabilization of hypoxia-dependent transcription factors [28]. HIF-1 influences the cellular inflammatory response through a metabolic switch to glycolysis, which may be important for preventing the excessive generation of deleterious reactive oxygen species and impaired wound resolution [29], and elicits the upregulation of many genes that enhance the wound repair process, such as adhesion proteins, soluble growth factors (TGF-β and VEGF), and matrix components. Consequently, the anti-inflammatory effects of hypoxia signaling have been linked to a transcriptional program under the control of HIF-1, which has been shown to dampen hypoxia-induced inflammation in a wide variety of inflammatory disease models, for example, through the enhanced production of anti-inflammatory signaling molecules [30,31].
The interplay among keratinocytes and fibroblasts is fundamental in skin repair: keratinocytes play a key role in skin barrier and immunity, while fibroblasts are responsible for tissue remodeling and cell migration [32].
Within this context, a single study, limited to Brazilian green propolis, has highlighted a possible involvement in the modulation of the activity of the transcription factor HIF-1. However, available data refer to a model of human embryonic kidney (HEK) cells transfected with a reporter plasmid [33]. Drupanin, baccharin, and kaempferide inhibited the activation of HIF-1α and downstream target genes such as GLUT1 and VEGFA, whereas the flavonoids isosakuranetin and betuletol induced HIF-1 transcriptional activity in both hypoxic and normoxic conditions [33].
In the present work, on the one hand, an analytical characterization of green and red Brazilian propolis samples was performed, while on the other hand, their spectrum of molecular mechanisms on skin cells was evaluated. A comprehensive in vitro assessment of the still largely unknown biological activities of green and red Brazilian propolis on human keratinocyte and dermal fibroblast cellular models was conducted, taking into account the potential involvement of NF-κB and HIF-1 pathways. In particular, the purpose of the investigation of the anti-inflammatory, HIF-1-modulating activities, and their interrelationships was intended to showcase the potential of Brazilian propolis as an all-around skin-protecting agent able to elicit a regenerative cell behavior triggered by a hypoxia-mimicking survival response.
2. Materials and Methods
2.1. Brazilian Propolis Samples
Green propolis tincture, a dark green hydroalcoholic solution certified to contain at least 11% of green propolis, was purchased from “Apiário Silvestre” (Piracaia, Sâo Paulo State, Brazil). Red propolis tincture, a carmine, aromatic hydroalcoholic solution, was purchased from “Apiário Cajueiro” (Una, Bahia State, Brazil). Both propolis tinctures were kept overnight at −20 °C to favor the precipitation of inert waxes, which were then filtered out by vacuum filtration. The filtrate was evaporated to dryness using a rotary evaporator (Laborota 4000 efficient, Heidolph Instruments GmbH & Co., Schwabach, Germany), and the dry residue was redissolved at a concentration of 50 mg/mL in a mixture of 75:25 EtOH:H2O, aliquoted, and stored at −20 °C for subsequent experiments.
2.2. Total Phenolic Content (TPC)
The total phenolic content was determined according to the Folin–Ciocâlteu method. Briefly, propolis samples were preliminarily diluted in deionized water (1 mg/mL), and 20 µL, corresponding to 20 μg of extract, was further diluted to a final volume of 800 µL. Then, 50 µL of 2 N Folin–Ciocâlteu reagent (Merck Life Science, Milan, Italy) and 150 µL of 20%w/v Na2CO3 were added. After 30 min of incubation at 37 °C, the absorbance of the samples was measured with a JASCO V630 UV-Vis cuvette spectrophotometer (JASCO International Co. Ltd., Tokyo, Japan) at 765 nm. The total phenolic content was quantified using a calibration curve of gallic acid (0–15 μg/mL).
2.3. Oxygen Radical Absorbance Capacity (ORAC) Assay
The oxygen radical absorbance capacity assay was carried out according to Dávalos et al. [34], with minor modifications. Briefly, propolis samples were preliminarily diluted in deionized water (at 5 μg/mL), and 20 µL, corresponding to 0.1 μg of extract, was aliquoted into a black 96-well plate (Greiner Bio-One Italia S.r.l., Cassina de’ Pecchi, Italy). Then, 120 µL of fluorescein solution (with a final concentration of 70 nM) in a phosphate buffer (75 mM, pH 7.4) was added to each well. Alkyl peroxyl radicals were generated by the addition of 60 µL of 40 mM AAPH solution [2-2′-azobis(2-aminidinopropane) dihydrochloride] (Merck Life Science, Milan, Italy). The plate was immediately put in a multilabel plate reader (VICTOR X3, PerkinElmer Italia S.p.a., Milan, Italy) at 37 °C, and fluorescence (Ex. = 485 nm/Em. = 535 nm) was recorded, after shaking, every 2 min for 31 repeats. Trolox (0–120 µM) was used as a reference radical scavenger. The area under the curve (AUC) was calculated for each sample and compared with the standard Trolox curve.
2.4. GC-MS Analysis
A few milligrams of propolis extract, evaporated to dryness, were treated with 70 µL of the silylating agent BSTFA [N,O-bis(trimethylsilyl)trifluoroacetamide] (Merck Life Science, Milan, Italy) in 30 µL of pyridine and 100 µL of ethyl acetate. The reaction was conducted for 3 h at 70 °C, and then 1.0 µL was injected into the gas chromatograph. GC-MS analysis was carried out on a Bruker SCION SQ gas chromatograph (Bruker Daltonics, Macerata, Italy) equipped with a Zebron ZB-5HT Inferno column (30 m; ID 0.25 mm, df 0.25 µm) (Phenomenex, Castel Maggiore, Italy) coupled with an EI source and single quadrupole (SQ) analyzer.
Operative parameters were set as follows: the GC oven temperature program was 60 °C (3 min), 8.0 °C/min to 120 °C (1 min hold), 4.0 °C/min to 280 °C (1.5 min hold), and 10.0 °C/min to 380 °C (2 min hold) for a total runtime of 60 min; the inlet temperature was 250 °C; the flow rate was 1.00 mL/min; the carrier gas was helium 5.5; and the ionization energy was 70 eV. The split/splitless ratio was 1:30 after 45 s. Peaks were assigned by matching experimental mass spectra with those present in the NIST mass spectral library (version 2.0, 2011). The relative abundance of compounds was obtained through peak area normalization.
2.5. HPLC-ESI-HRMS Analysis
Analyses were conducted on ethanolic samples, further diluted to 1:20 in ethanol, and centrifuged (16,000× g, 5 min) using a SYNAPT G2-Si mass spectrometer (Waters, Sesto San Giovanni, Italy) equipped with an autosampler, a UPLC-PDA detector operating in the range of λ = 190–400 nm, an ESI source, and a TOF analyzer. The chromatographic separation was obtained using an ACQUITY UPLC HSS T3 column (75 mm × 2.1 mm, 1.8 μm) (Waters, Sesto San Giovanni, Italy). The injection volume was 10.0 µL; the mobile phase was set as follows: acetonitrile (mobile phase A) and water (mobile phase B) with a gradient of 10% A for 2 min, then 10–60% in 48 min, and then 60–90% in 10 min. Desolvation was obtained with nitrogen heated at 180 °C and a capillary voltage of 2 kV. Data was acquired in a negative mode.
2.6. Cell Cultures
HaCaT cells (RRID:CVCL-0038, Cell Line Service GmbH, Eppelheim, Germany), a stable cell line of human keratinocytes from Caucasian male adults, were grown as an adherent monolayer in a high-glucose DMEM medium (Merck Life Science, Milan, Italy) supplemented with penicillin (100 units/mL) and streptomycin (100 μg/mL) (Pen Strep Gibco, Thermo Fisher Scientific, Rodano, Italy), 2 mM L-glutamine (Gibco, Thermo Fisher Scientific, Rodano, Italy), and 10% heat-inactivated fetal bovine serum (Euroclone S.p.A, Pero, Italy), at 37 °C in a humidified atmosphere with 5% CO2.
HDF cells (RRID:CVCL_UF42, ECACC, Porton Down, Porton, UK), a stable cell line of normal female adult dermal fibroblasts, were grown as an adherent monolayer in a DMEM medium (Merck Life Science, Milan, Italy) supplemented with penicillin (100 units/mL) and streptomycin (100 μg/mL) (Pen Strep Gibco, Thermo Fisher Scientific, Rodano, Italy), 2 mM L-glutamine (Gibco, Thermo Fisher Scientific, Rodano, Italy), and 10% heat-inactivated fetal bovine serum (Euroclone S.p.A, Pero, Italy), at 37 °C in a humidified atmosphere with 5% CO2.
At 80–90% confluence, cells were detached from 75 cm2 culture flasks (Euroclone S.p.A, Pero, Italy) using a 0.25% trypsin–EDTA solution (Gibco, Thermo Fisher Scientific, Rodano, Italy) and transferred to a new flask at a density of 1.5 × 10⁶ cells per flask to allow for cell line expansion. For the experimental procedures, cells were seeded in flat-bottom culture plates or dishes (Falcon, Corning Life Sciences B.V., Amsterdam, The Netherlands) at a standard density of 1.5–3 × 10⁴ cells/cm2 and cultured for 72 h before the treatment.
2.7. Cell Treatments
After 72 h of growth, HaCaT and HDF cells were treated with different concentrations of green and red propolis extracts using a serum-free medium. Concomitantly, cells were stimulated with the pro-inflammatory cytokines TNF-α or IL-1β (10 ng/mL) for 6 h or 24 h. Moreover, according to previously published methodologies [35], IL-6 production was evaluated by adding the inflammatory enhancer IFN-γ (5 ng/mL) to TNF-α. Following previous works, 20 μM of epigallocatechin gallate (EGCG) was used as a reference inhibitor against TNF-α, while 1 mM of DMOG was used as a reference inhibitor against IL-1β.
2.8. Cytotoxicity Assays
The integrity of cell morphology before and after the treatments was assessed by light microscope inspection. The viability of HaCaT and HDF cells in the presence of propolis samples was investigated by MTT [3-(4,5-Dimethyl-2-thiazolyl)-2,5-diphenyl-2H-tetrazolium bromide] and LDH (lactate dehydrogenase) release tests (Smith, Wunder, Norris, & Shellman, 2011) [35].
For the MTT test, the medium was removed after treatment and replaced with a 0.25 mg/mL MTT (Merck Life Science, Milan, Italy) solution in PBS; then, the cells were incubated for 30 min at 37 °C. At the end of incubation, the MTT solution was discarded, formazan crystals were dissolved with a 90:10 isopropanol:DMSO solution, and the absorbance was measured at 570 nm using a multilabel plate reader (EnVision 2101, PerkinElmer Italia S.p.a., Milan, Italy).
For the LDH assay, the amount of LDH released in the medium compared to total intracellular LDH was measured with the LDH Cytotoxicity Detection Kit (Takara Bio Europe, Saint Germain-en-Laye, France), following the manufacturer’s instructions. After 30 min of incubation at room temperature, absorbance was read at 490 nm using a multilabel plate reader (VICTOR X3, Perkin Elmer S.p.a., Milan, Italy).
2.9. Reporter Plasmid Assays
Two reporter plasmids were used to transiently transfect HaCaT and HDF cells, as previously described [35]: NF-κB-Luc, a luciferase reporter construct containing three κΒ-responsive elements from the E-selectin gene, was a gift from Dr N. Marx (Department of Internal Medicine-Cardiology, University of Ulm, Ulm, Germany); HRE-Luc, a luciferase reporter construct containing three hypoxia-responsive elements (24-mers) from the Pgk-1 gene, was a gift from Navdeep Chandel (Addgene plasmid # 26731; http://n2t.net/addgene:26731, accessed on 7 January 2025; RRID:Addgene_26731).
Plasmid amplification was obtained in transformed Escherichia coli, strain DH5α. Bacteria from frozen glycerinates were grown in LB broth supplemented with 100 μg/mL ampicillin (Merck Life Science, Milan, Italy), keeping flasks overnight in an orbital shaker at 37 °C. The following day, bacteria were pelleted by centrifugation (5000 rpm, 10 min, 4 °C), and the plasmid was extracted using a commercial kit according to the manufacturer’s instructions (NucleoBond® Xtra Maxi; MACHEREY-NAGEL GmbH & Co. KG, Düren, Germany). The purified plasmid was resuspended in nuclease-free water and quantified with a NanoDrop ND-1000 spectrophotometer (Thermo Fisher Scientific, Rodano, Italy).
After preliminary titration of reporter plasmid signal-to-noise response, the amounts of 250 ng/well for 24-well plates and 42 ng/well for 96-well plates were chosen. Cells were transiently transfected with Lipofectamine 3000 transfection reagent (Thermo Fisher Scientific, Rodano, Italy). After incubation overnight, cells were treated, and the luciferase produced was assessed using the Britelite Plus reporter gene assay system (PerkinElmer Italia S.p.a., Milan, Italy), according to the manufacturer’s instructions. The luminescence generated by the reaction between luciferase and luciferin was measured with a multilabel plate reader (VICTOR X3, PerkinElmer Italia S.p.a., Milan, Italy).
2.10. ELISA
The release of IL-8, IL-6, and VEGF was evaluated by an enzyme-linked immunosorbent assay (ELISA) on culture media [35]. Human IL-8 (ABTS), IL-6 (TMB), and VEGF (ABTS) ELISA development kits were purchased from PeproTech (PeproTech, London, UK). In brief, 96-well EIA/RIA plates (Corning Life Sciences B.V., Amsterdam, The Netherlands) were coated overnight at room temperature with a capture antibody contained in the kit. The amounts of IL-8, IL-6, and VEGF in the samples were detected by measuring the absorbance resulting from the colorimetric reaction between an HRP conjugate and 2,2′-azino-bis(3-ethylbenzothiazoline-6-sulfonic acid) (ABTS) or a 3,3′,5,5′-tetramethylbenzidine (TMB) substrate (Merck Life Science, Milan, Italy). Absorbance was measured at 405 nm (ABTS) or 450 nm (TMB) using a multilabel plate reader (VICTOR X3; PerkinElmer, Milan, Italy). IL-8, IL-6, and VEGF levels were extrapolated from a standard curve of the mediator of interest.
2.11. Immunocytochemistry
For immunocytochemistry experiments, cells were seeded on Nunc Lab-Tek II chamber slides (Thermo Fisher Scientific, Rodano, Italy). At the end of the treatment, cells were washed with PBS and fixed with buffered 4% formaldehyde solution for 15 min. Cells were washed 3 times with PBS and incubated for 1 h in a blocking solution consisting of 5% normal goat serum (Cell Signaling Technology B.V., Leiden, The Netherlands) and 0.3% Triton X-100 (Merck Life Science, Milan, Italy) in PBS. Then, the blocking solution was removed, and cells were incubated overnight at 4 °C with the primary antibody (HIF-1α D1S7W XP Rabbit mAb #36169, Cell Signaling Technology B.V., Leiden, The Netherlands) diluted to 1:800 in 1% BSA (Merck Life Science, Milan, Italy) and 0.3% Triton X-100 (Merck Life Science, Milan, Italy) in PBS. The day after, cells were washed 3 times with PBS and incubated for 1.5 h with the secondary antibody (Anti-rabbit IgG (H+L) F(ab’)2 Fragment Alexa Fluor 647 conjugate #4414, Cell Signaling Technology B.V., Leiden, The Netherlands) diluted to 1:1500 and ActinRed 555 (Thermo Fisher Scientific, Rodano, Italy). Finally, cells were washed 3 times with PBS, mounted with coverslips using a drop of ProLong Gold antifade reagent with DAPI (Cell Signaling Technology B.V., Leiden, The Netherlands), and imaged with a confocal laser scanning microscope (LSM 900, Carl Zeiss S.p.a., Milan, Italy).
2.12. Gene Expression Analysis
RNA was extracted at the end of the treatment, the medium was removed, and cells were washed with PBS and lysed with QIAzol Lysis Reagent (QIAGEN S.r.l., Milan, Italy) according to the manufacturer’s instructions. The lysates were homogenized and stored at −80 °C until the following RNA purification steps were carried out: Total RNA was isolated from cell lysates with miRNeasy Mini Kit (QIAGEN S.r.l., Milan, Italy), according to the manufacturer’s protocol. A set of RNase-free DNase (QIAGEN S.r.l., Milan, Italy) was used to provide efficient on-column digestion of genomic DNA. Total RNA was eluted with nuclease-free water, and the concentration and quality were assessed spectrophotometrically using a NanoDrop ND-1000 spectrophotometer (Thermo Fisher Scientific, Rodano, Italy). Sample purity was estimated by measuring A260/280 and A260/230 ratios to check for possible contaminants co-purified during the RNA isolation.
Then, real-time quantitative PCR was performed using the iScript One-Step RT-PCR kit for probes (Bio-Rad Laboratories S.r.l., Segrate, Italy) according to the manufacturer’s instructions, on a CFX38 Real-Time PCR Detection System (Bio-Rad Laboratories S.r.l., Segrate, Italy). Primers and probes were obtained from Eurofins Genomics Italy (Vimodrone, Italy) (Table 1).

Table 1.
Sequence of primers used in this study.
The threshold cycle value for each gene was automatically provided by the software CFX Manager (Bio-Rad Laboratories S.r.l., Segrate, Italy), depending on the amplification curves, and quantification was performed with the standard curve method. Expression data were normalized to the housekeeping gene 36B4 (ribosomal protein lateral stalk subunit P0).
2.13. Intracellular ROS Production
ROS production was investigated in HaCaT cells seeded in 96-well black plates, as previously described [36]. At the end of 24 h pretreatment with propolis extracts, cells were washed with warm PBS and incubated at 37 °C with 25 μM CM-H2DCFDA (Invitrogen, Thermo Fisher Scientific, Monza, Italy) in HBSS without phenol red (Merck Life Science, Milano, Italy). After 30 min, cells were washed twice with PBS and treated for 1 h with H2O2 (1 mM) in serum-free medium. Following 1 h of incubation, cells were washed again with PBS, and 100 μL of PBS was added to each well; finally, fluorescence was read using a multiplate reader (VICTOR X3; PerkinElmer, Milano, Italy) at Ex. = 490 nm/Em. = 535 nm.
2.14. Statistical Analysis
All the experiments were performed at least in triplicate. The results of TPC and ORAC assays are expressed as mean ± SD for unpaired two-sample t-tests. All other results are expressed as mean ± SEM, and the statistical significance of differences between means has been calculated through an unpaired one-way ANOVA followed by a Bonferroni post hoc test for multiple comparisons. Statistical analyses and IC50 calculations were carried out using GraphPad Prism 8.0.1 (GraphPad Software Inc., San Diego, CA, USA); p values less than 0.05 were considered statistically significant.
3. Results
3.1. Total Phenolic Content and Antioxidant Capacity of Brazilian Propolis Extracts
In the first step of this work, two propolis tinctures from the Brazilian market were refined by removing waxes through simple procedures described in Methods. Then, dry extracts were characterized for the total phenolic content (TPC) and oxygen radical absorbance capacity (ORAC).
The TPC of Brazilian green and red propolis dry extracts was determined using the Folin–Ciocâlteu assay. Table 2 shows the TPC values of propolis dry extracts and their relationship with the original hydroethanolic tinctures.
Table 2.
Total phenolic content (TPC) of Brazilian green and red propolis extracts. The results are expressed as mg of gallic acid per g of extract or tincture (mean ± SD).
A statistically significant difference in TPC values was observed between the two propolis samples, with red propolis showing a TPC approximately twice that of green propolis.
The two propolis samples demonstrate a statistically significant difference in the antioxidant capacity (Table 3).
Table 3.
Oxygen Radical Absorbance Capacity (ORAC) values of Brazilian green and red propolis extracts. The results are expressed as mmol of Trolox per g of extract or tincture (mean ± SD).
Considering the potential involvement of phenolic compounds in determining the antioxidant capacity, red propolis shows an antioxidant capacity that is approximately twice that of green propolis, which is consistent with the results of the TPC.
3.2. GC-EI-MS
The GC-EI-MS chromatograms of silylated green and red Brazilian propolis samples are shown in Figure 1. Even in this case, it is evident that the two propolis samples possess completely different composition profiles.
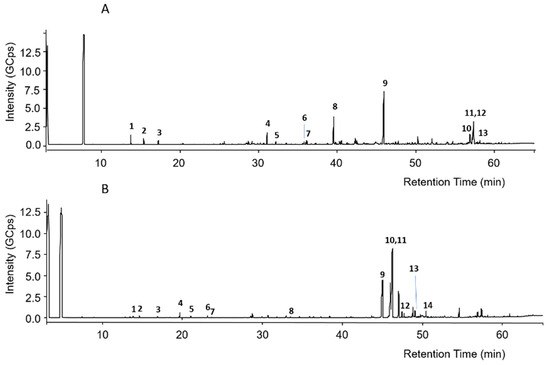
Figure 1.
GC-MS chromatograms of silylated green propolis (A) and red propolis (B). Numbers indicate the principal peaks that were putatively assigned a structure through a comparison of mass spectra with those found in the literature.
The putative assignment of peaks was conducted by comparison of recorded mass spectra with those in the NIST 2011 mass spectral library or those reported in the literature [37,38,39]. Regarding green propolis, peak numbers reported in Figure 1A were related to the compounds listed in Table 4.
Table 4.
Putatively annotated compounds identified by GC-EI-MS in green propolis.
In green propolis, the relative intensity of peaks demonstrates that the main compounds, identified as TMS derivatives, are artepillin C (m/z = 444.3 [M+H]+, peak 9), drupanin (m/z = 376.2 [M+H]+, peak 8), p-coumaric acid (m/z = 308.1 [M+H]+, peak 4), and some sesquiterpenes such as cycloartenol acetate (m/z = 468.5 [M+H]+, peak 12) and β-amyrin (m/z = 498.5 [M+H]+, peak 10), the structures of which are shown in Figure 2.
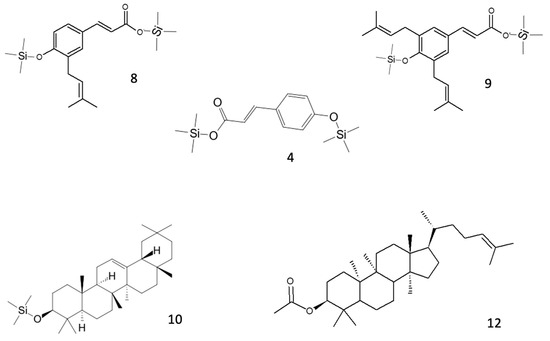
Figure 2.
Structures of the main putative compounds identified in green propolis through GC-EI-MS: p-coumaric acid (4), drupanin 2TMS (8), artepillin C 2TMS (9), β-amyrin TMS (10), and cycloartenol acetate (12).
Regarding red propolis, peak numbers reported in Figure 1B were related to the compounds listed in Table 5.
Table 5.
Putatively annotated compounds identified by GC-EI-MS in red propolis. TMS: trimethylsilyl group.
In red propolis, the relative intensity of peaks demonstrates that the principal compounds, identified as TMS derivatives, are vestitol (m/z = 416.2 [M+H]+, peak 11), neovestitol (m/z = 416.2 [M+H]+, peak 10), and medicarpin (m/z = 342.2 [M+H]+, peak 9), while liquiritigenin (m/z = 400.2 [M+H]+, peak 12) and formononetin (m/z = 340.2 [M+H]+, peak 13) are marginally present. Based on these results, it was hypothesized that neovestitol and vestitol represented the two main compounds observed in GC-EI-MS analysis, the structures of which, together with those of other identified compounds, are reported in Figure 3.
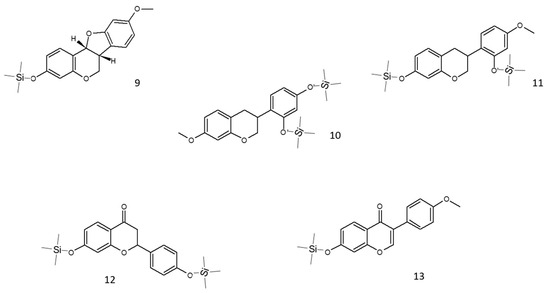
Figure 3.
Structures of the main putative compounds identified in red propolis through GC-EI-MS: medicarpin TMS (9), neovestitol 2TMS (10), vestitol 2TMS (11), liquiritigenin 2TMS (12), and formononetin TMS (13).
3.3. HPLC-ESI-HRMS
The investigation into the phytochemical composition was concluded by a thorough comparative HPLC-UV/PDA-ESI-HRMS analysis, which is reported in the Supplementary Materials (Figures S1 and S2).
All compounds detected in green propolis are reported in Table 6: the main identified compounds were p-coumaric acid (m/z 163.0399 [M-H]−, peak 1), drupanin (m/z 231.1029 [M-H]−, peak 4), and artepillin C (m/z 299.1633 [M-H]−, peak 8); the structures of the respective molecules are reported in Figure S3.
Table 6.
Compounds identified in green propolis through HPLC-ESI-HRMS analysis.
The compounds identified in red propolis are reported in Table 7: the main compounds identified were vestitol and neovestitol (m/z 271.0974 and m/z 271.0972 [M-H]−, peaks 3 and 4, respectively), medicarpin/4′-dihydroxy-2-methoxychalcone/(7 S)-dalbergiphenol (all with m/z 269 and the same molecular formula, peak 5), and guttiferone (m/z 601.3535 and m/z 601.3531 [M-H]−, peaks 6 and 7, respectively). The structures of the identified molecules are reported in Figure S4.
Table 7.
Compounds identified in red propolis through HPLC-ESI-HRMS analysis.
The assignment of the main peaks to the respective compounds was made possible by the comparison of spectroscopic and spectrophotometric parameters with those reported in the literature [green propolis: [37,40]; red propolis: [37,41]. Since the signal was acquired in a negative ion mode, MS peak assignment was conducted taking into consideration m/z values corresponding to [M-H]−. Further confirmation was obtained through the elemental analysis of m/z fragments of interest.
In some cases, besides the deprotonated pseudomolecular ion peaks, it was possible to appreciate ion peaks with masses corresponding to [2M-H]−, indicating molecule dimerization within the ion source. In Figure S5, the case of neovestitol/vestitol is reported as an example.
3.4. In Vitro Cytotoxicity
Before proceeding with the evaluation of the biological activities in keratinocytes and fibroblasts, cytotoxicity was evaluated to assess the influence on cell viability and determine the maximum concentrations to be used in cell treatments.
At 6 h, green Brazilian propolis extract did not affect viability, neither in HaCaT nor HDF cells (Figure S6). On the other hand, red propolis extract induced a slight reduction in viability in HaCaT cells, which was measured by the MTT assay at the concentrations of 25 and 50 μg/mL. Given a certain variability and to dispel possible doubts, cytotoxicity at the highest concentrations was assessed by LDH assay as well, confirming the absence of significant cytotoxic effects. Consequently, in 6 h treatments, both propolis samples were used up to a concentration of 50 μg/mL.
At 24 h, once again, green propolis extract did not affect viability, either in HaCaT or HDF cells (Figure S7). Instead, red propolis extract showed significant cytotoxic effects in HaCaT cells at the concentrations that had yielded dubious results at 6 h. Therefore, in 24 h treatments in HaCaT cells, red propolis was used up to a concentration of 10 μg/mL.
3.5. Effect on NF-κB-Driven Transcription
As the very first step in the biological investigation, propolis was screened against a key pathway of skin inflammation, also known as the NF-κB pathway. Both TNF-α and IL-1β are inflammatory cytokines involved in skin diseases associated with tissue damage. However, they are known to activate the NF-κB pathway in diverse ways. Thus, both cytokines were selected for our experimental setting to obtain more information regarding anti-inflammatory mechanisms occurring at the upstream level of NF-κB activation.
For this purpose, cells were transiently transfected with an NF-κB-Luc reporter plasmid, subjected to the pro-inflammatory stimulus, TNF-α or IL-1β (10 ng/mL), and concomitantly treated with increasing concentrations of Brazilian propolis (1–50 μg/mL).
Beginning with the results obtained with TNF-α stimulation of HaCaT cells (Figure 4A,B), green propolis was able to partially inhibit NF-κB-driven transcription, in a statistically significant manner, only at the concentrations of 25 and 50 μg/mL, with an IC50 of 40.29 μg/mL. The effect of red propolis is greater and markedly concentration-dependent, with an IC50 of 8.51 μg/mL. At 25 and 50 μg/mL, NF-κB-driven transcription was brought back to basal levels. In HDF cells (Figure 4C,D), in the case of green propolis, a concentration-dependent response was not observed, even though, at the highest concentrations, a slight inhibition of NF-κB-driven transcription could be seen. On the contrary, despite the entity of the effect being lower compared to HaCaT cells, red propolis was once again able to bring NF-κB-driven transcription back to basal levels in a concentration-dependent manner, with an IC50 of 23.83 μg/mL.
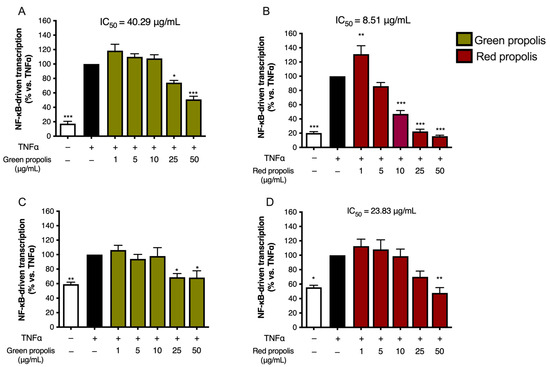
Figure 4.
Assessment of green (A,C) and red (B,D) Brazilian propolis effect on NF-κB-driven transcription in HaCaT (A,B) and HDF (C,D) cells. Cells were stimulated with 10 ng/mL of TNF-α and treated for 6 h with increasing propolis concentrations. EGCG 20 μM was used as a reference inhibitor (−77%). Data are expressed as a percentage of the stimulus, which was arbitrarily assigned the value of 100%. − means “present” and + means “absent”. * p < 0.05, ** p < 0.01, and *** p < 0.001 versus TNF-α.
Stimulation with IL-1β was investigated only in HaCaT cells, since HDF cells were not elicited by this cytokine. Green propolis determined a slight inhibition of IL-1β-induced NF-κB-driven transcription at the highest concentration tested of 50 μg/mL (Figure 5A). The effect of red propolis was greater, with an IC50 of about 10 μg/mL (Figure 5B). At the concentrations of 25 and 50 μg/mL, NF-κB-driven transcription was brought back to basal levels.
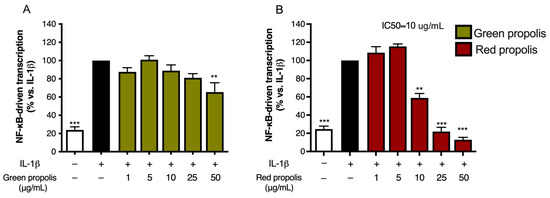
Figure 5.
Assessment of green (A) and red (B) Brazilian propolis effect on NF-κB-driven transcription in HaCaT cells. Cells were stimulated with 10 ng/mL of IL-1β and treated for 6 h with increasing propolis concentrations. DMOG 1 mM was used as a reference inhibitor (−41%). Data are expressed as a percentage of the stimulus, which was arbitrarily assigned the value of 100%. − means “present” and + means “absent”. ** p < 0.01 and *** p < 0.001 versus IL-1β.
3.6. Effect on IL-8 and IL-6 Secretion
Since Brazilian propolis showed an inhibitory effect on NF-κB activity, we selected various soluble pro-inflammatory mediators as read-outs of such an inhibitory effect at a downstream level. Thus, the release of NF-κB-dependent mediators, namely IL-8 and IL-6, was measured by ELISA.
Following the previous experimental paradigm, to assess the ability of green and red Brazilian propolis to inhibit IL-8 release in keratinocytes and fibroblasts, cells were subjected to a pro-inflammatory stimulus (TNF-α 10 ng/mL, 6 h) and concomitantly treated with increasing concentrations of propolis (1–50 μg/mL). In HaCaT cells (Figure 6A,B), green propolis did not prove to be appreciably active in inhibiting TNF-α-induced IL-8 release. Red propolis, instead, showed statistically significant activity at concentrations higher than 10 μg/mL, with an IC50 of 11.89 μg/mL.
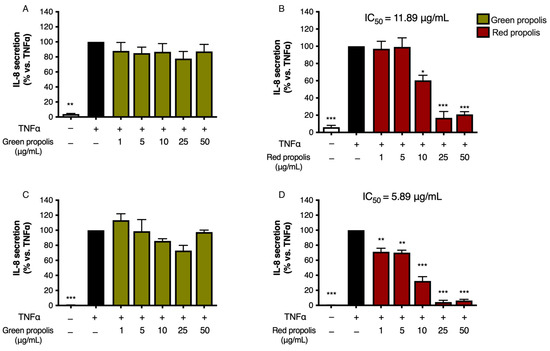
Figure 6.
Assessment of green (A,C) and red (B,D) Brazilian propolis effect on IL-8 release in HaCaT (A,B) and HDF (C,D) cells. Cells were stimulated with 10 ng/mL of TNF-α and treated for 6 h with increasing propolis concentrations. EGCG 20 μM was used as a reference inhibitor (−75%). Data are expressed as a percentage of the stimulus, which was arbitrarily assigned the value of 100%. − means “present” and + means “absent”. * p < 0.05, ** p < 0.01, and *** p < 0.001 versus TNF-α.
In HDF cells (Figure 6C,D), green propolis demonstrated a limited inhibitory activity on TNF-α-induced IL-8 release, with a slight and non-statistically significant reduction at 25 μg/mL. In the same experimental conditions, red propolis showed significant concentration-dependent inhibition of IL-8 release starting at 1 μg/mL, with an IC50 of 5.89 μg/mL.
The release of IL-6 was also investigated under a paradigm published in previous studies [35], challenging cells with a combination of TNF-α (10 ng/mL) and IFN-γ (5 ng/mL).
Unexpectedly, in HaCaT cells (Figure 7A,B), the highest concentration tested, which was the same used in the previous experiments, caused a significant increase in IL-6 release above the stimulated levels. In HDF cells (Figure 7C,D), the direction of the effect was similar to HaCaT cells but of modest magnitude.
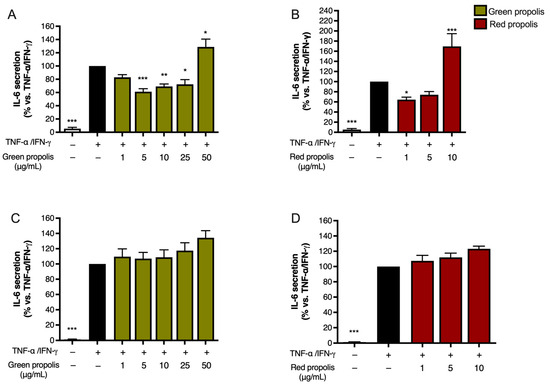
Figure 7.
Assessment of green (A,C) and red (B,D) Brazilian propolis effect on IL-6 release in HaCaT (A,B) and HDF (C,D) cells. Cells were stimulated with 10 ng/mL of TNF-α and 5 ng/mL of IFN-γ and treated for 24 h with increasing propolis concentrations. EGCG 20 μM was used as a reference inhibitor (−79%). Data are expressed as a percentage of the stimulus, which was arbitrarily assigned the value of 100%. − means “present” and + means “absent”. * p < 0.05, ** p < 0.01, and *** p < 0.001 versus TNF-α/IFN-γ.
Notably, in both HaCaT (Figure 8A) and HDF (Figure 8B) cells, green propolis and red propolis were able to significantly induce the overexpression of the IL6 gene, thus confirming the data reported in Figure 7. The effect induced by red propolis was significantly higher than that of green propolis.
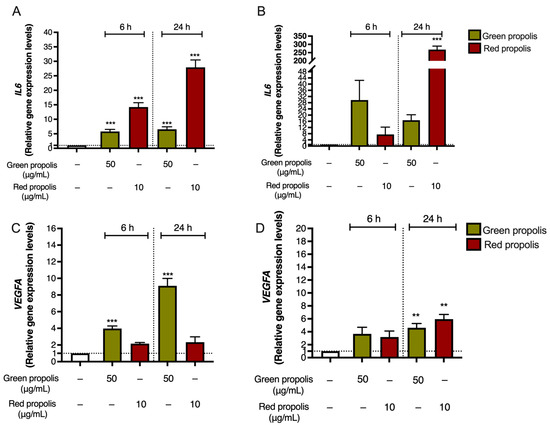
Figure 8.
Gene expression analysis of IL6 (A,B) and VEGFA (C,D) in HaCaT (A,C) and HDF (B,D) cells treated for 6 or 24 h with green and red Brazilian propolis. − means “present”. Dotted line means “cut-off/reference” ** p < 0.01 and *** p < 0.001 versus control (white bar).
IL-6 exerts pleiotropic functions in inflammation, and it is also involved in complex events related to tissue remodeling and fibrosis, not only at the skin level. It generally demonstrates its effects in the initial phases of wound healing, making it favorable for a successful outcome: in fact, IL-6 is a key modulator of the inflammatory and reparative process involved in the differentiation, activation, and proliferation of leukocytes, endothelial cells, keratinocytes, and fibroblasts [42]. Moreover, it is also crucial for the formation of new vessels and collagen deposition. Notably, IL-6 knockout mice show a delay in wound healing [43].
Based on these observations, at this step of our work, we wondered whether Brazilian propolis might sustain the production of other inflammatory markers involved in tissue remodeling, such as VEGF. Thus, the expression of VEGFA was investigated by qPCR in HaCaT and HDF cells to parallel previous data regarding IL6.
In both cell lines (Figure 8C,D), Brazilian propolis extracts induced a significant overexpression of VEGFA, thus sustaining our initial hypothesis. However, results differed from those obtained for IL6, since the acme of VEGF induction in HaCaT cells was detected after 24 h of treatment with green propolis.
Moreover, the amount of VEGF released in the culture medium was measured at 24 h by ELISA to determine whether the secretion paralleled the overexpression detected by qPCR. In HaCaT cells (Figure 9), only the highest concentration tested, which was the same as that used in the previous experiments, caused a significant increase in VEGF release. In HDF, unexpectedly, no secretion could be detected.
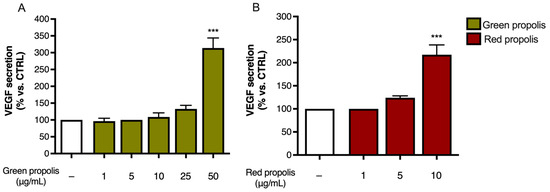
Figure 9.
Assessment of green (A) and red (B) Brazilian propolis effect on VEGF release in HaCaT cells. Cells were treated for 24 h with increasing propolis concentrations. Data is expressed as a percentage of the control, which was arbitrarily assigned the value of 100%. − means “present”. *** p < 0.001 vs. control (white bar).
The modulation of inflammatory markers determined by propolis extracts drew our attention to other biological mechanisms relevant to tissue remodeling, such as the modulation of oxidative stress. As mentioned, the antioxidant activity of propolis against UV-induced skin damage has already been reported. However, considering the role of IL-6 and VEGF in promoting oxidative stress, our findings could suggest that propolis extracts might paradoxically act in a pro-oxidant manner.
For this reason, intracellular ROS production was measured in HaCaT cells challenged with H2O2 (1 mM), according to a previous experimental paradigm in which oxidative damage had been correlated with VEGF production [36]. Intriguingly, ROS levels were significantly reduced by the same concentrations of propolis extracts responsible for VEGF induction (Figure 10), thus confirming the coexistence of antioxidant effects.
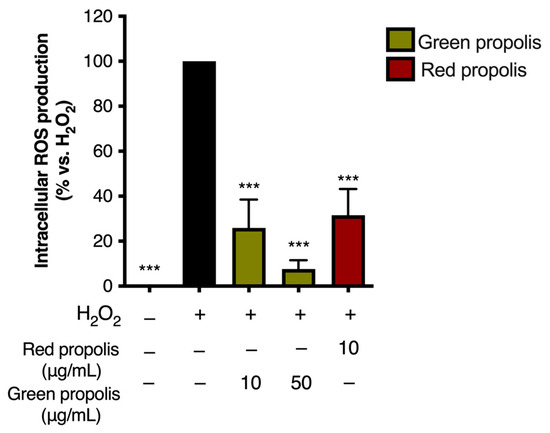
Figure 10.
Assessment of green and red Brazilian propolis effect on ROS production in HaCaT cells. Cells were treated for 24 h with propolis extracts; then, cells were challenged with a pro-oxidant stimulus (H2O2, 1 mM) for 1 h. Data are expressed as a percentage of the stimulus, which was arbitrarily assigned the value of 100%. − means “present” and + means “absent”. *** p < 0.001 vs. H2O2.
3.7. Effect on HIF-1α Stabilization—Immunocytochemistry
As previously mentioned, the transcription factor HIF-1 is widely involved in the expression of several genes playing a role in inflammation, tissue remodeling, and wound healing. VEGFA is a well-known target gene downstream of HIF-1 activation [44]. Notably, other authors have investigated the role of hypoxia in triggering the expression of several inflammatory markers in HaCaT cells, reporting an increased expression of VEGF and IL-6 [45].
Therefore, we speculated on the role of green and red Brazilian propolis in the activation of HIF-1 in keratinocytes and fibroblasts, focusing on the stabilization of the HIF-1α subunit, which was investigated through fluorescent immunocytochemistry in confocal microscopy. HaCaT and HDF cells were treated in a time course for 1–3–6–24 h with green or red propolis extracts at the highest common non-toxic concentrations of 50 and 10 μg/mL, respectively, to allow for direct comparability. Dimethyloxalylglycine (DMOG) was used as a reference inducer of HIF-1α stabilization. Controls, as expected, show the absence of HIF-1α, which, in normal conditions, undergoes rapid degradation with a half-life of less than 10 min [46]. On the other hand, when cells are treated with DMOG, the activity of HIF-prolyl hydroxylases is impaired, thus leading to the accumulation of HIF-1α in the cytoplasm and promoting its prompt translocation to the nucleus, where it can be detected by immunofluorescence. At 1 and 3 h, no sign of translocation could be detected, whereas the most interesting results have been obtained at 6 and 24 h.
In HaCaT cells at 6 h (Figure 11) and 24 h (Figure 12), both green and red propolis determined a significant nuclear accumulation of HIF-1α, indicating the ability to induce HIF-1 transcriptional activity.
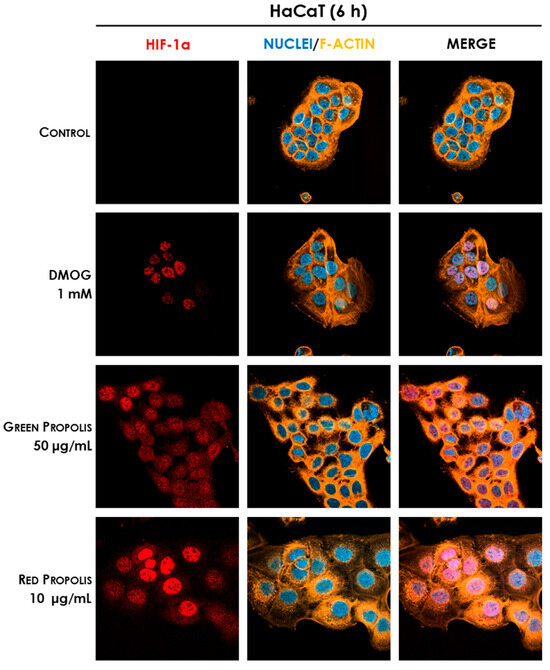
Figure 11.
Representative confocal micrographs of the fluorescent immunostaining of HIF-1α (red) to assess the effect of Brazilian propolis on HIF-1α stabilization and nuclear translocation in HaCaT cells after 6 h of treatment (magnification 60×, 50 μm scale). Nuclei were stained with DAPI (blue), whereas F-actin was stained with TRITC-phalloidin (orange).
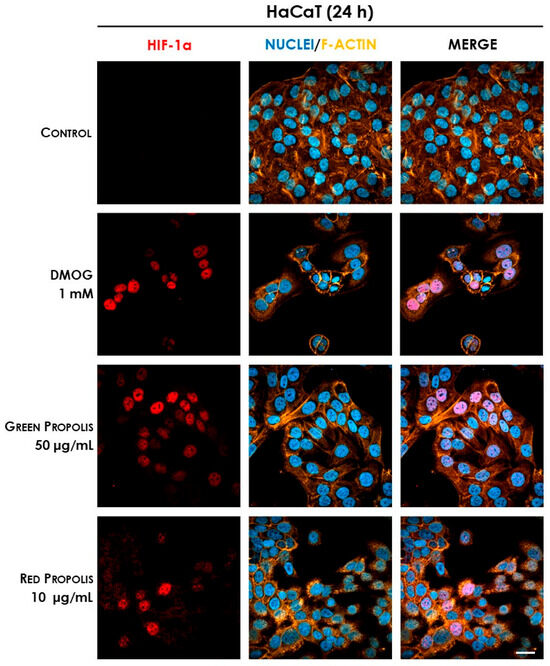
Figure 12.
Representative confocal micrographs of the fluorescent immunostaining of HIF-1α (red) to assess the effect of Brazilian propolis on HIF-1α stabilization and nuclear translocation in HaCaT cells after 24 h of treatment (magnification 60×, 50 μm scale). Nuclei were stained with DAPI (blue), whereas F-actin was stained with TRITC-phalloidin (orange).
In HDF cells at 6 h (Figure 13), only the reference inducer DMOG caused an appreciable nuclear translocation of HIF-1α, while propolis seemed to be inactive. However, at 24 h (Figure 14), red propolis proved to be capable of inducing a significant stabilization and nuclear translocation of the transcription factor subunit, whereas green propolis remained inactive in this cell line.
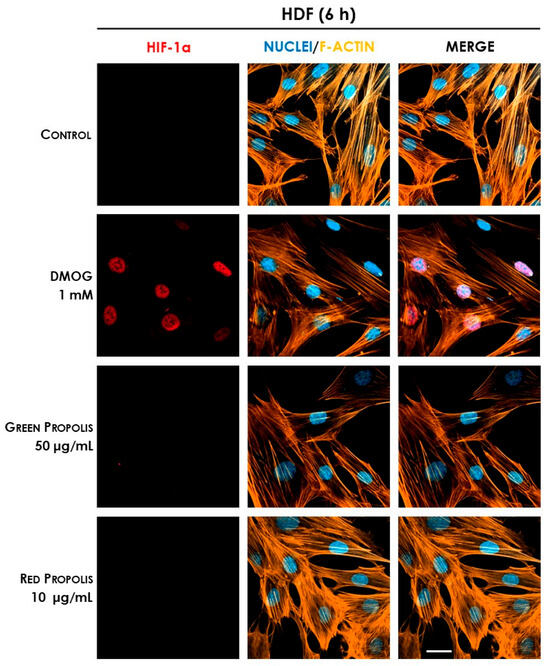
Figure 13.
Representative confocal micrographs of the fluorescent immunostaining of HIF-1α (red) to assess the effect of Brazilian propolis on HIF-1α stabilization and nuclear translocation in HDF cells after 6 h of treatment (magnification 60×, 50 μm scale). Nuclei were stained with DAPI (blue), whereas F-actin was stained with TRITC-phalloidin (orange).
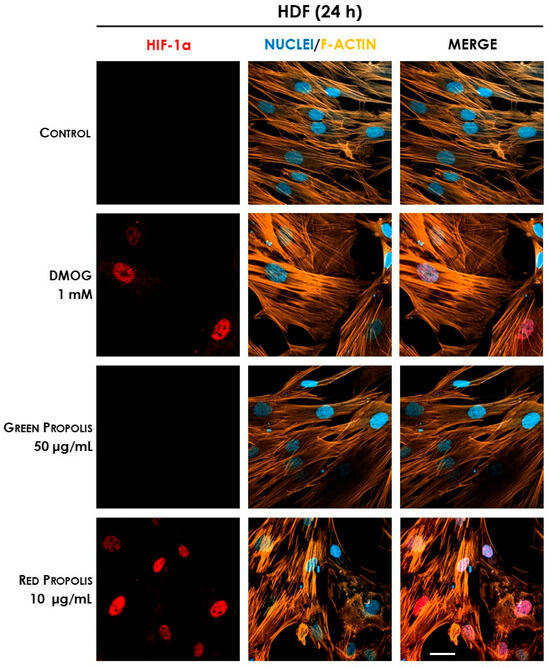
Figure 14.
Representative confocal micrographs of the fluorescent immunostaining of HIF-1α (red) to assess the effect of Brazilian propolis on HIF-1α stabilization and nuclear translocation in HDF cells after 24 h of treatment (magnification 60×, 50 μm scale). Nuclei were stained with DAPI (blue), whereas F-actin was stained with TRITC-phalloidin (orange).
4. Discussion
Propolis is a multifaceted bee product that has been traditionally used to treat infectious disorders, including those occurring at the skin level [2]. Its therapeutic properties, known since ancient times, are currently experiencing a renewed and deserved interest in pharmacological research. “Propolis” is an umbrella term used to define a complex product, which is only outwardly uniform in features, macroscopic appearance, and composition, but has dramatic diversity in molecular components due to the geographical area of origin, the botanical species present around the apiary, and the climatic conditions at the collection time [37]. Moreover, the methods of extraction from the raw material might also influence the final composition, leading to highly diverse propolis extracts. Despite the extreme chemical variability, which inevitably poses serious issues about product standardization, different propolis types generally share pharmacological properties in terms of antioxidant, antimicrobial, anti-inflammatory, and immunomodulatory activities [3,4,5], which constitute the primary motivation for its therapeutic exploitation. Beyond the multifariousness of propolis composition, a common thread unites samples with similar biological activities: the presence of high concentrations of flavonoids or phenolic acids. To overcome propolis’ inherent diversity and facilitate research in this field, many efforts have been made to classify and characterize propolis varieties according to their geographical origin and physical–chemical properties. Two of the varieties that are generating greater interest are green and red Brazilian propolis, which are native to diametrically opposed regions of Brazil and foraged from different botanical sources, known as Baccharis dracunculifolia DC. and Dalbergia ecastaphyllum (L.) Taub., respectively [7,8]. The most innovative field of application of these propolis varieties is probably the treatment of skin conditions: recent in vivo evidence in rodent models has, in fact, highlighted the protective effects against UV-induced oxidative stress [22,23] and the adjuvant activity in wound healing [13]. However, the modulation of inflammatory pathways at the skin level has been investigated in a few articles [47,48].
The research, to address the objective of the present work, has been conducted on multiple fronts to elucidate potential differences and strengths of the two extracts under study. A thorough chemical characterization, carried out with different and complementary chromatographic techniques, allowed the identification of numerous compounds present in green and red Brazilian propolis. The results of the analyses indicated artepillin C (8.5%, relative abundance) and drupanin (3.6%, relative abundance) as the main components of green propolis, whereas vestitol (14.6%, relative abundance), medicarpin (9.73%, relative abundance), and neovestitol (7.52%, relative abundance) were the most abundant in red propolis, thus confirming the evidence already reported in the literature [49]. This characterization confirmed the higher flavonoid content of red propolis, while in green propolis, the amount of flavonoid appears limited in favor of higher amounts of prenylated derivatives of phenolic acids. A considerable total phenolic content was demonstrated in both samples through the Folin–Ciocâlteu assay, which was significantly higher in red propolis, consistent with the work of Machado et al., who demonstrated that, among other varieties of Brazilian propolis, red propolis presented the highest phenolic content [50]. There is, in fact, a close correlation between the antioxidant capacity and the molecular structure of phenolic compounds, which was also reflected in the ORAC test (Table 2 and Table 3).
The biological activities have been investigated in two in vitro models of stable human cell lines representative of the principal actors involved in the process of wound healing, HaCaT keratinocytes and HDF dermal fibroblasts. Preliminary studies, assessing mitochondrial function and intracellular lactate dehydrogenase release, have been conducted to determine the cytotoxicity of the extracts and define treatment concentrations for subsequent experiments (Figures S6 and S7). Green propolis did not induce cytotoxic effects up to 50 μg/mL and 24 h of treatment. On the other hand, red propolis showed, in HaCaT cells, prodromal toxicity signs at the highest concentration at 6 h, which became fully manifested at 24 h, limiting the maximum usable concentration to 10 μg/mL at longer time points. According to the literature data, cytotoxic effects have been attributed to the elevated isoflavone content [51]. Nevertheless, a putative protein synthesis inhibitory mechanism has been excluded based on the results of the O-propargyl-puromycin assay.
The anti-inflammatory properties of green and red Brazilian propolis, although being quite well-established in [52], have never been explored in keratinocytes or in dermal fibroblasts. Consequently, the ability to inhibit NF-κB-driven transcription, representative of one of the principal pathways involved in skin inflammatory processes, has been extensively evaluated in HaCaT and HDF cells (Figure 4 and Figure 5). In HaCaT cells, both extracts, with red propolis in a much more significant manner, were active in inhibiting the activation of NF-κB under TNF-α pro-inflammatory stimulation. In HDF cells, the effect was less pronounced and manifested with a certain significance only for red propolis at the highest concentration tested. The ability to inhibit NF-κB-driven transcription under another pro-inflammatory stimulus, IL-1β, was further examined; however, it was only examined in HaCaT cells since this cytokine could not elicit NF-κB activation in HDF cells. These data suggested that the higher presence of polyphenols in red propolis might be responsible for both the anti-inflammatory and the cytotoxic effects observed at higher concentrations.
The NF-κB pathway is implicated in the downstream modulation of the expression of several inflammatory chemokines and cytokines, including IL-8 and IL-6. IL-8 and IL-6 are expressed in the cutis during inflammation, but an excessive or prolonged secretion is correlated with the chronicization of cutaneous injuries [53]. In line with NF-κB impairment, red propolis exerted a significant inhibitory effect on IL-8 release in both HaCaT and, to a greater extent, HDF cells under TNF-α pro-inflammatory stimulation, thus confirming the anti-inflammatory properties previously inferred (Figure 6). On the other hand, a limited or no effect was seen in the case of green propolis. Once again, the greater efficacy of red propolis emerging from these results is probably associated with the higher phenolic content and especially with the presence of flavonoids [54].
Surprisingly, both propolis samples were able to increase the expression of the IL6 gene in basal conditions (Figure 8), paralleled by an increase in cytokine secretion levels only in the presence of a pro-inflammatory stimulus (Figure 7) but not in the absence of stimulation. This is particularly interesting considering that the favorable involvement in the initial phases of cutaneous repair of IL-6, which exerts a proliferative effect on keratinocytes, is a chemoattractant for neutrophils, and may play a role in collagen deposition and angiogenesis [42]. Notably, previous research demonstrated that IL6 knockout mice present a significant delay in wound healing [43]. We further noticed that Brazilian green and red propolis can enhance VEGF expression in HaCaT cells (Figure 8 and Figure 9). These results are concordant with published studies ascribing wound healing properties to polyphenols featuring antioxidant effects and promoting activity on growth factors such as VEGF [55]. Moreover, they are in line with other works supporting the wound healing properties of Brazilian propolis [19,20,21]. Notably, these modulatory effects on inflammatory mediators were paralleled by the reduction in ROS levels, which, again, suggested a favorable antioxidant activity in tissue remodeling (Figure 10).
The putative molecules possibly responsible for the aforementioned anti-inflammatory activities may be recognized for red propolis in vestitol, which is able to inhibit the release of chemokines and the migration of neutrophils in the inflammatory site, and neovestitol, which modulates the NO pathway to inhibit leukocyte recruitment [56]. However, apart from this evidence, activities on the transcription factor NF-κB analogous to those demonstrated in this work have never been reported nor related to any specific component. For green propolis, the ability to modulate the NF-κB pathway, and consequently inhibit the production of prostaglandin E2 and nitric oxide, has been previously demonstrated for the main component artepillin C [57]. All of these molecules have been identified in the propolis samples considered in this study and, on the basis of their relative abundance, were found to be the principal characterizing compounds and, therefore, the main candidates for the attribution of the anti-inflammatory activities observed.
Polyphenols from other sources are known to interfere not only with NF-κB, but also with other pathways involved in cell metabolism, such as the HIF-1 pathway [24,25,58]. HIF-1 is a heterodimer composed of an oxygen-regulated alpha subunit, the stability of which is enhanced by hypoxia through the inhibition of prolyl hydroxylases responsible for post-translational modifications involved in ubiquitination and proteasomal degradation, and a constitutively expressed beta subunit. The HIF-1 transcription factor is able to induce the expression of genes that promote cell survival, re-establish tissue oxygenation (e.g., VEGFA [44]), and sustain glycolytic metabolism to produce ATP under oxygen shortage [59]. It has been recently demonstrated that the hypoxia-independent induction of HIF-1 activity, obtained with the pharmacological inhibition of HIF-prolyl hydroxylases, evokes a regenerative phenotype in mammals [60] and may therefore influence cell survival, wound closure, and tissue regeneration, suggesting that targeting this pathway can improve the wound healing process [60,61,62]. In addition, prolyl hydroxylase inhibitors such as the iron chelating agents deferoxamine and deferiprone, are successfully used for the treatment of difficult-to-heal diabetic and pressure ulcers [63,64].
Thus, the final part of our work was aimed at demonstrating the plausible involvement of HIF-1 in the mechanisms of action previously elucidated. Initial screening immunocytochemistry experiments have demonstrated that both propolis samples are able to induce the stabilization and nuclear translocation of HIF-1α in HaCaT cells, while only red propolis seems to be active at 24 h in HDF cells (Figure 11, Figure 12, Figure 13 and Figure 14). These results showed a greater activity of green propolis in HaCaT cells and reconfirmed that, in HDF cells, only red propolis is active and at longer time points. Notably, in HDF cells, the effect on HIF-1α stabilization appeared temporally disjoint from that of the reference compound DMOG, thus suggesting different underlying molecular mechanisms.
To have a better understanding of the situation, the experiments investigating VEGFA and IL6 expression were repeated using DMOG as a reference compound, thus sustaining the link between HIF-1α stabilization and inflammatory modulation (Figure S8). It was noteworthy that VEGFA expression, but not IL6, was significantly increased by DMOG treatment in both cell lines, thus introducing an element of complexity, suggesting that HIF-1 could only partially explain the modulatory effects of propolis. Accordingly, DMOG showed only a mild inhibitory effect on NF-κB activation compared to red propolis extract (Figure S9). Similar evidence was reported by other authors, who demonstrated that the stabilization of the isoforms HIF-1α and HIF-2α, both active under hypoxic conditions, exacerbated the TNF-α-induced increase in VEGF and IL-6, while decreasing the levels of TSLP, despite their common dependency on the NF-κB pathway [45].
To simplify the comparison among the biological effects of red and green Brazilian propolis and DMOG, the direction of the overall effects is reported in Table 8.
Table 8.
Comparison between the biological effects of Brazilian propolis and HIF-1α stabilizer DMOG, demonstrated in HaCaT and HDF cells.
5. Conclusions
This experimental work investigated both the phytochemical composition of two Brazilian propolis samples and their biological activity at the skin level. The complex activity on inflammatory and proliferative mediators (IL-8, IL-6, and VEGF), observed in human keratinocytes and fibroblasts, is correlated with the divergent modulation of the transcription factors NF-κB and HIF-1. Plausibly, bioactive concentrations considered in the study (10–50 μg/mL) may be achieved after topical application of milligrams of propolis in animals and human studies. Collected data may contribute to strengthening the biological rationale behind the traditional use of Brazilian propolis in inflammatory disorders associated with skin lesions. More specifically, the biological properties of Brazilian propolis may influence skin repair through immunomodulatory mechanisms in addition to classical antimicrobial effects. These results may inform the design of future studies, in which the range of concentrations used in the present work would be easily translated to address in vivo safety and efficacy.
Supplementary Materials
The following supporting information can be downloaded at: https://www.mdpi.com/article/10.3390/biomedicines13092229/s1, Figure S1. Comparison of HPLC-UV/PDA and MS/TOF chromatograms of green propolis. Numbers indicate the principal peaks identified by spectroscopic and spectrophotometric parameters. Figure S2. Comparison of HPLC-UV/PDA and MS/TOF chromatograms of red propolis. Numbers indicate the principal peaks identified by spectroscopic and spectrophotometric parameters. Figure S3. Structures of the main compounds identified in green propolis through HPLC-ESI-MS: p-coumaric acid (1), di-O-caffeoylquinic acid (2, 3), drupanin (4), kaempferide (6), dimethylquercetin (7), artepillin C (8), and baccharin (9). Figure S4. Structures of the main compounds identified in red propolis through HPLC-ESI-MS: liquiritigenin/isoliquiritigenin (1), formononetin/isoformononetin (2), vestitol/neovesitol (3, 4), medicarpin (5), guttiferone (6, 7), and nemorosone (8). Figure S5. TOF mass spectrum of neovestitol/vestitol. The molecular peak has an m/z of 271.0972 [M-H]-, the dimer peak has an m/z of 543.2020 [M-H]-. Figure S6. Assessment of green and red Brazilian propolis effect on HaCaT (A, B) and HDF (C, D) cell viability through MTT and LDH assays. Cells were treated for 6 h in the presence of increasing propolis concentrations. Data is expressed as a percentage of the control, which was arbitrarily assigned the value of 100%. ** p < 0.01 versus control. Figure S7. Assessment of green and red Brazilian propolis effect on HaCaT (A) and HDF (B) cell viability through LDH assay. Cells were treated for 24 h in the presence of increasing propolis concentrations. Data is expressed as a percentage of the control, which was arbitrarily assigned the value of 100%. *** p < 0.001 versus control. Figure S8. Gene expression analysis of IL6 (A, B) and VEGFA (C, D) in HaCaT (A, C) and HDF (B, D) cells treated for 6 or 24 h with DMOG (1 mM). * p < 0.05, ** p < 0.01, and *** p < 0.001 versus control. Figure S9. Assessment of DMOG effect on NF-κB-driven transcription in HaCaT cells. Cells were stimulated with 10 ng/mL of IL-1β and treated for 6 h with DMOG (1 mM). Data are expressed as a percentage of the stimulus, which was arbitrarily assigned the value of 100%. *** p < 0.001 versus IL-1β.
Author Contributions
Conceptualization, A.M., G.B., S.P., M.D., and E.S.; methodology, A.M., G.B., S.P., G.M., and M.F.; investigation, A.M., G.M., G.B., and S.P.; data curation, A.M., G.M., G.B., and S.P.; writing—original draft preparation, A.M. and S.P.; writing—review and editing, A.M., N.M., C.P., M.F., G.B., S.P., M.D., and E.S.; supervision, M.D. and E.S.; funding acquisition, M.D., E.S., and G.B. All authors have read and agreed to the published version of the manuscript.
Funding
This research was supported by grants from MIUR “Progetto Eccellenza 2023–2027”.
Institutional Review Board Statement
Not applicable.
Informed Consent Statement
Not applicable.
Data Availability Statement
Data are available upon request to the corresponding author (stefano.piazza@unimi.it).
Acknowledgments
The manuscript is based on the experimental Ph.D. thesis of Magnavacca, published through the Institutional portal of the University of Milan at the link https://air.unimi.it/retrieve/d1a39fa7-221d-4b73-a5b2-b6d1e5a71f7e/phd_unimi_R12574.pdf. (accessed on 9 September 2025) The authors thank Petra Boukamp and Norbert Fusenig from the Deutsches Krebsforschungszentrum, Stiftung des öffentlichen Rechts (German Cancer Research Center), Im Neuenheimer Feld 280, D-69120 Heidelberg, Germany, for providing the HaCaT cell line. Part of this work was carried out in UNITECH COSPECT, an advanced spectroscopy core facility established by the Università degli Studi di Milano.
Conflicts of Interest
The authors declare no conflicts of interest.
References
- Silva-Carvalho, R.; Baltazar, F.; Almeida-Aguiar, C. Propolis: A Complex Natural Product with a Plethora of Biological Activities That Can Be Explored for Drug Development. Evid. Based Complement. Alternat. Med. 2015, 2015, 206439. [Google Scholar] [CrossRef] [PubMed]
- Pereira, R.F.; Bartolo, P.J. Traditional Therapies for Skin Wound Healing. Adv. Wound Care 2016, 5, 208–229. [Google Scholar] [CrossRef]
- Grange, J.M.; Davey, R.W. Antibacterial properties of propolis (bee glue). J. R. Soc. Med. 1990, 83, 159–160. [Google Scholar] [CrossRef]
- Daleprane, J.B.; Abdalla, D.S. Emerging roles of propolis: Antioxidant, cardioprotective, and antiangiogenic actions. Evid. Based Complement. Alternat. Med. 2013, 2013, 175135. [Google Scholar] [CrossRef] [PubMed]
- Sforcin, J.M. Propolis and the immune system: A review. J. Ethnopharmacol. 2007, 113, 1–14. [Google Scholar] [CrossRef]
- Daugsch, A.; Moraes, C.S.; Fort, P.; Park, Y.K. Brazilian red propolis—chemical composition and botanical origin. Evid. Based Complement. Alternat. Med. 2008, 5, 435–441. [Google Scholar] [CrossRef] [PubMed]
- Park, Y.K.; Alencar, S.M.; Aguiar, C.L. Botanical origin and chemical composition of Brazilian propolis. J. Agric. Food Chem. 2002, 50, 2502–2506. [Google Scholar] [CrossRef]
- Piccinelli, A.L.; Lotti, C.; Campone, L.; Cuesta-Rubio, O.; Campo Fernandez, M.; Rastrelli, L. Cuban and Brazilian red propolis: Botanical origin and comparative analysis by high-performance liquid chromatography-photodiode array detection/electrospray ionization tandem mass spectrometry. J. Agric. Food Chem. 2011, 59, 6484–6491. [Google Scholar] [CrossRef]
- Salatino, A.; Teixeira, E.W.; Negri, G.; Message, D. Origin and Chemical Variation of Brazilian Propolis. Evid. Based Complement. Alternat. Med. 2005, 2, 33–38. [Google Scholar] [CrossRef]
- Banskota, A.H.; Tezuka, Y.; Midorikawa, K.; Matsushige, K.; Kadota, S. Two novel cytotoxic benzofuran derivatives from Brazilian propolis. J. Nat. Prod. 2000, 63, 1277–1279. [Google Scholar] [CrossRef]
- Szliszka, E.; Kucharska, A.Z.; Sokol-Letowska, A.; Mertas, A.; Czuba, Z.P.; Krol, W. Chemical Composition and Anti-Inflammatory Effect of Ethanolic Extract of Brazilian Green Propolis on Activated J774A.1 Macrophages. Evid. Based Complement. Alternat. Med. 2013, 2013, 976415. [Google Scholar] [CrossRef]
- Shahinozzaman, M.; Basak, B.; Emran, R.; Rozario, P.; Obanda, D.N. Artepillin C: A comprehensive review of its chemistry, bioavailability, and pharmacological properties. Fitoterapia 2020, 147, 104775. [Google Scholar] [CrossRef]
- Jacob, A.; Parolia, A.; Pau, A.; Davamani Amalraj, F. The effects of Malaysian propolis and Brazilian red propolis on connective tissue fibroblasts in the wound healing process. BMC Complement. Altern. Med. 2015, 15, 294. [Google Scholar] [CrossRef]
- Nani, B.D.; Franchin, M.; Lazarini, J.G.; Freires, I.A.; da Cunha, M.G.; Bueno-Silva, B.; de Alencar, S.M.; Murata, R.M.; Rosalen, P.L. Isoflavonoids from Brazilian red propolis down-regulate the expression of cancer-related target proteins: A pharmacogenomic analysis. Phytother. Res. 2018, 32, 750–754. [Google Scholar] [CrossRef] [PubMed]
- Zulhendri, F.; Chandrasekaran, K.; Kowacz, M.; Ravalia, M.; Kripal, K.; Fearnley, J.; Perera, C.O. Antiviral, Antibacterial, Antifungal, and Antiparasitic Properties of Propolis: A Review. Foods 2021, 10, 1360. [Google Scholar] [CrossRef] [PubMed]
- Bueno-Silva, B.; Marsola, A.; Ikegaki, M.; Alencar, S.M.; Rosalen, P.L. The effect of seasons on Brazilian red propolis and its botanical source: Chemical composition and antibacterial activity. Nat. Prod. Res. 2017, 31, 1318–1324. [Google Scholar] [CrossRef] [PubMed]
- Bachiega, T.F.; Orsatti, C.L.; Pagliarone, A.C.; Sforcin, J.M. The effects of propolis and its isolated compounds on cytokine production by murine macrophages. Phytother. Res. 2012, 26, 1308–1313. [Google Scholar] [CrossRef]
- Washio, K.; Kobayashi, M.; Saito, N.; Amagasa, M.; Kitamura, H. Propolis Ethanol Extract Stimulates Cytokine and Chemokine Production through NF-kappaB Activation in C2C12 Myoblasts. Evid. Based Complement. Alternat. Med. 2015, 2015, 349751. [Google Scholar] [CrossRef]
- Conceicao, M.; Gushiken, L.F.S.; Aldana-Mejia, J.A.; Tanimoto, M.H.; Ferreira, M.V.S.; Alves, A.C.M.; Miyashita, M.N.; Bastos, J.K.; Beserra, F.P.; Pellizzon, C.H. Histological, Immunohistochemical and Antioxidant Analysis of Skin Wound Healing Influenced by the Topical Application of Brazilian Red Propolis. Antioxidants 2022, 11, 2188. [Google Scholar] [CrossRef]
- Nani, M.; Leone, A.; Bom, V.P.; Buszinski, A.F.; Oliveira de Souza, R.; Pinheiro, V.A.; Danapoulos, P.; Swikidisa, R.; Marquele-Oliveira, F.; Frade, M.A.C.; et al. Evaluation and Comparison of Wound Healing Properties of an Ointment (AlpaWash) Containing Brazilian Micronized Propolis and Peucedanum ostruthium Leaf Extract in Skin Ulcer in Rats. Int. J. Pharm. Compd. 2018, 22, 154–163. [Google Scholar]
- da Silva Barud, H.; de Araujo Junior, A.M.; Saska, S.; Mestieri, L.B.; Campos, J.A.; de Freitas, R.M.; Ferreira, N.U.; Nascimento, A.P.; Miguel, F.G.; Vaz, M.M.; et al. Antimicrobial Brazilian Propolis (EPP-AF) Containing Biocellulose Membranes as Promising Biomaterial for Skin Wound Healing. Evid. Based Complement. Alternat. Med. 2013, 2013, 703024. [Google Scholar] [CrossRef]
- Saito, Y.; Tsuruma, K.; Ichihara, K.; Shimazawa, M.; Hara, H. Brazilian green propolis water extract up-regulates the early expression level of HO-1 and accelerates Nrf2 after UVA irradiation. BMC Complement. Altern. Med. 2015, 15, 421. [Google Scholar] [CrossRef]
- Yoshino, Y.; Marunaka, K.; Kobayashi, M.; Matsunaga, H.; Shu, S.; Matsunaga, T.; Ikari, A. Protective Effects of Ethanol Extract of Brazilian Green Propolis and Apigenin against Weak Ultraviolet Ray-B-Induced Barrier Dysfunction via Suppressing Nitric Oxide Production and Mislocalization of Claudin-1 in HaCaT Cells. Int. J. Mol. Sci. 2021, 22, 10326. [Google Scholar] [CrossRef]
- Juchaux, F.; Sellathurai, T.; Perrault, V.; Boirre, F.; Delannoy, P.; Bakkar, K.; Albaud, J.; Gueniche, A.; Cheniti, A.; Dal Belo, S.; et al. A combination of pyridine-2, 4-dicarboxylic acid diethyl ester and resveratrol stabilizes hypoxia-inducible factor 1-alpha and improves hair density in female volunteers. Int. J. Cosmet. Sci. 2020, 42, 167–173. [Google Scholar] [CrossRef]
- Mirossay, L.; Varinska, L.; Mojzis, J. Antiangiogenic Effect of Flavonoids and Chalcones: An Update. Int. J. Mol. Sci. 2017, 19, 27. [Google Scholar] [CrossRef]
- Solis, E.R.; Jameson, J.M. Skin deep: Epithelial cell metabolism and chronic skin inflammation. Immunity 2024, 57, 1451–1453. [Google Scholar] [CrossRef]
- Manresa, M.C.; Taylor, C.T. Hypoxia Inducible Factor (HIF) Hydroxylases as Regulators of Intestinal Epithelial Barrier Function. Cell. Mol. Gastroenterol. Hepatology 2017, 3, 303–315. [Google Scholar] [CrossRef]
- Bartels, K.; Grenz, A.; Eltzschig, H.K. Hypoxia and inflammation are two sides of the same coin. Proc. Natl. Acad. Sci. USA 2013, 110, 18351–18352. [Google Scholar] [CrossRef] [PubMed]
- Papandreou, I.; Cairns, R.A.; Fontana, L.; Lim, A.L.; Denko, N.C. HIF-1 mediates adaptation to hypoxia by actively downregulating mitochondrial oxygen consumption. Cell Metab. 2006, 3, 187–197. [Google Scholar] [CrossRef] [PubMed]
- Eltzschig, H.K.; Sitkovsky, M.V.; Robson, S.C. Purinergic signaling during inflammation. N. Engl. J. Med. 2012, 367, 2322–2333. [Google Scholar] [CrossRef]
- Rosenberger, P.; Schwab, J.M.; Mirakaj, V.; Masekowsky, E.; Mager, A.; Morote-Garcia, J.C.; Unertl, K.; Eltzschig, H.K. Hypoxia-inducible factor-dependent induction of netrin-1 dampens inflammation caused by hypoxia. Nat. Immunol. 2009, 10, 195–202. [Google Scholar] [CrossRef]
- Pastar, I.; Stojadinovic, O.; Yin, N.C.; Ramirez, H.; Nusbaum, A.G.; Sawaya, A.; Patel, S.B.; Khalid, L.; Isseroff, R.R.; Tomic-Canic, M. Epithelialization in Wound Healing: A Comprehensive Review. Adv. Wound Care 2014, 3, 445–464. [Google Scholar] [CrossRef]
- Hattori, H.; Okuda, K.; Murase, T.; Shigetsura, Y.; Narise, K.; Semenza, G.L.; Nagasawa, H. Isolation, identification, and biological evaluation of HIF-1-modulating compounds from Brazilian green propolis. Bioorg. Med. Chem. 2011, 19, 5392–5401. [Google Scholar] [CrossRef]
- Davalos, A.; Gomez-Cordoves, C.; Bartolome, B. Extending applicability of the oxygen radical absorbance capacity (ORAC-fluorescein) assay. J. Agric. Food Chem. 2004, 52, 48–54. [Google Scholar] [CrossRef] [PubMed]
- Magnavacca, A.; Piazza, S.; Cammisa, A.; Fumagalli, M.; Martinelli, G.; Giavarini, F.; Sangiovanni, E.; Dell’Agli, M. Ribes nigrum Leaf Extract Preferentially Inhibits IFN-gamma-Mediated Inflammation in HaCaT Keratinocytes. Molecules 2021, 26, 3044. [Google Scholar] [CrossRef]
- Piazza, S.; Martinelli, G.; Vrhovsek, U.; Masuero, D.; Fumagalli, M.; Magnavacca, A.; Pozzoli, C.; Canilli, L.; Terno, M.; Angarano, M.; et al. Anti-Inflammatory and Anti-Acne Effects of Hamamelis virginiana Bark in Human Keratinocytes. Antioxidants 2022, 11, 1119. [Google Scholar] [CrossRef] [PubMed]
- Bankova, V.; Bertelli, D.; Borba, R.; Conti, B.J.; da Silva Cunha, I.B.; Danert, C.; Eberlin, M.N.; Falcão, S.I.; Isla, M.I.; Moreno, M.I.N.; et al. Standard methods for Apis melliferapropolis research. J. Apic. Res. 2016, 58, 1–49. [Google Scholar] [CrossRef]
- Freires, I.A.; Queiroz, V.; Furletti, V.F.; Ikegaki, M.; de Alencar, S.M.; Duarte, M.C.T.; Rosalen, P.L. Chemical composition and antifungal potential of Brazilian propolis against Candida spp. J. Mycol. Med. 2016, 26, 122–132. [Google Scholar] [CrossRef] [PubMed]
- Rohloff, J. Analysis of phenolic and cyclic compounds in plants using derivatization techniques in combination with GC-MS-based metabolite profiling. Molecules 2015, 20, 3431–3462. [Google Scholar] [CrossRef]
- Pellati, F.; Orlandini, G.; Pinetti, D.; Benvenuti, S. HPLC-DAD and HPLC-ESI-MS/MS methods for metabolite profiling of propolis extracts. J. Pharm. Biomed. Anal. 2011, 55, 934–948. [Google Scholar] [CrossRef]
- da Cruz Almeida, E.T.; da Silva, M.C.D.; Oliveira, J.; Kamiya, R.U.; Arruda, R.; Vieira, D.A.; Silva, V.D.C.; Escodro, P.B.; Basilio-Junior, I.D.; do Nascimento, T.G. Chemical and microbiological characterization of tinctures and microcapsules loaded with Brazilian red propolis extract. J. Pharm. Anal. 2017, 7, 280–287. [Google Scholar] [CrossRef]
- Johnson, B.Z.; Stevenson, A.W.; Prele, C.M.; Fear, M.W.; Wood, F.M. The Role of IL-6 in Skin Fibrosis and Cutaneous Wound Healing. Biomedicines 2020, 8, 101. [Google Scholar] [CrossRef]
- Lin, Z.Q.; Kondo, T.; Ishida, Y.; Takayasu, T.; Mukaida, N. Essential involvement of IL-6 in the skin wound-healing process as evidenced by delayed wound healing in IL-6-deficient mice. J. Leukoc. Biol. 2003, 73, 713–721. [Google Scholar] [CrossRef]
- Forsythe, J.A.; Jiang, B.H.; Iyer, N.V.; Agani, F.; Leung, S.W.; Koos, R.D.; Semenza, G.L. Activation of vascular endothelial growth factor gene transcription by hypoxia-inducible factor 1. Mol. Cell Biol. 1996, 16, 4604–4613. [Google Scholar] [CrossRef] [PubMed]
- Tashiro, N.; Segawa, R.; Tobita, R.; Asakawa, S.; Mizuno, N.; Hiratsuka, M.; Hirasawa, N. Hypoxia inhibits TNF-alpha-induced TSLP expression in keratinocytes. PLoS ONE 2019, 14, e0224705. [Google Scholar] [CrossRef] [PubMed]
- Berra, E.; Roux, D.; Richard, D.E.; Pouyssegur, J. Hypoxia-inducible factor-1 alpha (HIF-1 alpha) escapes O2-driven proteasomal degradation irrespective of its subcellular localization: Nucleus or cytoplasm. EMBO Rep. 2001, 2, 615–620. [Google Scholar] [CrossRef]
- Shinmei, Y.; Kagawa, Y.; Yano, H.; Hossen, M.A.; Kamei, C. Effect of topical application of Brazilian propolis on scratching behavior induced by compound 48/80 in mice. Immunopharmacol. Immunotoxicol. 2010, 32, 327–332. [Google Scholar] [CrossRef]
- Correa, F.R.; Schanuel, F.S.; Moura-Nunes, N.; Monte-Alto-Costa, A.; Daleprane, J.B. Brazilian red propolis improves cutaneous wound healing suppressing inflammation-associated transcription factor NFkappaB. Biomed. Pharmacother. 2017, 86, 162–171. [Google Scholar] [CrossRef] [PubMed]
- Alencar, S.M.; Oldoni, T.L.; Castro, M.L.; Cabral, I.S.; Costa-Neto, C.M.; Cury, J.A.; Rosalen, P.L.; Ikegaki, M. Chemical composition and biological activity of a new type of Brazilian propolis: Red propolis. J. Ethnopharmacol. 2007, 113, 278–283. [Google Scholar] [CrossRef]
- Machado, B.A.; Silva, R.P.; de Abreu Barreto, G.; Costa, S.S.; Silva, D.F.; Brandao, H.N.; Rocha, J.L.; Dellagostin, O.A.; Henriques, J.A.; Umsza-Guez, M.A.; et al. Chemical Composition and Biological Activity of Extracts Obtained by Supercritical Extraction and Ethanolic Extraction of Brown, Green and Red Propolis Derived from Different Geographic Regions in Brazil. PLoS ONE 2016, 11, e0145954. [Google Scholar] [CrossRef]
- da Silva, R.O.; Andrade, V.M.; Bulle Rego, E.S.; Azevedo Doria, G.A.; Santos Lima, B.D.; da Silva, F.A.; de Souza Araujo, A.A.; de Albuquerque Junior, R.L.; Cordeiro Cardoso, J.; Zanardo Gomes, M. Acute and sub-acute oral toxicity of Brazilian red propolis in rats. J. Ethnopharmacol. 2015, 170, 66–71. [Google Scholar] [CrossRef] [PubMed]
- Dos Santos, F.F.; Morais-Urano, R.P.; Cunha, W.R.; de Almeida, S.G.; Cavallari, P.; Manuquian, H.A.; Pereira, H.A.; Furtado, R.; Santos, M.F.C.; Amdrade, E.S.M.L. A review on the anti-inflammatory activities of Brazilian green, brown and red propolis. J. Food Biochem. 2022, 46, e14350. [Google Scholar] [CrossRef] [PubMed]
- Iocono, J.A.; Colleran, K.R.; Remick, D.G.; Gillespie, B.W.; Ehrlich, H.P.; Garner, W.L. Interleukin-8 levels and activity in delayed-healing human thermal wounds. Wound Repair. Regen. 2000, 8, 216–225. [Google Scholar] [CrossRef]
- Moise, A.R.; Bobis, O. Baccharis dracunculifolia and Dalbergia ecastophyllum, Main Plant Sources for Bioactive Properties in Green and Red Brazilian Propolis. Plants 2020, 9, 1619. [Google Scholar] [CrossRef]
- Piazza, S.; Fumagalli, M.; Khalilpour, S.; Martinelli, G.; Magnavacca, A.; Dell’Agli, M.; Sangiovanni, E. A Review of the Potential Benefits of Plants Producing Berries in Skin Disorders. Antioxidants 2020, 9, 542. [Google Scholar] [CrossRef]
- Franchin, M.; Colon, D.F.; da Cunha, M.G.; Castanheira, F.V.; Saraiva, A.L.; Bueno-Silva, B.; Alencar, S.M.; Cunha, T.M.; Rosalen, P.L. Neovestitol, an isoflavonoid isolated from Brazilian red propolis, reduces acute and chronic inflammation: Involvement of nitric oxide and IL-6. Sci. Rep. 2016, 6, 36401. [Google Scholar] [CrossRef]
- Paulino, N.; Abreu, S.R.; Uto, Y.; Koyama, D.; Nagasawa, H.; Hori, H.; Dirsch, V.M.; Vollmar, A.M.; Scremin, A.; Bretz, W.A. Anti-inflammatory effects of a bioavailable compound, Artepillin C, in Brazilian propolis. Eur. J. Pharmacol. 2008, 587, 296–301. [Google Scholar] [CrossRef]
- Pozzoli, C.; Martinelli, G.; Fumagalli, M.; Di Lorenzo, C.; Maranta, N.; Colombo, L.; Piazza, S.; Dell’Agli, M.; Sangiovanni, E. Castanea sativa Mill. By-Products: Investigation of Potential Anti-Inflammatory Effects in Human Intestinal Epithelial Cells. Molecules 2024, 29, 3951. [Google Scholar] [CrossRef]
- Semenza, G.L. HIF-1: Upstream and downstream of cancer metabolism. Curr. Opin. Genet. Dev. 2010, 20, 51–56. [Google Scholar] [CrossRef]
- Zhang, Y.; Strehin, I.; Bedelbaeva, K.; Gourevitch, D.; Clark, L.; Leferovich, J.; Messersmith, P.B.; Heber-Katz, E. Drug-induced regeneration in adult mice. Sci. Transl. Med. 2015, 7, 290ra92. [Google Scholar] [CrossRef] [PubMed]
- Botusan, I.R.; Sunkari, V.G.; Savu, O.; Catrina, A.I.; Grunler, J.; Lindberg, S.; Pereira, T.; Yla-Herttuala, S.; Poellinger, L.; Brismar, K.; et al. Stabilization of HIF-1alpha is critical to improve wound healing in diabetic mice. Proc. Natl. Acad. Sci. USA 2008, 105, 19426–19431. [Google Scholar] [CrossRef] [PubMed]
- Kalucka, J.; Ettinger, A.; Franke, K.; Mamlouk, S.; Singh, R.P.; Farhat, K.; Muschter, A.; Olbrich, S.; Breier, G.; Katschinski, D.M.; et al. Loss of epithelial hypoxia-inducible factor prolyl hydroxylase 2 accelerates skin wound healing in mice. Mol. Cell Biol. 2013, 33, 3426–3438. [Google Scholar] [CrossRef]
- Bonham, C.A.; Rodrigues, M.; Galvez, M.; Trotsyuk, A.; Stern-Buchbinder, Z.; Inayathullah, M.; Rajadas, J.; Gurtner, G.C. Deferoxamine can prevent pressure ulcers and accelerate healing in aged mice. Wound Repair. Regen. 2018, 26, 300–305. [Google Scholar] [CrossRef] [PubMed]
- Duscher, D.; Neofytou, E.; Wong, V.W.; Maan, Z.N.; Rennert, R.C.; Inayathullah, M.; Januszyk, M.; Rodrigues, M.; Malkovskiy, A.V.; Whitmore, A.J.; et al. Transdermal deferoxamine prevents pressure-induced diabetic ulcers. Proc. Natl. Acad. Sci. USA 2015, 112, 94–99. [Google Scholar] [CrossRef] [PubMed]


Disclaimer/Publisher’s Note: The statements, opinions and data contained in all publications are solely those of the individual author(s) and contributor(s) and not of MDPI and/or the editor(s). MDPI and/or the editor(s) disclaim responsibility for any injury to people or property resulting from any ideas, methods, instructions or products referred to in the content. |
© 2025 by the authors. Licensee MDPI, Basel, Switzerland. This article is an open access article distributed under the terms and conditions of the Creative Commons Attribution (CC BY) license (https://creativecommons.org/licenses/by/4.0/).