1. Introduction
Atrial fibrillation (AF) is a type of arrhythmia with a heavy health burden all over the world. Statistical results show that the incidence rate is approximately 3% [
1]. AF is a multi-system-related disease. AF is associated with hypertension, coronary heart disease, structural heart disease, hyperthyroidism, chronic obstructive pulmonary disease (COPD), and advanced age. And diabetes is an endocrine disorder that also affects multiple systems. Common complications of diabetes include diabetic angiopathy, diabetic peripheral neuropathy, chronic kidney disease (CKD), and diabetic cardiomyopathy. It is worth noting that diabetes increases the risk of AF. The association between diabetes and AF is, on the one hand, related to comorbidities such as heart failure and hypertension, and on the other hand, involves molecular mechanisms related to inflammation, oxidative stress, and disturbances in glucose and lipid metabolism [
2].
Currently, AF management follows a full-process, integrated, and multidisciplinary approach. As AF progresses with the development of the disease or the mutual promotion of comorbidities, some surgeries and medications may have suboptimal effects. Therefore, prevention, diagnosis, and treatment targeting the risk factors and high-risk characteristics of AF are crucial for effective AF management [
3,
4,
5]. Furthermore, the liquid chromatography–mass spectrometry (LC–MS) approach offers an effective method for identifying low molecular weight substances that are not typically tested in routine hospital examinations and for identifying specific biomarkers for the management of AF and its comorbidities [
6].
There are many existing studies on risk prediction models for AF, with models such as the C
2HEST score being based on clinical characteristics [
7]. There are also models developed using machine learning and multi-omics technologies; however, these models often face challenges in clinical application and widespread adoption due to the black-box nature of machine learning or the difficulties in collecting multi-omics data [
8,
9]. In addition, there is a lack of personalized management strategies aimed at identifying high-risk AF individuals within the diabetic population. Meanwhile, there is a lack of explanation and analysis of the comorbid relationships and pathophysiological mechanisms between AF and its risk factors, as well as a lack of summary and comparison of features from different modeling approaches.
The process of this study was as follows: (1) the AFDB score (the nomogram) was developed and tested for predicting AF risk in diabetic patients using NHANES data, with subsequent validation using data from Tongji Hospital. The association between the AFDB score and survival prognosis was also evaluated in the National Death Index (NDI) cohort, and its predictive value for AF recurrence after radiofrequency ablation was examined in diabetic patients at our hospital [
10,
11]; (2) untargeted plasma metabolomics analysis was performed on diabetic patients with and without AF at our hospital.
In conclusion, this study provided two approaches to identify high-risk AF in diabetic patients, discussed the underlying pathophysiological mechanisms, and compared their characteristics and applications.
2. Materials and Methods
2.1. Inclusion and Exclusion of the Population and Data Collection
The NHANES is a large, comprehensive, and representative research project aimed at assessing the health and nutritional status of U.S. adults and children. The website is:
https://wwwn.cdc.gov/nchs/nhanes/Default.aspx (accessed on 1 December 2024).
First, in all NHANES datasets, following this search and inclusion-exclusion process, a total of 257 diabetic patients with AF from the 1999–2020 NHANES dataset were selected as the case group. In the 1999–2000, 2001–2002, and 2009–2010 datasets, 1683 diabetic patients without AF were included as the control group. The NHANES dataset population was used as the training set for score development. The variables involved in the inclusion and exclusion process of the NHANES, the variables used to collect basic information of the NHANES, and the variables in the NDI dataset were provided in the
Appendix A,
Table A1.
Additionally, a hospital data processing and application platform developed by Yidu Cloud Technology Co., Ltd. (Beijing, China) was used to search, include, and exclude subjects in case groups (diabetic patients with AF) and control groups (diabetic patients without AF) at Tongji Hospital, based on admission dates and discharge diagnoses. A total of 911 diabetic patients with AF from 2023 and 2819 diabetic patients without AF from December 2023 were included in the dataset. This part was used as the test dataset.
In the NHANES, we gathered relevant data for the corresponding population. Detailed definitions of the variables could be found on the NHANES website. For categorical data, we collected the following variables: gender, ethnicity, hypertension, infection, chronic bronchitis, hyperlipidemia, CKD, anemia, hyperthyroidism, coronary heart disease, stroke, hepatic insufficiency, and New York Heart Association II~IV (NYHA II~IV). For continuous data, we collected the following variables: age, body mass index (BMI), glycated hemoglobin (HbA1c), systolic and diastolic blood pressure, leucocytes, neutrophils, lymphocytes, platelets, C-reactive protein (CRP), triglycerides, low-density lipoprotein cholesterol (LDL-C), high-density lipoprotein cholesterol (HDL-C), total cholesterol (TC), creatinine, hemoglobin, free thyroxine (FT4), thyroid stimulating hormone (TSH), alanine aminotransferase (ALT), and N-terminal pro B-type natriuretic peptide (NT-proBNP). Mortality status and follow-up time were obtained from the NDI records linked to NHANES, available at:
https://www.cdc.gov/nchs/data-linkage/mortality-public.htm (accessed on 1 December 2024). The missing data statistics for the training set were summarized in the
Appendix A,
Table A2 for reference.
Additionally, we used the Yidu Cloud platform to retrieve data from relevant populations at Tongji Hospital, Huazhong University of Science and Technology. Information such as admission date, gender, age, ethnicity, and discharge diagnosis were collected. As the data from 2023 was relatively recent, the medical records were complete, and no missing values were found in the test set for this study.
2.2. Statistical Analysis, Score Design, and Test
In the case of directly deleting missing values, we performed group comparisons of baseline data from the NHANES dataset. For continuous data, the correlation analysis between the two groups was based on the U test, while the correlation analysis for categorical data was based on the chi-square test. To facilitate regression analysis, we imputed the missing values in the population data before conducting logistic regression. For continuous data, missing values were imputed with the mean. For binary categorical data, missing values were imputed with 0.
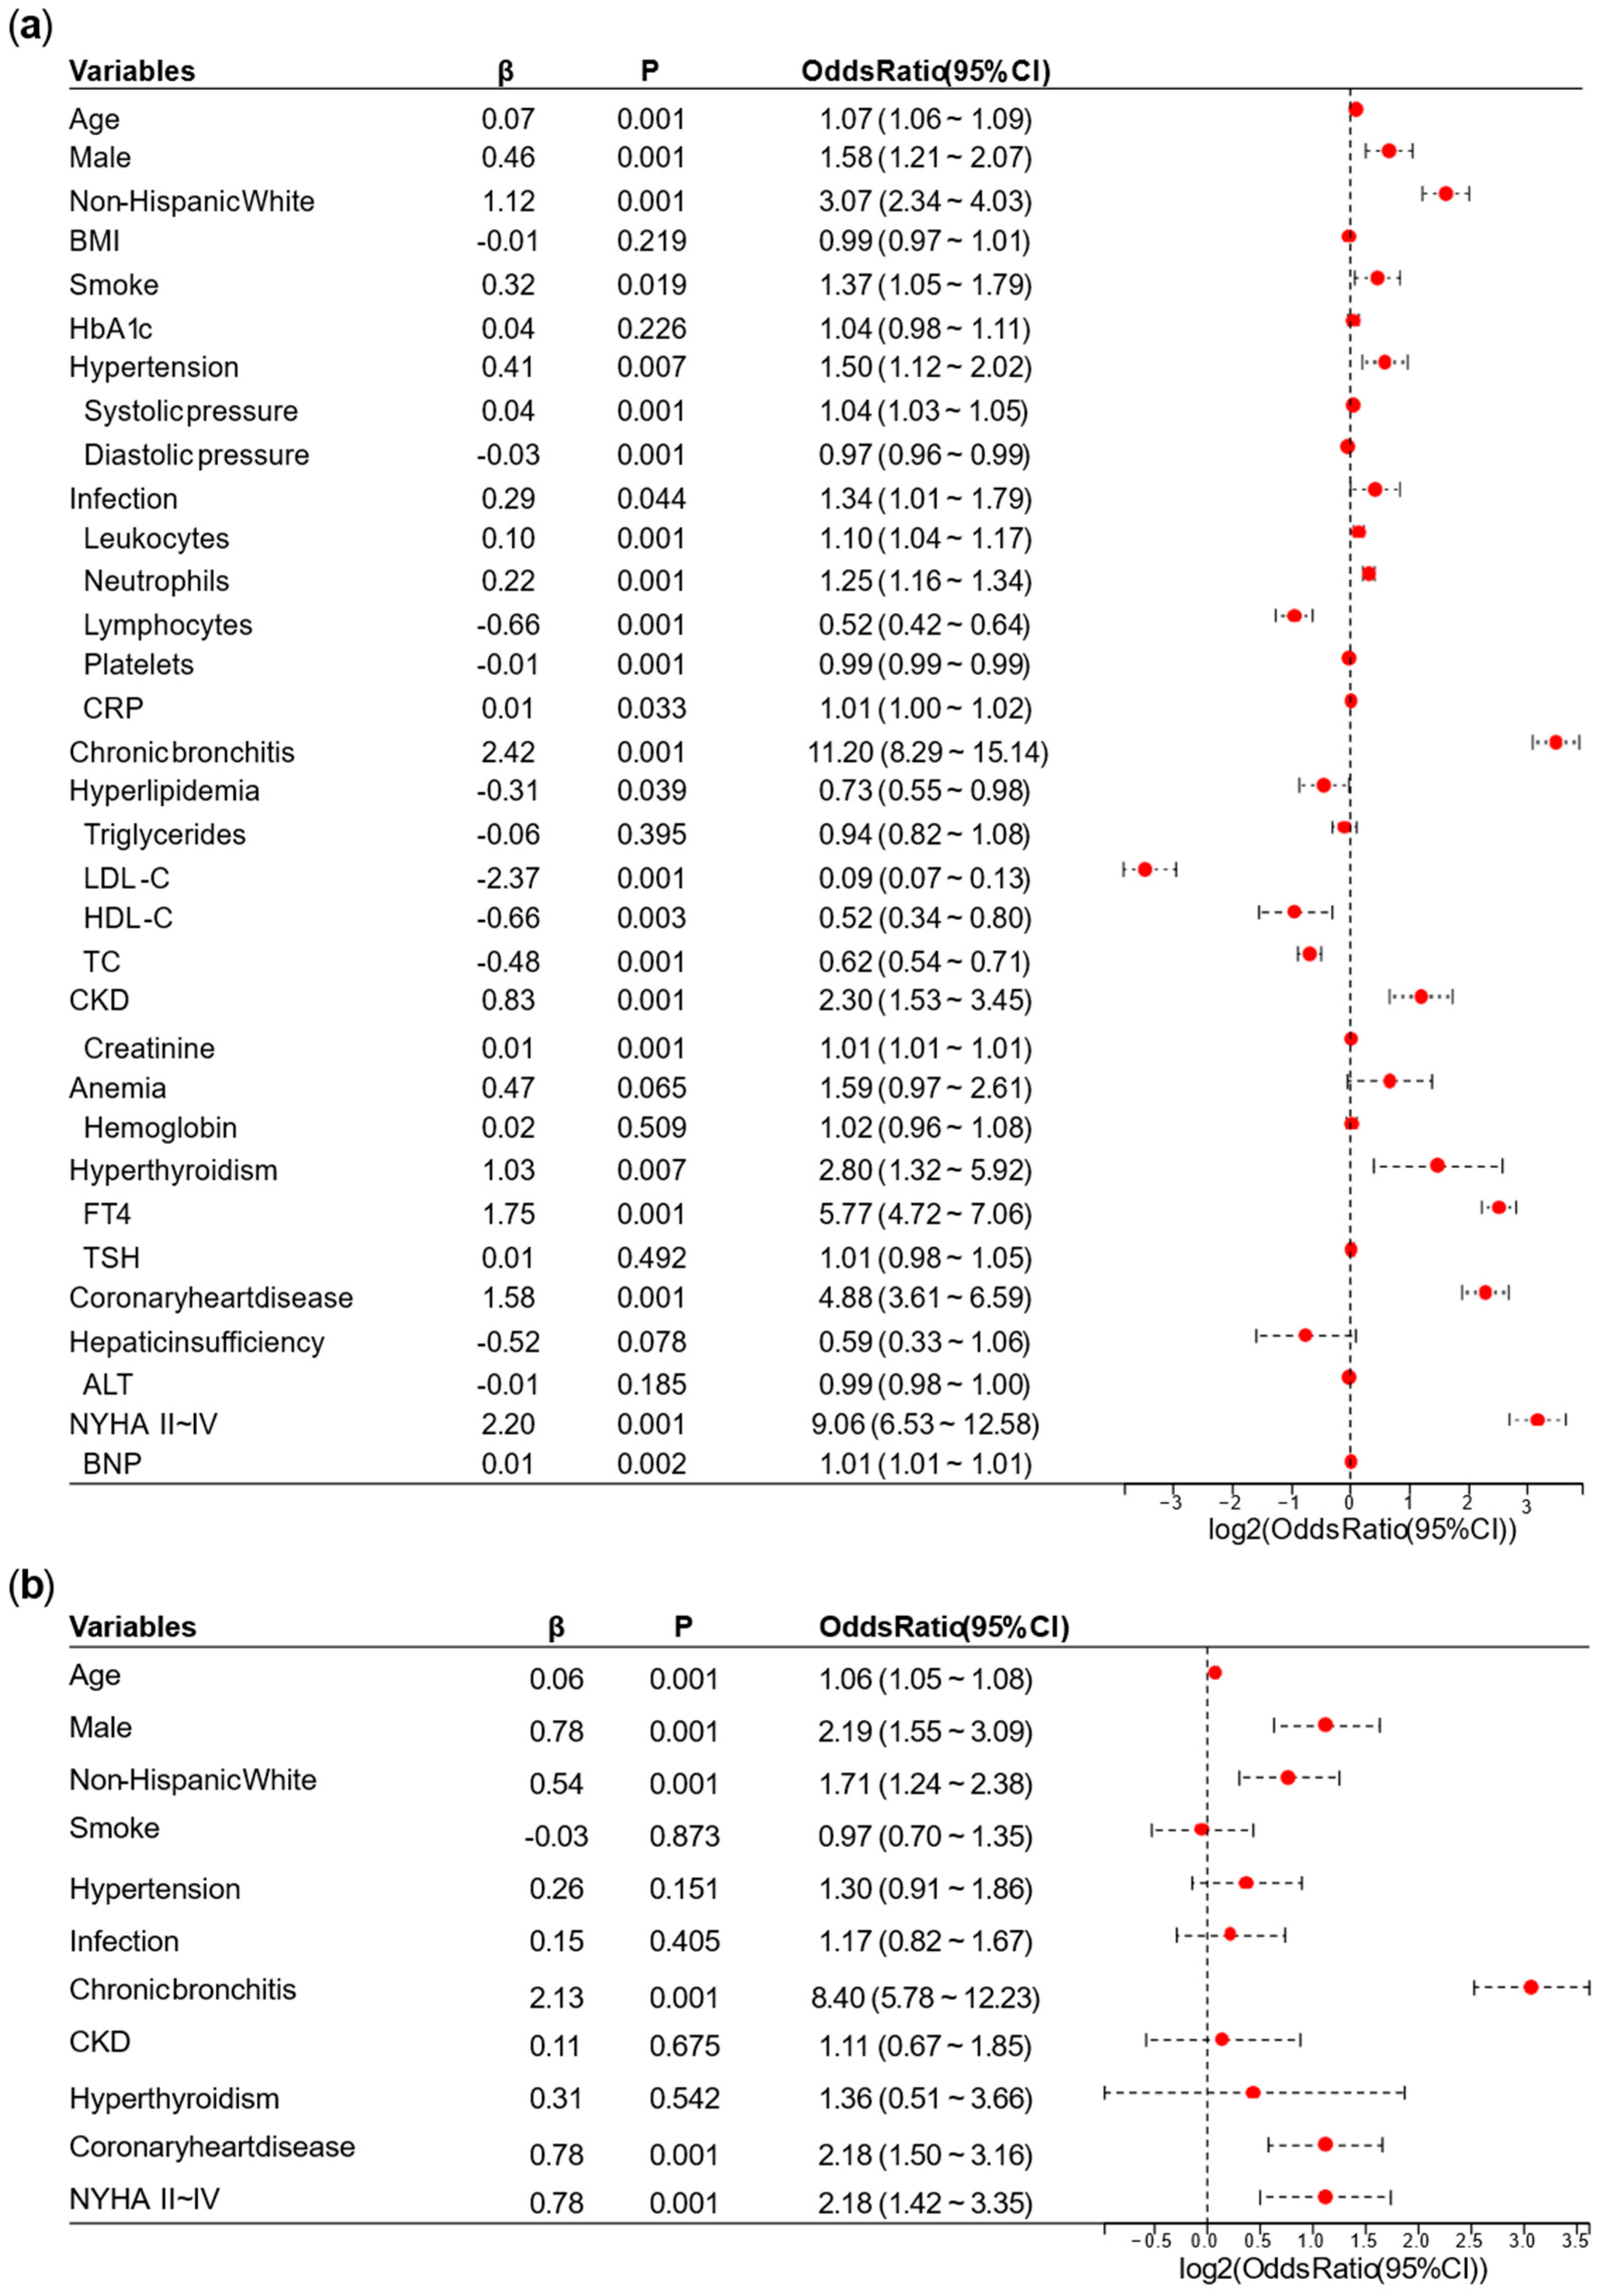
A univariate logistic regression analysis was performed on the NHANES. Based on the results of the univariate logistic regression analysis, we removed overlapping variables between the laboratory tests represented by continuous data and the diagnoses or categorical data. We also removed variables with
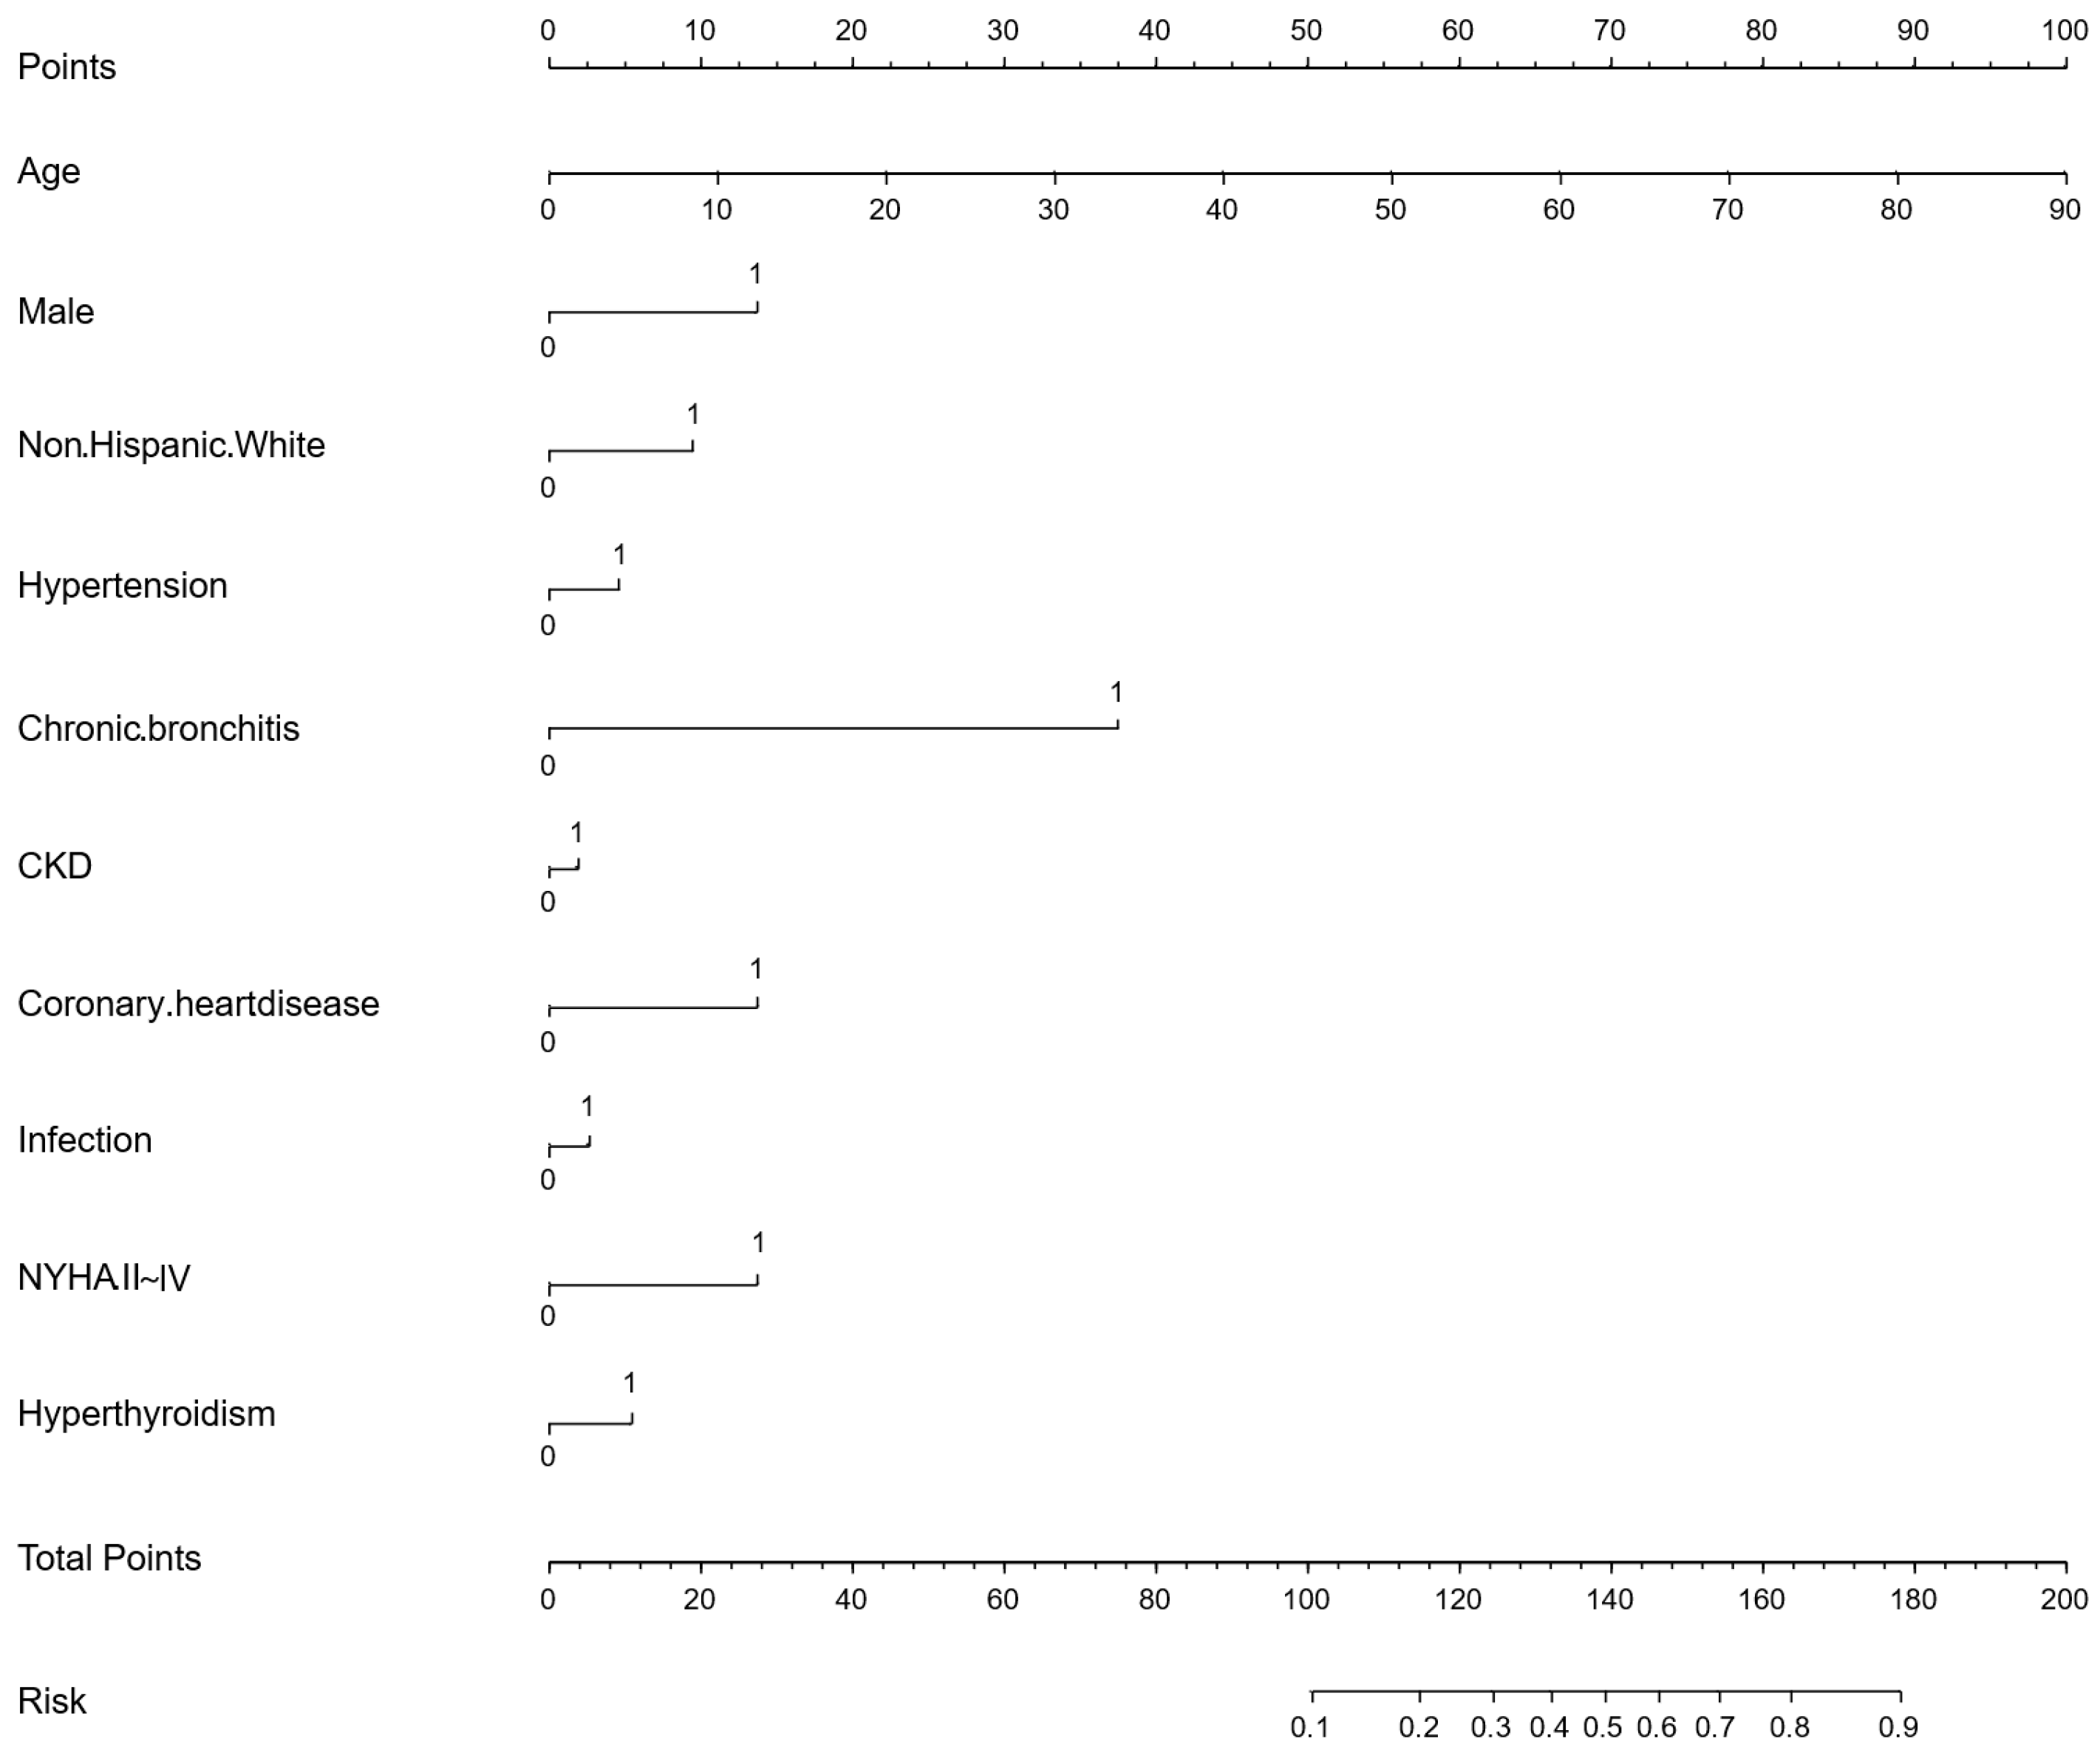
p ≥ 0.05 or odds ratio (OR) ≤ 1 in this stage. Afterward, we conducted a preliminary multivariate logistic regression analysis on the remaining variables. Variables whose OR direction in the preliminary multivariate logistic regression analysis differed from the univariate logistic regression analysis were excluded. Finally, the remaining variables were used for the final multivariate logistic regression analysis, and a nomogram for the AFDB score was generated based on the results. Collinearity analysis is provided in
Appendix B, with a VIF > 10 considered suggestive of strong collinearity and taken into account as a reference during variable assessment.
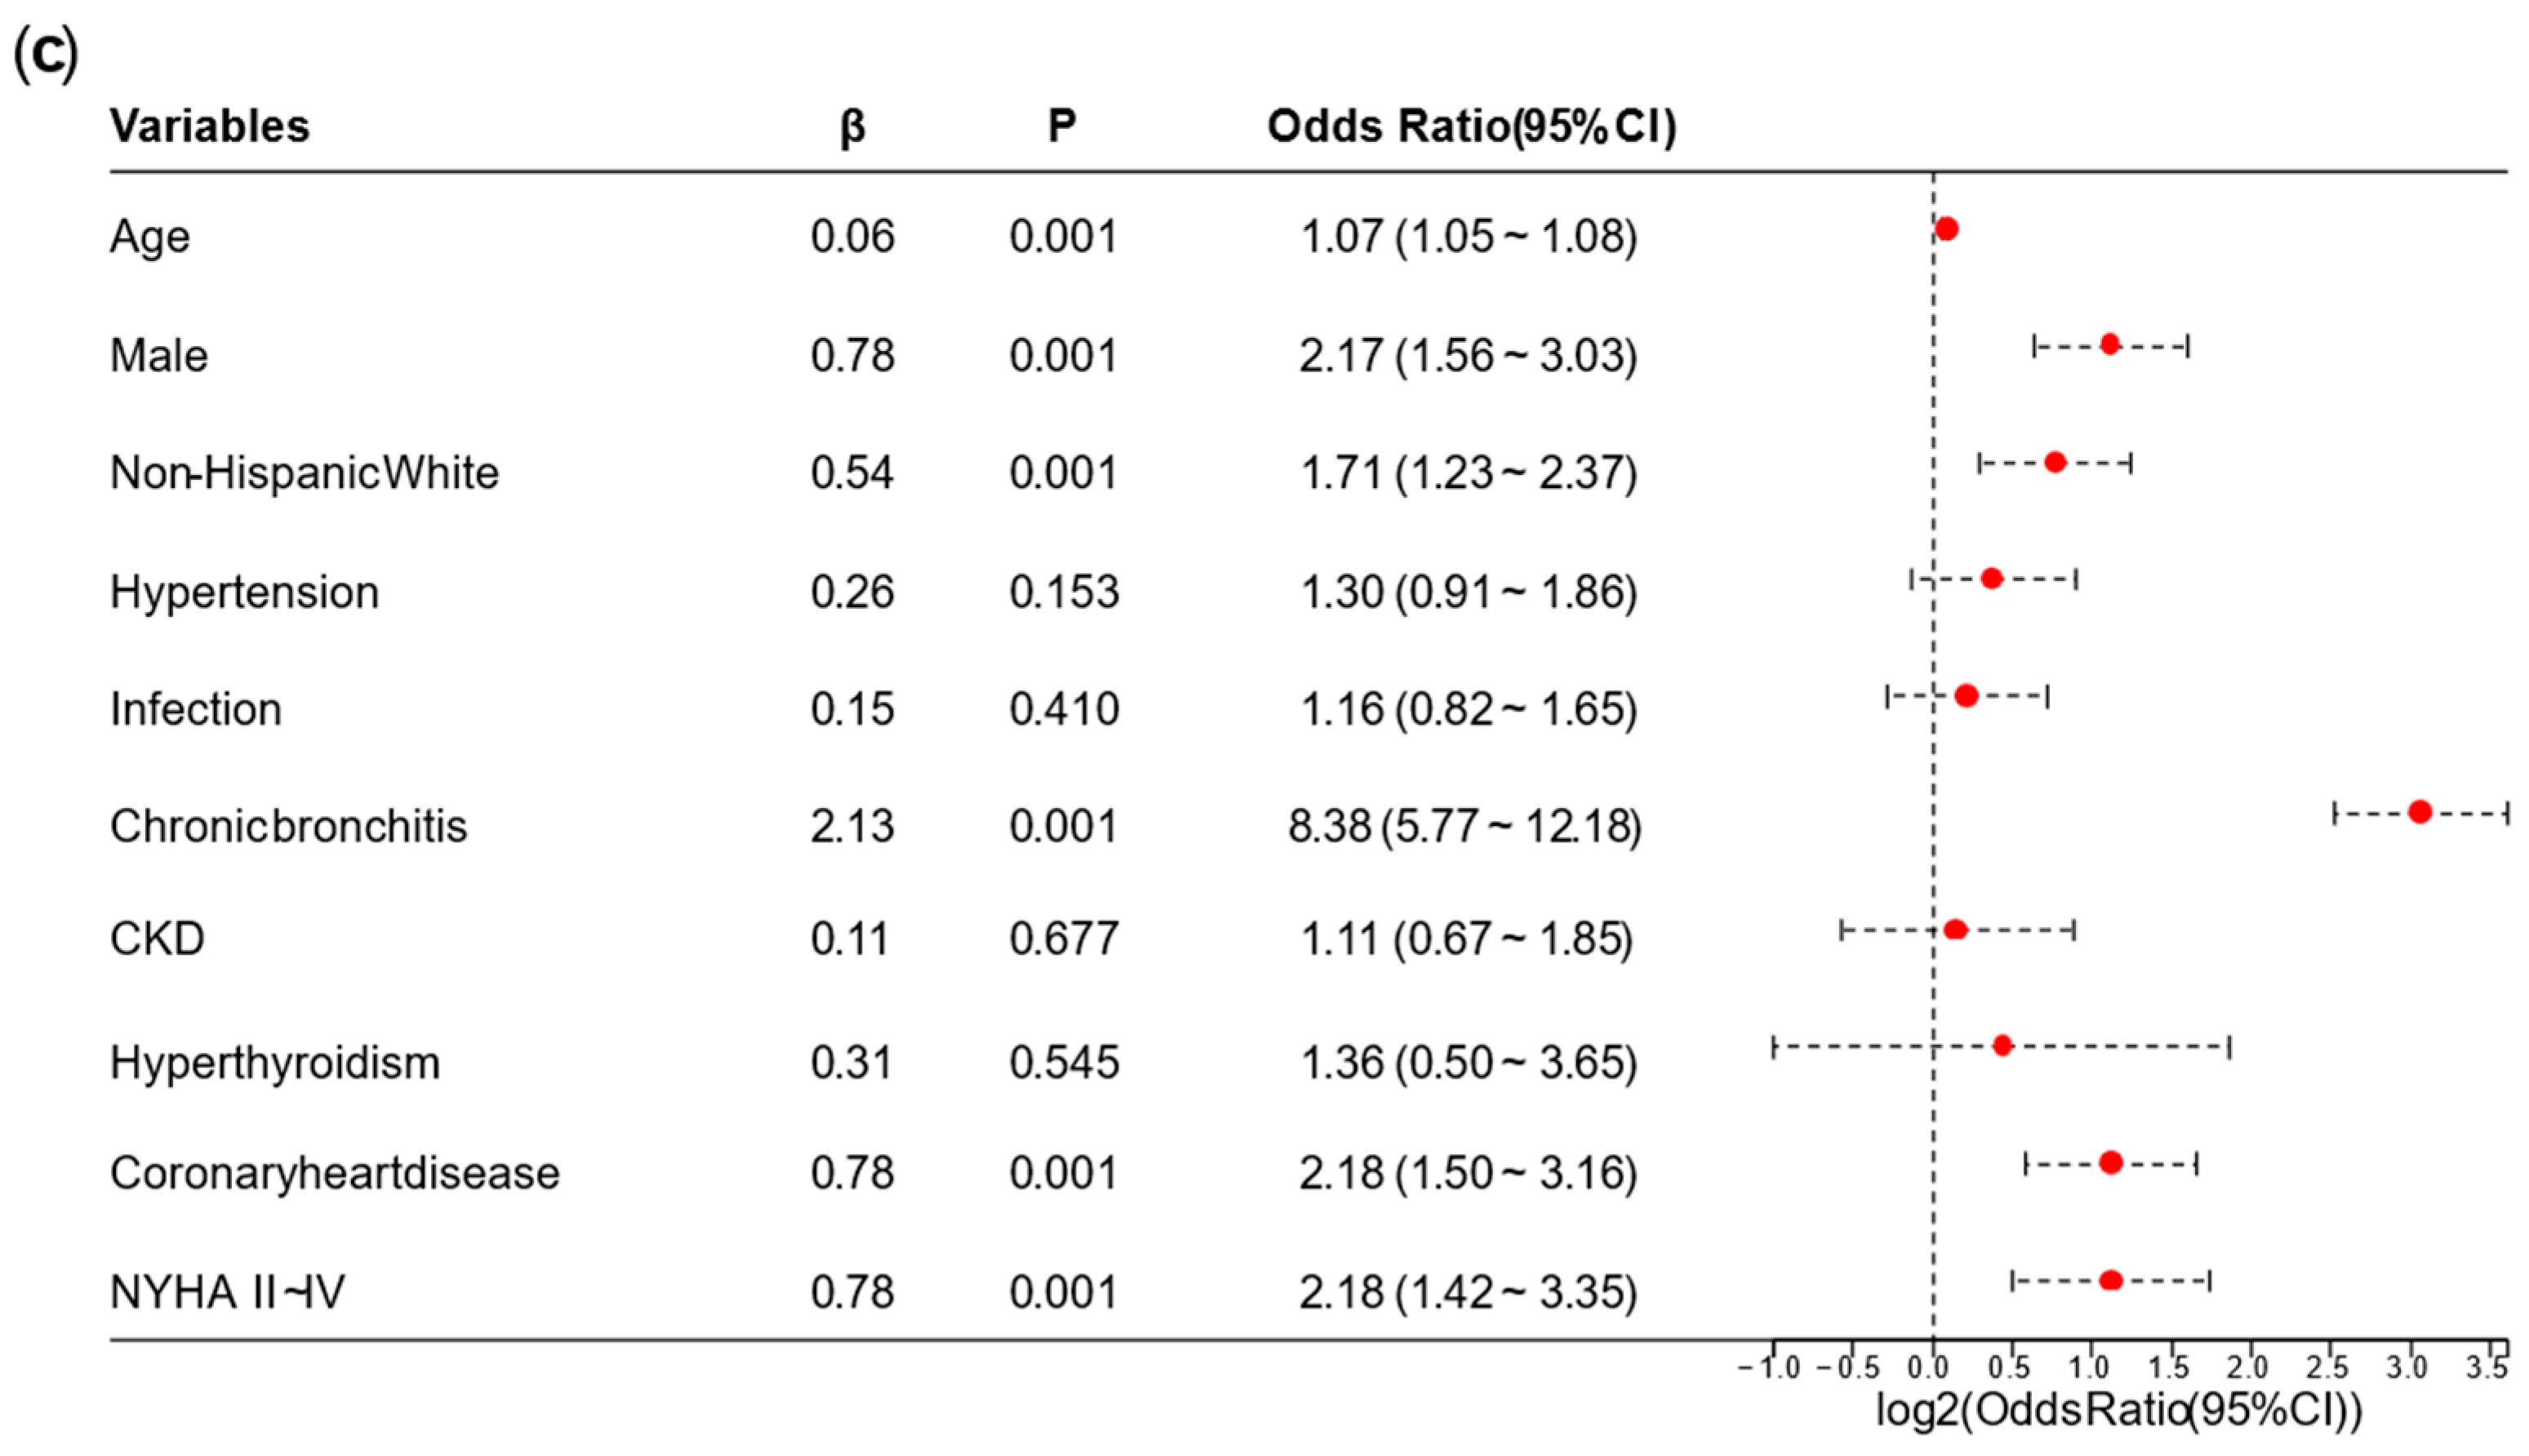
Next, we continued to retrieve relevant information from the diabetes with AF and diabetes without AF on the application platform developed by Yidu Cloud (Beijing) Technology Co., Ltd. And then, using R, we calculated the scores and risk scores for both groups in the test set and compared the results with the actual outcomes. Additionally, we performed group difference analysis and univariate logistic regression analysis on this portion of the data.
Logistic regression analysis established a linear equation to describe the relationship between independent variables and log odds. The log odds were then converted to probabilities, which were used to predict and interpret outcome categories. The logistic regression model could be represented by the following equation:
where
represented the log odds, where
p was the probability of the event occurring,
,
,…,
represented the variables,
,
,
,…,
represented the model parameters (coefficients). By estimating the parameter values, the best-fitting model can be obtained, which was used to predict the probability of the outcome variable.
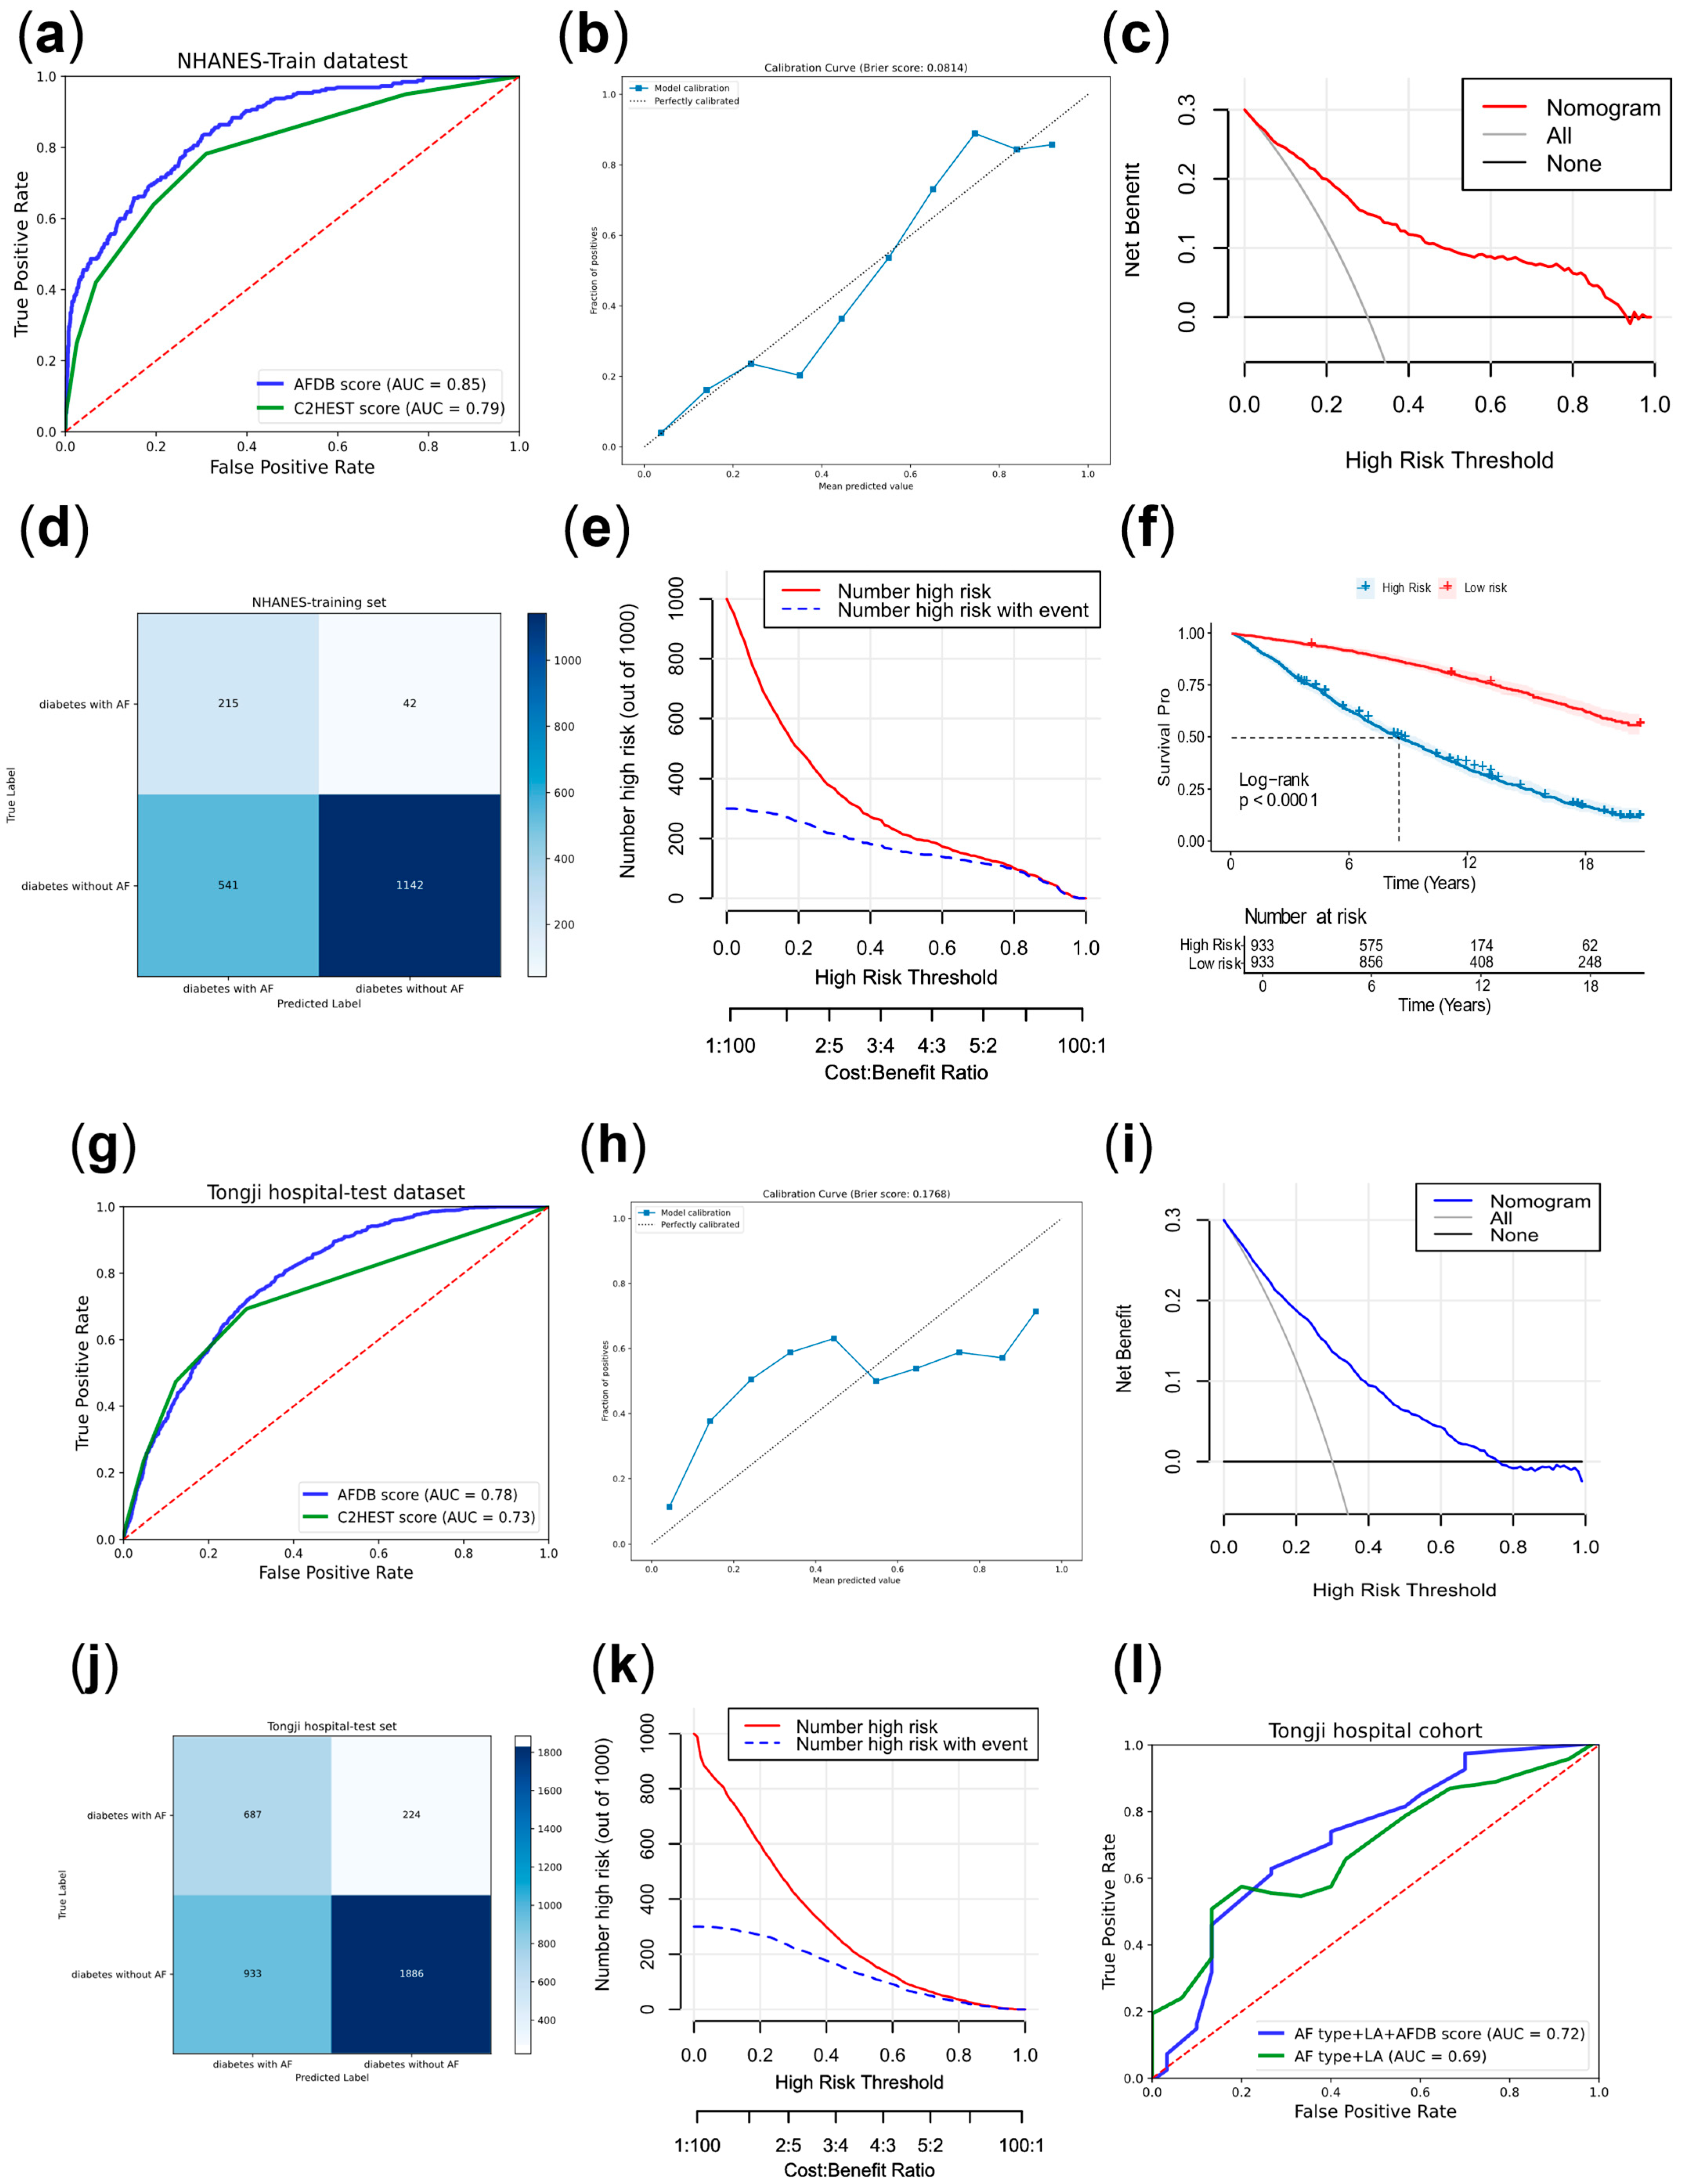
The receiver operating characteristic (ROC) curve was a method for evaluating diagnostic performance. And the area under the curve (AUC) was also an indicator for assessing diagnostic effectiveness.
The confusion matrix was a method for evaluating diagnostic performance, with related metrics including true positive (TP), false positive (FP), true negative (TN), and false negative (FN). Among these, the Youden index was an indicator for assessing the authenticity of the model. In this study, the confusion matrix was based on the threshold corresponding to the maximum Youden index in the training set, which most accurately reflected the model’s generalizability. R 4.4.0 and SPSS Statistics 26 were used during these processes.
The calibration curve was used to assess the predictive accuracy of the model. Decision curve analysis (DCA) and clinical impact curve (CIC) were used to evaluate the clinical intervention benefits and the model’s practical clinical impact.
Meanwhile, we divided the subjects in NHANES into high-risk and low-risk groups based on the score median, and plotted the Kaplan–Meier (KM) curve for the two risk groups using the NDI dataset linked to this dataset. In April 2025, we conducted telephone follow-ups for some AF patients in the case group after radiofrequency ablation to record AF recurrence and when outcomes occurred.
2.3. Untargeted Metabolomics Analysis
From 1 September 2024, 10 diabetic patients with AF and 10 diabetic patients without AF were enrolled at Tongji Hospital, Huazhong University of Science and Technology, and plasma samples were collected for untargeted metabolomics analysis.
The metabolomics analysis was performed using a LC–MS system (Waters, Milford, MA, USA). In both the positive and negative ion modes, the mobile phase consisted of 0.1% formic acid in water and 0.1% formic acid in acetonitrile.
The Xevo G2-XS QTof mass spectrometer (Waters, Milford, Massachusetts, USA) acquired both primary and secondary mass spectra. Dual-channel data were collected at low and high collision energies (10–40 V) with a 0.2-s scanning frequency per spectrum. The ESI (Electrospray Ionization) ion source parameters included a capillary voltage of 2500 V (positive mode) or −2000 V (negative mode), a cone voltage of 40 V, an ion source temperature of 100 °C, desolvation gas temperature of 500 °C, backflush gas flow rate of 50 L/h, and desolvation gas flow rate of 800 L/h.
Raw data were processed using Progenesis QI software 2.4 (Waters, Milford, MA, USA) for peak extraction, alignment, and compound identification.
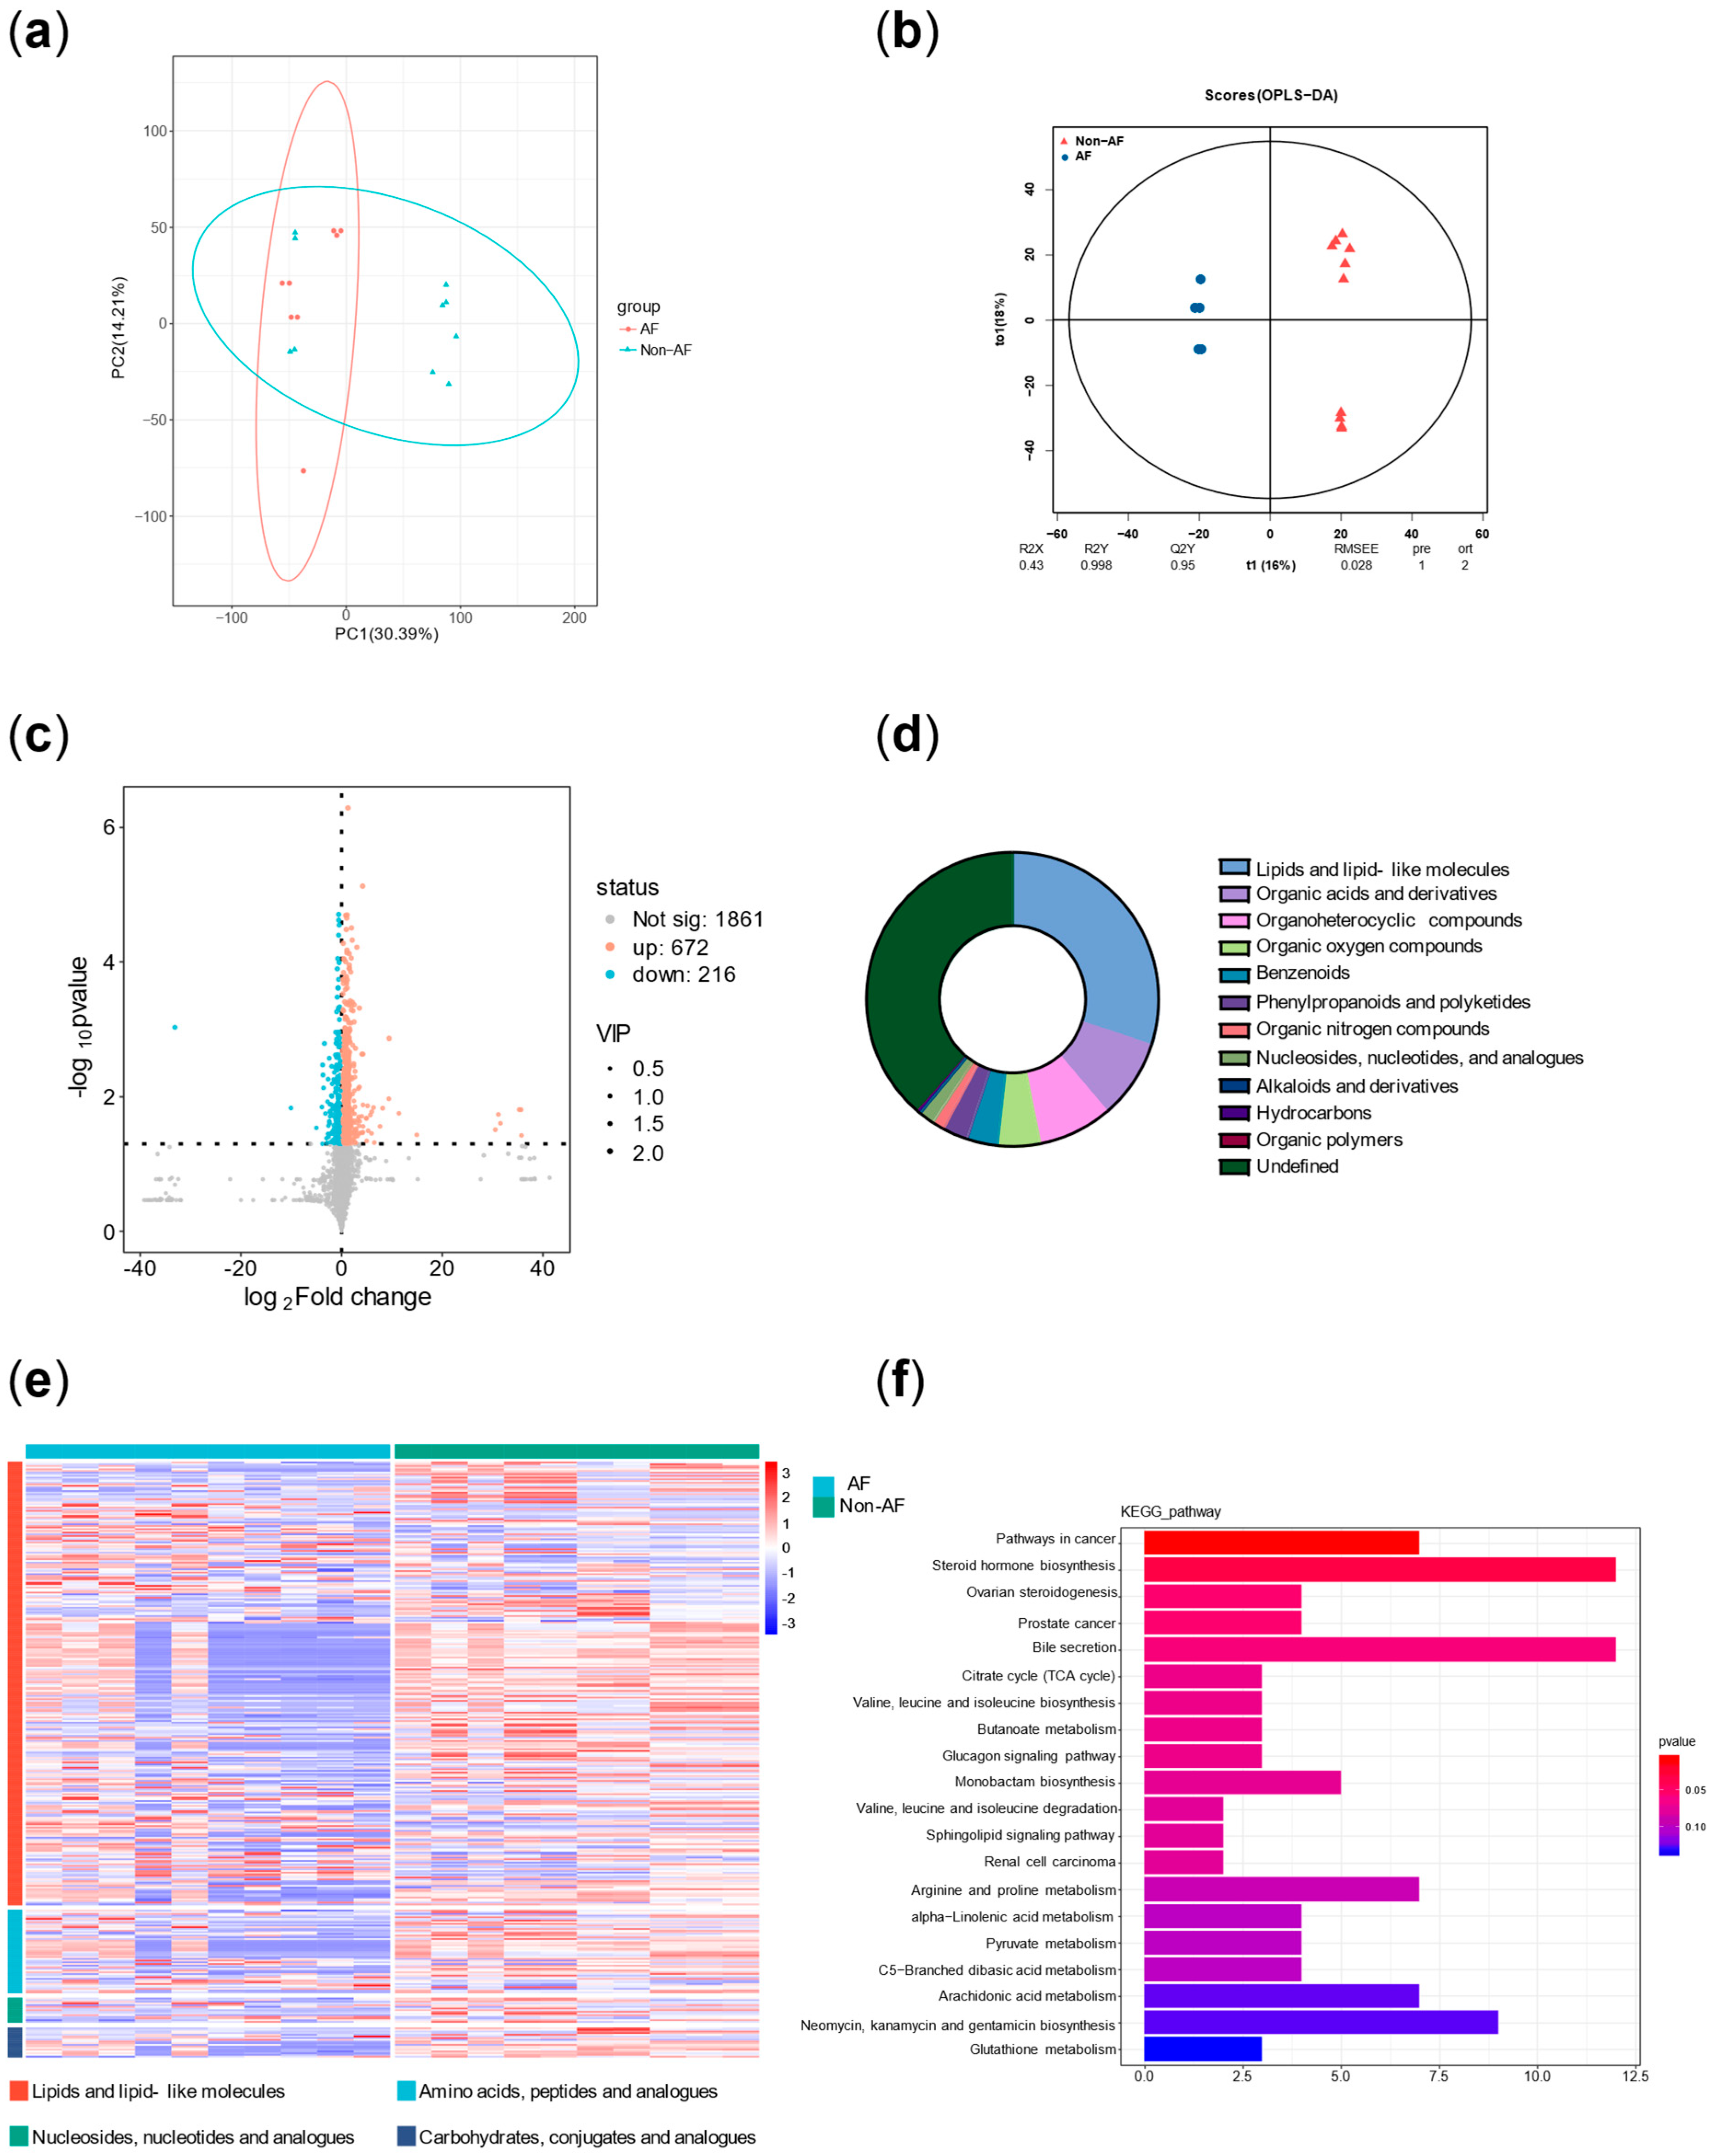
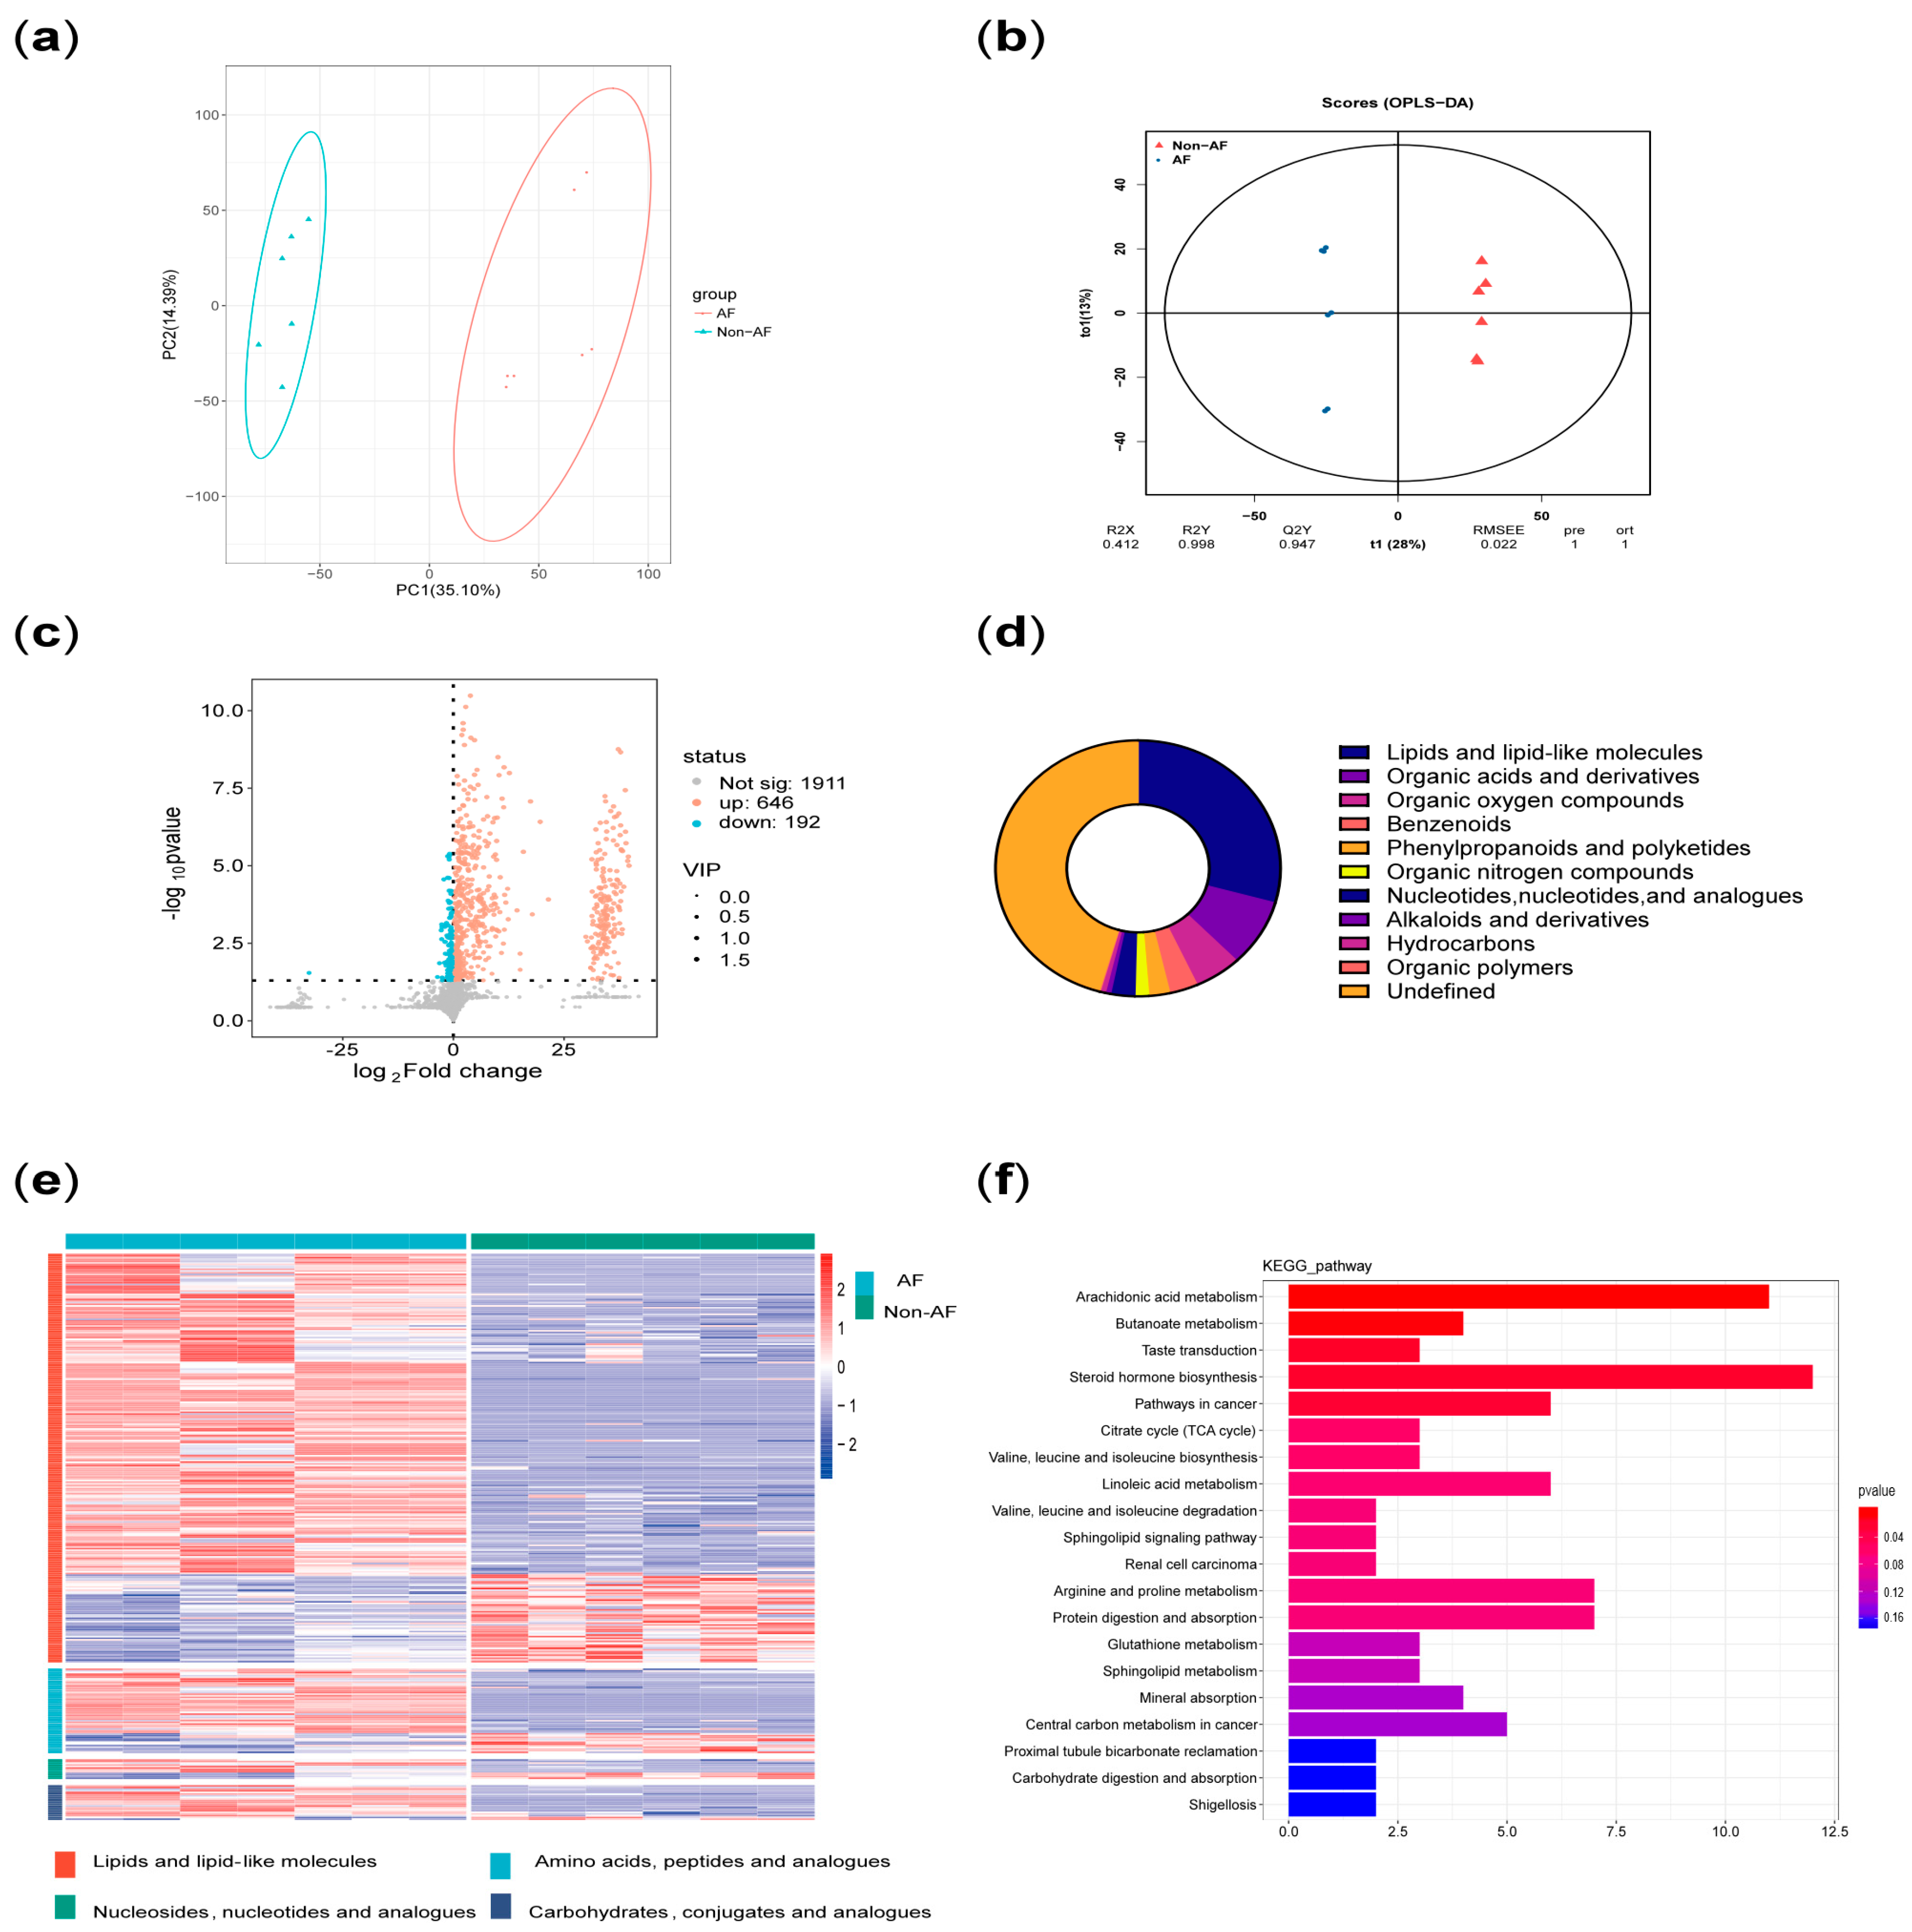
Principal component analysis (PCA) was performed on all metabolites to evaluate intergroup differences. In addition, orthogonal partial least squares (OPLS) analysis was conducted to assess the significance of group-specific features. A volcano plot of differentially altered metabolites (p < 0.05; VIP > 1) was generated. Pie charts and volcano plots were used to assess the classification and differential expression of metabolites. Pathway enrichment significance was evaluated using a hypergeometric distribution test based on the KEGG (Kyoto Encyclopedia of Genes and Genomes) database.
In addition, principal component analysis and correlation analysis were used to exclude samples with poor correlation, resulting in a final selection of 7 diabetic patients with AF and 6 diabetic patients without AF. The results were then reanalyzed.
4. Discussion
This study provided two approaches to identify high-risk AF populations among diabetic patients. (1) This study developed a nomogram for identifying high-risk AF in diabetes, which underwent cross-ethnic validation and was supplemented with follow-up cohorts. The nomogram incorporated variables such as age, sex, ethnicity, hypertension, chronic bronchitis, chronic kidney disease (CKD), coronary heart disease, infection, New York Heart Association (NYHA) classification, and hyperthyroidism. It outperformed the similarly structured C
2HEST score by an average of five points. The nomogram is intuitive, simple, and highly interpretable, making it easy to implement in clinical practice, with a particular emphasis on comorbidity management [
7]. (2) Plasma metabolomics analysis identified three key characteristics associated with high risk of atrial fibrillation in diabetes: more significant disruption of energy utilization, more severe inflammation, and stronger stress responses, which are closely related to the pathophysiology of both diabetes and AF.
Numerous studies have developed risk scores for predicting AF risk [
9]. Meanwhile, Schnabel et al., Chamberlai et al., FIND-AF model, The CHARGE-AF score identified a lot of clinical factors associated with AF occurrence [
8,
12,
13,
14]. However, these models had several limitations, including reliance on single-center or single-source data, absence of cross-ethnic external validation, lack of comparative analysis between nomogram and metabolomics approaches, dependence on complex algorithms with limited interpretability, and restricted generalizability. Notably, none of these models were specifically developed for diabetic populations. It was noteworthy that the C
2HEST score, similar to our model in terms of simplicity and interpretability [
7], which performed worse than ours. This performance gap might be attributed to the C
2HEST score’s lack of specificity for diabetic populations. This performance gap might be attributed to the C
2HEST score’s lack of specificity for diabetic populations. Meanwhile, our scoring system drew on diverse datasets from North America to Asia, including both U.S. and Chinese populations, which complemented each other and demonstrated a broad application range and strong generalizability.
The latest guideline not only emphasized the importance of preventing AF before its electrocardiographic confirmation by introducing the concepts of AF stage 1 and stage 2, but also highlighted that, in addition to rate control and restoration of sinus rhythm, managing risk factors and addressing atrial structural remodeling were crucial for the prevention and treatment of AF [
5]. The nomogram in this study included variables such as age, sex, ethnicity, hypertension, CKD, and coronary heart disease. While factors like age and sex are non-modifiable, the remaining conditions are treatable. Hypertension, CKD, heart failure and coronary heart disease are common diabetes complications [
5]. In other words, lowering blood pressure, improving heart failure, treating coronary heart disease, controlling infections (or pulmonary infection), improving renal function, controlling COPD (or chronic bronchitis), and managing hyperthyroidism were crucial for the prevention of AF. Furthermore, diabetic subjects with higher AFDB scores (high-risk diabetic population for AF) had a higher risk of mortality (
p < 0.01) and shorter follow-up time (
p < 0.01). Therefore, preventing and managing AF in diabetic patients was of great importance for improving survival and prognosis, which suggested related measures could improve prognosis and prolong survival in the diabetic. In addition, this score also provided certain guidance for predicting the recurrence of AF after surgery.
It should be emphasized that both diabetes and AF are highly heterogeneous diseases. Diabetes not only includes type 1 and type 2 diabetes, but also broadly encompasses gestational diabetes, mitochondrial diabetes, and diabetes secondary to exocrine pancreatic disorders [
15]. Similarly, AF can be classified based on episode characteristics and duration into paroxysmal, persistent, and permanent AF, and can also be divided etiologically into valvular and non-valvular AF [
5]. Given the significant variability in individual pathophysiological mechanisms, elucidating the disease mechanisms on a personalized basis is crucial for understanding the onset and progression of these conditions.
Wang et al. reviewed the specific mechanisms underlying the increased incidence of AF in patients with diabetes. On the one hand, these mechanisms include glycemic variability, inflammatory responses, and oxidative stress; on the other hand, they involve structural remodeling of the heart, electromechanical remodeling, electrical remodeling, and autonomic remodeling [
2]. Firstly, both the arachidonic acid metabolism pathway and its upstream linoleic acid metabolism pathway, which were identified in the enrichment analysis, are involved in inflammatory responses [
16]. In addition, the elevated plasma levels of cortisol served as evidence of stress in the case group. Moreover, increased levels of various steroid hormones other than cortisol also suggested adrenal cortex hyperfunction, reflecting both stress and autonomic remodeling [
17]. Furthermore, as the heart is a highly energy-demanding organ, diabetic patients often experience impaired cardiac energy metabolism. Hahn et al. conducted a metabolomic analysis using plasma and myocardial samples from patients with heart failure with preserved ejection fraction (HFpEF). The metabolic profile they summarized—“HFpEF is a syndrome with substantial fuel inflexibility”—is highly consistent with the findings in our metabolomic analysis [
18]. Notably, both AF and diabetes are major comorbidities of HfpEF [
19,
20]. Thus, this substantial fuel inflexibility also exists in high-risk AF patients with diabetes, characterized by the accumulation of long-chain acylcarnitines, increased branched-chain amino acids, buildup of tricarboxylic acid cycle intermediates, disrupted ATP metabolic homeostasis, and overall mitochondrial dysfunction.
Therefore, the metabolic characteristics of AF in diabetes summarized in this study, which referred to more significant disruption of energy utilization, inflammation, and stress responses, align with the underlying pathophysiology of both diabetes and AF observed in previous studies. These molecular-level mechanistic features are often present across different clinical phenotypes of diabetes and AF. Meanwhile, numerous studies summarized the characteristics of metabolomics, proteomics, genomics, and transcriptomics in AF or diabetes [
21,
22,
23,
24]. Integrating multi-omics data (with a focus on plasma metabolomics in this study) greatly aids our understanding of the mechanisms underlying high-risk atrial fibrillation in diabetes.
Precisely because of the heterogeneity of diabetes and AF, this study did not use “black-box” artificial intelligence algorithms in the modeling process of the Electronic Health Record-integrated (EHR-integrated) tool [
25,
26]. Instead, variable selection was based on traditional
p-values and odds ratios (OR), and modeling was performed using logistic regression. Additionally, results from plasma metabolomics of the case and control groups from our center were incorporated to help explain potential pathogenic mechanisms. The reason for this approach lies in fully considering the target users of the tool—clinicians. In practical applications, clinical prediction models often face issues of overfitting and underfitting [
27]. Overfitting occurs when the model fits the training data too closely but has poor generalizability. Compared with artificial intelligence models, ours is more transparent, so if overfitting occurs, users (especially clinicians) can interpret and adjust the AFDB nomogram based on pathophysiological knowledge, characteristics of comorbidities in their own patients, and plasma metabolomic profiles. Underfitting occurs when the model does not fit the training data adequately and fails to capture underlying patterns. Since the modeling in this study used NHANES, a publicly available and transparent database, if underfitting arises, users (especially clinicians) can expand the AFDB nomogram training set using their own local data or multi-omics data (such as the metabolomics data in this study) to improve the model’s performance across various scenarios.
On the one hand, the advantage of the EHR-integrated tool is that it is derived from clinical data, making it relatively easy to obtain and apply. However, its limitation lies in the presence of bias when applied to different populations. In the NHANES dataset in this study, the variable with the highest OR was chronic bronchitis; while in the validation data from Tongji Hospital, the highest OR was for NYHA II–IV. This discrepancy is due to admission rate bias, which also affected the performance of the AFDB score in our hospital. On the other hand, plasma metabolomics offers a deeper mechanistic understanding, facilitating individualized interpretation of disease characteristics in different populations. Its drawbacks are that it is not routinely performed in clinical laboratories, has relatively high costs, and it is difficult for a single center to obtain large-sample data.
Yao et al. demonstrated that combining clinical and polygenic risk scores yielded the highest predictive accuracy for AF [
9]. Therefore, the comprehensive integration and interpretation of different types of data will promote personalized management and precision treatment of diabetes with AF.
It is worth noting that the sample size and its representativeness often influence the reliability of conclusions. First, Gumprecht et al. conducted a prospective study and found that the incidence of AF among diabetic patients in the Polish population was approximately 25% [
28]. The AFDB score includes 10 independent variables, and based on the Events Per Variable (EPV) method for sample size estimation (with EPV set at 10 and the training set proportion at 0.52), at least 400 cases are needed in the training set. Considering a 10% rate of invalid samples, a total sample size of at least 855 cases is required. The sample size used in this part of our study fully meets this requirement. In addition, we used G*Power 3.1 (
http://www.gpower.hhu.de) to calculate the classification power of the plasma metabolites shown in
Figure 7 (n = 7 AF cases vs. n = 6 controls) [
29]. The statistical method used was a two-tailed
t-test for two independent groups with a significance level of
p = 0.05. The minimum classification powers for the three representative metabolites involved in the mechanisms shown in
Figure 7b,e,f—namely isoleucine, TXB2, and cortisone—were 1.00, 1.00, and 0.91, respectively, all exceeding the threshold of 0.80.
Appendix C shows the means and standard deviations of these three metabolites in the two groups. Future studies require larger, multicenter cohorts.
Diabetes combined with atrial fibrillation is often associated with poor treatment outcomes [
30,
31]. This study provided two approaches to identify high-risk AF in diabetic patients, discussed the underlying pathophysiological mechanisms, and compared their characteristics and applications. And integrated strategies could improve AF risk stratification and personalized management in the diabetic.


 ,
, 

