Abstract
Background: Glioblastoma (GBM) is the most malignant brain tumor, with a cellular hierarchy dominated by glioma stem cells (GSCs). Understanding global communications among GSCs and other cells helps us identify potential new therapeutic targets. In this study, multi-transcriptomic analysis was utilized to explore the communication pattern of GSCs in GBM. Methods: CellChat was used to quantitatively infer and analyze intercellular communication networks from GBM single-cell RNA-sequencing (scRNA-seq) data. Gene set enrichment analysis (GSEA) was conducted to identify specific biological pathways (epithelial–mesenchymal transition, EMT) involved in the communication pattern of GSCs. Spatial transcriptomic database was used to support the relationship between EMT and GSC proliferation. Single-sample GSEA (ssGSEA) was employed to assess which GSC state exhibited the strongest association with the EMT signature. Results: The cell communication pattern of GSCs is mostly related to EMT. Multiple EMT-related genes are highly expressed in GBM, particularly in GSCs, which are associated with poor prognosis. In addition, EMT-related genes are most enriched in mesenchymal-like (MES-like) GSCs. Tumor patients with MES-like GSC-enriched signatures demonstrate the most unfavorable prognosis compared to those harboring proneural-like (PN-like) or classical-like (CL-like) GSCs. Conclusions: This study suggests that GSCs facilitate GBM progression through intercellular communication in the pattern of EMT. EMT-associated genes may drive the differentiation of GSCs toward a MES-like phenotype, thereby leading to poorer clinical outcomes. Consequently, targeting EMT-related pathways could represent a novel therapeutic strategy for GBM treatment.
1. Background
Glioblastoma (GBM) is the predominant malignant and most lethal tumor of the central nervous system (CNS), carrying the highest mortality rates [1]. Epidemiological studies indicate that the incidence rate of GBM is approximately 5.26/100,000, with nearly 17,000 new diagnoses annually [2,3,4]. The current standard of care (SoC) for GBM, including maximal surgical resection with preservation of neurologic function, chemoradiation, and adjuvant chemotherapy [5], offers only limited survival benefit, and almost all patients eventually recur, in part due to the presence of glioma stem cells (GSCs) [6]. As at the apex of cellular hierarchies in GBM, the self-renewing GSCs contribute to neovascularization, immunosuppressive adaptation, infiltrative growth patterns, and multidrug resistance phenotypes during tumor progression [7,8,9,10]. Therapeutic targeting of GSCs holds significant promise for GBM management. However, developing effective GSC-targeting strategies remains challenging due to their heterogeneity, plasticity, and varied therapeutic responses [11,12,13].
Recent studies have established foundational insights into GSC heterogeneity and epithelial–mesenchymal transition (EMT). For instance, Neftel et al. [14] delineated four GSC subtypes with distinct transcriptional programs, including oligodendrocyte precursor cell-like (OPC-like), neural progenitor cell-like (NPC-like), astrocyte-like (AC-like), and mesenchymal-like (MES-like), highlighting microenvironment-driven plasticity. However, the dynamic interplay between subtype-specific transcriptional regulators and EMT effectors remains unresolved.
Cells communicate through released chemicals and surface signals to guide key decisions like starting growth, triggering self-destruct, moving locations, or developing into specific cell types [15,16,17]. The tumor microenvironment (TME) in GBM is highly complex, containing various cell types and extracellular components. Understanding how tumor cells, particularly GSCs, interact with surrounding cells could reveal key mechanisms driving GBM progression and help identify potential treatment targets. The interplay between GSCs and other GBM cells within TME is multi-dimensional, with biophysical properties integral to oncology, and proposed as a source for new strategies for GBM management.
Single-cell RNA sequencing (scRNA-seq) allows researchers to study cell differences and development patterns in great detail [18,19]. Several strategies have been recently applied to infer cell–cell communication from scRNA-seq data [20,21,22,23,24,25,26], such as CellChat [20], Single-CellSignalR [22], and NicheNet [25]. Other than scRNA-seq, recent progress in spatially resolved transcriptomic methods allows researchers to study how cells are arranged spatially in tissues [27]. Combining these spatial data with scRNA-seq results could help provide a better understanding of cellular crosstalk in GBM [28].
Therefore, our study aims to identify communication patterns of GSCs in GBM and their impact on disease progression. Through integrated analysis of multiple scRNA-seq datasets and spatial transcriptomic data, we found that GSC communication patterns are closely associated with EMT. Further analysis showed that EMT may promote increased proportions of MES-like subtypes in GSCs, which are strongly linked to poorer patient outcomes. Importantly, targeting EMT-related genes in GBM could serve as a potential therapeutic strategy for future treatment development.
2. Materials and Methods
2.1. Data Source and Processing
Data were obtained from the Gene Expression Omnibus (GEO) (https://www.ncbi.nlm.nih.gov/geo/, accessed on 16 March 2025) database at the National Center for Biotechnology Information (NCBI) in the United States. The information on the datasets is presented in Table 1.

Table 1.
Detailed information on the datasets used in this study.
For the GSE84465 dataset, following data normalization, we performed differential expression analysis across all cells, conducted principal component analysis (PCA), and subsequently applied clustering and UMAP dimensionality reduction. Cell annotation was performed using markers for GSCs and differentiated glioma cells (DGCs) defined by Martina et al. [29], while employing the CellMarker database (http://xteam.xbio.top/CellMarker/#, accessed on 16 March 2025) as a reference for other cell types.
For the GSE129438 dataset, the BW-format files were visualized using the Integrative Genomics Viewer (IGV) software (version 2.17.0), with genomic data aligned to the human reference genome assembly (GRCh37/hg19).
For the GSE131928 dataset, the pre-processed data provided by the authors through the GEO repository were directly employed for subsequent analytical procedures.
2.2. Cell–Cell Interaction Analysis
The R package CellChat V.1.6.114 was used to quantitatively infer and analyze intercellular communication networks using scRNA-seq data of GSE84465. CellChat employs a computational framework integrating network topology analysis and pattern recognition algorithms to systematically infer principal signaling input–output relationships among cellular populations.
Inference of intercellular communications: identification of differentially expressed signaling genes. To infer the cell state-specific communications, we first identified differentially expressed signaling genes across all cell groups within the scRNA-seq dataset using the Wilcoxon rank sum test with a significance level of 0.05.
2.3. Functional Enrichment Analysis
The clusterProfiler package (v 3.14.3) was used to perform Kyoto Encyclopedia of Genes and Genomes (KEGG) enrichment analyses on the cellular communication pattern genes of GSCs. The gene set enrichment analysis (GSEA) software (v 4.3.3) was obtained from the GSEA website (http://software.broadinstitute.org/gsea/index.jsp, accessed on 17 March 2025) and used for GSEA enrichment analysis based on the MSigDB database [30,31] (http://www.gsea-msigdb.org/gsea/downloads.jsp, accessed on 17 March 2025). Additionally, single-sample GSEA (ssGSEA) was performed to quantify the EMT-related enrichment score of various GSC subtypes within GBM.
2.4. Processing of GBM Spatial Transcriptome Sequencing Data
GBM spatial transcriptome sequencing data were sourced from Datadryad (https://doi.org/10.5061/dryad.h70rxwdmj) [32]. We employed SPATA software SPATA:: plotSurfaceInteractive and SPATA2 (https://github.com/theMILOlab/SPATA2, accessed on 20 March 2025) for the visualization of spatial gene expression. For spatial expression plots, either normalized and scaled gene expression values (to plot single genes) or enrichment scores of a defined gene set were used, with the 0.5 quantile of a probability distribution fitting. The x-axis and y-axis coordinates are given by the input file based on the localization to the H&E staining.
2.5. Cell Lines and Cell Culture
The following cell lines were utilized in this study: GSC models (MES28, GSC23, 387, 3691) generously donated by Dr. Jeremy N. Rich’s laboratory (University of Pittsburgh Medical Center, Pittsburgh, PA, USA), and neural stem cell lines (NSC11, ENSA, HNP1). All stem cell populations were maintained in serum-free DMEM/F12 medium (Gibco, Waltham, MA, USA) enriched with B27 supplement (Life Technologies, Carlsbad, CA, USA) and dual growth factors (20 ng/mL bFGF/EGF; R&D Systems, Minneapolis, MN, USA). Corresponding DGCs were propagated in DMEM basal medium (Gibco 11995065) containing 10% fetal bovine serum (Gibco 26140079) to preserve their differentiated phenotype.
2.6. SiRNA Transfection
ZEB1 siRNAs were purchased from Dharmacon (ON-TARGETplus Human ZEB1 siRNA, J-006564-10-0050, J-006564-11-0050). MMP9 siRNAs were purchased from Dharmacon (ON-TARGETplus Human MMP9 siRNA, J-005970-07-0050, J-005970-08-0050). ZO-1(TJP1) siRNAs were purchased from Dharmacon (ON-TARGETplus Human TJP1 siRNA, J-007746-05-0020, J-007746-06-0020). A total of 2,500,000 of GSC23 cells were electroporated with either control, ZEB1, MMP9, or ZO-1(TJP1) siRNA (100 nM) using nucleofector (kit C and program X-05). Then, the cells were plated in 5 mL of complete neurobasal media and incubated for 48 h at 37 °C until experiment analysis.
2.7. Immunoblotting
Protein extraction was performed with RIPA lysis buffer (P0013B, Beyotime, Shanghai, China) supplemented with protease inhibitors, and protein concentrations were determined using a BCA assay (Thermo Fisher Scientific, Waltham, MA, USA). Equal protein quantities from cellular or tissue lysates were separated on 10–17% SDS-PAGE gels. Following electrophoretic separation and membrane transfer, blots were probed with specific primary antibodies followed by Goat anti-Mouse or Goat anti-Rabbit IgG (H+L) HRP-linked secondary antibodies (31430 and 31460, Invitrogen, Waltham, MA, USA). Protein signals were detected by enhanced chemiluminescence (Clarity Western ECL Substrate, Bio-Rad, Hercules, CA, USA) and quantified through grayscale densitometry. A detailed list of primary antibodies is presented in Table 2. All the uncropped original blots are provided in Supplementary Figures S1 and S2.
Table 2.
Key resources.
2.8. Statistical Analysis
The statistical software R (version 4.0.3) and GraphPad Prism 10 software (version 10.1.0) were used for the statistical analysis and the generation of figures. The median values of EMT-related gene expression were considered the cutoff value to separate patients into the high and low groups. Survival analysis was conducted using Kaplan–Meier analysis and the log-rank test. The Wilcoxon signed rank test, Mann–Whitney test, and unpaired t-test were used for statistical analysis between two groups, while the Kruskal–Wallis test was applied for statistical analysis between more than two groups. The non-parametric Spearman test was conducted to evaluate the correlation of two variables. All statistical tests were independently performed by two different scientists, and a p-value of less than 0.05 was considered statistically significant.
3. Results
3.1. Initial Clustering and Identification of Cell Types in GBM
To investigate cell–cell communication patterns of GSCs in GBM, we analyzed a scRNA-seq dataset (GSE84465) from the GEO database containing 3589 cells derived from human primary GBM samples. We used k-means clustering on the 2D UMAP map, resulting in the identification of 10 distinct cell types within separate clusters, which includes GSCs, DGCs, oligodendrocyte precursor cells (OPCs), microglia, astrocytes, neurons, vascular cells, oligodendrocyte, monocytes/macrophages, and undefined cancer cells (Figure 1A).
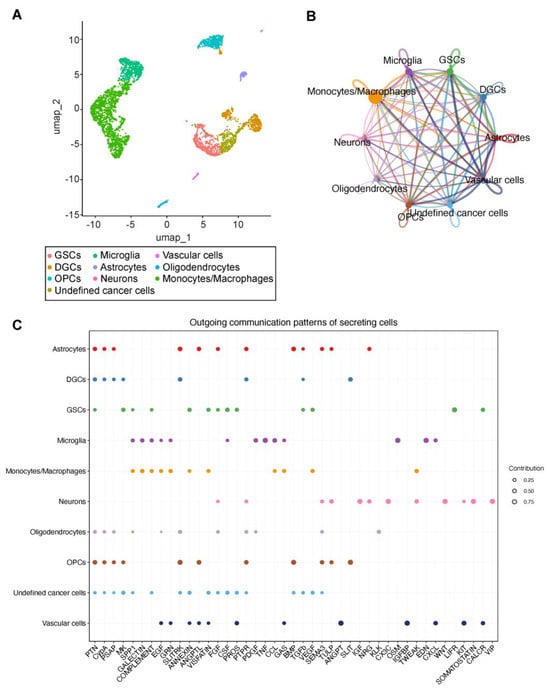
Figure 1.
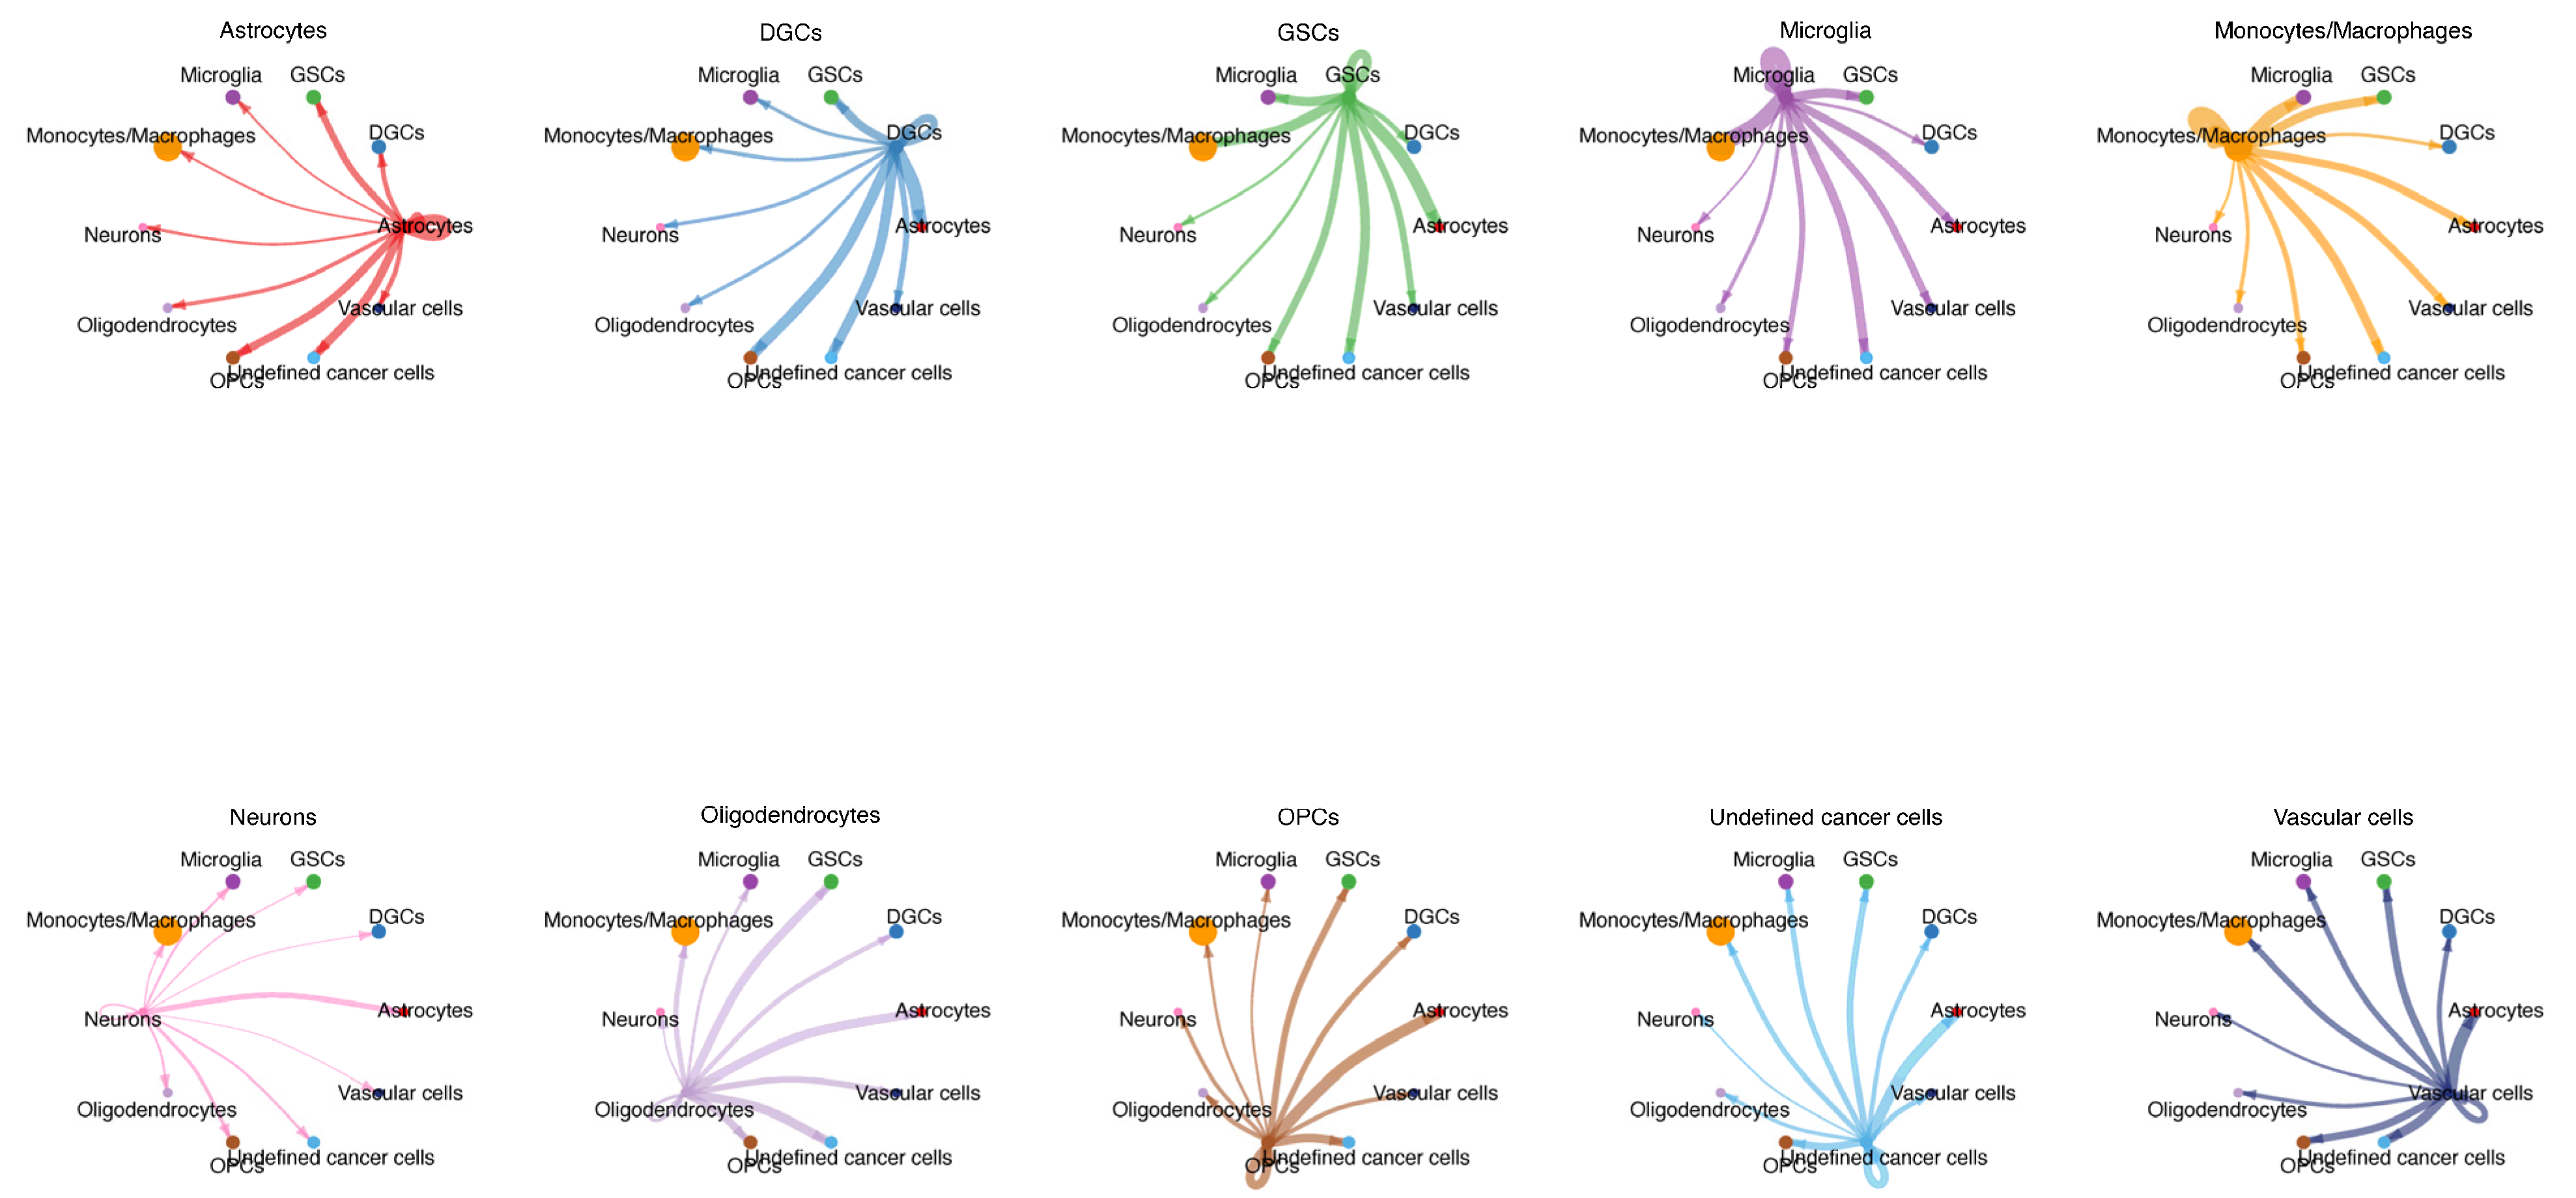
Identification of cell types and overview of the communication network in GBM. (A) 2D-UMAP representation of all single cells included in the study (n = 3589). Cell clusters are differentially colored and identified as distinct cell classes. (B) Cellular communication visualization of all 10 cell types. Different colors in the circle plot represent different cell groups. The interaction strength is quantified based on ligand–receptor interaction probabilities. The communication probability here only represents the interaction strength and is not an exact probability [20]. (C) All the outgoing signaling pathways of secreting cells. The dot color and size represent the cell group and contribution factor. Data sourced from scRNA-seq dataset (GSE84465) from the GEO database.
3.2. Overview of the Communication Network in GBM
To infer and visualize intercellular communications in GBM, we ran CellChat analysis on the scRNA-seq dataset mentioned above. CellChat analysis revealed intricate cell–cell communication networks in GBM, with all pairwise combinations among the 10 cell clusters exhibiting varying degrees of interaction intensity, including notable autocrine signaling within individual cell populations (Figure 1B).
A total of 43 significant signaling pathways among the 10 cell groups were detected (Figure 1C). The signaling pathways associated with GSCs encompassed multiple molecular systems, including pleiotrophin (PTN), midkine (MK), secreted phosphoprotein 1 (SPP1), complement signaling, annexin-mediated pathways, visfatin-related mechanisms, fibroblast growth factor (FGF) signaling, colony-stimulating factor (CSF) pathways, prosaposin (PROS)-associated signaling, transforming growth factor beta (TGF-β) pathways, vascular endothelial growth factor (VEGF) signaling, leukemia inhibitory factor receptor (LIFR)-mediated communication, and calcitonin receptor (CALCR)-related interactions.
3.3. Cell–Cell Communication Strength Across 10 Cell Groups
Figure 2 illustrates the communication strength between each cell type and others, where GSCs demonstrate robust autocrine signaling (self-communication), followed by notable paracrine interactions with microglia, monocytes/macrophages, and astrocytes. Surprisingly, their communication intensities with neurons, oligodendrocytes, and DGCs were comparatively weaker.
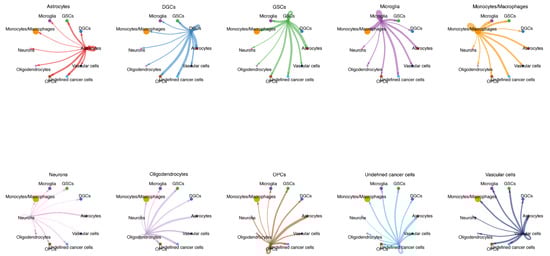
Figure 2.
Cell–cell communication network analysis across 10 cell groups. Different colors of circles represent different cell groups.
3.4. The Cell Communication Pattern of GSCs Is Mostly Related to EMT
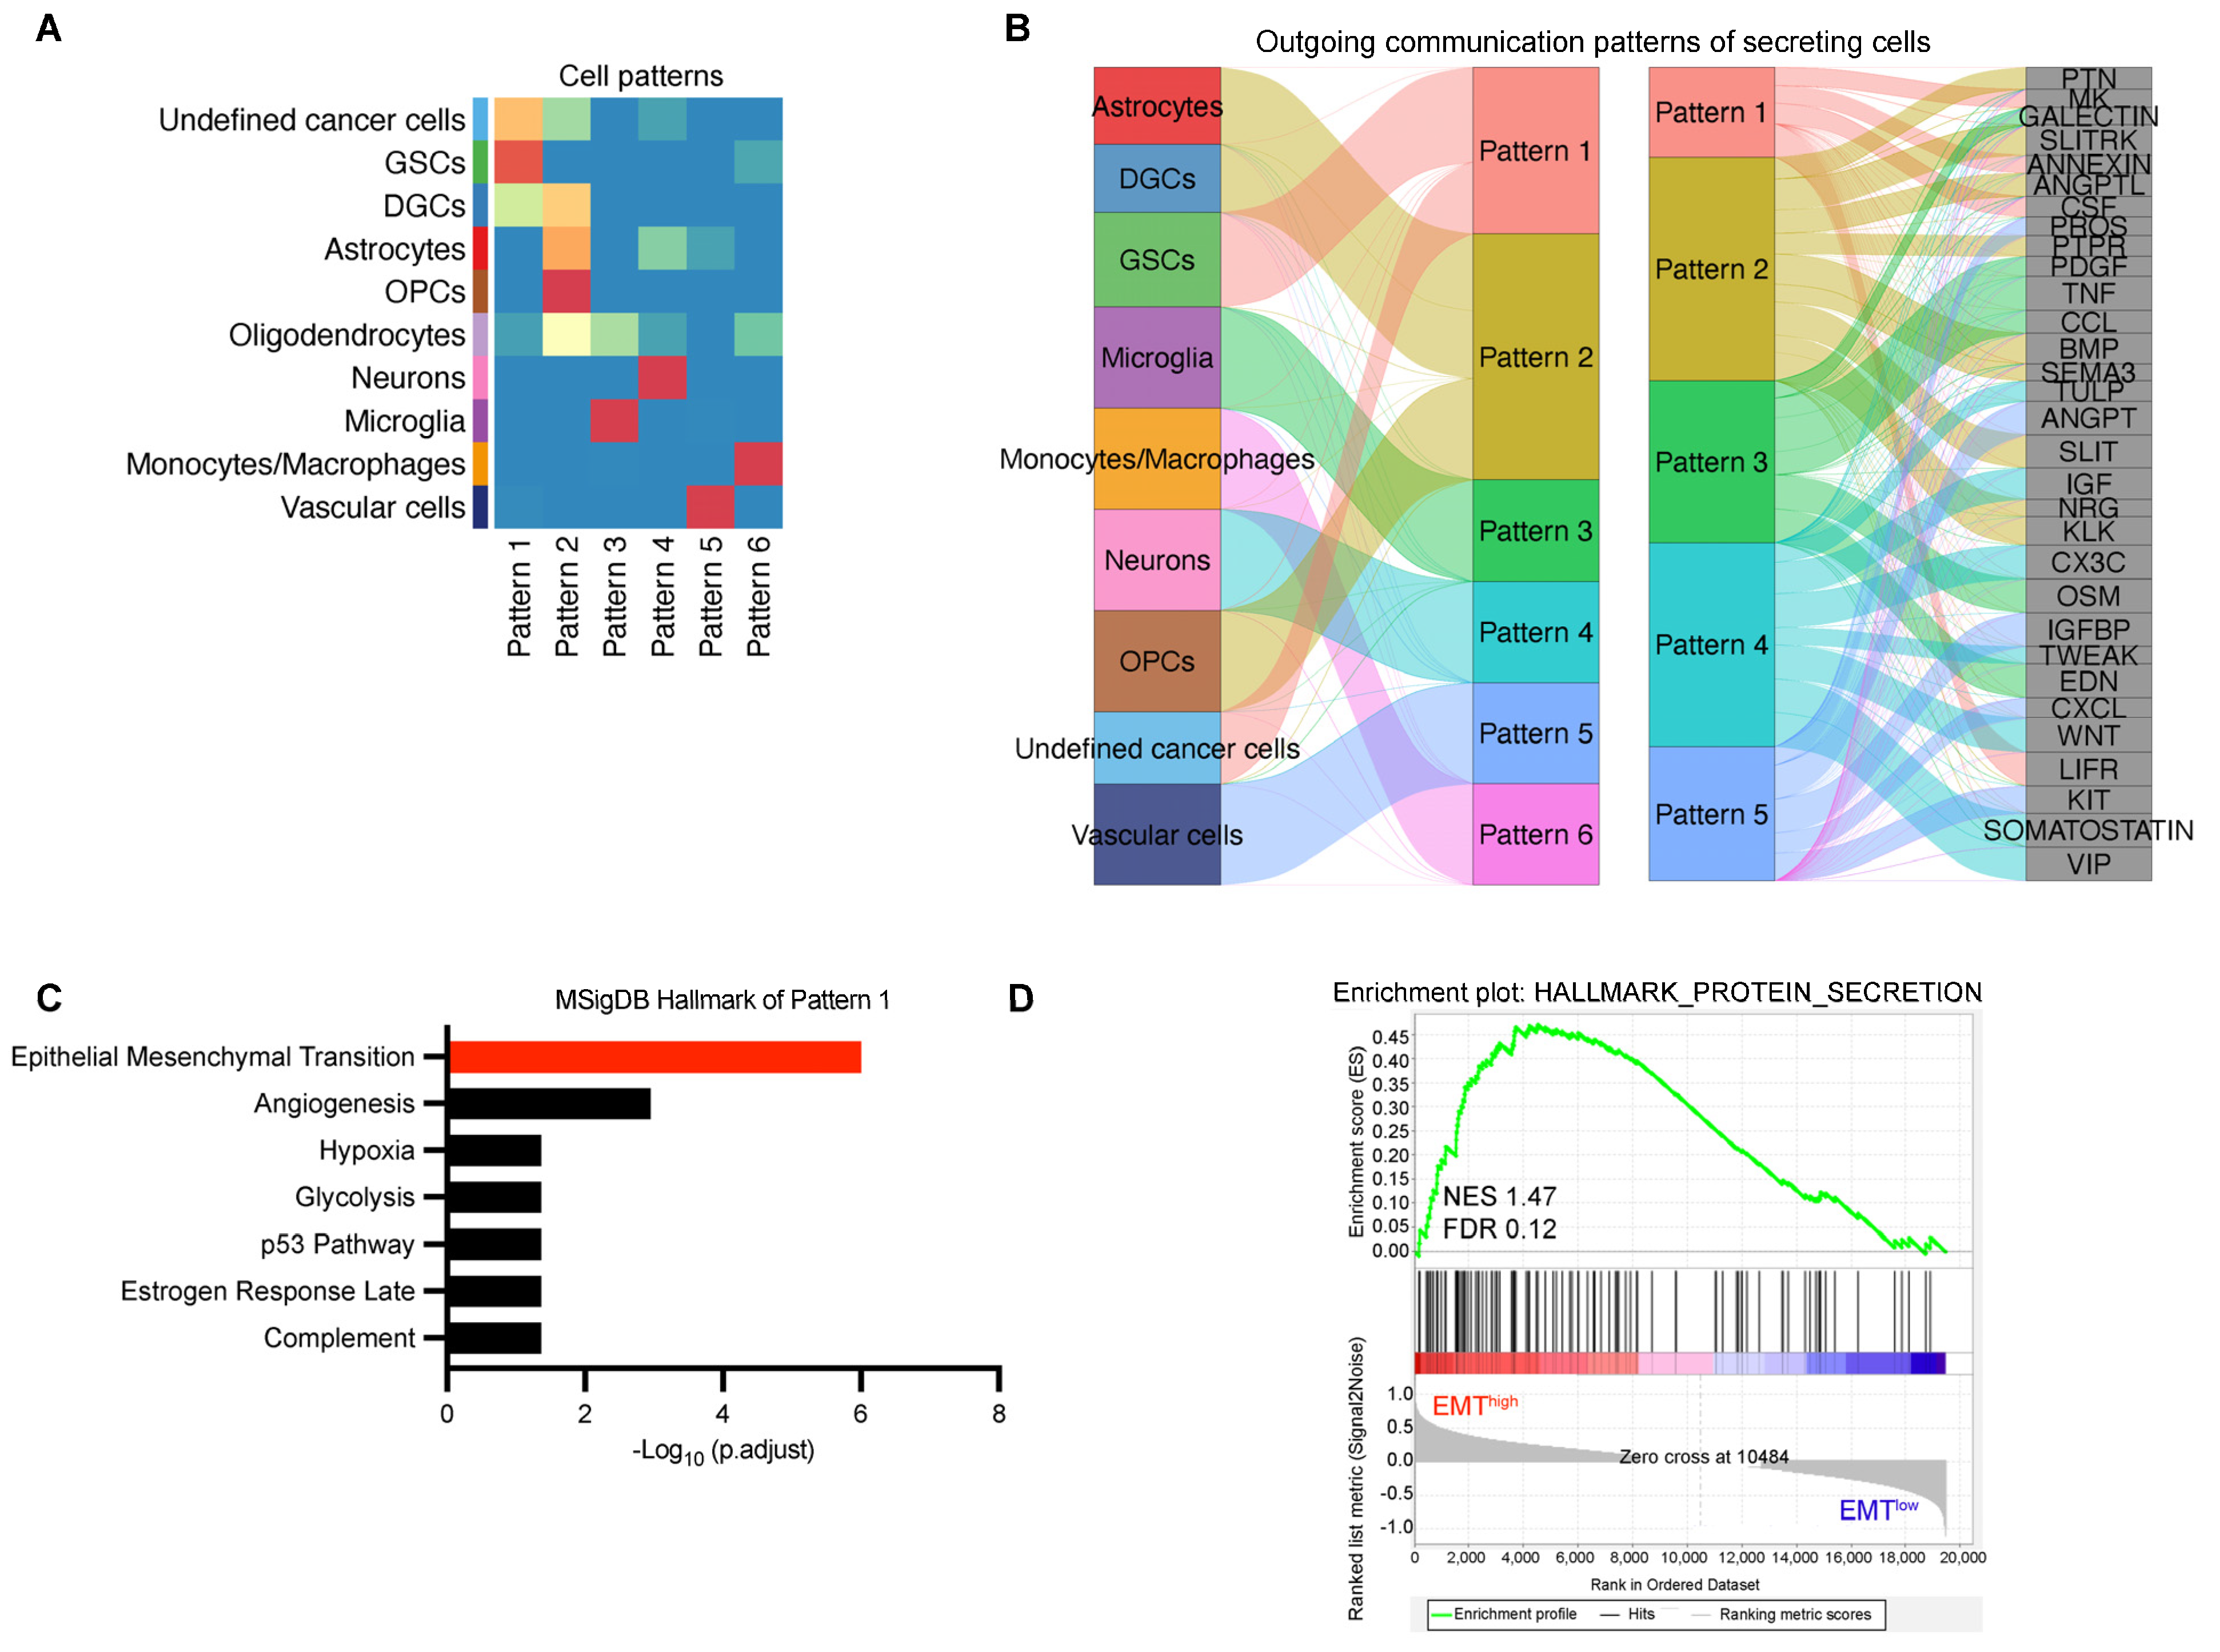
To further investigate how multiple cellular groups and signaling pathways coordinate their functions, we employed CellChat to identify global communication patterns using a pattern recognition approach. Through the selectK function, we inferred the optimal number of communication patterns to be six. The outgoing communication patterns revealed how sender cells (i.e., signal-originating cells) coordinate with each other and interact with specific signaling pathways to drive cellular communication. Among these six outgoing patterns, GSCs were predominantly associated with Pattern 1 (Figure 3A), which encompasses signaling pathways including MK, ANNEXIN, CSF, and LIFR (Figure 3B).

Figure 3.
The cell communication pattern of GSCs is mostly related to EMT. (A) Identification of outgoing communication patterns in secretory cells. The color of the box indicates the contribution of the cell group or signaling pathway to each latent pattern, with warmer (red-shifted) spectra indicating elevated contribution indices and cooler (blue-shifted) spectra corresponding to diminished contribution values. (B) The inferred outgoing communication patterns of secreting cells, which shows the correspondence between the inferred latent patterns and cell groups, as well as signaling pathways. The thickness of the flow indicates the contribution of the cell group or signaling pathway to each latent pattern. (C) KEGG analysis of the genes associated with pathways in Pattern 1, ranked on the basis of adjusted p-values. (D) GSEA of TCGA-GBM data. Normalized enrichment score (NES) and false discovery rate (FDR) are shown.
KEGG analysis of the genes associated with these pathways demonstrated significant enrichment in EMT processes (Figure 3C). Previous studies have demonstrated that MK promotes EMT-mediated cisplatin resistance [33]. Members of the ANNEXIN family, including ANXA2, can form complexes with TTK, which activate the Akt/mTOR signaling pathway and promote EMT [34]. G-CSF and CSF-1 were key factors, which promoted the EMT, migration, and invasion of trophoblasts via activating the PI3K/Akt/Erk1/2 signaling pathway [35,36]. LIFR, functioning as a target of KMT2D, epigenetically activates the PI3K/Akt pathway and drives EMT [37]. Subsequent GSEA of TCGA-GBM data further revealed that enhanced enrichment of EMT-related genes correlated with increased secretory protein production capacity (Figure 3D). These findings collectively suggest a strong association between secretory protein signaling in GSCs and EMT activation.
3.5. Spatial Co-Localization of EMT and GSCs in GBM
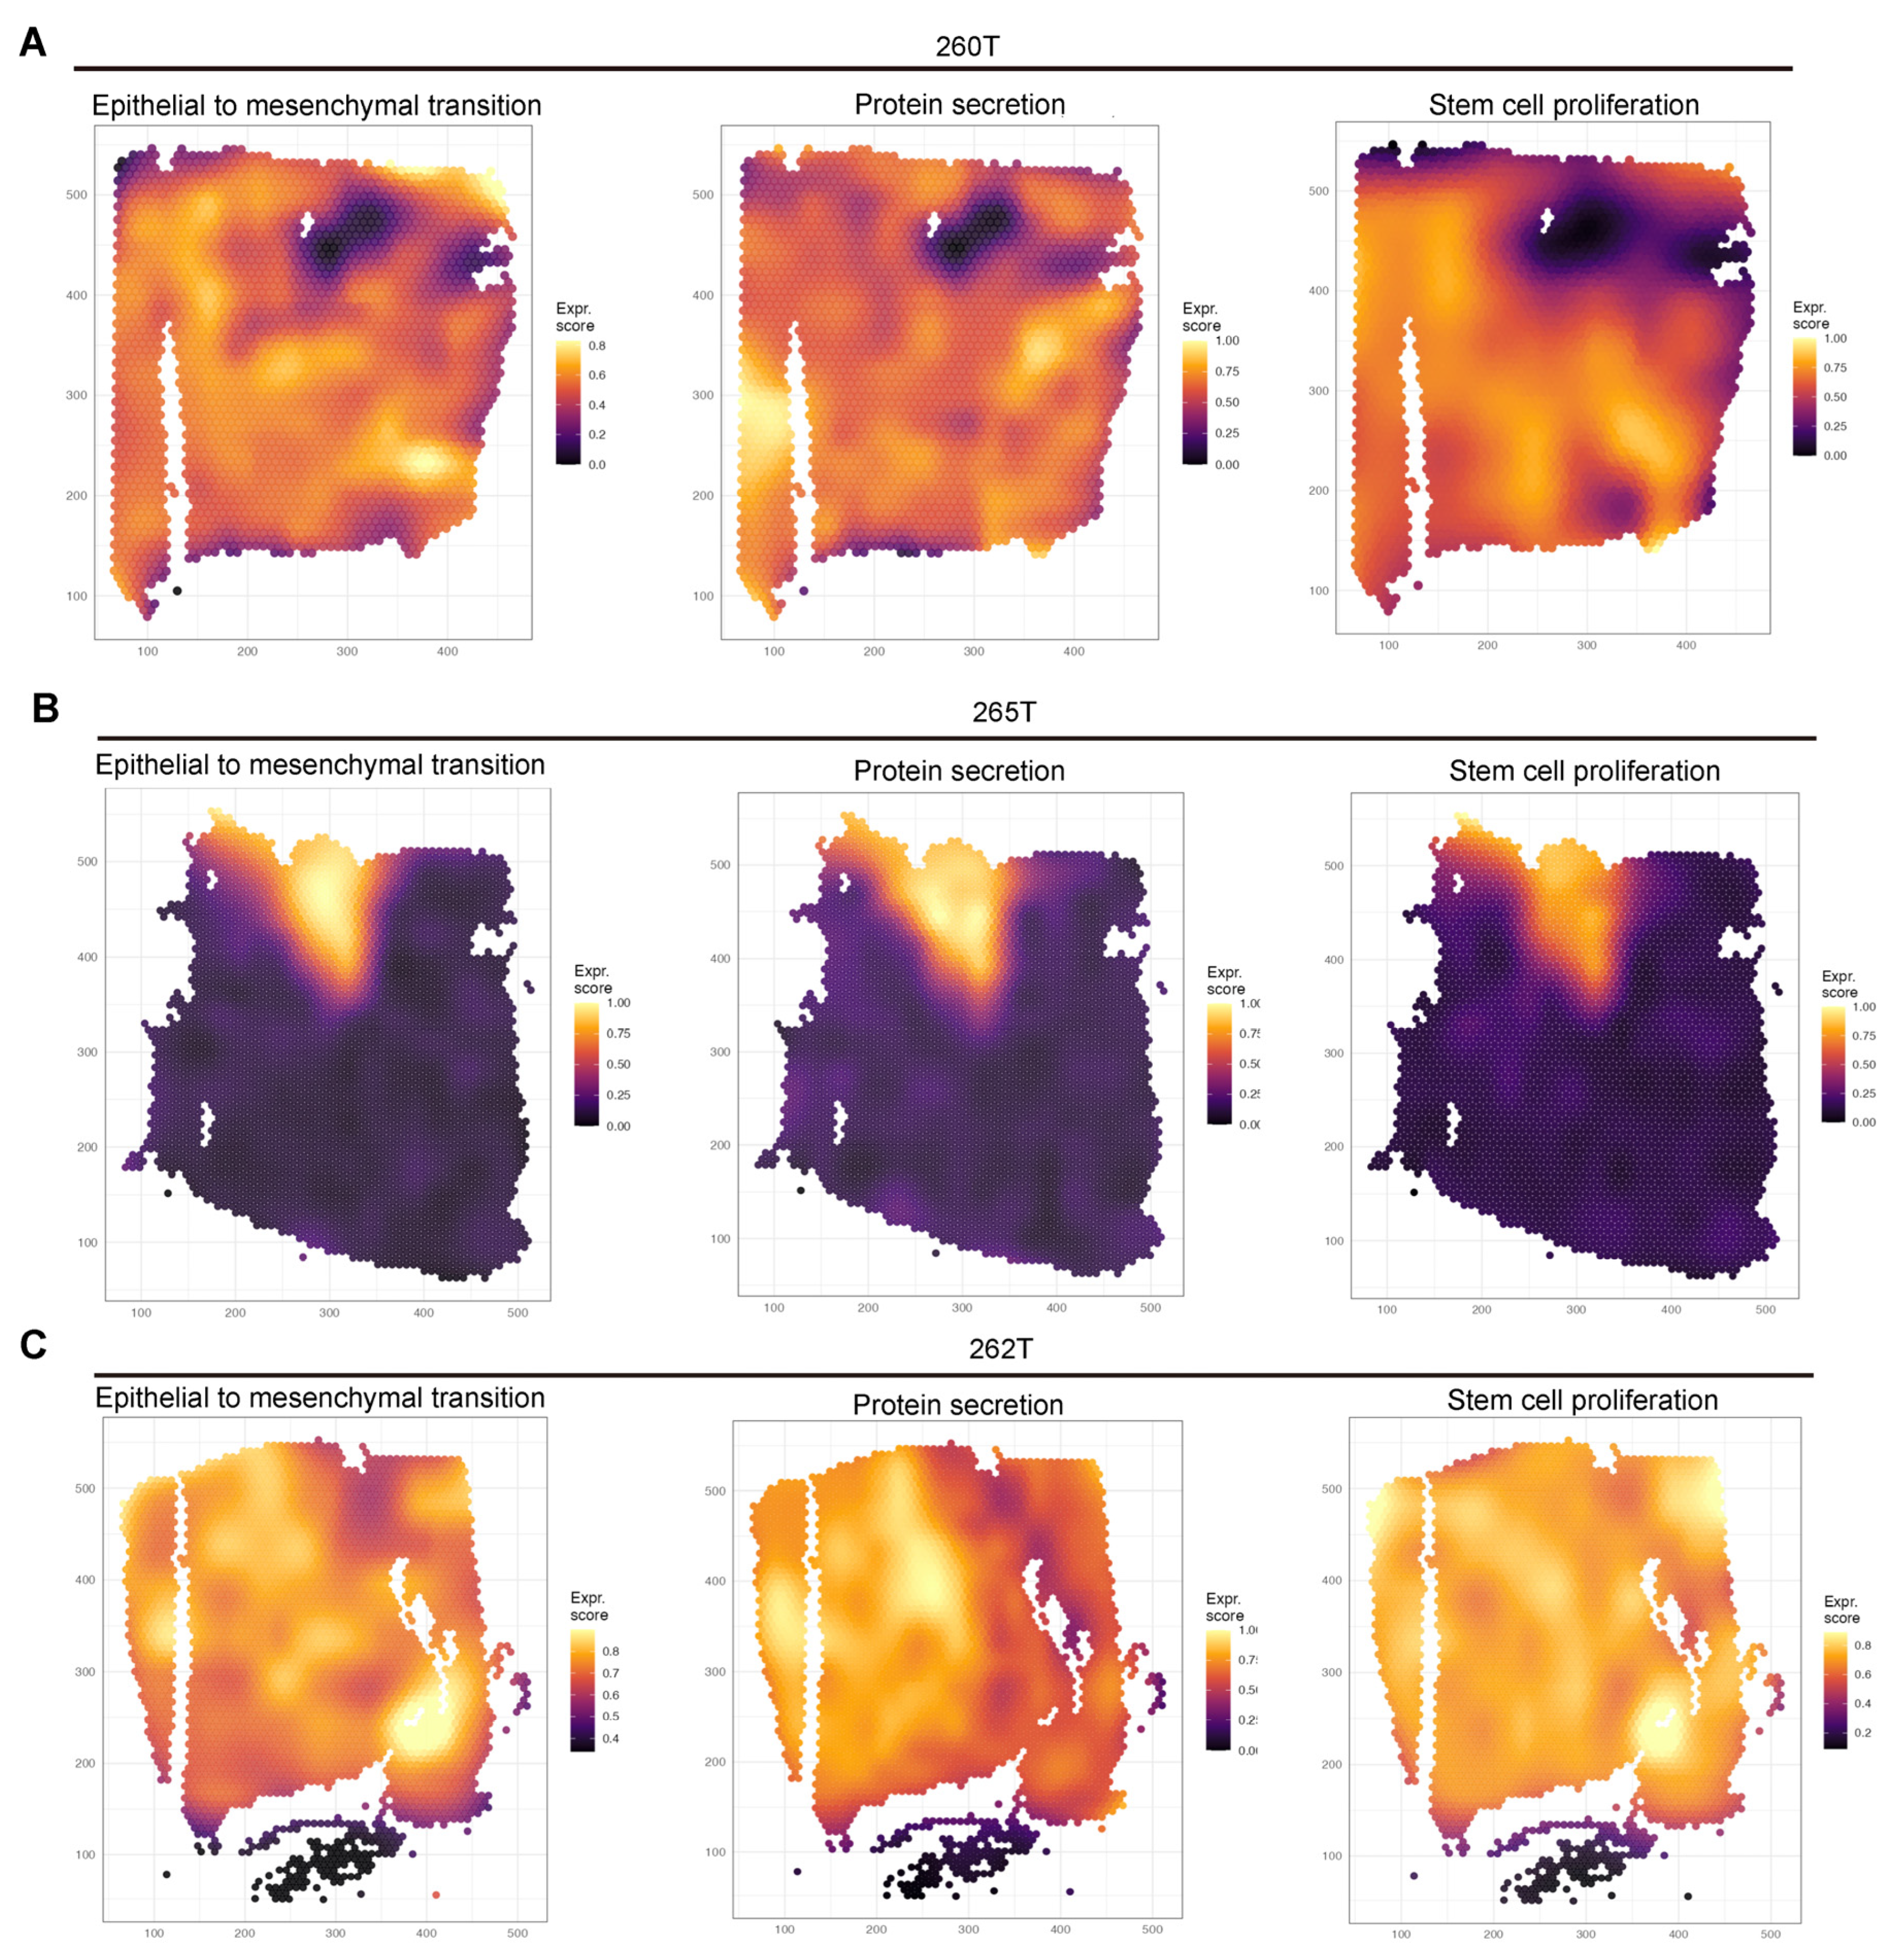
To investigate the spatial correlation between EMT expression patterns and GSCs, we analyzed spatial transcriptomic data from three GBM specimens [32] (Figure 4A–C). Intriguingly, our findings revealed striking spatial concordance among stem cell proliferation, protein secretion activity, and EMT activation patterns.
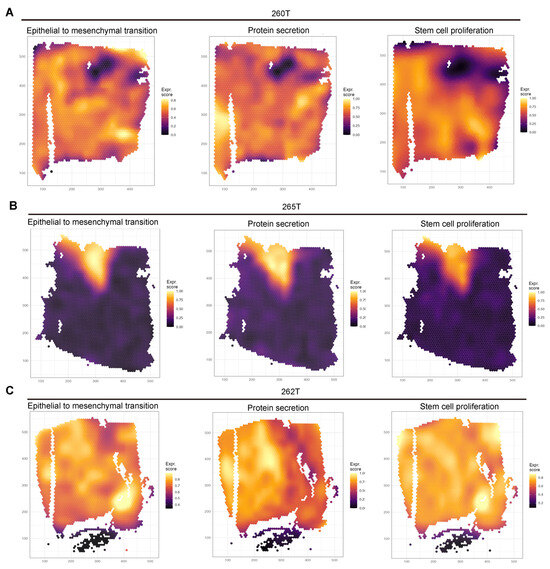
Figure 4.
Spatial co-localization of EMT and GSCs in GBM. (A–C) Spatial GBM patient sample (UKF#260, #265, #262). Reference mapping was performed using SpaceXR (Version 1.0) and SPATA2 (Version 3.1.3) software. Data sourced from Datadryad (https://doi.org/10.5061/dryad.h70rxwdmj).
3.6. Elevated Expression of EMT-Associated Genes in GBM
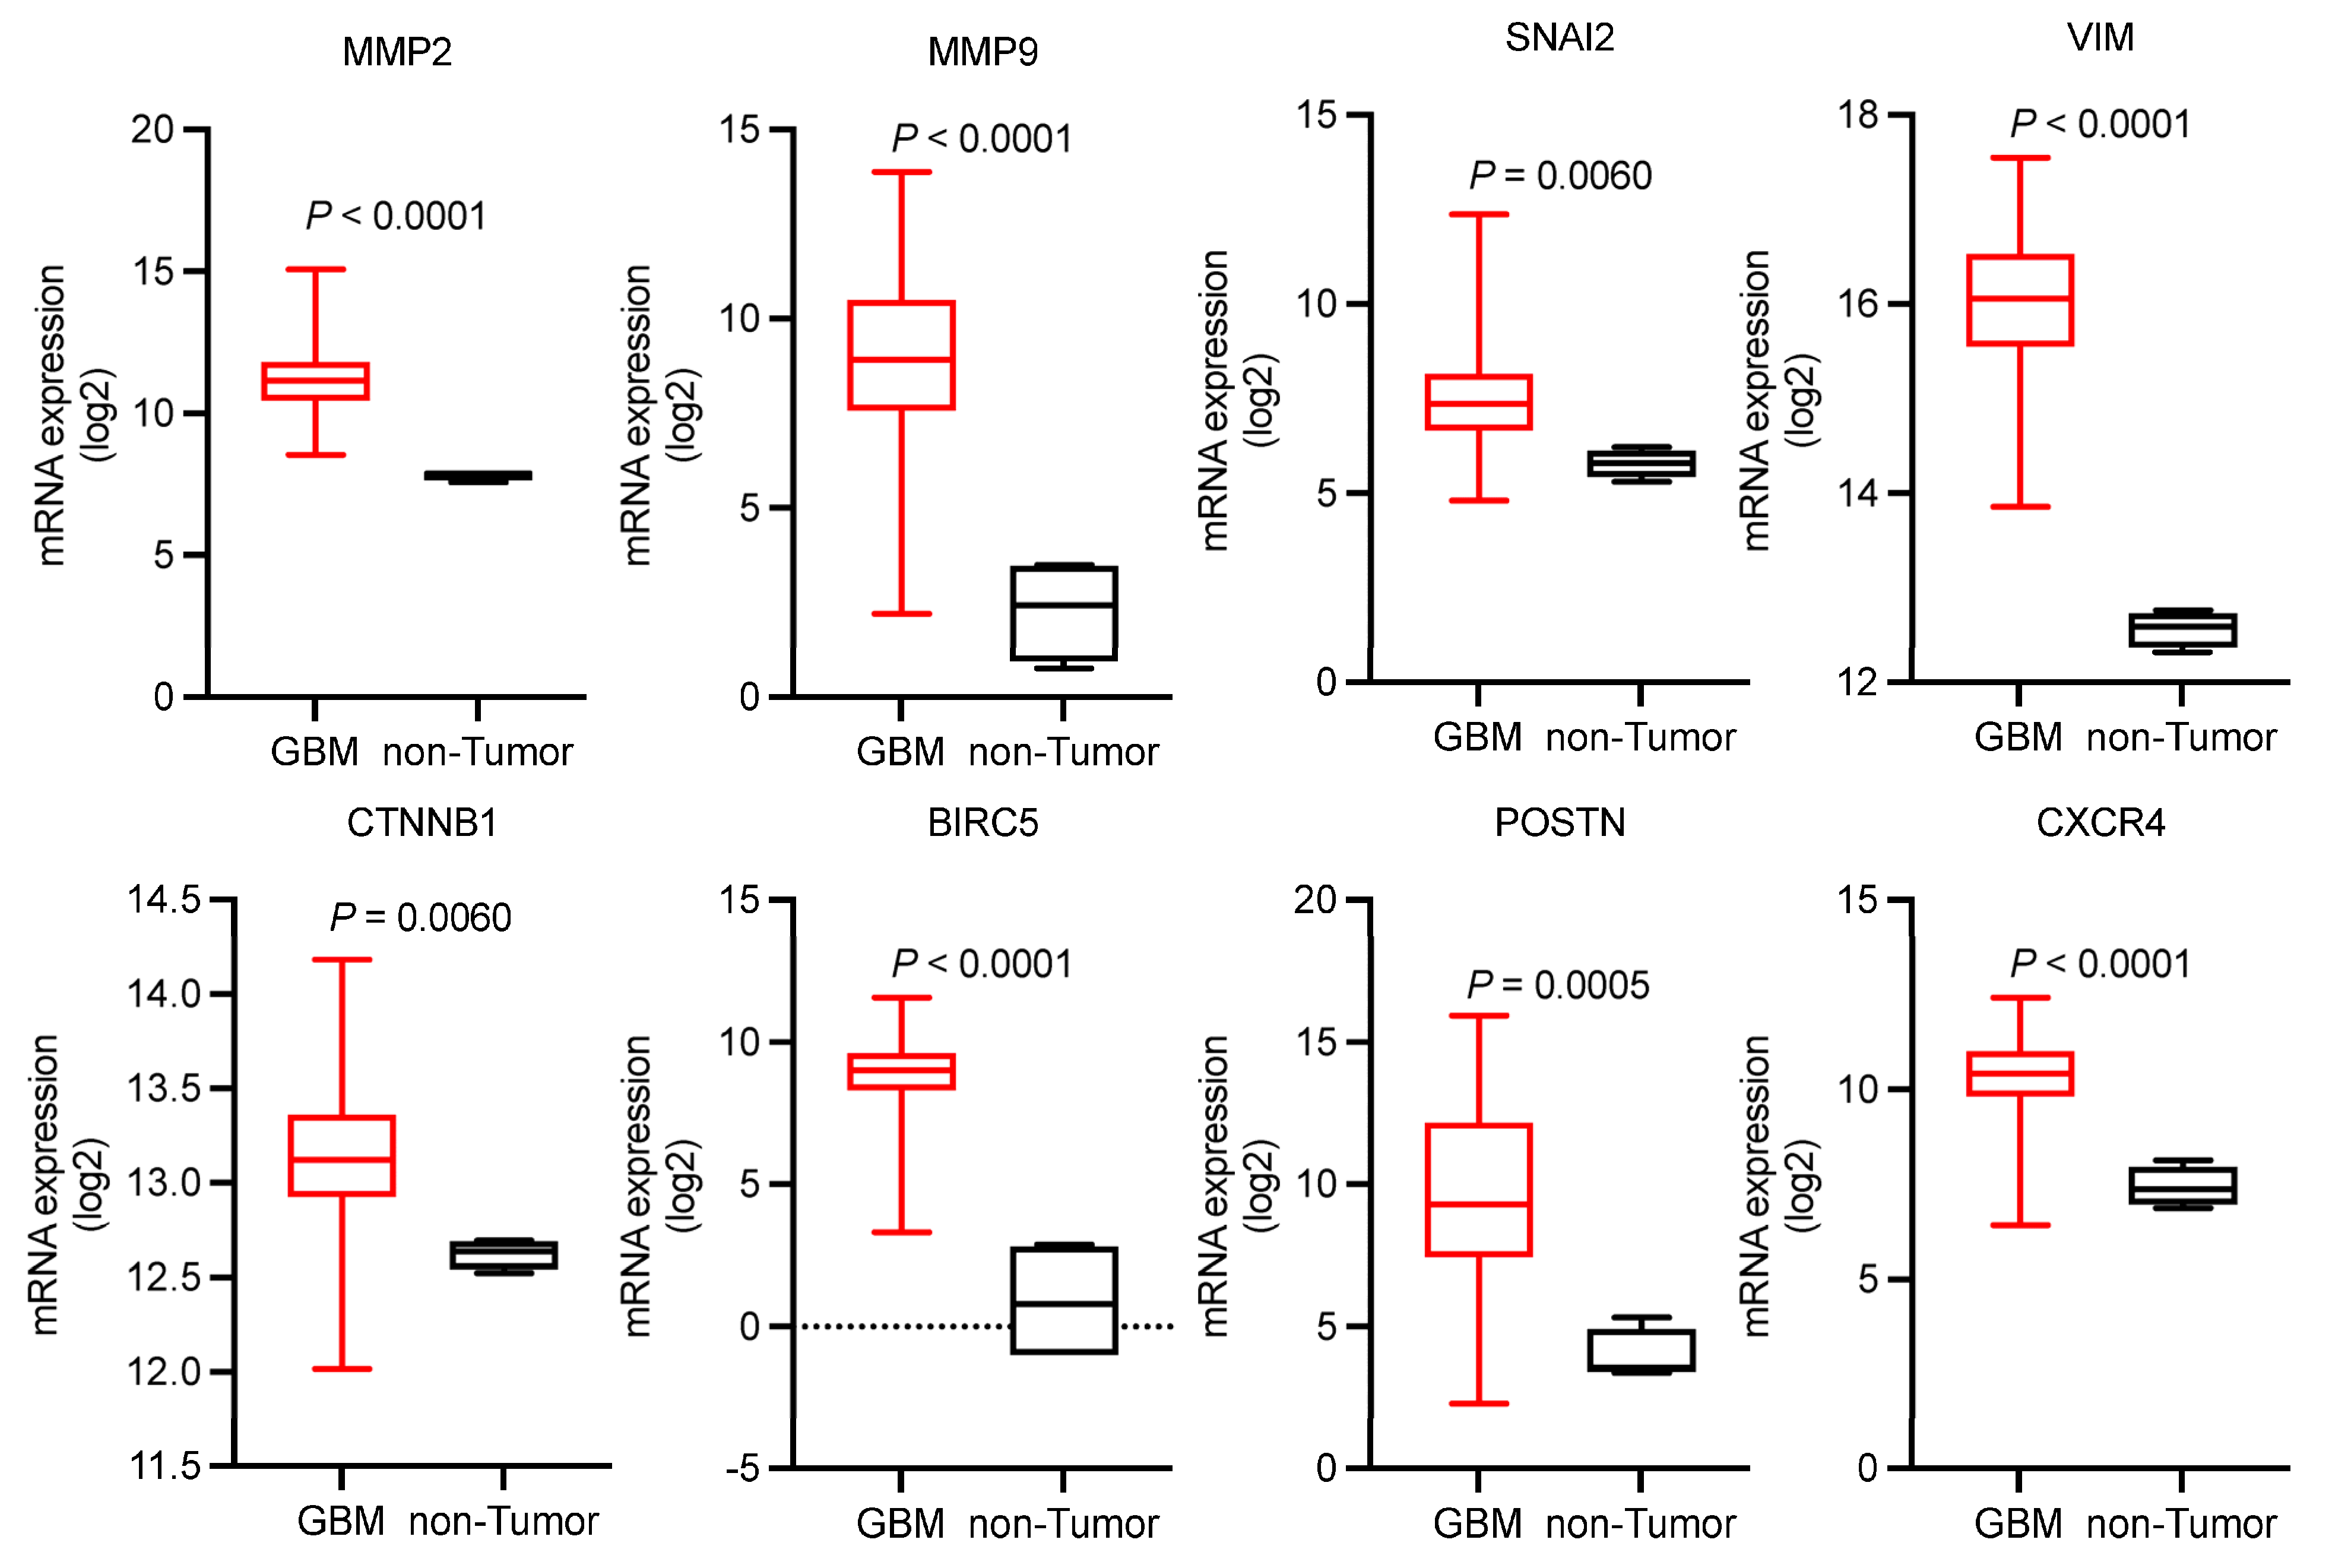
Subsequently, we sought to investigate the expression patterns of EMT-related genes in GBM. Given the extensive number of EMT-associated genes, we selected eight representative genes (MMP2, MMP9, SNAI2, VIM, CTNNB1, BIRC5, POSTN, CXCR4) for analysis [38]. Their expression profiles were analyzed using Gliovis platform within The Cancer Genome Atlas (TCGA) database. Comparative analysis revealed significant upregulation of all eight examined genes in GBM tissues compared to non-tumor controls (Figure 5). The majority of EMT-related genes in Pattern 1 of Figure 3C were also highly expressed in TCGA-GBM (Supplementary Figure S3).
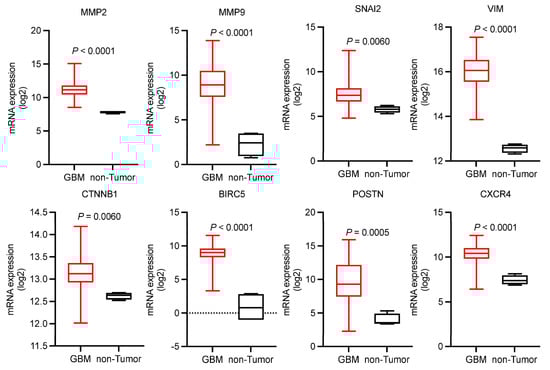
Figure 5.
Expression profiles of 8 EMT-related genes in GBM and non-tumor tissues. Box plots represent median expression values with interquartile ranges (IQRs). Data sourced from the Gliovis platform within The Cancer Genome Atlas (TCGA) database.
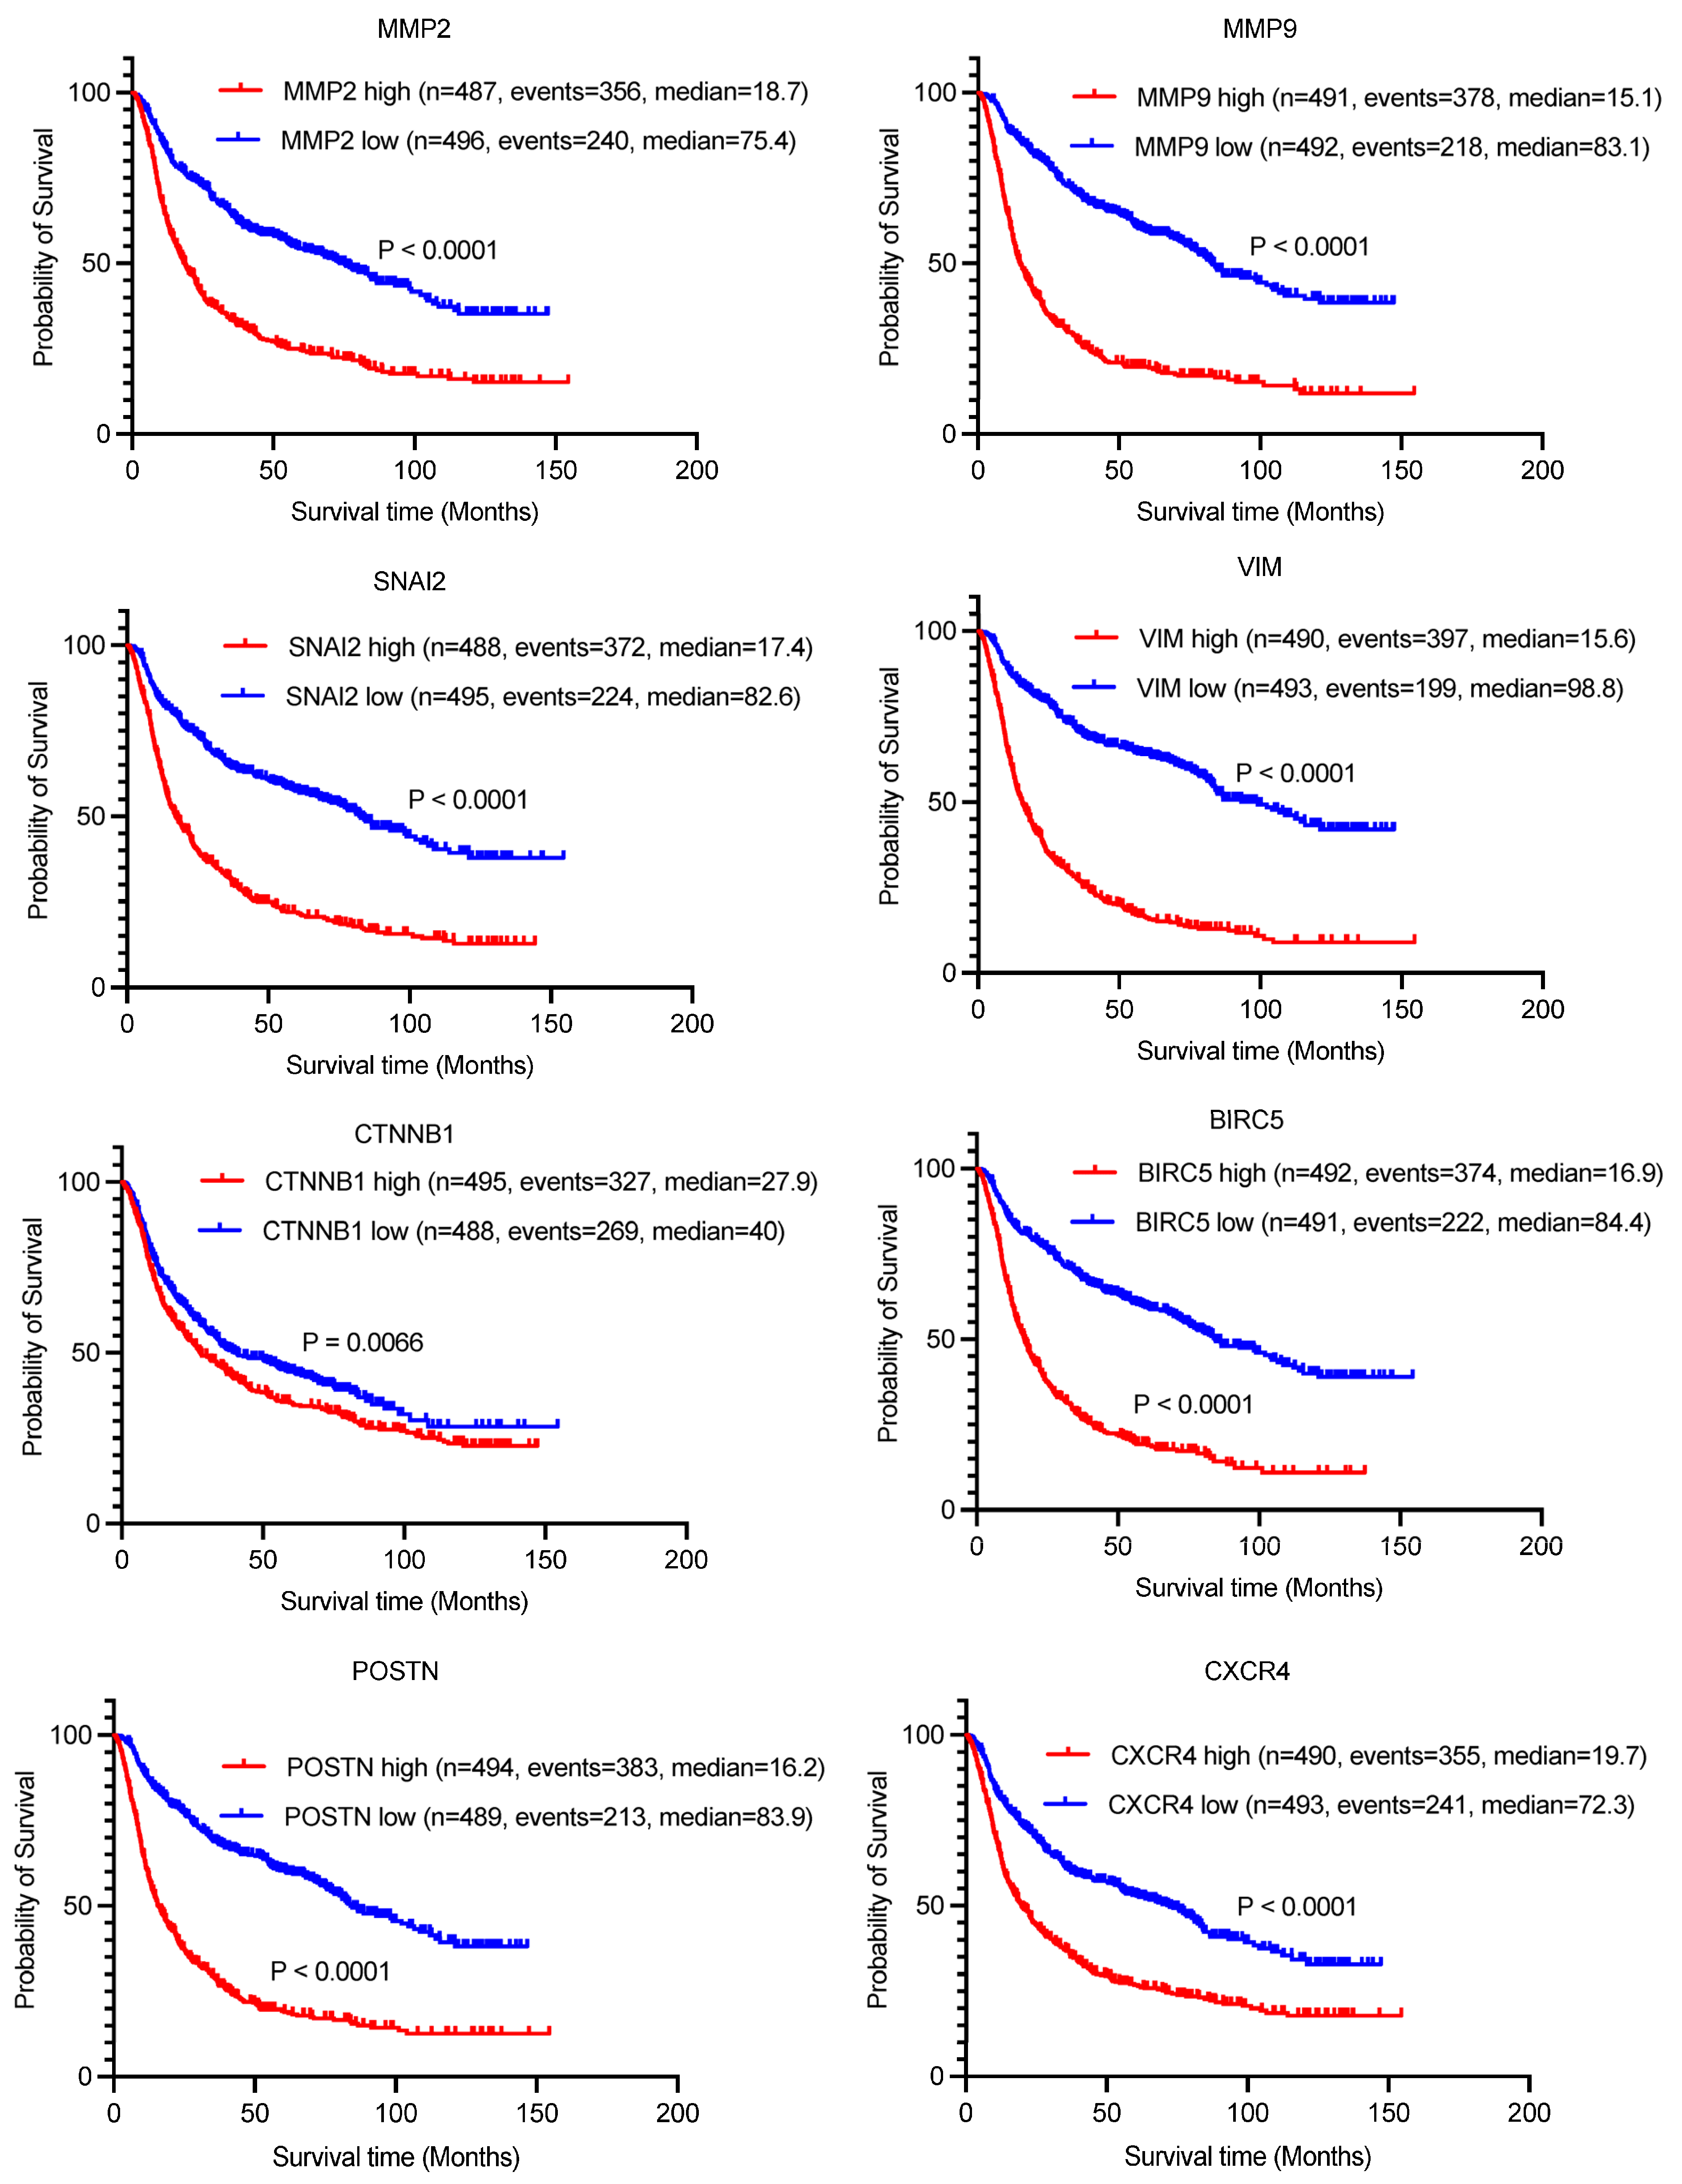
3.7. Elevated Expression of EMT-Associated Genes Correlates with Poor Prognosis
Next, we investigated the prognostic relevance of these highly expressed genes in glioma patients using the Chinese Glioma Genome Atlas (CGGA) database. Our analysis revealed that all eight genes exhibited significantly shorter overall survival times in high-expression groups compared to their low-expression counterparts, suggesting a negative correlation between these genes and patient prognosis (Figure 6).
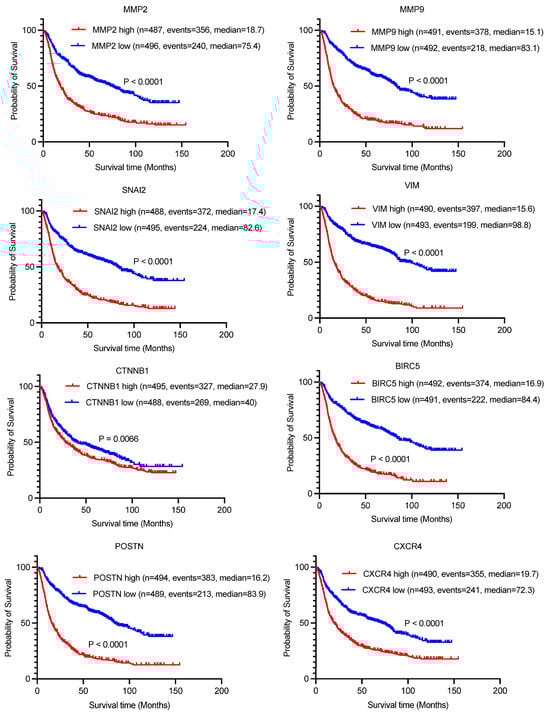
Figure 6.
Kaplan–Meier survival curves illustrating the association between the expression levels of 8 EMT-related genes and overall survival in glioma patients. Patients were stratified into high-expression (red lines) and low-expression (blue lines) groups based on median gene expression values. Log-rank test p-values are displayed for each gene. Data sourced from CGGA glioma cohort.
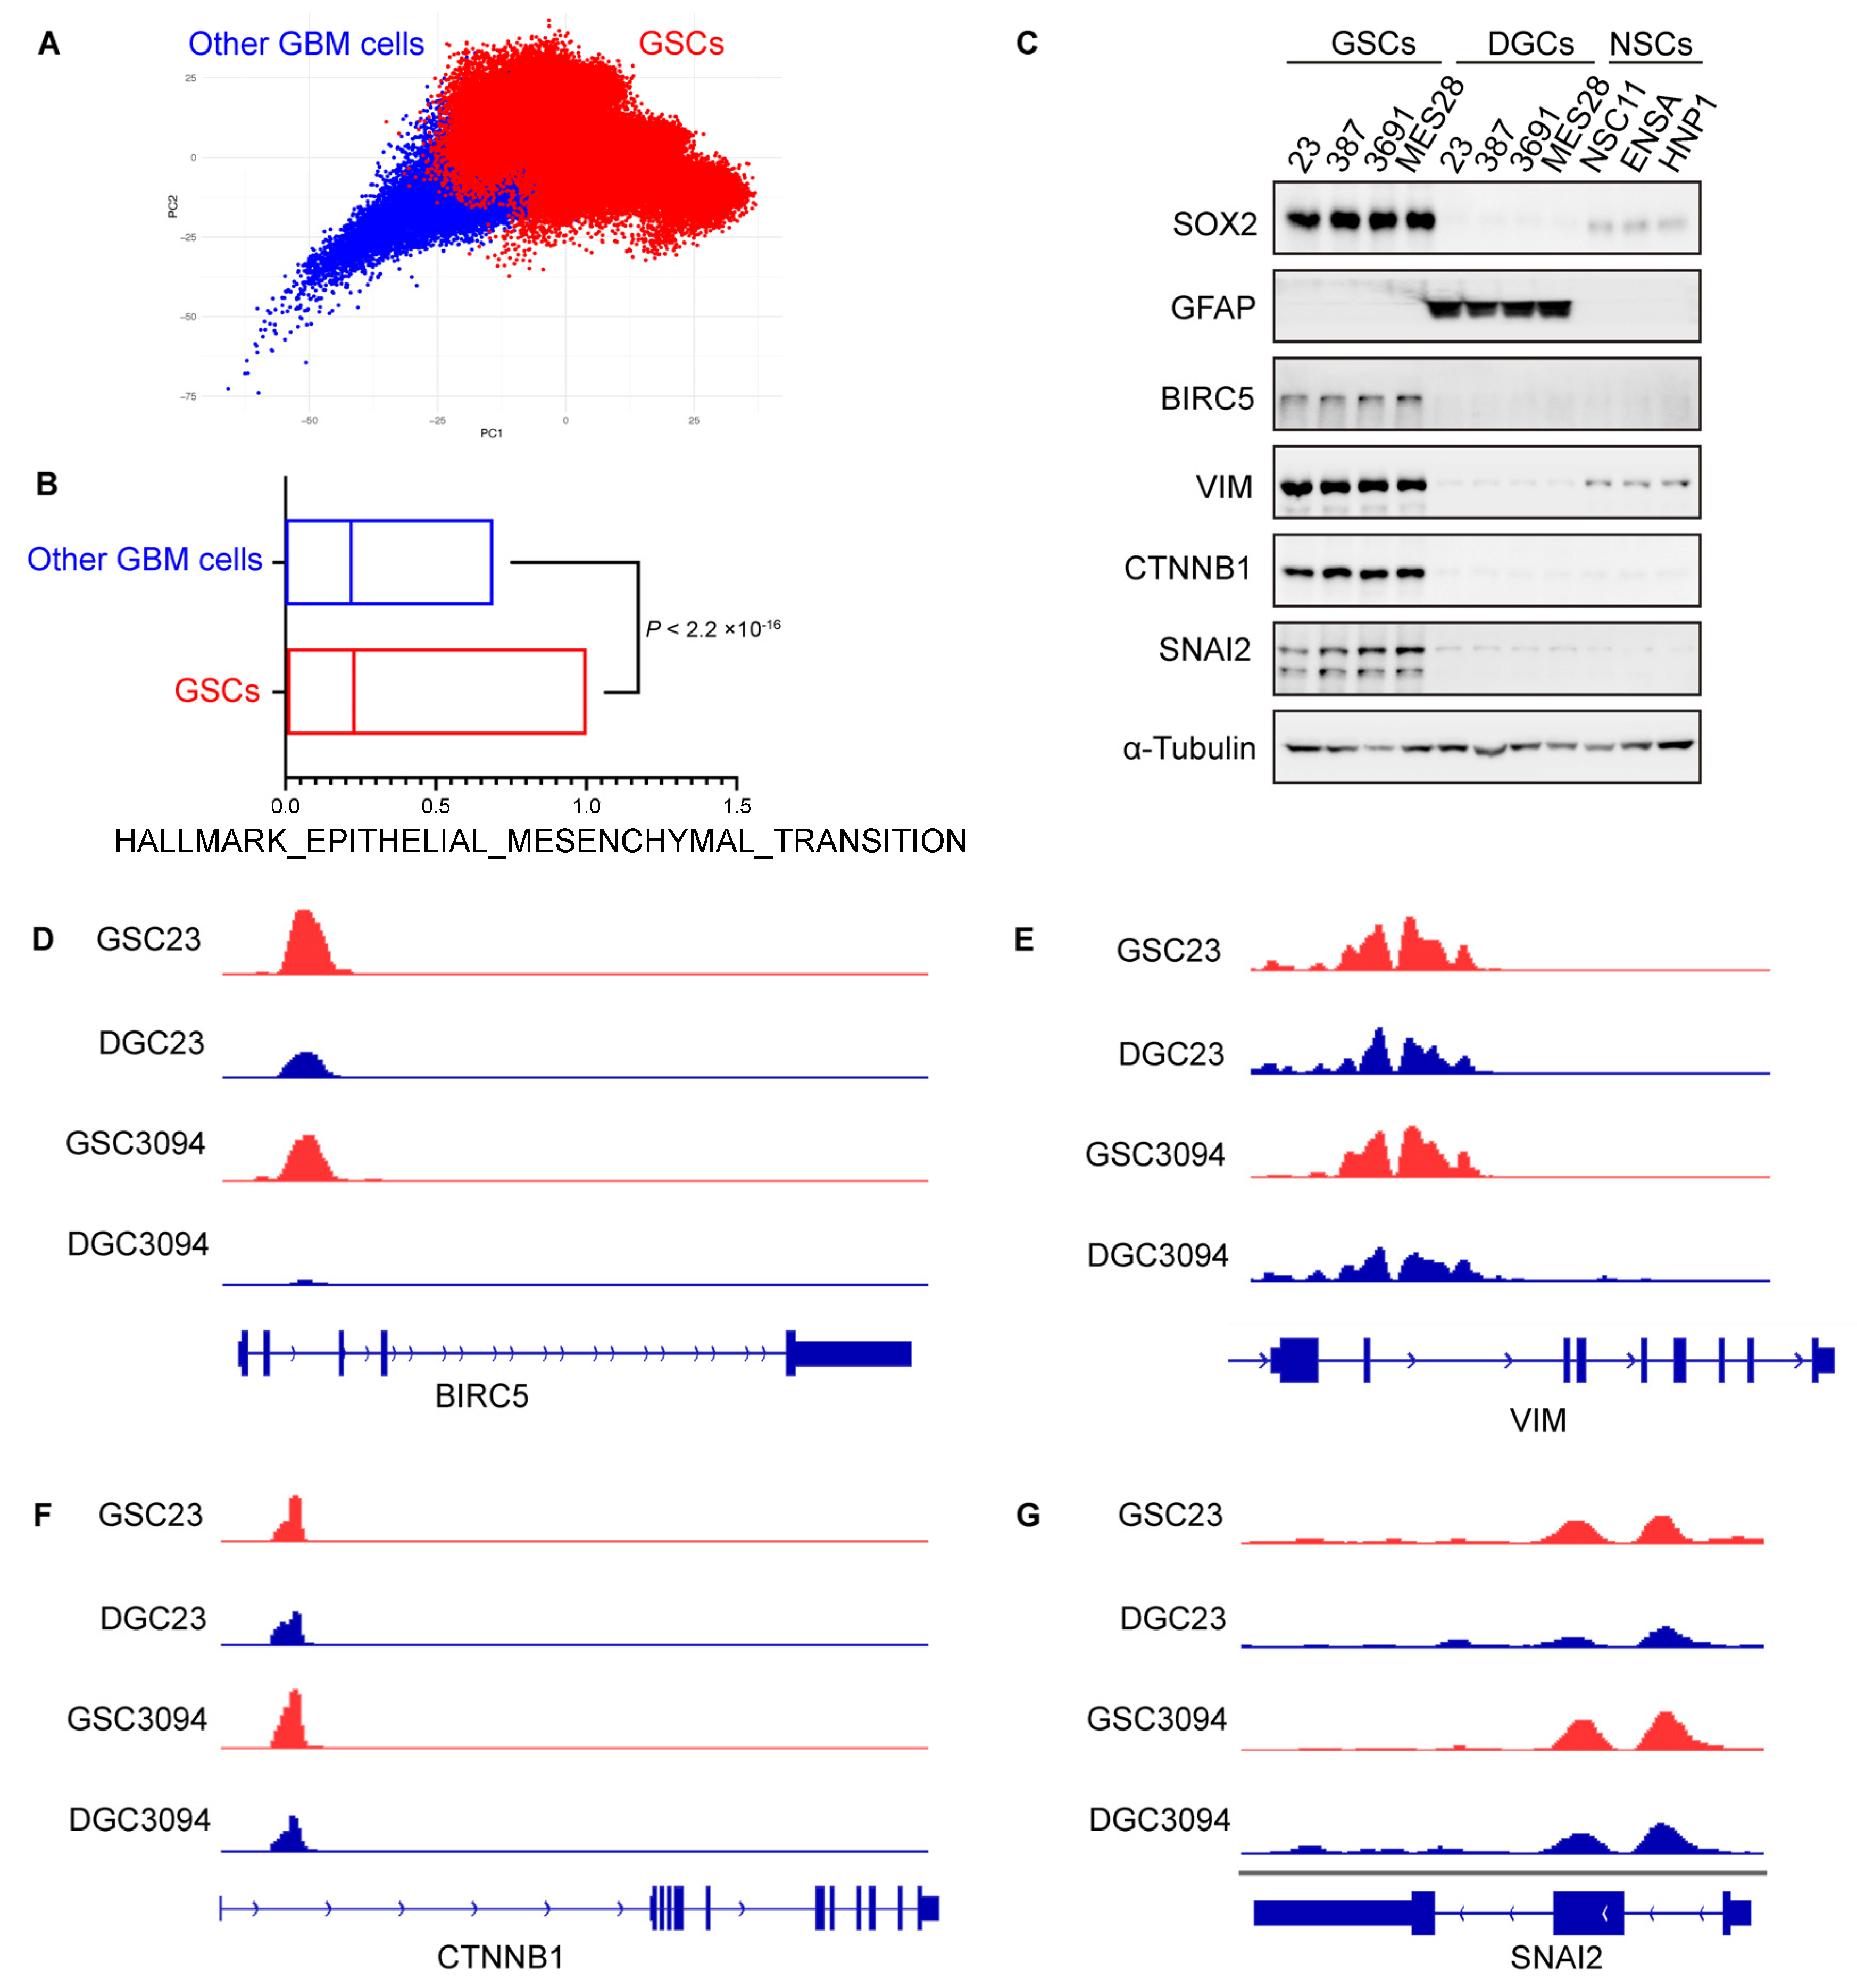
3.8. GSCs Exhibit Pronounced Overexpression of EMT-Associated Gene Signature in GBM
To compare the expression of EMT-related genes between GSCs and other GBM cells, we analyzed an additional scRNA-seq dataset comprising 28 early-passage GSC cultures derived from 24 patients and 14,207 malignant cells from seven patients with GBM [39] (Figure 7A). Our analysis revealed significantly higher expression levels of EMT-associated genes in GSCs compared to other GBM cell populations (Figure 7B).
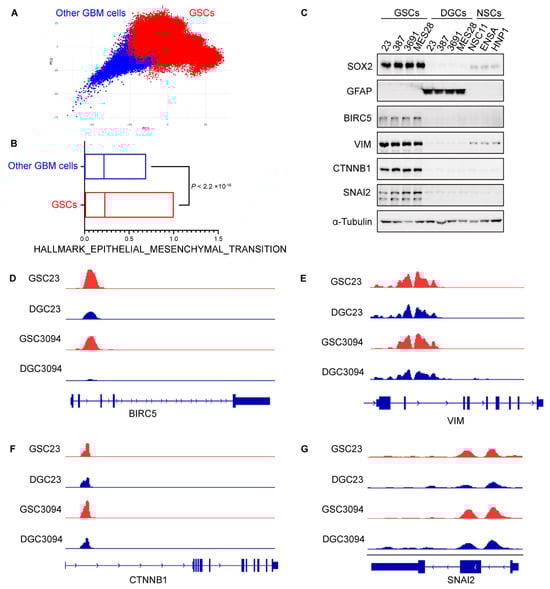
Figure 7.
GSCs exhibit pronounced overexpression of EMT-associated gene signature in GBM. (A) Distribution of all GSCs (n = 65,655), including 28 early-passage GSC cultures derived from 24 patients and all tumor cells (n = 14,207) from seven patients with GBM. (B) Quantification of hallmark of EMT in scRNA-seq data. Violin plots represent the overall distribution of data points. Box plots show median, upper, and lower quartiles; whiskers depict 1.5 times the interquartile range. (A,B) Data sourced from the Broad Institute Single-Cell Portal (https://singlecell.broadinstitute.org/single_cell/study/SCP503, accessed on 17 March 2025) and CReSCENT60 (https://crescent.cloud; accessed on 16 March 2025, study ID CRES-P23). (C) Immunoblots showing BIRC5, VIM, CTNNB1, and SNAI2 expression in the indicated cells. GFAP is a differentiation marker, and SOX2 is a stem cell marker. Immunoblots are representative of three independent experiments with similar results. (D–G) H3K27ac ChIP-seq tracks at BIRC5, VIM, CTNNB1, and SNAI2 gene loci. (D–G) Data sourced from the GEO dataset (GSE129438).
The protein expression levels of BIRC5, VIM, CTNNB1, and SNAI2 were demonstrated by immunoblot analysis to be significantly elevated in four GSC lines (MES28, GSC23, 387, 3691) compared to their DGC counterparts and three NSC lines (NSC11, ENSA, HNP1) (Figure 7C). In two pairs of matched GSCs and DGCs analyzed by H3K27ac ChIP-seq, the H3K27ac peaks of BIRC5, VIM, CTNNB1, and SNAI2 were consistently elevated in GSCs compared to their corresponding DGC counterparts (Figure 7D–G). This observation suggests that EMT-associated genes exhibit enhanced expression in GBM, particularly within the GSC population.
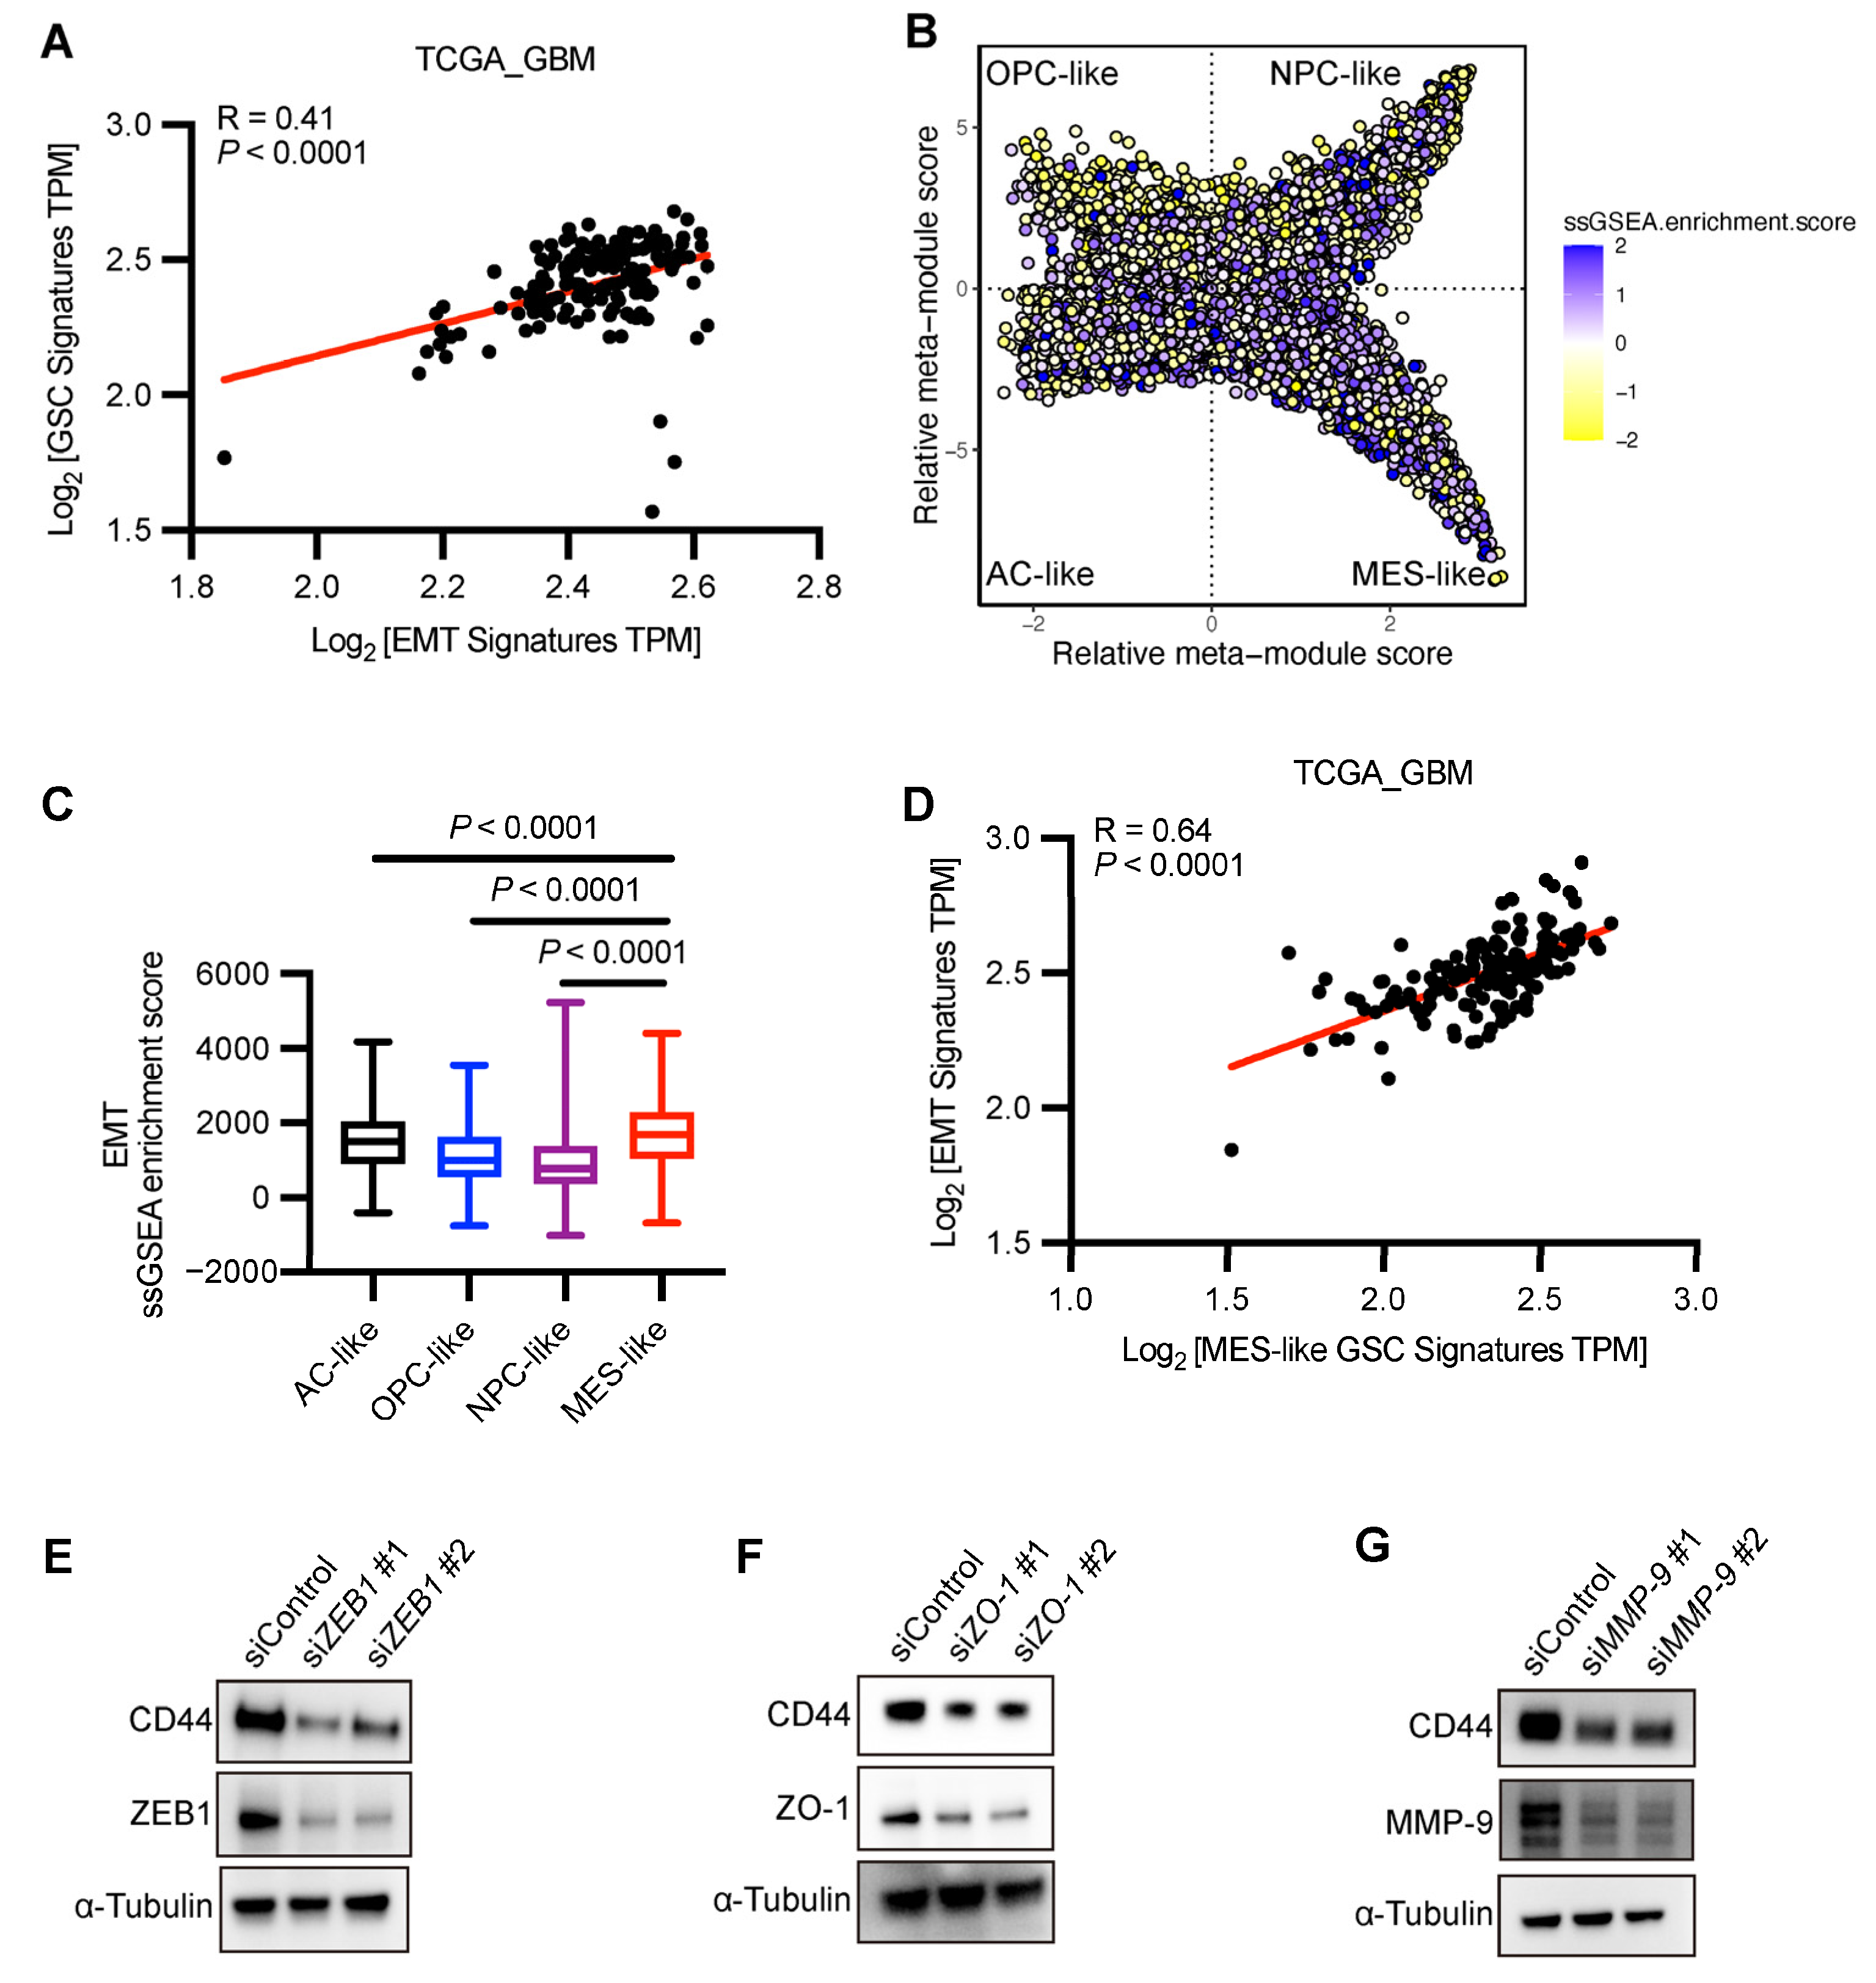
3.9. EMT-Related Genes Are More Enriched in MES-like GSCs
As previously demonstrated, a subset of EMT-related genes exhibits elevated expression in GSCs, and the EMT signatures demonstrate a positive correlation with the GSC signatures (Figure 8A).
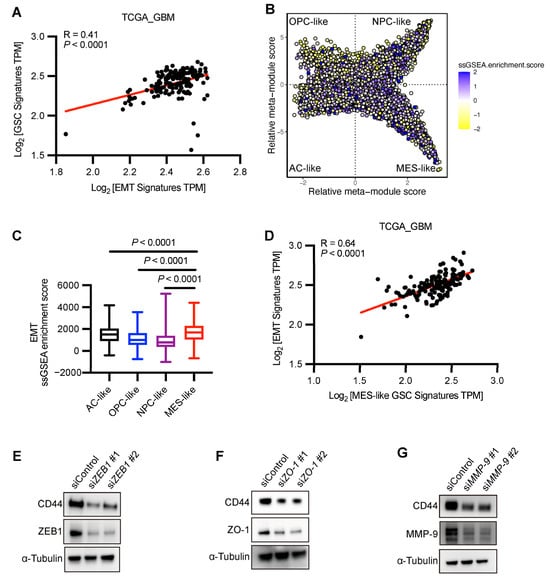
Figure 8.
EMT-related genes are more enriched in MES-like GSCs. (A) Pearson correlation of EMT signatures and GSC signatures in RNA-seq data of TGGA_GBM. The red line shows linear regression. (B) Two-dimensional representation of cellular states. Each quadrant corresponds to one cellular state, the exact position of malignant cells (dots) reflects their relative scores for the meta-modules, and their colors reflect the ssGSEA enrichment scores of EMT. (C) Box plots depict ssGSEA enrichment scores of EMT-related gene signatures across four GSC states. Each box represents the distribution of scores for a specific GSC state: AC-like (black), OPC-like (blue), NPC-like (purple), and MES-like (red). The central line within each box indicates the median value, while the box spans the interquartile range (IQR). Whiskers extend to 1.5× IQR. Statistical significance between groups was calculated by Wilcoxon rank-sum test. (B,C) Data sourced from GSE131928. (D) Pearson correlation of EMT signatures and MES-like GSC signatures in RNA-seq data of TGGA_GBM. The red line shows linear regression. (E–G) GSC23 cells were transfected with control, ZEB1, ZO-1, or MMP-9 siRNAs for 48 h. Then, immunoblots were performed using CD44, ZEB1, ZO-1, MMP-9, and α-tubulin antibodies.
It was reported that different states of GSCs that are thought to act as key cancer drivers can spread tumors and resist radiation/chemo treatments better than other cells [8,40]. Cyril Neftel and colleagues categorized GSCs into four distinct phenotypic states based on cellular markers [14]: OPC-like, NPC-like, AC-like, and MES-like, which demonstrates the diversity of proliferating cells. To investigate the association between EMT-related genes and different GSC states, we performed ssGSEA analysis on those four GSC subtypes (GSE131928). The results revealed that MES-like GSCs exhibited the highest enrichment scores for EMT-related genes (Figure 8B,C), indicating their strongest correlation with the mesenchymal state. In the TCGA-GBM database, EMT-related genes also demonstrated significant correlations with MES-like GSC signatures (Figure 8D).
To confirm that EMT activation precedes MES differentiation in GBM progression, we transfected GSC23 cells with siRNAs targeting the most common EMT markers, e.g., ZEB1, ZO-1, and MMP-9, and subsequently examined the protein levels of CD44, a marker of the mesenchymal GSC subtype (Figure 8E–G). The results demonstrated that knockdown of EMT-related genes significantly reduced CD44 levels, further confirming that EMT activation precedes mesenchymal differentiation.
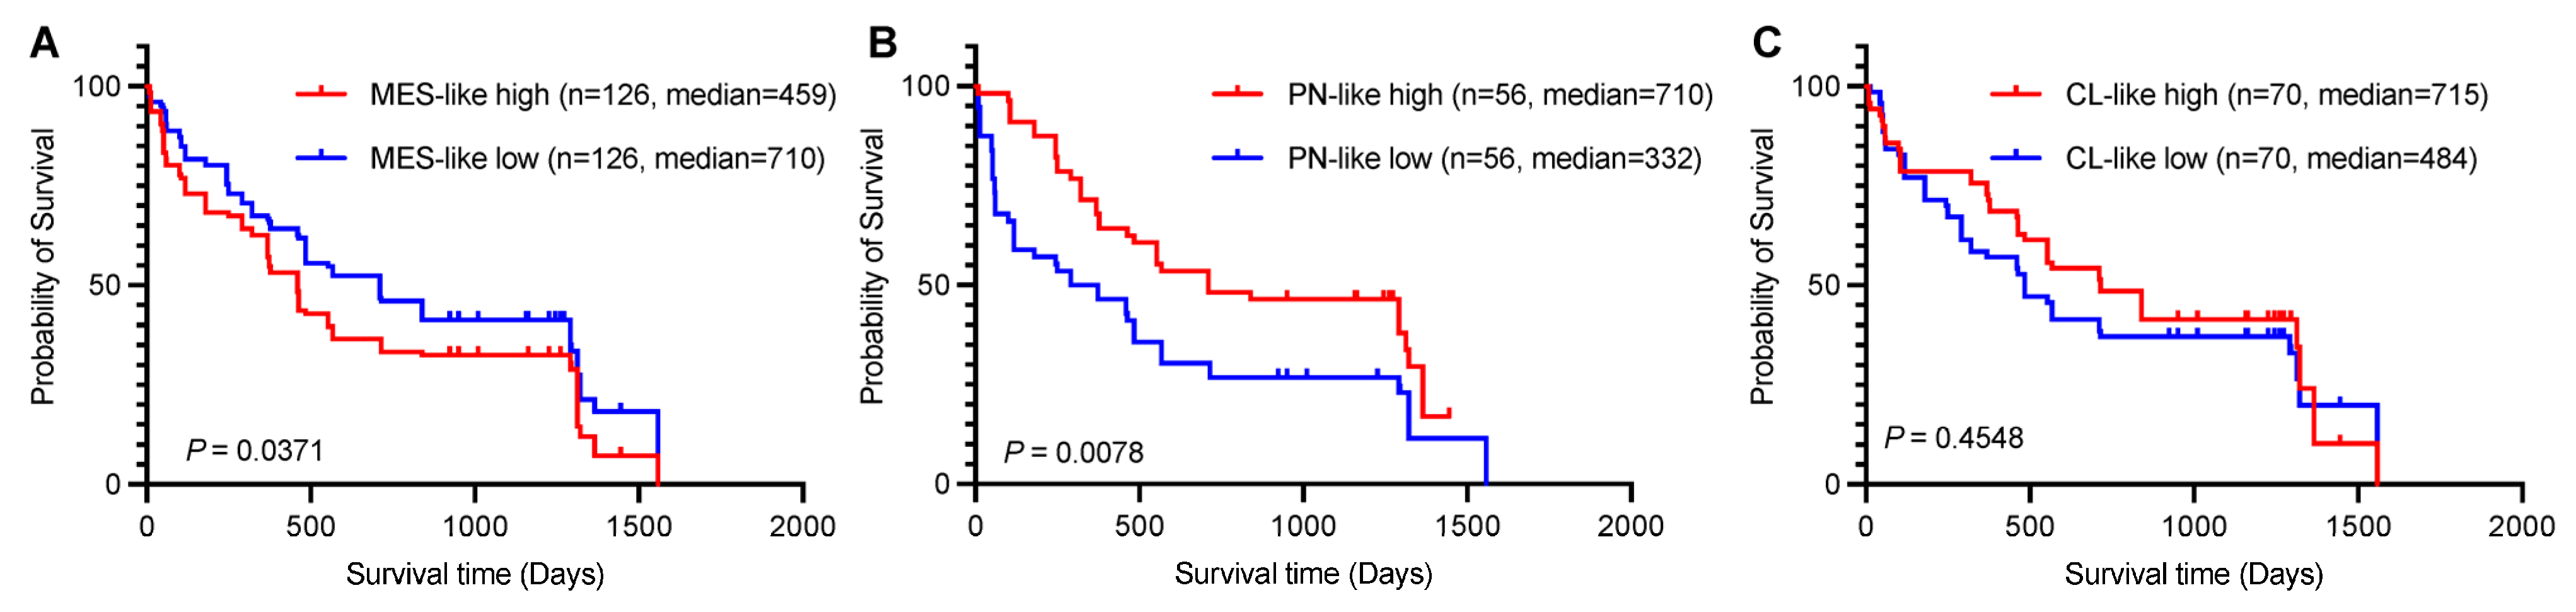
3.10. Clinical Significance: Worse Prognosis Associated with High MES-like Signature Expression in Brain Tumor Patients
Given the close association between EMT-related genes and MES-like GSCs, we next sought to investigate the clinical significance of MES-like signatures. Studies of intertumoral heterogeneity based on bulk expression profiles suggest that three subtypes of GBM exist, namely proneural (PN), classical (CL), and mesenchymal (MES) [41,42]. We performed survival analyses on all brain tumor patients [43] using the Brain TIME platform with these three subtypes of signatures (Figure 9A–C) and found that only the MES-like group demonstrated a significantly worse prognosis when exhibiting high expression levels (p = 0.0371).
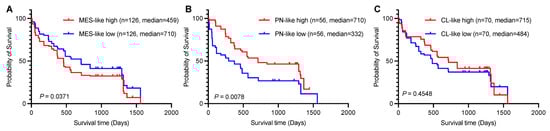
Figure 9.
High MES-like signature expression is associated with poor prognosis in brain tumor patients. (A–C) Kaplan–Meier survival curves illustrating the association between the expression levels of MES-like, PN-like, CL-like, and overall survival in all tumor patients. Patients were stratified into high-expression (red lines) and low-expression (blue lines) groups based on median gene expression values. Log-rank test p-values are displayed for each gene. Data sourced from the Brain TIME platform [43].
4. Discussion
This study explored the communication pattern of GSCs in GBM. Existing studies have investigated cell–cell communication in GBM [44,45,46,47,48]; however, the majority have predominantly focused on elucidating the interactions between GSCs and immune cell populations [48,49]. For example, Cao et al. found that the MIF pathway was active between GSCs and myeloid-derived suppressor cells (MDSCs) [48]. GSCs may activate MDSCs to inhibit immune responses by secreting MIF. Li et al. identified important ligand–receptor interactions, including MIF binding with CD74 + CXCR4 or CD74 + CD44 and SPP1 binding with CD44 or ITGAV + ITGB1 [49]. They also highlighted the key role and higher interaction between monocytes/macrophages and MES-like malignant cells in the SPP1 signaling pathway, which is consistent with our results (Figure 1C). In our study, we focused on the most relevant biological functions of GSC signal pathways after enrichment analysis. Through KEGG analysis, we found that the cell communication patterns of GSC are most closely associated with EMT, suggesting that GSCs may play a role in promoting the mesenchymal transition of GBM (Figure 3).
The process of EMT involves a series of biochemical transformations in which epithelial cells, originally organized in a polarized sheet, acquire mesenchymal characteristics. This transition results in cells that exhibit reduced intercellular adhesion, increased mobility, and a mesenchymal phenotype. Additionally, these transformed cells develop distinct morphological features, enhanced resistance to apoptosis induced by detachment (anoikis), and increased tolerance to chemotherapy [50,51].
Because GBMs are not typical epithelial cells due to the absence of a basal membrane and inconsistent expression of E-cadherin, to coin the term “EMT” within the GBM context would be scientifically inaccurate. However, studies in recent years have found that the regulation of the classical EMT markers can induce the GBM cells to the invasive MES subtype [52,53]. Compared to bulk RNA-seq approaches in prior studies by Neftel et al. [14], we used CellChat to infer cell–cell communication and revealed that the expression of EMT-associated genes may serve as a driving force for MES-like phenotypic transformation, suggesting that these genes may act as transcriptional regulators of the MES phenotype. Our findings also indicate that EMT-related genes are more enriched in MES-like GSCs (Figure 8). These findings highlight the parallels in genetic profiles shared by both the MES transition and the classical EMT process, encompassing key elements such as traditional EMT markers, transcription factors, and the activation of signaling pathways.
Our study also revealed that MES signatures are associated with poorer prognostic outcomes in brain tumor patients compared with PN or CL signatures (Figure 9A). The PN and MES expression subtypes have been most consistently described in the literature, with PN relating to a more favorable outcome and MES relating to poor survival [54,55,56], which is consistent with our results with different datasets (Figure 9A,B). MES-like glioma cell differentiation status has been found to correlate with enrichment of macrophages/microglia [41,57,58]. It is also reported that EMT is the main way in which glioma-associated microglia/macrophages (GAMs) promote glioma progression [59]. These findings suggest that GSCs may facilitate MES differentiation through EMT-associated cell communication patterns, subsequently recruiting immunosuppressive GAMs. This cascade could contribute to GBM immune evasion, thereby promoting tumor progression. However, further experimental validation is required to substantiate these conclusions.
This study also has certain limitations and shortcomings. Firstly, the scRNA-seq database we utilized for CellChat contained a relatively small number of cells (n = 3589). To further validate our conclusions, it will be necessary to employ larger databases with greater cell numbers in future studies. Second, we relied on published retrospective datasets, necessitating future validation in a prospective, large cohort. Third, we should conduct more in-depth and detailed molecular biology studies in both in vivo and in vitro experiments to uncover the molecular mechanisms of MES differentiation of GSCs and identify new therapeutic targets.
5. Conclusions
Our study suggests that GSCs facilitate GBM progression through intercellular communication in the pattern of EMT. EMT-associated genes may drive the differentiation of GSCs toward a MES-like phenotype, thereby leading to poorer clinical outcomes. Consequently, targeting EMT-related pathways could represent a novel therapeutic strategy for GBM treatment.
Supplementary Materials
The following supporting information can be downloaded at: https://www.mdpi.com/article/10.3390/biomedicines13061304/s1, Figure S1: Original images for immunoblots in Figure 7C; Figure S2: Original images for immunoblots in Figure 8E–G; Figure S3: Expression profiles of EMT-related genes in Pattern 1 of Figure 3C in TCGA-GBM and non-tumor tissues.
Author Contributions
W.W., P.Z. and D.L.: writing—original draft, methodology, investigation, data analysis. K.H.: study design, writing—review and editing. All authors have read and agreed to the published version of the manuscript.
Funding
The author(s) declares that financial support was received for the research, authorship, and/or publication of this article. This work was supported by the National Natural Scientific Foundation of China (82303556).
Institutional Review Board Statement
Not applicable.
Informed Consent Statement
Not applicable.
Data Availability Statement
All data can be obtained from the corresponding author.
Acknowledgments
We thank the Joyce Lab for providing the user-friendly bioinformatics platform Brain TIME (https://joycelab.shinyapps.io/braintime/, accessed on 11 March 2025), which has significantly streamlined and accelerated our research process.
Conflicts of Interest
The authors declare no conflicts of interest.
Abbreviations
The following abbreviations are used in this manuscript:
| GBM | Glioblastoma |
| CNS | Central nervous system |
| SoC | Standard of care |
| GSCs | Glioma stem cells |
| TME | Tumor microenvironment |
| scRNA-seq | Single-cell RNA sequencing |
| EMT | Epithelial–mesenchymal transition |
| GEO | Gene Expression Omnibus |
| NCBI | National Center for Biotechnology Information |
| PCA | Principal component analysis |
| DGCs | Differentiated glioma cells |
| IGV | Integrative Genomics Viewer |
| KEGG | Kyoto Encyclopedia of Genes and Genomes |
| GSEA | Gene set enrichment analysis |
| ssGSEA | Single-sample GSEA |
| OPCs | Oligodendrocyte precursor cells |
| PTN | Pleiotrophin |
| MK | Midkine |
| SPP1 | Secreted phosphoprotein 1 |
| FGF | Fibroblast growth factor |
| CSF | Colony-stimulating factor |
| PROS | Prosaposin |
| TGF-β | Transforming growth factor beta |
| VEGF | Vascular endothelial growth factor |
| LIFR | Leukemia inhibitory factor receptor |
| CALCR | Calcitonin receptor |
| NES | Normalized enrichment score |
| FDR | False discovery rate |
| TCGA | The Cancer Genome Atlas |
| CGGA | Chinese Glioma Genome Atlas |
| OPC-like | Oligodendrocyte precursor cell-like |
| NPC-like | Neural progenitor cell-like |
| AC-like | Astrocyte-like |
| MES-like | Mesenchymal-like |
| IQR | Interquartile range |
| PN | Proneural |
| CL | Classical |
| MDSCs | Myeloid-derived suppressor cells |
| GAMs | Glioma-associated microglia/macrophages |
References
- Ostrom, Q.T.; Price, M.; Neff, C.; Cioffi, G.; Waite, K.A.; Kruchko, C.; Barnholtz-Sloan, J.S. CBTRUS Statistical Report: Primary Brain and Other Central Nervous System Tumors Diagnosed in the United States in 2015–2019. Neuro-Oncology 2022, 24, v1–v95. [Google Scholar] [CrossRef] [PubMed]
- Delgado-López, P.D.; Corrales-García, E.M. Survival in Glioblastoma: A Review on the Impact of Treatment Modalities. Clin. Transl. Oncol. Off. Publ. Fed. Span. Oncol. Soc. Natl. Cancer Inst. Mex. 2016, 18, 1062–1071. [Google Scholar] [CrossRef] [PubMed]
- Alexopoulos, G.; Zhang, J.; Karampelas, I.; Patel, M.; Kemp, J.; Coppens, J.; Mattei, T.A.; Mercier, P. Long-Term Time Series Forecasting and Updates on Survival Analysis of Glioblastoma Multiforme: A 1975-2018 Population-Based Study. Neuroepidemiology 2022, 56, 75–89. [Google Scholar] [CrossRef] [PubMed]
- Omuro, A.; DeAngelis, L.M. Glioblastoma and Other Malignant Gliomas: A Clinical Review. JAMA 2013, 310, 1842–1850. [Google Scholar] [CrossRef]
- Stupp, R.; Mason, W.P.; van den Bent, M.J.; Weller, M.; Fisher, B.; Taphoorn, M.J.B.; Belanger, K.; Brandes, A.A.; Marosi, C.; Bogdahn, U.; et al. Radiotherapy plus Concomitant and Adjuvant Temozolomide for Glioblastoma. N. Engl. J. Med. 2005, 352, 987–996. [Google Scholar] [CrossRef]
- Prager, B.C.; Bhargava, S.; Mahadev, V.; Hubert, C.G.; Rich, J.N. Glioblastoma Stem Cells: Driving Resilience through Chaos. Trends Cancer 2020, 6, 223–235. [Google Scholar] [CrossRef]
- Zhou, B.-B.S.; Zhang, H.; Damelin, M.; Geles, K.G.; Grindley, J.C.; Dirks, P.B. Tumour-Initiating Cells: Challenges and Opportunities for Anticancer Drug Discovery. Nat. Rev. Drug Discov. 2009, 8, 806–823. [Google Scholar] [CrossRef]
- Bao, S.; Wu, Q.; McLendon, R.E.; Hao, Y.; Shi, Q.; Hjelmeland, A.B.; Dewhirst, M.W.; Bigner, D.D.; Rich, J.N. Glioma Stem Cells Promote Radioresistance by Preferential Activation of the DNA Damage Response. Nature 2006, 444, 756–760. [Google Scholar] [CrossRef]
- Murat, A.; Migliavacca, E.; Gorlia, T.; Lambiv, W.L.; Shay, T.; Hamou, M.-F.; de Tribolet, N.; Regli, L.; Wick, W.; Kouwenhoven, M.C.M.; et al. Stem Cell-Related “Self-Renewal” Signature and High Epidermal Growth Factor Receptor Expression Associated with Resistance to Concomitant Chemoradiotherapy in Glioblastoma. J. Clin. Oncol. Off. J. Am. Soc. Clin. Oncol. 2008, 26, 3015–3024. [Google Scholar] [CrossRef]
- Quail, D.F.; Bowman, R.L.; Akkari, L.; Quick, M.L.; Schuhmacher, A.J.; Huse, J.T.; Holland, E.C.; Sutton, J.C.; Joyce, J.A. The Tumor Microenvironment Underlies Acquired Resistance to CSF-1R Inhibition in Gliomas. Science 2016, 352, aad3018. [Google Scholar] [CrossRef]
- Safa, A.R.; Saadatzadeh, M.R.; Cohen-Gadol, A.A.; Pollok, K.E.; Bijangi-Vishehsaraei, K. Glioblastoma Stem Cells (GSCs) Epigenetic Plasticity and Interconversion between Differentiated Non-GSCs and GSCs. Genes Dis. 2015, 2, 152–163. [Google Scholar] [CrossRef] [PubMed]
- Vieira de Castro, J.; Gonçalves, C.S.; Hormigo, A.; Costa, B.M. Exploiting the Complexities of Glioblastoma Stem Cells: Insights for Cancer Initiation and Therapeutic Targeting. Int. J. Mol. Sci. 2020, 21, 5278. [Google Scholar] [CrossRef] [PubMed]
- Gimple, R.C.; Yang, K.; Halbert, M.E.; Agnihotri, S.; Rich, J.N. Brain Cancer Stem Cells: Resilience through Adaptive Plasticity and Hierarchical Heterogeneity. Nat. Rev. Cancer 2022, 22, 497–514. [Google Scholar] [CrossRef]
- Neftel, C.; Laffy, J.; Filbin, M.G.; Hara, T.; Shore, M.E.; Rahme, G.J.; Richman, A.R.; Silverbush, D.; Shaw, M.L.; Hebert, C.M.; et al. An Integrative Model of Cellular States, Plasticity, and Genetics for Glioblastoma. Cell 2019, 178, 835–849.e21. [Google Scholar] [CrossRef] [PubMed]
- Giladi, A.; Cohen, M.; Medaglia, C.; Baran, Y.; Li, B.; Zada, M.; Bost, P.; Blecher-Gonen, R.; Salame, T.-M.; Mayer, J.U.; et al. Dissecting Cellular Crosstalk by Sequencing Physically Interacting Cells. Nat. Biotechnol. 2020, 38, 629–637. [Google Scholar] [CrossRef]
- Stubbington, M.J.T.; Rozenblatt-Rosen, O.; Regev, A.; Teichmann, S.A. Single-Cell Transcriptomics to Explore the Immune System in Health and Disease. Science 2017, 358, 58–63. [Google Scholar] [CrossRef]
- Vento-Tormo, R.; Efremova, M.; Botting, R.A.; Turco, M.Y.; Vento-Tormo, M.; Meyer, K.B.; Park, J.-E.; Stephenson, E.; Polański, K.; Goncalves, A.; et al. Single-Cell Reconstruction of the Early Maternal-Fetal Interface in Humans. Nature 2018, 563, 347–353. [Google Scholar] [CrossRef]
- Jin, S.; MacLean, A.L.; Peng, T.; Nie, Q. scEpath: Energy Landscape-Based Inference of Transition Probabilities and Cellular Trajectories from Single-Cell Transcriptomic Data. Bioinforma. Oxf. Engl. 2018, 34, 2077–2086. [Google Scholar] [CrossRef]
- Yuan, G.-C.; Cai, L.; Elowitz, M.; Enver, T.; Fan, G.; Guo, G.; Irizarry, R.; Kharchenko, P.; Kim, J.; Orkin, S.; et al. Challenges and Emerging Directions in Single-Cell Analysis. Genome Biol. 2017, 18, 84. [Google Scholar] [CrossRef]
- Jin, S.; Guerrero-Juarez, C.F.; Zhang, L.; Chang, I.; Ramos, R.; Kuan, C.-H.; Myung, P.; Plikus, M.V.; Nie, Q. Inference and Analysis of Cell-Cell Communication Using CellChat. Nat. Commun. 2021, 12, 1088. [Google Scholar] [CrossRef]
- Kumar, M.P.; Du, J.; Lagoudas, G.; Jiao, Y.; Sawyer, A.; Drummond, D.C.; Lauffenburger, D.A.; Raue, A. Analysis of Single-Cell RNA-Seq Identifies Cell-Cell Communication Associated with Tumor Characteristics. Cell Rep. 2018, 25, 1458–1468.e4. [Google Scholar] [CrossRef] [PubMed]
- Cabello-Aguilar, S.; Alame, M.; Kon-Sun-Tack, F.; Fau, C.; Lacroix, M.; Colinge, J. SingleCellSignalR: Inference of Intercellular Networks from Single-Cell Transcriptomics. Nucleic Acids Res. 2020, 48, e55. [Google Scholar] [CrossRef]
- Raredon, M.S.B.; Adams, T.S.; Suhail, Y.; Schupp, J.C.; Poli, S.; Neumark, N.; Leiby, K.L.; Greaney, A.M.; Yuan, Y.; Horien, C.; et al. Single-Cell Connectomic Analysis of Adult Mammalian Lungs. Sci. Adv. 2019, 5, eaaw3851. [Google Scholar] [CrossRef] [PubMed]
- Wang, S.; Karikomi, M.; MacLean, A.L.; Nie, Q. Cell Lineage and Communication Network Inference via Optimization for Single-Cell Transcriptomics. Nucleic Acids Res. 2019, 47, e66. [Google Scholar] [CrossRef] [PubMed]
- Browaeys, R.; Saelens, W.; Saeys, Y. NicheNet: Modeling Intercellular Communication by Linking Ligands to Target Genes. Nat. Methods 2020, 17, 159–162. [Google Scholar] [CrossRef]
- Ren, X.; Zhong, G.; Zhang, Q.; Zhang, L.; Sun, Y.; Zhang, Z. Reconstruction of Cell Spatial Organization from Single-Cell RNA Sequencing Data Based on Ligand-Receptor Mediated Self-Assembly. Cell Res. 2020, 30, 763–778. [Google Scholar] [CrossRef]
- Burgess, D.J. Spatial Transcriptomics Coming of Age. Nat. Rev. Genet. 2019, 20, 317. [Google Scholar] [CrossRef]
- Cang, Z.; Nie, Q. Inferring Spatial and Signaling Relationships between Cells from Single Cell Transcriptomic Data. Nat. Commun. 2020, 11, 2084. [Google Scholar] [CrossRef]
- Castellan, M.; Guarnieri, A.; Fujimura, A.; Zanconato, F.; Battilana, G.; Panciera, T.; Sladitschek, H.L.; Contessotto, P.; Citron, A.; Grilli, A.; et al. Single-Cell Analyses Reveal YAP/TAZ as Regulators of Stemness and Cell Plasticity in Glioblastoma. Nat. Cancer 2021, 2, 174–188. [Google Scholar] [CrossRef]
- Liberzon, A.; Subramanian, A.; Pinchback, R.; Thorvaldsdóttir, H.; Tamayo, P.; Mesirov, J.P. Molecular Signatures Database (MSigDB) 3.0. Bioinforma. Oxf. Engl. 2011, 27, 1739–1740. [Google Scholar] [CrossRef]
- Subramanian, A.; Tamayo, P.; Mootha, V.K.; Mukherjee, S.; Ebert, B.L.; Gillette, M.A.; Paulovich, A.; Pomeroy, S.L.; Golub, T.R.; Lander, E.S.; et al. Gene Set Enrichment Analysis: A Knowledge-Based Approach for Interpreting Genome-Wide Expression Profiles. Proc. Natl. Acad. Sci. USA 2005, 102, 15545–15550. [Google Scholar] [CrossRef] [PubMed]
- Ravi, V.M.; Will, P.; Kueckelhaus, J.; Sun, N.; Joseph, K.; Salié, H.; Vollmer, L.; Kuliesiute, U.; von Ehr, J.; Benotmane, J.K.; et al. Spatially Resolved Multi-Omics Deciphers Bidirectional Tumor-Host Interdependence in Glioblastoma. Cancer Cell 2022, 40, 639–655.e13. [Google Scholar] [CrossRef] [PubMed]
- Yang, K.-D.; Wang, Y.; Zhang, F.; Li, Q.-L.; Luo, B.-H.; Feng, D.-Y.; Zeng, Z.-J. CAF-Derived Midkine Promotes EMT and Cisplatin Resistance by Upregulating lncRNA ST7-AS1 in Gastric Cancer. Mol. Cell. Biochem. 2022, 477, 2493–2505. [Google Scholar] [CrossRef] [PubMed]
- Liu, R.; Lu, Y.; Li, J.; Yao, W.; Wu, J.; Chen, X.; Huang, L.; Nan, D.; Zhang, Y.; Chen, W.; et al. Annexin A2 Combined with TTK Accelerates Esophageal Cancer Progression via the Akt/mTOR Signaling Pathway. Cell Death Dis. 2024, 15, 291. [Google Scholar] [CrossRef]
- Liu, X.; Wang, Z.; Lv, X.; Tao, Z.; Lin, L.; Zhao, S.; Zhang, K.; Li, Y. JDF Promotes the Apoptosis of M2 Macrophages and Reduces Epithelial-Mesenchymal Transition and Migration of Liver Cancer Cells by Inhibiting CSF-1/PI3K/AKT Signaling Pathway. Heliyon 2024, 10, e34968. [Google Scholar] [CrossRef]
- Ding, J.; Yang, C.; Zhang, Y.; Wang, J.; Zhang, S.; Guo, D.; Yin, T.; Yang, J. M2 Macrophage-Derived G-CSF Promotes Trophoblasts EMT, Invasion and Migration via Activating PI3K/Akt/Erk1/2 Pathway to Mediate Normal Pregnancy. J. Cell. Mol. Med. 2021, 25, 2136–2147. [Google Scholar] [CrossRef]
- Lv, S.; Ji, L.; Chen, B.; Liu, S.; Lei, C.; Liu, X.; Qi, X.; Wang, Y.; Lai-Han Leung, E.; Wang, H.; et al. Histone Methyltransferase KMT2D Sustains Prostate Carcinogenesis and Metastasis via Epigenetically Activating LIFR and KLF4. Oncogene 2018, 37, 1354–1368. [Google Scholar] [CrossRef]
- Iser, I.C.; Pereira, M.B.; Lenz, G.; Wink, M.R. The Epithelial-to-Mesenchymal Transition-Like Process in Glioblastoma: An Updated Systematic Review and In Silico Investigation. Med. Res. Rev. 2017, 37, 271–313. [Google Scholar] [CrossRef]
- Gradient of Developmental and Injury Response Transcriptional States Defines Functional Vulnerabilities Underpinning Glioblastoma Heterogeneity—PubMed. Available online: https://pubmed.ncbi.nlm.nih.gov/35122077/ (accessed on 17 March 2025).
- Parada, L.F.; Dirks, P.B.; Wechsler-Reya, R.J. Brain Tumor Stem Cells Remain in Play. J. Clin. Oncol. Off. J. Am. Soc. Clin. Oncol. 2017, 35, 2428–2431. [Google Scholar] [CrossRef]
- Wang, Q.; Hu, B.; Hu, X.; Kim, H.; Squatrito, M.; Scarpace, L.; deCarvalho, A.C.; Lyu, S.; Li, P.; Li, Y.; et al. Tumor Evolution of Glioma-Intrinsic Gene Expression Subtypes Associates with Immunological Changes in the Microenvironment. Cancer Cell 2018, 33, 152. [Google Scholar] [CrossRef]
- Verhaak, R.G.W.; Hoadley, K.A.; Purdom, E.; Wang, V.; Qi, Y.; Wilkerson, M.D.; Miller, C.R.; Ding, L.; Golub, T.; Mesirov, J.P.; et al. Integrated Genomic Analysis Identifies Clinically Relevant Subtypes of Glioblastoma Characterized by Abnormalities in PDGFRA, IDH1, EGFR, and NF1. Cancer Cell 2010, 17, 98–110. [Google Scholar] [CrossRef] [PubMed]
- Maas, R.R.; Soukup, K.; Fournier, N.; Massara, M.; Galland, S.; Kornete, M.; Wischnewski, V.; Lourenco, J.; Croci, D.; Álvarez-Prado, Á.F.; et al. The Local Microenvironment Drives Activation of Neutrophils in Human Brain Tumors. Cell 2023, 186, 4546–4566.e27. [Google Scholar] [CrossRef] [PubMed]
- Pombero, A.; Garcia-Lopez, R.; Martínez, S. Pericyte-Glioblastoma Cell Interaction: A Key Target to Prevent Glioblastoma Progression. Cells 2023, 12, 1324. [Google Scholar] [CrossRef] [PubMed]
- Oliver, L.; Landais, Y.; Gratas, C.; Cartron, P.-F.; Paris, F.; Heymann, D.; Vallette, F.M.; Serandour, A. Transcriptional Landscape of the Interaction of Human Mesenchymal Stem Cells with Glioblastoma in Bioprinted Co-Cultures. Stem Cell Res. Ther. 2024, 15, 424. [Google Scholar] [CrossRef]
- Zhang, Y.; Zhang, B.; Lv, C.; Zhang, N.; Xing, K.; Wang, Z.; Lv, R.; Yu, M.; Xu, C.; Wang, Y. Single-Cell RNA Sequencing Identifies Critical Transcription Factors of Tumor Cell Invasion Induced by Hypoxia Microenvironment in Glioblastoma. Theranostics 2023, 13, 3744–3760. [Google Scholar] [CrossRef]
- Ma, C.; Chen, J.; Ji, J.; Zheng, Y.; Liu, Y.; Wang, J.; Chen, T.; Chen, H.; Chen, Z.; Zhou, Q.; et al. Therapeutic Modulation of APP-CD74 Axis Can Activate Phagocytosis of TAMs in GBM. Biochim. Biophys. Acta Mol. Basis Dis. 2024, 1870, 167449. [Google Scholar] [CrossRef]
- Cao, L.; Lu, X.; Wang, X.; Wu, H.; Miao, X. From Single-Cell to Spatial Transcriptomics: Decoding the Glioma Stem Cell Niche and Its Clinical Implications. Front. Immunol. 2024, 15, 1475235. [Google Scholar] [CrossRef]
- Li, X.; Chen, S.; Ding, M.; Ding, H.; Yang, K. Mapping Glioma Progression: Single-Cell RNA Sequencing Illuminates Cell-Cell Interactions and Immune Response Variability. Discov. Oncol. 2025, 16, 302. [Google Scholar] [CrossRef]
- Lee, J.M.; Dedhar, S.; Kalluri, R.; Thompson, E.W. The Epithelial-Mesenchymal Transition: New Insights in Signaling, Development, and Disease. J. Cell Biol. 2006, 172, 973–981. [Google Scholar] [CrossRef]
- Kalluri, R.; Weinberg, R.A. The Basics of Epithelial-Mesenchymal Transition. J. Clin. Investig. 2009, 119, 1420–1428. [Google Scholar] [CrossRef]
- Noh, M.-G.; Oh, S.-J.; Ahn, E.-J.; Kim, Y.-J.; Jung, T.-Y.; Jung, S.; Kim, K.-K.; Lee, J.-H.; Lee, K.-H.; Moon, K.-S. Prognostic Significance of E-Cadherin and N-Cadherin Expression in Gliomas. BMC Cancer 2017, 17, 583. [Google Scholar] [CrossRef] [PubMed]
- Leung, D.H.L.; Phon, B.W.S.; Sivalingam, M.; Radhakrishnan, A.K.; Kamarudin, M.N.A. Regulation of EMT Markers, Extracellular Matrix, and Associated Signalling Pathways by Long Non-Coding RNAs in Glioblastoma Mesenchymal Transition: A Scoping Review. Biology 2023, 12, 818. [Google Scholar] [CrossRef] [PubMed]
- Zheng, S.; Chheda, M.G.; Verhaak, R.G.W. Studying a Complex Tumor: Potential and Pitfalls. Cancer J. Sudbury Mass 2012, 18, 107–114. [Google Scholar] [CrossRef] [PubMed]
- Huse, J.T.; Phillips, H.S.; Brennan, C.W. Molecular Subclassification of Diffuse Gliomas: Seeing Order in the Chaos. Glia 2011, 59, 1190–1199. [Google Scholar] [CrossRef]
- Phillips, H.S.; Kharbanda, S.; Chen, R.; Forrest, W.F.; Soriano, R.H.; Wu, T.D.; Misra, A.; Nigro, J.M.; Colman, H.; Soroceanu, L.; et al. Molecular Subclasses of High-Grade Glioma Predict Prognosis, Delineate a Pattern of Disease Progression, and Resemble Stages in Neurogenesis. Cancer Cell 2006, 9, 157–173. [Google Scholar] [CrossRef]
- Kreutzberg, G.W. Microglia: A Sensor for Pathological Events in the CNS. Trends Neurosci. 1996, 19, 312–318. [Google Scholar] [CrossRef]
- Bhat, K.P.L.; Balasubramaniyan, V.; Vaillant, B.; Ezhilarasan, R.; Hummelink, K.; Hollingsworth, F.; Wani, K.; Heathcock, L.; James, J.D.; Goodman, L.D.; et al. Mesenchymal Differentiation Mediated by NF-κB Promotes Radiation Resistance in Glioblastoma. Cancer Cell 2013, 24, 331–346. [Google Scholar] [CrossRef]
- He, X.; Guo, Y.; Yu, C.; Zhang, H.; Wang, S. Epithelial-Mesenchymal Transition Is the Main Way in Which Glioma-Associated Microglia/Macrophages Promote Glioma Progression. Front. Immunol. 2023, 14, 1097880. [Google Scholar] [CrossRef]

Disclaimer/Publisher’s Note: The statements, opinions and data contained in all publications are solely those of the individual author(s) and contributor(s) and not of MDPI and/or the editor(s). MDPI and/or the editor(s) disclaim responsibility for any injury to people or property resulting from any ideas, methods, instructions or products referred to in the content. |
© 2025 by the authors. Licensee MDPI, Basel, Switzerland. This article is an open access article distributed under the terms and conditions of the Creative Commons Attribution (CC BY) license (https://creativecommons.org/licenses/by/4.0/).