Article

Modelling Population Genetic Screening in Rare Neurodegenerative Diseases

1
Department of Basic and Clinical Neuroscience, Maurice Wohl Clinical Neuroscience Institute, King’s College London, London WC2R 2LS, UK
2
Department of Biostatistics and Health Informatics, King’s College London, London WC2R 2LS, UK
3
NIHR Maudsley Biomedical Research Centre (BRC) at South London and Maudsley NHS Foundation Trust, King’s College London, London WC2R 2LS, UK
4
Genetics and Genomic Medicine, Great Ormond Street Institute of Child Health, University College London, London WC1E 6BT, UK
5
Biomedical Research Centre, NIHR Great Ormond Street Hospital, University College London, London WC1E 6BT, UK
6
Department of Clinical Genetics, Great Ormond Street Hospital, London WC1N 3JH, UK
7
Department of Clinical Genetics, Guy’s and St Thomas NHS Foundation Trust, London SE1 7EH, UK
8
Department of Medical Statistics, London School of Hygiene and Tropical Medicine, London WC1E 7HT, UK
9
King’s College Hospital, Bessemer Road, London SE5 9RS, UK
*
Authors to whom correspondence should be addressed.
These authors contributed equally to this work.
Biomedicines 2025, 13(5), 1018; https://doi.org/10.3390/biomedicines13051018
Submission received: 25 February 2025 / Revised: 16 April 2025 / Accepted: 17 April 2025 / Published: 23 April 2025

Abstract

:
Importance: Genomic sequencing enables the rapid identification of a breadth of genetic variants. For clinical purposes, sequencing for small genetic variations is considered a solved problem, while challenges remain for structural variants, given the lower sensitivity and specificity. Interest has recently risen among governing bodies in developing protocols for population-wide genetic screening. However, usefulness is constrained when the probability of being affected by a rare disease remains low, despite a positive genetic test. This is a common scenario in neurodegenerative disorders. The problem is recognised among statisticians and statistical geneticists but is less well-understood by clinicians and researchers who will act on these results, and by the general public who might access screening services directly without the appropriate support for interpretation. Observations: We explore the probability of subsequent disease following genetic screening of several variants, both single nucleotide variants (SNVs) and larger repeat expansions, for two neurological conditions, Huntington’s disease (HD) and amyotrophic lateral sclerosis (ALS), comparing these results with screening for phenylketonuria, which is well-established. The risk following a positive screening test was 0.5% for C9orf72 in ALS and 0.4% for HTT in HD when testing repeat expansions, for which the test had sub-optimal performance (sensitivity = 99% and specificity = 90%), and 12.7% for phenylketonuria and 10.9% for ALS SOD1 when testing pathogenic SNVs (sensitivity = 99.96% and specificity = 99.95%). Subsequent screening confirmation via PCR for C9orf72 led to a 2% risk of developing ALS as a result of the reduced penetrance (44%). Conclusions and Relevance: We show that risk following a positive screening test result can be strikingly low for rare neurological diseases, even for fully penetrant variants such as HTT, if the test has sub-optimal performance. Accordingly, to maximise the utility of screening, it is vital to prioritise protocols with very high sensitivity and specificity, and a careful selection of markers for screening, giving regard to clinical interpretability, actionability, high penetrance, and secondary testing to confirm positive findings.

1. Introduction

Single nucleotide variants (SNVs) and small insertions and deletions (indels) are now genotyped in next-generation sequencing data with over 99% accuracy [1,2,3], while genotyping larger, structural variants is often less reliable [4]. For clinical purposes, the validity of sequencing for small genetic variations is considered a solved problem, while challenges remain for structural variants.
The widened availability of sequencing data has favoured our understanding of the role of genetic factors in various phenotypes [5,6,7,8]. Genetic testing has, therefore, become valuable for healthcare and has gained popularity among consumers who can access it directly, without advice from trained clinicians to guide the interpretation of results [9,10,11].
Interest has recently risen among governing bodies in developing protocols for population-wide genetic screening; such initiatives are being rolled out in the UK and are being considered in the US [12,13,14,15,16,17,18]. Genetic screening involves testing a population for genetic variants indicative of risk for specific diseases to identify people with either a higher predisposition of developing that disease or the potential to pass it on to their offspring. This approach utilises modern sequencing techniques to evaluate multiple genes associated with selected traits. In contrast, ‘targeted’ tests are those performed because of some suggestion that a person may harbour disease variants (e.g., symptoms or family history of disease). Although screening is relevant to liabilities ranging between monogenic and polygenic (cf. [16,19]), we focus here on screening for pathogenic variants with monogenic associations with rare diseases, particularly as applied to neurodegenerative disorders.
Although no widespread implementation of genetic screening protocols currently exist internationally, comparable metabolic screening testing neonates for metabolite markers of metabolic diseases is routine in many countries [17,20]. Positive metabolic tests are typically validated with secondary testing, including targeted genetic tests [9,21,22].
The utility of genetic screening can be assessed by the extent to which action can be taken following a positive test: its actionability [23,24]. One key tenet of actionability is the probability of having or later developing a disease following a positive test. Yet post-test disease probability can be strikingly low where disease risk prior to testing is low, as would be for population screening for rare diseases [25].
Bayesian inference, which is routine within clinical decision making [26], can be used to understand post-test ‘posterior’disease risk. Under this logic, disease probability following a test can be inferred given existing knowledge of the probability of other relevant events. Key considerations to understanding post-test disease risk, beyond pre-test (also known as ‘prior’) disease risk, include the genetic marker penetrance, its frequency among people displaying disease symptoms, and the sensitivity and specificity of the test (analytic validity). This reasoning is therefore highly relevant to screening for rare neurodegenerative diseases, for which genetic causes are typically rare variants of variable penetrance [27].
This article provides an overview of important considerations for genetic screening of rare disorders and it presents several case studies focused on neurodegenerative diseases. Considering conditional probability in medical decision making is not novel but these concepts must be emphasised in the genomic medicine era, since many results that could be obtained within large-scale indiscriminate testing of genetic variation across a population will not be actionable and may be misinterpreted. We modelled genetic screening for Huntington’s disease [28], HD, and amyotrophic lateral sclerosis [29], ALS, using Bayesian logic to examine the probability of disease following a positive test result for dichotomous ALS and HD genetic markers. We additionally modelled screening for phenylketonuria (PKU) [30] to compare genetic and metabolic screening.

2. Methods

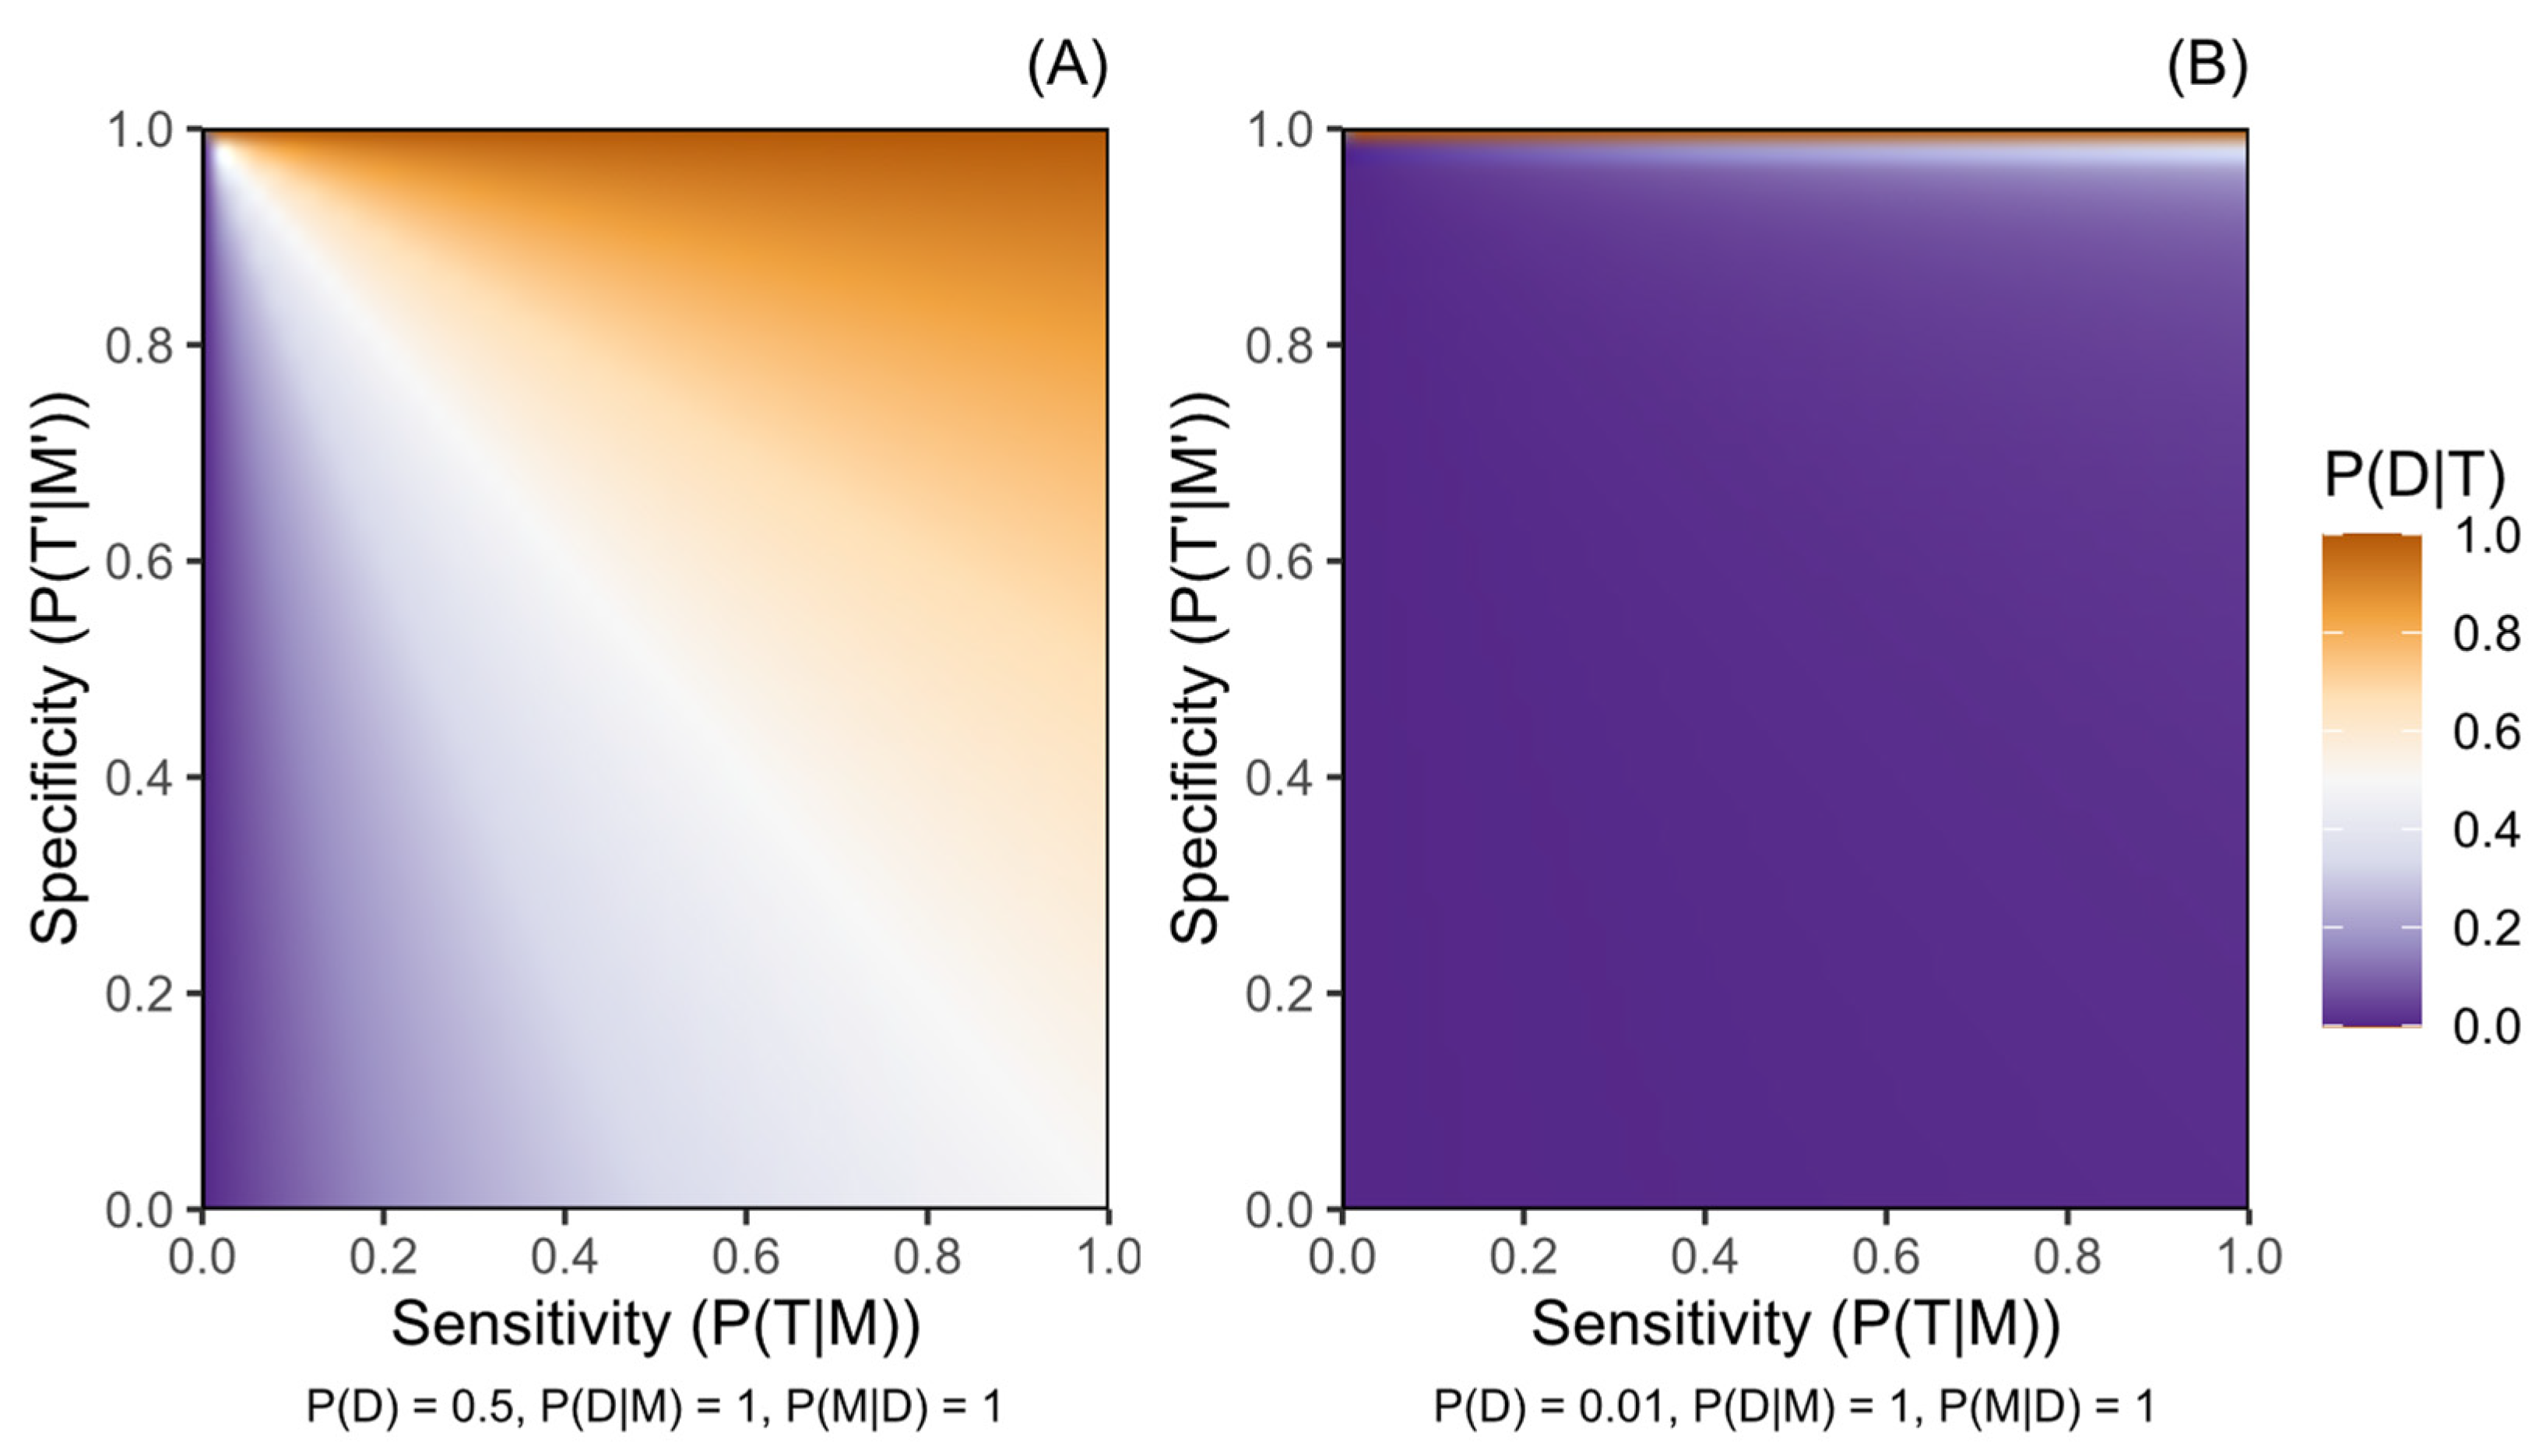
Definition of Probability in the Bayesian Framework

We used Bayesian logic to calculate the probability of having or subsequently manifesting disease D following a test result, indicating the presence or absence of marker M (the genetic variant). M is associated with increased liability of D, and positive test result T indicates the presence of M, while a negative test result T′ indicates its absence, denoted M′. Disease risk following a positive result is denoted by P(D|T), and P(D|T′) is used for a negative result.
Supplementary Materials S1 summarises the underlying logic. We assume that all model parameters represent binary events. This was a necessary simplification of reality as, for example, disease severity is not considered.
We estimated P(D|T) and P(D|T′) using the following input parameters:
  • P(D), probability of a person having or later manifesting disease D prior to testing;
  • P(M|D), frequency of marker M among those affected by D;
  • P(D|M), penetrance, probability of having or later manifesting D for people harbouring M;
  • P(T|M), sensitivity (true positive rate) of the testing procedure for detecting M;
  • P(T′|M′), specificity (true negative rate) of the testing procedure for identifying the absence of M.
Bayes’ theorem was applied to derive the total probability of harbouring disease marker M.
P M = P ( D ) × P M D P D M
and of disease D manifesting given the absence of M,
P D M = P D × 1 P M D 1 P M  
We next calculated the total probability of positive test result T, P(T), according to the sensitivity and specificity of the test and the probabilities of M being present versus absent:
P T = P T M × P M + 1 P T M × 1 P M
Bayes’ theorem was then used to derive the probabilities of M being present after a positive result:
P M T = P M × P ( T | M ) P ( T )
and for a negative result:
P M T = P M × 1 P T M ( 1 P T )
The probabilities of manifesting disease D (which has conditional independence from T when considering M) after receiving a positive test result T were calculated as follows:
P D T = P D M × P M T + P D M × 1 P M T
and for a negative test result T′, they were calculated with the following equation:
P D | T = P D M × P M T + P D M × 1 P M T

3. Case Studies

The Project MinE [31], ALS variant server [32], ClinVar [33], and gnomAD databases were searched alongside the previous databases and next-generation sequencing tool benchmarking reports to obtain data for the included case studies. Most input parameters were defined using data from the published literature and online databases. Sensitivity (P(T|M)) and specificity (P(T|M)) were defined by performance benchmarks for variant calling with state-of-the-art genomic sequencing techniques specialised for genotyping particular variant types (see Supplementary Materials S2; Table S1). For short tandem repeat expansion (STRE), we opted to base our modelling on the performance of short-read sequencing data because, although long-read sequencing could potentially offer higher performance in genotyping STREs, its higher cost and lower performance in genotyping SNVs make it a less practical choice for screening rare diseases compared to short-read sequencing [34,35]. Although analytical accuracy will vary across the genome and other sources of error exist, these heuristics were sufficient for our purposes.
Table 1 presents the parameter estimates and post-test disease risks calculated across various scenarios. A comprehensive description of parameter ascertainment, including penetrance estimation, is given in Supplementary Materials S3; Table S2 summarises the assumptions and corresponding reality.

3.1. Case 1—Huntington’s Disease

HD is a late-onset Mendelian disease with autosomal dominant inheritance caused by a trinucleotide, CAG, STRE in the HTT gene (OMIM: 613004). We let M be a CAG expansion of >40 repeat units, which would have complete penetrance in a normal lifespan [28].
We modelled two scenarios for this example: (1) as in genetic screening, defining pre-test disease probability by using the baseline risk of HD in a general population and (2) as a targeted test, considering pre-test disease probability for an individual whose parent harbours the fully penetrant HTT STRE and who has a 0.5 probability of inheriting M (we did not model genetic anticipation [36]).

3.2. Case 2—Amyotrophic Lateral Sclerosis

ALS is a late-onset disease with locus and allelic heterogeneity; the genetic associations with risk and phenotype modification range between monogenic and polygenic. Variants in at least 40 genes are associated with ALS [29,37,38,39]. SOD1 (OMIM: 147450) and C9orf72 (OMIM: 614260) are the most frequently implicated genes, where variants of each account for fewer than 10% of cases. Autosomal dominant inheritance is typical for most people with a known genetic disease cause.
We modelled several definitions of markers for ALS risk, drawing from three of the commonest ALS genes: SOD1, C9orf72, and FUS (OMIM: 137070). SOD1- and FUS-linked ALS is typically attributed to SNVs and many pathogenic variants, with varying strength of supporting evidence reported in these genes [40]. The pathogenic form of C9orf72 is a hexanucleotide, GGGGCC, STRE associated principally with the onset of either one or both ALS and frontotemporal dementia [41]. Known variants in these genes have typically incomplete penetrance; examples include ~90–100% penetrance for SOD1 p.A5V and ~45% for the C9orf72 STRE [42,43].
The definitions of M modelled in this case study were as follows:
  • SOD1 (all)—M includes any rare variant reported in people with ALS of European ancestry contained within the meta-analysis sample set from which the variant frequencies were derived (see Supplementary Materials S3.2) [38];
  • SOD1 (A5V)—M represents the pathogenic SOD1 p.A5V variant, one of the most common SOD1 variants among North American ALS populations, characterised by high penetrance [42,44];
  • FUS (all)—M includes any rare variant reported in people with ALS of European ancestry contained within the meta-analysis sample set from which the variant frequencies were derived (see Supplementary Materials S3.2) [38];
  • FUS (ClinVar)—M includes any of 21 FUS variants reported as pathogenic or likely pathogenic for ALS within ClinVar and present within databases of familial and sporadic ALS (see Tables S3, S5 and S6) [31,32,33];
  • C9orf72M represents a pathogenic C9orf72 STRE of 30≤ repeat GGGGCC units within the first intron of the C9orf72 gene.
In the SOD1 (all) and FUS (all) scenarios, M encompasses variants classed as pathogenic, likely pathogenic, and variants of uncertain significance [45]. It is appropriate to model these scenarios since many variants of uncertain significance in ALS-implicated genes have a high probability of being deleterious and should not necessarily be ignored [39].
For the C9orf72 marker, we modelled two scenarios: (1) genetic screening with sensitivity and specificity defined by the performance of existing tools for genotyping STREs in sequencing data and (2) using repeat-primed polymerase chain reaction with amplicon-length analysis [46] as a secondary test to validate a positive result from screening via sequencing in scenario 1.
Table 1. Input parameters and disease risk estimates following testing for all case study scenarios. Parameter ascertainment is comprehensively described within Supplementary Materials S3. HD = Huntington’s disease; ALS = amyotrophic lateral sclerosis; PKU = phenylketonuria. SNV = single nucleotide variant; STRE = short tandem repeat expansion. § Estimates are based on populations of predominantly European ancestry—95% confidence intervals shown for newly derived estimates in the ALS case study; * includes FUS variants classified as pathogenic or likely pathogenic for ALS in the ClinVar database and recorded within ALS population databases (see Tables S3 and S4); defined by variant-calling performance benchmarks of tools for genotyping in sequencing data by variant type (see Table S1) and, where marked , by aggregate laboratory accuracy for genotyping C9orf72 STRE with repeat-primed polymerase chain reaction and amplicon-length analysis [46]. Ω Risk following positive results in primary screening and confirmatory tests relative to a negative screening result (probability of PKU given a negative metabolic screening result is approximated as 1 × 10⁻⁶). Probabilities are defined in the methods.
Case StudyGene Containing Marker (Case Study Scenario)Variant TypePre-Test Disease Probability §Marker Frequency in People Affected §Penetrance §Test Sensitivity Test Specificity Disease Risk After Positive TestDisease Risk After Negative Test Relative Disease Risk After Positive Rather than Negative Test
---P(D)P(M|D)P(D|M)P(T|M)P(T’|M’)P(D|T)P(D|T′)-
1:
HD
HTT (screening)STRE0.0004101.0001.0000.9900.9000.004040.00000456887
HTT (targeted)STRE0.5001.0001.0000.9900.9000.9080.01182.7
2: ALSSOD1 (all)SNV0.003330.0188 (0.0138, 0.0238)0.701 (0.491, 0.926)0.99960.99950.1090.0032733.3
SOD1 (A5V)SNV0.003330.000529
(4.43 × 10⁻⁵, 0.00101)
0.910.99960.99950.006830.003332.05
FUS (all)SNV0.003330.00425 (0.0023, 0.0062)0.579 (0.291, 0.884)0.99960.99950.03020.003329.09
FUS (ClinVar *)SNV0.003330.00251 (0.00125, 0.00377)0.536
(0.211, 0.877)
0.99960.99950.01940.003335.84
C9orf72STRE0.003330.0635 (0.0538, 0.0732)0.439 (0.358, 0.520)0.9900.9000.005190.003131.66
C9orf72 (positive sequencing screening confirmation)STRE0.00520.0635 (0.0538, 0.0732)0.439 (0.358, 0.520)0.95 0.98 0.01980.004894.06 (6.35 Ω)
3: PKUPAH (screening)SNV0.0001000.7430.8920.99960.99950.1270.00002574.961
PAH (positive metabolic screening confirmation)SNV0.1670.7430.8920.99960.99950.8890.049717.9 (889,000 Ω)

3.3. Case 3—Phenylketonuria

PKU is an autosomal recessive disease with infantile onset, caused by variants in the PAH gene (OMIM: 612349) [30]; most pathogenic variants for PKU are SNVs. M represents being homozygous or compound heterozygous for any of the three most common PAH variants recorded in European populations of people with PKU: p.Arg408Trp, c.1066-11G>A, p.Arg261Gln [30].
We modelled two testing scenarios for PKU: (1) genetic screening, with pre-test disease probability defined per the baseline population risk of PKU, and (2) secondary testing to confirm positive results obtained using tandem mass spectrometry [47] as in established metabolic screening protocols (see Supplementary Materials S3.3).

4. Results and Discussion

4.1. Post-Test Disease Probability

4.1.1. Screening Versus Diagnostic Testing

Across the case studies, we showed a low probability of disease following positive results within contextually blind genetic screening scenarios; risk ranged between 12.7% and 0.4% (see Table 1). Disease risk was always negligible following a negative test result, indicating absence of the tested variant, as would be seen for any rare trait.
The HD case study illustrates the distinction between contextually blind screening and diagnostic testing for rare diseases: following a positive test result, lifetime HD risk was high (90.8%) using targeted testing but low (0.4%) with screening. This difference reflects the effect of the sub-optimal performance (sensitivity = 99% and specificity = 90%) of the test for repeat expansions generating a large number of false positives in population screening despite the complete penetrance of HTT. Indeed, unlike screening, targeted testing is performed based on some indication of a person’s elevated disease risk (e.g., existing disease symptoms or family history). Accordingly, pre-test disease probability is greater. Inherently low pre-test disease probability will be a pervasive issue in screening for rare diseases.

4.1.2. Relative Risk and Secondary Testing

The utility of a test for identifying at-risk individuals can be examined based on relative disease risk following positive rather than negative test results: utility is limited when risk is only minimally greater for people testing positive rather than negative. This is observed in the ALS C9orf72 case study, where risk was only 1.7 times greater (Table 1) following a positive screening from sequencing alone, despite this variant being the most common genetic cause of ALS [38].
We additionally observed 6.35 times greater ALS risk for a person testing positive on both screening for C9orf72 and a secondary test than for a person testing negative on the initial screening. This increased relative risk reflects that a person testing positive on two independent measures of disease risk has a greater absolute probability of disease than after the initial screening result alone.
We emphasise that secondary testing is important to increase certainty in positive tests. The PKU case study demonstrates its potentially sizable impact. A positive screening result using the established metabolic approach alone indicated 16.7% PKU risk, versus 12.7% with genetic screening. The metabolic marker, which is universal across people with PKU and indicates existing disease manifestation, eclipses the need for genetic screening for PKU, marked by variants with incomplete penetrance that are not present for all people with PKU. However, the genetic test remains useful for validating the positive metabolic screening result [17]: the probability of PKU following a confirmatory genetic test conducted on the basis of a positive metabolic screening result was 88.9%.
The overall benefit of secondary testing will, however, differ by scenario. For ALS, the risk remained moderate (~2%) despite two positive test results for C9orf72.

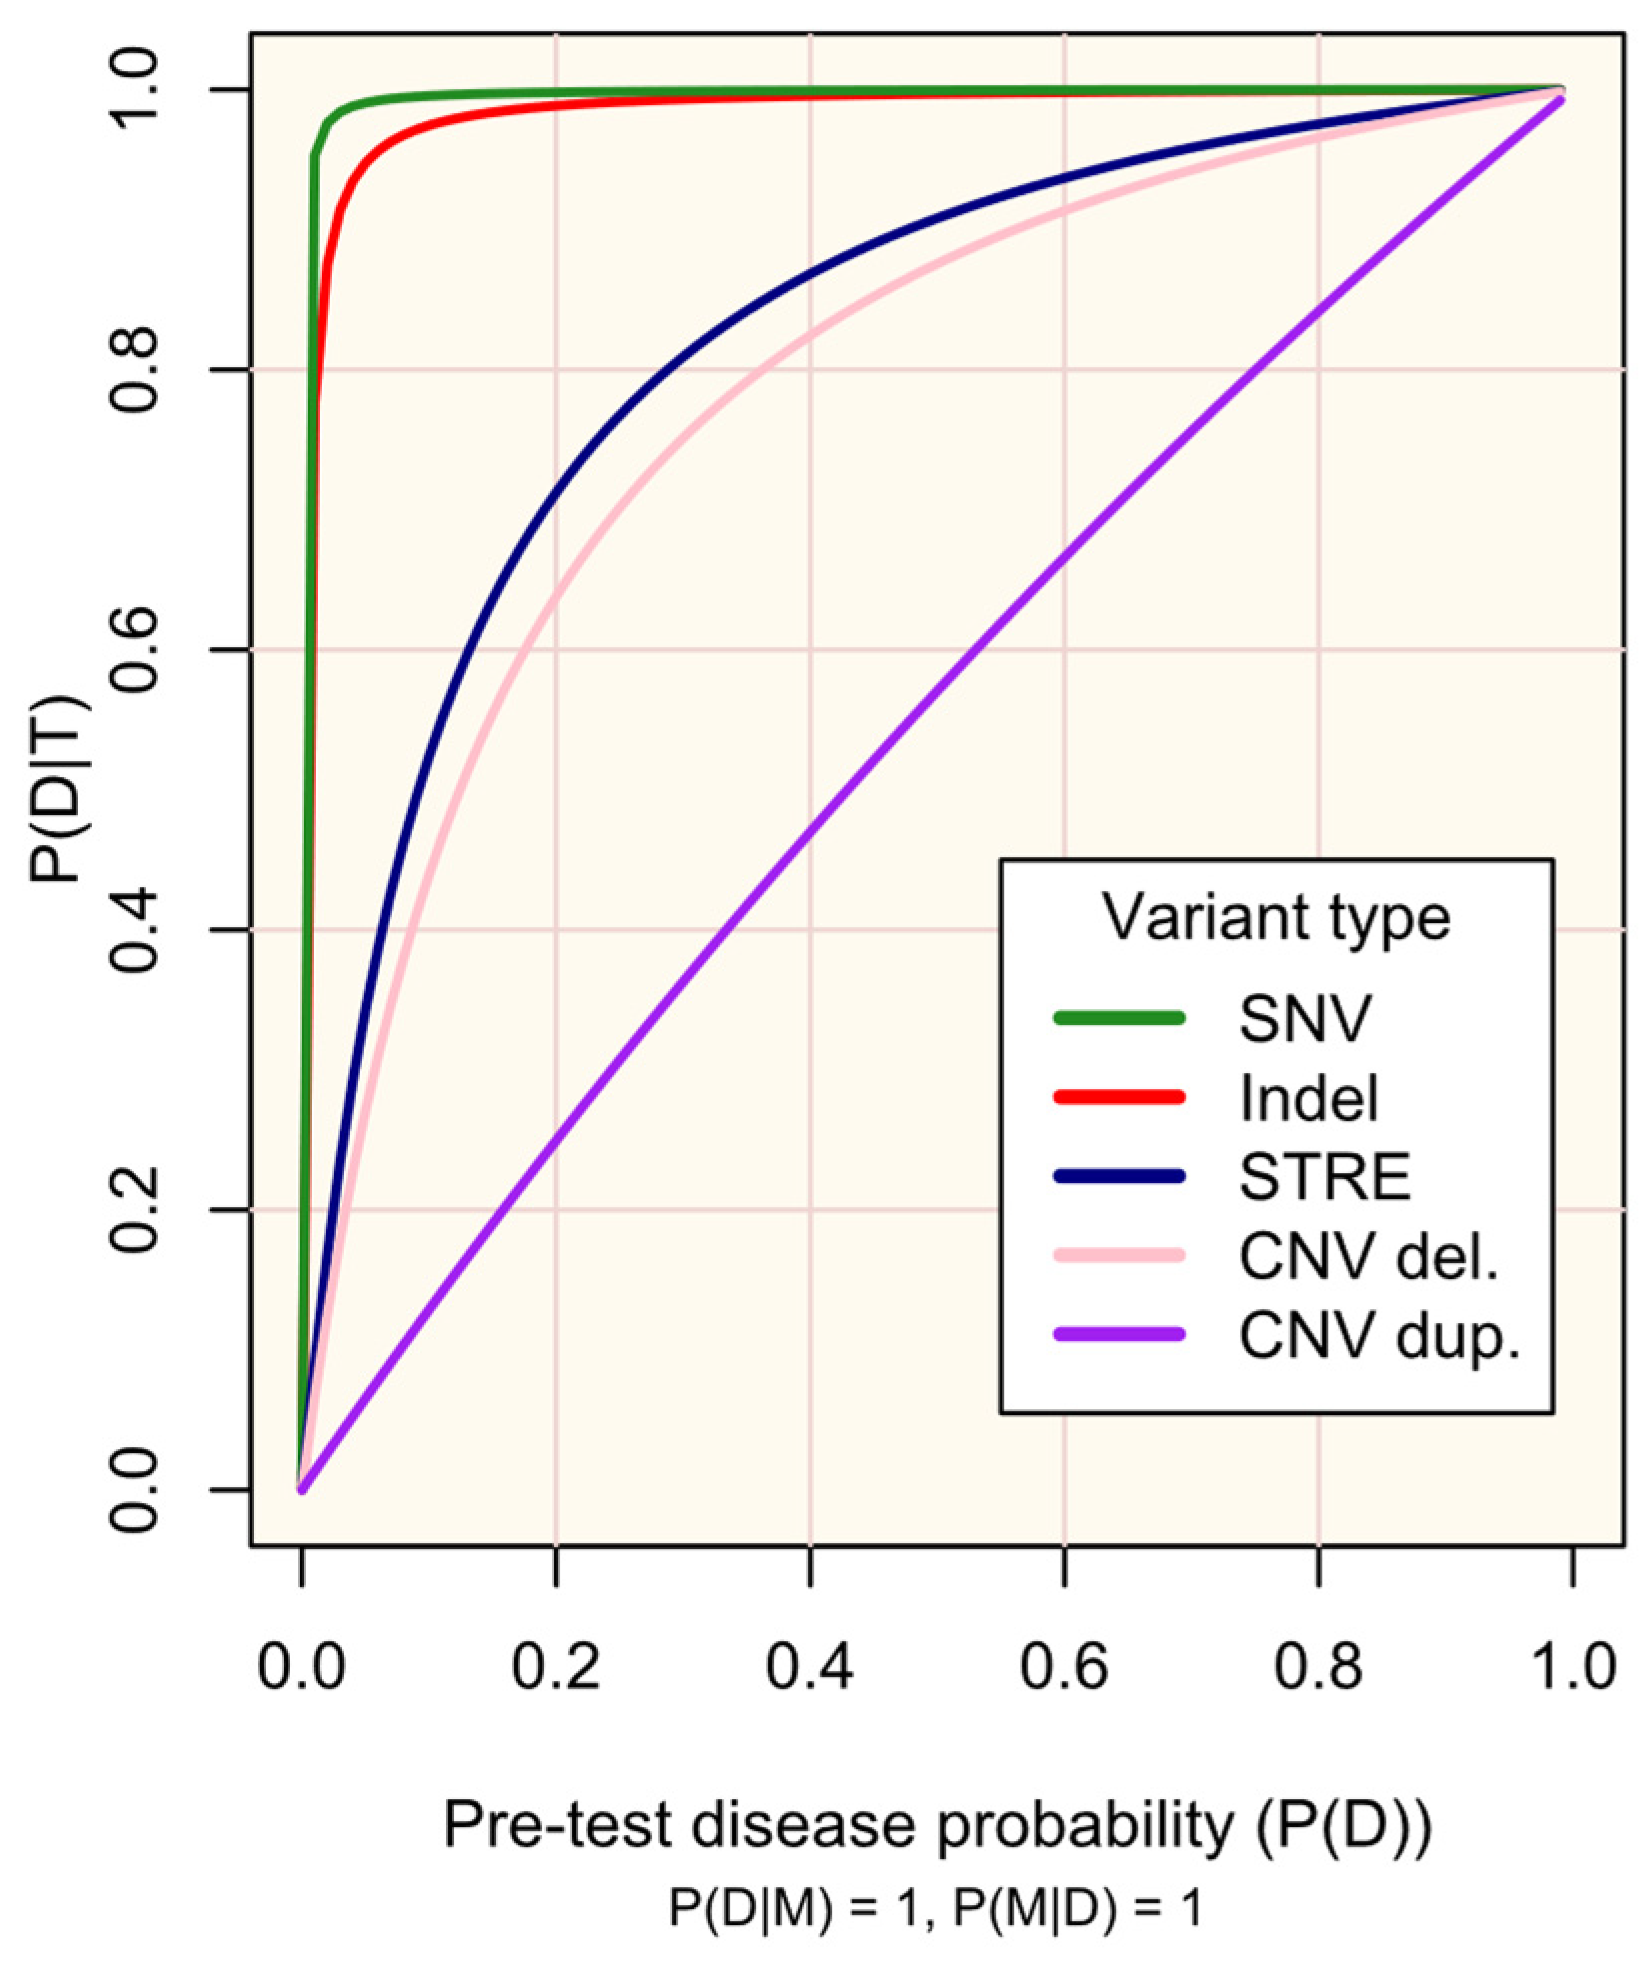
4.1.3. Constraints upon Post-Test Disease Probability

Figure 1, Figure 2 and Figure 3 illustrate how the post-test disease probability reduces as the probability of any test, disease, or marker characteristic decreases. Sensitivity and specificity critically constrain certainty about post-test disease risk, and this role is amplified as the other parameter probabilities decrease. Figure 1 particularly demonstrates the increased role of specificity in rarer diseases, where disease risk following a positive test result will be moderated only by penetrance in a protocol of perfect specificity.
M occurs in all people with D (P(M|D) = 1) and has complete penetrance (P(D|M) = 1)). The plot lines are defined according to the sensitivity (P(T|M)) and specificity (P(T′|M′)) of existing protocols for genotyping variant types (see Supplementary Materials S2): single nucleotide variant (SNV), test sensitivity P(T|M) = 0.9996, and test specificity P(T′|M′) = 0.9995; small insertion or deletion (Indel) and test sensitivity P(T|M) = 0.9962, test specificity P(T′|M′) = 0.9971; short tandem repeat expansion (STRE), test sensitivity P(T|M) = 0.99, and test specificity P(T′|M′) = 0.90; copy number variant (CNV)-del. (deletion), test sensitivity P(T|M) = 0.289, and test specificity P(T′|M′) = 0.959; and CNV-dup. (duplication), test sensitivity P(T|M) = 0.1020, and test specificity P(T′|M′) = 0.9233. The probabilities are defined in the methods.
Figure 2 illustrates the impact of the genetic test’s performance (sensitivity and specificity) in existing protocols for genotyping different variant types (SNVs, indels, STREs, and CNVs) on the probability of disease, given a positive test result. As is well-recognized, high sensitivity and specificity are crucial for maximizing the utility of testing, especially for rare diseases. The respective trade-offs between prioritising each of these must be regarded: high sensitivity is required to detect markers, while high specificity increases confidence in positive results. Established screening protocols prioritise high sensitivity to maximise detection of at-risk individuals, with confirmatory secondary testing being vital to minimise false-positive results [9,21,22].
Since the characteristics of diseases and associated variants are all pre-determined within a population, the disease markers (variants) screened should be chosen carefully. Figure 3 illustrates how the prevalence of a marker among affected individuals, its penetrance, and the performance of the test (sensitivity and specificity) influence the probability of developing the disease given a positive test result. The most useful variants are those that are more prevalent among affected individuals, have high penetrance, and can be genotyped with high sensitivity and specificity (see examples of real and hypothetical diseases and markers in Figure 3A–D).

4.2. Practical Implementation of Genetic Screening

4.2.1. Marker Selection

Before a marker is used in screening, its relevance across people must be evaluated, recognising that this may vary by ancestry. For instance, particular variants may be less common or only present in certain populations, and penetrance can also vary between them [37,44]. Screening protocols must therefore account for these differences to prevent systemic inequalities, especially for minorities, which are often under-studied and which therefore have limited genetic information available.
Regard must be given to the clinical interpretability of selected markers. We illustrated several approaches to defining markers in the ALS case study. Within the SOD1 (all) scenario, disease risk is marked by an aggregation of putatively pathogenic SOD1 variants. Without curation, the relationship to disease varies across them, e.g., SOD1 p.I114T has substantially lower penetrance than p.A5V, and many potentially relevant variants have uncertain significance [33,39,40,43]. Curation could involve defining a positive result as presence of variants with sufficient evidence of pathogenicity [45], as in the FUS (ClinVar) scenario, or as harbouring specific variants, as in the SOD1 (A5V) scenario.
De novo variants and variants of uncertain significance present a substantial challenge for screening since they will frequently be identified, yet must be set aside until variant interpretation is possible despite potentially being deleterious [12]. PKU demonstrates the scale of this issue for rare diseases with multiple implicated variants, as 55% of deleterious PAH genotypes are observed uniquely [30].

4.2.2. Utility over Time and Actionability

As genetic screening is possible from birth, while non-genetic methods may not be, the age of viability for screening methods should be evaluated. For late-onset diseases, early genetic screening may enable preventative treatments to at-risk individuals or close monitoring for prodromal disease markers. For instance, rapid eye movement sleep behaviour disorder is a prodromal feature for Parkinson’s disease [48], and the monitoring of at-risk individuals may enable early intervention. The influence of time upon treatment viability and effectiveness must also be considered. For example, genetic therapy has potential utility for preventing or delaying the onset of degenerative disorders [49].
The ultimate benefit of early identification of disease risk through genetic screening is contingent upon the actionability of the result. A framework of actionability [23,24], shown to align with laypersons’ views on treatment acceptability [50], states that actionability is determined by disease likelihood and severity, intervention effectiveness in disease minimisation or prevention, and the consequence of the intervention to a person and risk if not performed. Each of these elements are critical when selecting traits and markers for genetic screening and for the clinical interpretation of results.

4.3. Limitations

The Bayesian logic in the case studies simplifies genotype–phenotype relationships and cannot address all considerations relevant to clinical genetic testing. Phenotype variability is not considered. Other factors include polygenicity and oligogenicity, pleiotropy, the role of genetic and environmental modifying factors, and additive genetic effects in recessive conditions and heterozygous carriers of pathogenic variants. Such influences can fundamentally impact both the probability that a disease will manifest and its severity. For instance, although we used widely accepted thresholds to identify pathogenic repeat expansions in this study (≥30 repeats for C9orf72 and >40 repeats for HTT), it is important to note that the CAG repeat length in HTT shows a strong negative correlation with age at symptom onset [51]. Additionally, C9orf72 repeats could contribute to oligogenic forms of ALS, and intermediate lengths may have a smaller effect on disease risk [52,53]. Any results from genetic screening must be interpreted within the wider context of that disease and its modifiers.

5. Conclusions

We have shown that risk following a positive screening test result can be strikingly low for rare neurological diseases. Accordingly, to maximise the utility of screening, we suggest prioritising protocols of very high sensitivity and specificity, careful selection of markers for screening, giving regard to clinical interpretability and secondary testing to confirm positive findings.
A key advantage of a genetic screening approach for late-onset diseases is that these markers can be examined across the lifespan. Hence, positive test results could be useful for targeting people for prevention and for the monitoring of prodromal features.
Although considering disease risk within a Bayesian context is not novel, it is important to stress that the considerations raised here come at a time when governments are evaluating the implementation of genomic sequencing for population screening and as access to genetic testing outside healthcare settings increases. While genetic screening has many potential benefits, the limitations of such an approach should be properly understood. Policy makers must consider the impact of a positive test result on large numbers of people that will never develop a given disease, a particularly salient issue for late-onset diseases. Although not the present focus, the substantial ethical and social considerations raised in conjunction with screening must also be regarded [13].

Supplementary Materials

The following supporting information can be downloaded at https://www.mdpi.com/article/10.3390/biomedicines13051018/s1, Table S1: Performance benchmarks of next generation sequencing tools specialised for genotyping different types of variants, Table S2: Assumptions made about the case studies described in this paper, Table S3: Variants in the FUS gene recorded in ClinVar as “pathogenic” or “likely pathogenic” for amyotrophic lateral sclerosis, Table S4: Estimation of variant frequency among people of European ancestry with ALS, P(M|D), for the SOD1 (all), FUS (all), and C9orf72 scenario of the ALS case study, Table S5: Estimation of the frequency of ALS risk variants reported in the FUS gene on the ClinVar database (Table S3) among people with ALS represented in the ALS variant Server and Project MinE Data Browser, Table S6: Estimation of the aggregate penetrance for ALS of FUS variants identified in people with ALS from a European population (FUS (all)), and of FUS variants identified as pathogenic for ALS within the ClinVar database (FUS (ClinVar)) following the adpenetrance approach.

Author Contributions

T.P.S.: Conceptualisation, Methodology, Formal analysis, Investigation, Data Curation, Writing—Original Draft, Writing—Review and Editing, Visualisation. A.I.: Conceptualisation, Methodology, Writing—Original Draft, Writing—Review and Editing, Supervision, Project Administration, Funding Acquisition. M.R.: Conceptualisation, Writing—Review and Editing. F.F.: Conceptualisation, Writing—Review and Editing. N.P.: Conceptualisation, Writing—Review and Editing. A.A.-C.: Conceptualisation, Methodology, Writing—Review and Editing, Supervision. All authors have read and agreed to the published version of the manuscript.

Funding

AC is an NIHR Senior Investigator. This is an EU Joint Programme-Neurodegenerative Disease Research (JPND) project. The project is supported through the following funding organizations under the aegis of JPND (United Kingdom, Medical Research Council MR/L501529/1 and MR/R024804/1; Economic and Social Research Council ES/L008238/1) and through the Motor Neurone Disease Association. This study represents independent research part-funded by the NIHR Maudsley Biomedical Research Centre at South London and Maudsley NHS Foundation Trust and King’s College London. The work leading up to this publication was funded by the European Community’s Horizon 2020 Programme (H2020-PHC-2014-two-stage; grant 633413). This work was part-funded by my Name’5 Doddie Foundation and the Alan Davidson Foundation. The views expresented are those of the author(s) and not necessarily those of the NHS, the NIHR, King’s College London, or the Department of Health and Social Care. AI is funded by South London and Maudsley NHS Foundation Trust, MND Scotland, Motor Neurone Disease Association, National Institute for Health and Care Research, Spastic Paraplegia Foundation, Rosetrees Trust, Darby Rimmer MND Foundation, the Medical Research Council (UKRI), and Alzheimer’s Research UK.

Data Availability Statement

Data are contained within the article.

Acknowledgments

We wish to thank Naomi Wray of the Queensland Brain Institute for her contribution to the project conceptualisation and methodology. We also thank Leslie Biesecker of the National Human Genome Research Institute of the National Institutes of Health for contributing to our discussions around this work.

Conflicts of Interest

A.I., M.R., F.F., and N.P. declare no competing interests. T.P.S. declares employment with AstraZeneca. A.A.-C. declares royalties from The Brain, A Beginner’s Guide: Oneworld Publications, and The Genetics of Complex Human Diseases, A Laboratory Manual. A.A.-C. reports consultancies or advisory boards for Amylyx, Apellis, Biogen, Brainstorm, Cytokinetics, GenieUs, GSK, Lilly, Mitsubishi Tanabe Pharma, Novartis, OrionPharma, Quralis, Sano, Sanofi, and Wave Pharmaceuticals. A.A.-C. is the deputy editor for Brain. A.A.-C. has planned patents for ‘Use of CSF-Neurofilament determinations and CSF-Neurofilament thresholds of prognostic and stratification value with regards to response to therapy in neuromuscular and neurodegenerative diseases’. A.A.-C. is the Scientific co-lead for the United to End MND Partnership Coalition and Guarantor of Brain. A.A.-C. has stock options for Quralis.

References

  1. Iacoangeli, A.; Al Khleifat, A.; Sproviero, W.; Shatunov, A.; Jones, A.R.; Morgan, S.L.; Pittman, A.; Dobson, R.J.; Newhouse, S.J.; Al-Chalabi, A. DNAscan: Personal computer compatible NGS analysis, annotation and visualisation. BMC Bioinform. 2019, 20, 213. [Google Scholar] [CrossRef] [PubMed]
  2. Wenger, A.M.; Peluso, P.; Rowell, W.J.; Chang, P.-C.; Hall, R.J.; Concepcion, G.T.; Ebler, J.; Fungtammasan, A.; Kolesnikov, A.; Olson, N.D.; et al. Accurate circular consensus long-read sequencing improves variant detection and assembly of a human genome. Nat. Biotechnol. 2019, 37, 1155–1162. [Google Scholar] [CrossRef] [PubMed]
  3. Illumina. Accuracy Improvements in Germline Small Variant Calling with the DRAGEN Platform2019 07/09/2019. Available online: https://science-docs.illumina.com/documents/Informatics/dragen-v3-accuracy-appnote-html-970-2019-006/Content/Source/Informatics/Dragen/dragen-v3-accuracy-appnote-970-2019-006/dragen-v3-accuracy-appnote-970-2019-006.html (accessed on 13 March 2023).
  4. Kosugi, S.; Momozawa, Y.; Liu, X.; Terao, C.; Kubo, M.; Kamatani, Y. Comprehensive evaluation of structural variation detection algorithms for whole genome sequencing. Genome Biol. 2019, 20, 117. [Google Scholar] [CrossRef] [PubMed]
  5. Rhoades, R.; Jackson, F.; Teng, S. Discovery of rare variants implicated in schizophrenia using next-generation sequencing. J. Transl. Genet. Genom. 2019, 3, 1. [Google Scholar] [CrossRef]
  6. Davey, J.W.; Hohenlohe, P.A.; Etter, P.D.; Boone, J.Q.; Catchen, J.M.; Blaxter, M.L. Genome-wide genetic marker discovery and genotyping using next-generation sequencing. Nat. Rev. Genet. 2011, 12, 499–510. [Google Scholar] [CrossRef]
  7. Lee, J.J.; Wedow, R.; Okbay, A.; Kong, E.; Maghzian, O.; Zacher, M.; Nguyen-Viet, T.A.; Bowers, P.; Sidorenko, J.; Linnér, R.K.; et al. Gene discovery and polygenic prediction from a genome-wide association study of educational attainment in 1.1 million individuals. Nat. Genet. 2018, 50, 1112–1121. [Google Scholar] [CrossRef]
  8. Bycroft, C.; Freeman, C.; Petkova, D.; Band, G.; Elliott, L.T.; Sharp, K.; Motyer, A.; Vukcevic, D.; Delaneau, O.; O’Connell, J.; et al. The UK Biobank resource with deep phenotyping and genomic data. Nature 2018, 562, 203–209. [Google Scholar] [CrossRef]
  9. Hörster, F.; Kölker, S.; Loeber, J.G.; Cornel, M.C.; Hoffmann, G.F.; Burgard, P. Newborn Screening Programmes in Europe, Arguments and Efforts Regarding Harmonisation: Focus on Organic Acidurias. JIMD Rep. 2017, 32, 105–115. [Google Scholar]
  10. Perrone, F.; Cacace, R.; Van Mossevelde, S.; Van den Bossche, T.; De Deyn, P.P.; Cras, P.; Engelborghs, S.; van der Zee, J.; Van Broeckhoven, C. Genetic screening in early-onset dementia patients with unclear phenotype: Relevance for clinical diagnosis. Neurobiol. Aging. 2018, 69, 292.e7–292.e14. [Google Scholar] [CrossRef]
  11. Majumder, M.A.; Guerrini, C.J.; McGuire, A.L. Direct-to-Consumer Genetic Testing: Value and Risk. Annu. Rev. Med. 2021, 72, 151–166. [Google Scholar] [CrossRef]
  12. Murray, M.F.; Evans, J.P.; Khoury, M.J. DNA-Based Population Screening: Potential Suitability and Important Knowledge Gaps. JAMA 2020, 323, 307–308. [Google Scholar] [CrossRef] [PubMed]
  13. Dickinson, J.A.; Pimlott, N.; Grad, R.; Singh, H.; Szafran, O.; Wilson, B.J.; Groulx, S.; Thériault, G.; Bell, N.R. Screening: When things go wrong. Can. Fam. Physician 2018, 64, 502–508. [Google Scholar] [PubMed]
  14. Jansen, M.E.; Lister, K.J.; van Kranen, H.J.; Cornel, M.C. Policy Making in Newborn Screening Needs a Structured and Transparent Approach. Front. Public Health 2017, 5, 53. [Google Scholar] [CrossRef] [PubMed]
  15. Genome U.K.: The Future of Healthcare. Available online: https://www.gov.uk/government/publications/genome-uk-the-future-of-healthcare (accessed on 13 March 2023).
  16. Moorthie, S.; Hall, A.; Janus, J.; Brigden, T.; de Villiers, C.B.; Blackburn, L.; Johnson, E.; Kroese, M. Polygenic Scores and Clinical Utility; University of Cambridge: Cambridge, UK, 2021. [Google Scholar]
  17. Adhikari, A.N.; Gallagher, R.C.; Wang, Y.; Currier, R.J.; Amatuni, G.; Bassaganyas, L.; Chen, F.; Kundu, K.; Kvale, M.; Mooney, S.D.; et al. The role of exome sequencing in newborn screening for inborn errors of metabolism. Nat. Med. 2020, 26, 1392–1397. [Google Scholar] [CrossRef]
  18. Centers for Disease Control and Prevention. Use of Genomics in Newborn Screening Programs: The Promise and Challenges 2021. Available online: https://archive.cdc.gov/www_cdc_gov/genomics/events/newborn_screening_2021.htm (accessed on 16 April 2025).
  19. Pain, O.; Gillett, A.C.; Austin, J.C.; Folkersen, L.; Lewis, C.M. A tool for translating polygenic scores onto the absolute scale using summary statistics. Eur. J. Hum. Genet. 2022, 30, 339–348. [Google Scholar] [CrossRef]
  20. Loeber, J.G.; Burgard, P.; Cornel, M.C.; Rigter, T.; Weinreich, S.S.; Rupp, K.; Hoffmann, G.F.; Vittozzi, L. Newborn screening programmes in Europe; arguments and efforts regarding harmonization. Part 1—From blood spot to screening result. J. Inherit. Metab. Dis. 2012, 35, 603–611. [Google Scholar] [CrossRef]
  21. Southern, K.W.; Munck, A.; Pollitt, R.; Travert, G.; Zanolla, L.; Dankert-Roelse, J.; Castellani, C.; ECFS CF Neonatal Screening Working Group. A survey of newborn screening for cystic fibrosis in Europe. J. Cyst. Fibros. 2007, 6, 57–65. [Google Scholar] [CrossRef]
  22. Rinaldo, P.; Zafari, S.; Tortorelli, S.; Matern, D. Making the case for objective performance metrics in newborn screening by tandem mass spectrometry. Ment. Retard. Dev. Disabil. Res. Rev. 2006, 12, 255–261. [Google Scholar] [CrossRef]
  23. Rehm, H.L.; Berg, J.S.; Brooks, L.D.; Bustamante, C.D.; Evans, J.P.; Landrum, M.J.; Ledbetter, D.H.; Maglott, D.R.; Martin, C.L.; Nussbaum, R.L.; et al. ClinGen—The Clinical Genome Resource. N. Engl. J. Med. 2015, 372, 2235–2242. [Google Scholar] [CrossRef]
  24. Hunter, J.E.; Irving, S.A.; Biesecker, L.G.; Buchanan, A.; Jensen, B.; Lee, K.; Martin, C.L.; Milko, L.; Muessig, K.; Niehaus, A.D.; et al. A standardized, evidence-based protocol to assess clinical actionability of genetic disorders associated with genomic variation. Genet. Med. 2016, 18, 1258–1268. [Google Scholar] [CrossRef]
  25. Biesecker, L.G. Genomic screening and genomic diagnostic testing-two very different kettles of fish. Genome Med. 2019, 11, 75. [Google Scholar] [CrossRef] [PubMed]
  26. Hunink, M.G.M.; Weinstein, M.C.; Wittenberg, E.; Drummond, M.F.; Pliskin, J.S.; Wong, J.B.; Glasziou, P.P. Decision Making in Health and Medicine: Integrating Evidence and Values, 2nd ed.; Cambridge University Press: Cambridge, UK, 2014. [Google Scholar]
  27. Bertram, L.; Tanzi, R.E. The genetic epidemiology of neurodegenerative disease. J. Clin. Invest. 2005, 115, 1449–1457. [Google Scholar] [CrossRef] [PubMed]
  28. Langbehn, D.R.; Brinkman, R.R.; Falush, D.; Paulsen, J.S.; Hayden, M.R. A new model for prediction of the age of onset and penetrance for Huntington’s disease based on CAG length. Clin. Genet. 2004, 65, 267–277. [Google Scholar] [CrossRef]
  29. Brown, R.H.; Al-Chalabi, A. Amyotrophic Lateral Sclerosis. N. Engl. J. Med. 2017, 377, 162–172. [Google Scholar] [CrossRef]
  30. Hillert, A.; Anikster, Y.; Belanger-Quintana, A.; Burlina, A.; Burton, B.K.; Carducci, C.; Chiesa, A.E.; Christodoulou, J.; Đorđević, M.; Desviat, L.R.; et al. The Genetic Landscape and Epidemiology of Phenylketonuria. Am. J. Hum. Genet. 2020, 107, 234–250. [Google Scholar] [CrossRef]
  31. van der Spek, R.A.A.; van Rheenen, W.; Pulit, S.L.; Kenna, K.P.; van den Berg, L.H.; Veldink, J.H. The project MinE databrowser: Bringing large-scale whole-genome sequencing in ALS to researchers and the public. Amyotroph. Lateral Scler. Front. Degener. 2019, 20, 432–440. [Google Scholar] [CrossRef]
  32. ALS Variant Server. Available online: https://www.umassmed.edu/als-clinic-research-center/ (accessed on 12 February 2021).
  33. Landrum, M.J.; Lee, J.M.; Benson, M.; Brown, G.R.; Chao, C.; Chitipiralla, S.; Gu, B.; Hart, J.; Hoffman, D.; Jang, W.; et al. ClinVar: Improving access to variant interpretations and supporting evidence. Nucleic Acids Res. 2018, 46, D1062–D1067. [Google Scholar] [CrossRef]
  34. Santos, R.; Lee, H.; Williams, A.; Baffour-Kyei, A.; Breen, G.; Iacoangeli, A. Investigating the performance of Oxford Nanopore long-read sequencing with respect to Illumina microarrays and short-read sequencing. bioRxiv 2024. [Google Scholar] [CrossRef]
  35. Mitsuhashi, S.; Frith, M.C.; Mizuguchi, T.; Miyatake, S.; Toyota, T.; Adachi, H.; Oma, Y.; Kino, Y.; Mitsuhashi, H.; Matsumoto, N. Tandem-genotypes: Robust detection of tandem repeat expansions from long DNA reads. Genome biology 2019, 20, 1–17. [Google Scholar] [CrossRef]
  36. Paulson, H. Repeat expansion diseases. Handb. Clin. Neurol. 2018, 147, 105–123. [Google Scholar]
  37. Iacoangeli, A.; Al Khleifat, A.; Sproviero, W.; Shatunov, A.; Jones, A.R.; Opie-Martin, S.; Naselli, E.; Topp, S.D.; Fogh, I.; Hodges, A.; et al. ALSgeneScanner: A pipeline for the analysis and interpretation of DNA sequencing data of ALS patients. Amyotroph. Lateral Scler. Front. Degener. 2019, 20, 207–215. [Google Scholar] [CrossRef] [PubMed]
  38. Zou, Z.-Y.; Zhou, Z.-R.; Che, C.-H.; Liu, C.-Y.; He, R.-L.; Huang, H.-P. Genetic epidemiology of amyotrophic lateral sclerosis: A systematic review and meta-analysis. J. Neurol. Neurosurg. Psychiatry 2017, 88, 540–549. [Google Scholar] [CrossRef] [PubMed]
  39. Mehta, P.R.; Iacoangeli, A.; Opie-Martin, S.; van Vugt, J.; Al Khleifat, A.; Bredin, A.; Ossher, L.; Andersen, P.M.; Hardiman, O.; Mehta, A.R.; et al. The impact of age on genetic testing decisions in amyotrophic lateral sclerosis. Brain 2022, 145, 4440–4447. [Google Scholar] [CrossRef]
  40. Abel, O.; Powell, J.F.; Andersen, P.M.; Al-Chalabi, A. ALSoD: A user-friendly online bioinformatics tool for amyotrophic lateral sclerosis genetics. Hum. Mutat. 2012, 33, 1345–1351. [Google Scholar] [CrossRef]
  41. Renton, A.E.; Majounie, E.; Waite, A.; Simon-Sanchez, J.; Rollinson, S.; Gibbs, J.R.; Schymick, J.C.; Laaksovirta, H.; van Swieten, J.C.; Myllykangas, L.; et al. A hexanucleotide repeat expansion in C9ORF72 is the cause of chromosome 9p21-linked ALS-FTD. Neuron 2011, 72, 257–268. [Google Scholar] [CrossRef]
  42. Cudkowicz, M.E.; McKenna-Yasek, D.; Sapp, P.E.; Chin, W.; Geller, B.; Hayden, D.L.; Schoenfeld, D.A.; Hosler, B.A.; Horvitz, H.R.; Brown, R.H. Epidemiology of mutations in superoxide dismutase in amyotrophic lateral sclerosis. Ann. Neurol. 1997, 41, 210–221. [Google Scholar] [CrossRef]
  43. Spargo, T.P.; Opie-Martin, S.; Bowles, H.; Lewis, C.M.; Iacoangeli, A.; Al-Chalabi, A. Calculating variant penetrance from family history of disease and average family size in population-scale data. Genome Med. 2022, 14, 141. [Google Scholar] [CrossRef]
  44. Saeed, M.; Yang, Y.; Deng, H.X.; Hung, W.Y.; Siddique, N.; Dellefave, L.; Gellera, C.; Andersen, P.M.; Siddique, T. Age and founder effect of SOD1 A4V mutation causing ALS. Neurol. 2009, 72, 1634–1639. [Google Scholar] [CrossRef]
  45. Richards, S.; Aziz, N.; Bale, S.; Bick, D.; Das, S.; Gastier-Foster, J.; Grody, W.W.; Hegde, M.; Lyon, E.; Spector, E.; et al. Standards and guidelines for the interpretation of sequence variants: A joint consensus recommendation of the American College of Medical Genetics and Genomics and the Association for Molecular Pathology. Genet. Med. 2015, 17, 405–423. [Google Scholar] [CrossRef]
  46. Akimoto, C.; Volk, A.E.; van Blitterswijk, M.; Van den Broeck, M.; Leblond, C.S.; Lumbroso, S.; Camu, W.; Neitzel, B.; Onodera, O.; van Rheenen, W.; et al. A blinded international study on the reliability of genetic testing for GGGGCC-repeat expansions in C9orf72 reveals marked differences in results among 14 laboratories. J. Med. Genet. 2014, 51, 419. [Google Scholar] [CrossRef]
  47. Schulze, A.; Lindner, M.; Kohlmüller, D.; Olgemöller, K.; Mayatepek, E.; Hoffmann, G.F. Expanded newborn screening for inborn errors of metabolism by electrospray ionization-tandem mass spectrometry: Results, outcome, and implications. Pediatrics 2003, 111, 1399–1406. [Google Scholar] [CrossRef] [PubMed]
  48. Ferini-Strambi, L.; Marelli, S.; Galbiati, A.; Rinaldi, F.; Giora, E. REM Sleep Behavior Disorder (RBD) as a marker of neurodegenerative disorders. Arch. Ital. Biol. 2014, 152, 129–146. [Google Scholar] [CrossRef] [PubMed]
  49. Amado, D.A.; Davidson, B.L. Gene therapy for ALS: A review. Mol. Ther. 2021, 29, 3345–3358. [Google Scholar] [CrossRef] [PubMed]
  50. Paquin, R.S.; Mittendorf, K.F.; Lewis, M.A.; Hunter, J.E.; Lee, K.; Berg, J.S.; Williams, M.S.; Goddard, K.A.B. Expert and lay perspectives on burden, risk, tolerability, and acceptability of clinical interventions for genetic disorders. Genet. Med. 2019, 21, 2561–2568. [Google Scholar] [CrossRef]
  51. Batish, S.D.; Meservey, M.; Haji-Sheikhi, F.; Nedzweckas, E.; Wang, Z.; Datta, V.; Mullen, T.; Radcliff, J. HTT CAG Repeat Length Variation in Huntington Disease (HD) Patients: Experience from a US Reference Laboratory (2376). Neurology 2021, 96 (Suppl. S15), 2376. [Google Scholar] [CrossRef]
  52. Iacoangeli, A.; Al Khleifat, A.; Jones, A.R.; Sproviero, W.; Shatunov, A.; Opie-Martin, S.; Alzheimer’s Disease Neuroimaging Initiative; Morrison, K.E.; Shaw, P.J.; Shaw, C.E.; et al. C9orf72 intermediate expansions of 24–30 repeats are associated with ALS. Acta Neuropathol. Commun. 2019, 7, 115. [Google Scholar] [CrossRef]
  53. Iacoangeli, A.; Dilliott, A.A.; Al Khleifat, A.; Andersen, P.M.; Başak, N.A.; Cooper-Knock, J.; Corcia, P.; Couratier, P.; de Carvalho, M.; Drory, V.; et al. Oligogenic structure of amyotrophic lateral sclerosis has genetic testing, counselling and therapeutic implications. J. Neurol. Neurosurg. Psychiatry 2025. [Google Scholar] [CrossRef]
Figure 1. Probability of a disease given a positive genetic test result for a marker of increased disease risk (P(D|T)) according to the sensitivity (P(T|M)) and the specificity (P(T′|M′)) of the testing protocol. (A) presents this for a disease with pre-test probability (P(D)) of 0.5, while (B) presents a disease with P(D) of 0.01. Penetrance is complete (P(D|M) = 1) and variant M is harboured by all people with disease D (P(M|D) = 1) in both panels. Probabilities are defined in the methods.
Biomedicines 13 01018 g001
Figure 2. Probability of disease D following a positive genetic test result for marker M (P(D|T)) according to pre-test disease probability (P(D)).
Biomedicines 13 01018 g002
Figure 3. Change in disease risk following a positive test result for a marker of increased disease risk (P(D|T)) according to penetrance (P(D|M)). (A,B) display modelled and hypothetical markers of ALS which differ in frequency across people affected by ALS (P(M|D)), where pre-test disease probability (P(D)) is 0.0033, and diamonds mark the penetrance estimated for non-hypothetical variants (see Table 1). (C,D) display diseases in which P(M|D) = 1 and with P(D) set in line with the modelled case studies or a hypothetical rare disease. Analytic validity parameters are defined according to the performance of sequencing tools for genotyping single nucleotide variants in (A,C), and of short tandem repeat expansions in (B,D) (see Table S1; Figure 2). Probabilities are defined in the methods.
Biomedicines 13 01018 g003
Disclaimer/Publisher’s Note: The statements, opinions and data contained in all publications are solely those of the individual author(s) and contributor(s) and not of MDPI and/or the editor(s). MDPI and/or the editor(s) disclaim responsibility for any injury to people or property resulting from any ideas, methods, instructions or products referred to in the content.

