Article

Ramp Sequence May Explain Synonymous Variant Association with Alzheimer’s Disease in the Paired Immunoglobulin-like Type 2 Receptor Alpha (PILRA)

by
Justin B. Miller
1,2,3,4,*,
J. Anthony Brandon
2,
Lauren M. Harmon
5,
Hady W. Sabra
1,2,3,4,
Chloe C. Lucido
1,2,3,4,
Josue D. Gonzalez Murcia
5,
Kayla A. Nations
2,
Samuel H. Payne
5,
Mark T. W. Ebbert
2,4,6,
John S. K. Kauwe
5 and
Perry G. Ridge
5,*
1
Department of Pathology and Laboratory Medicine, University of Kentucky, Lexington, KY 40506, USA
2
Sanders-Brown Center on Aging, University of Kentucky, Lexington, KY 40506, USA
3
Department of Microbiology, Immunology, and Molecular Genetics, University of Kentucky, Lexington, KY 40506, USA
4
Division of Biomedical Informatics, Department of Internal Medicine, University of Kentucky, Lexington, KY 40506, USA
5
Department of Biology, Brigham Young University, Provo, UT 84602, USA
6
Department of Neuroscience, University of Kentucky, Lexington, KY 40506, USA
*
Authors to whom correspondence should be addressed.
Biomedicines 2025, 13(3), 739; https://doi.org/10.3390/biomedicines13030739
Submission received: 16 January 2025 / Revised: 7 March 2025 / Accepted: 14 March 2025 / Published: 18 March 2025
(This article belongs to the Special Issue Alzheimer's Disease Genetics)

Abstract

:
Background: The synonymous variant NC_000007.14:g.100373690T>C (rs2405442:T>C) in the Paired Immunoglobulin-like Type 2 Receptor Alpha (PILRA) gene was previously associated with decreased risk for Alzheimer’s disease (AD) in genome-wide association studies, but its biological impact is largely unknown. Objective: We hypothesized that rs2405442:T>C decreases mRNA and protein levels by destroying a ramp of slowly translated codons at the 5′ end of PILRA. Methods: We assessed rs2405442:T>C predicted effects on PILRA through quantitative polymerase chain reactions (qPCRs) and enzyme-linked immunosorbent assays (ELISAs) using Chinese hamster ovary (CHO) cells. RESULTS: Both mRNA (p = 1.9184 × 10⁻¹³) and protein (p = 0.01296) levels significantly decreased in the mutant versus the wildtype in the direction that we predicted based on the destruction of a ramp sequence. Conclusions: We show that rs2405442:T>C alone directly impacts PILRA mRNA and protein expression, and ramp sequences may play a role in regulating AD-associated genes without modifying the protein product.

1. Introduction

Alzheimer’s disease (AD) is highly heritable, with genetic variants accounting for 58–79% of total dementia risk [1]. Common genetic effects identified through genome-wide association studies (GWASs) implicate approximately 80 genetic risk loci with AD-type dementia [2,3,4,5,6,7,8,9], yet less is known about which genetic variants drive disease association. Many factors from high-impact diseases in addition to AD (i.e., amyloid plaques and neurofibrillary tangles) contribute to the dementia phenotype [10,11], and heterogeneity plays a role in several distinct subtypes based on biomarkers [12,13,14], genetics [15,16], imaging [13,17,18,19,20,21], and impact on daily function [22,23]. Similarly, clinical symptoms of dementia are heterogeneous and based on a progression of amyloid deposition, tau buildup, and neurodegeneration (A/T/N) [24], with mixed pathologies impacting the speed of cognitive decline [13,17,22,25,26,27,28,29]. While polygenic risk scores (PRSs) have recently emerged as a viable tool to aggregate genetic risk across various disease-associated loci so that complex population-specific genetic interactions can be simplified to a single risk score [30,31], they do not attempt to characterize the biological mechanisms underpinning disease associations, and many associations have yet to be biologically validated. One of those currently unsubstantiated associations is located in the Paired Immunoglobulin-like Type 2 Receptor Alpha (PILRA). Here, we biologically assessed the effects of the synonymous variant, NC_000007.14:g.100373690T>C (rs2405442:T>C), and propose that its association with AD is caused by the destruction of a ramp of slowly translated codons at the 5′ end of PILRA.
Ramp sequences are essential genetic regulatory regions that counterintuitively maximize overall translational efficiency by slowing translation at the 5′ end of genes to evenly space ribosomes, which limits downstream ribosomal collisions and reduces translational errors [32,33,34,35,36,37,38,39]. Specifically, ramp sequences increase mRNA stability and gene expression, especially in genes that have higher ribosome density, higher mRNA levels, and a strong correlation between mRNA and protein expression [38,40] by reducing ribosome stalling and mRNA degradation via ribosome-associated protein quality control (RQC) [41]. Ramp sequences are phylogenetically conserved [42], yet differ between human populations [43] and cell types [44], which corresponds with population and cell-specific differences in gene expression [38,43,44]. A ramp sequence is present in PILRA, which likely helps regulate both protein and mRNA levels within different cell types.
PILRA is an inhibitory receptor that regulates immune cells [45] of the myelomonocytic lineage such as macrophages, dendritic cells, monocytes and monocyte-derived dendritic cells and is highly expressed in the lymph node and neural tissues [46,47]. It functions by negatively regulating neutrophil infiltration and controlling monocyte mobility [45,48]. The innate and adaptive immune responses have been implicated in AD [49], and gene regulation of PILRA-expressing myeloid cells have also been associated with AD [50]. AD risk alleles are specifically enriched in active enhancers of myeloid-derived cells that express PILRA such as monocytes, macrophages, and microglia, with PILRA expression contributing to a systemic failure of cell-mediated amyloid-β (Aβ) clearance [51], which likely contributes to AD onset and progression.
Several studies have found AD-associated variants in PILRA to be protective [7,52,53], yet the protective variant effects are generally attributed to a missense variant, NC_000007.14:g.100374211A>G (rs1859788:A>G) [53], which is in high linkage disequilibrium with rs2405442:T>C. However, we show that rs2405442:T>C alone disrupts the PILRA ramp sequence by increasing codon adaptiveness relative to the rest of the transcript, which in turn significantly decreases both mRNA (p = 1.9184 × 10⁻¹³) and protein (p = 0.01296) levels in the direction that we hypothesized based on predicted ramp sequence effects. This study is the first time where ramp sequences have been used to prioritize disease-associated variants for biological validation and offers a likely biological mechanism that can regulate PILRA expression without altering the final protein product. Further, these analyses show that the synonymous variant rs2405442:T>C alone disrupts PILRA and may drive association with AD.

2. Materials and Methods

2.1. Identifying AD-Associated Genetic Variants

We prioritized genetic variants for ramp sequence analyses using the GWAS summary statistics from Jansen, Savage [54] because they report all single nucleotide polymorphism (SNP) associations with AD that exceeded the genome-wide significance threshold of p ≤ 5.0 × 10⁻⁸ before accounting for linkage disequilibrium at each locus. While Bellenguez, Küçükali [2] report additional genetic associations with AD, we opted to not include their summary statistics in these analyses because they report only variants that are likely independent hits after performing linkage disequilibrium analyses, which greatly reduces the number of reported genetic associations by using p-values to prioritize the independent hits. In some cases, leading variants are chosen based on predicted effects, which would also bias our analyses since variant-level ramp sequence effects have not previously been reported. Additionally, ramp sequences are affected by only exonic coding variants, which are generally rarer than intronic variants in GWASs and may be missed by a clumping approach to choose independent hits. Thus, we decided that the full table of variant-level associations reported by Jansen, Savage [54] was most appropriate to assess how ramp sequences potentially impact AD. Although 2357 variants were originally reported [54], only 51 variants were reported in exonic regions, with only 14 SNPs identified as plausible causal variants based on a fine-mapping model that accounts for APOE ε4, roughly corresponding to p > ~2.0 × 10⁻⁴. All computational analyses were limited to those 14 variants.
Ensembl [55] web queries were conducted in December 2023 to obtain the most severe variant consequence, highest minor allele frequency, Combined Annotation Dependent Depletion (CADD) score [56], Genomic Evolutionary Rate Profiling (GERP) score [57], and GRCh38.p14 reference genome chromosome coordinates. RegulomeDB [58] scores were then queried using the RegulomeDB web interface. All transcript isoforms with GRCh38.p14 reference genome coordinates were downloaded from the National Center for Biotechnology Information (NCBI; https://www.ncbi.nlm.nih.gov/datasets/genome/GCF_000001405.40/) accessed on 1 December 2023.

2.2. Identifying Ramp Sequences

Since ramp sequences are dependent on tissue and cell-specific tRNA pools, we used The Ramp Atlas [44] to download pre-computed tRNA efficiency values for 62 human tissues included in a consensus dataset derived from the Genotype-Tissue Expression (GTEx) Project [59], Functional ANnoTation of the Mammalian genome (FANTOM5) [60], and the Human Protein Atlas [47] databases. An additional file consisting of codon efficiencies from 66 cell types was also downloaded from The Ramp Atlas and used to analyze cell-specific effects on PILRA ramp sequences. The relative codon adaptiveness in each tissue or cell type could impact the presence or absence of a ramp sequence by changing where translational bottlenecks occur without altering the DNA sequence. We used ExtRamp [36] to identify ramp sequences in the reference and mutant sequence for each tissue or cell type individually using the -a option to specify the relative codon adaptiveness for each tissue or cell, which resulted in 256 total ramp sequence calculations for each variant (62 tissues + 66 cell types for both the reference and mutant sequences). By default, ExtRamp identifies ramp sequences based on codon translational efficiencies spanning nine codons, which is roughly the size of a ribosome window [61]. The harmonic mean is then used to determine the translational rate within that window, which is compared to the harmonic mean translational efficiency of the entire gene sequence. True outlier regions that occur at the 5′ end of genes are considered ramp sequences and were reported for each tissue and cell type. All scripts used to identify ramp sequences are available at https://github.com/jmillerlab/PILRA_ramp.

2.3. Biological Assessment of Ramp Sequence Effects in PILRA

The synonymous variant rs2405442:T>C in PILRA was the only AD-associated variant predicted to destroy a ramp sequence. Since all five PILRA isoforms are predicted to have ramp sequences, we opted to use the longest PILRA isoform (Ensembl accession: ENST00000198536.7; NCBI accession: NM_013439.3) to assess rs2405442:T>C effects on mRNA and protein levels. DNA sequences for ENST00000198536.7 (wildtype) and ENST00000198536.7 containing rs2405442:T>C (mutant) were synthesized by GenScript Biotech. A Human c-Myc proto-oncogene (MYC) epitope tag, FLAG® epitope tag, and enterokinase cleavage site were attached to the 3′ end of the coding sequences. The reference and mutant sequences with annotated features are depicted in Supplementary Figures S1 and S2.
Three independent replicates of quantitative polymerase chain reactions (qPCRs), each of which contained eight technical replicates, were used to assess how the synonymous variant, rs2405442:T>C, impacted PILRA mRNA levels in both the mutant and the wildtype transfected cells. Similarly, three independent sets of eight technical replicates were used to assess how PILRA protein levels differed between the mutant and wildtype using Enzyme-Linked Immunosorbent Assay (ELISA). Detailed instructions for replicating each protocol are described below.

2.4. Transfection of Wildtype and Mutant Transcripts

The wildtype and mutant sequences synthesized by GenScript Biotech were each inserted into separate mammalian expression vectors pCMV6-AN-myc-DDK (ORIGENE, Catalog #PS100016). Transformation protocols were followed as recommended by the manufacturer. In brief, plasmids were transformed into competent DH5a cells, amplified, and purified using the ZymoPURE II Plasmid Maxiprep kit (Catalog #D4203). Purified wildtype and mutant plasmids were then transfected into Chinese Hamster Ovary-K1 (CHO-K1) cells using the Lipofectamine™ 3000 Transfection Reagent protocol (ThermoFisher, Waltham, MA, USA, Catalog #15338100). Properly transfected cells were selected using the antibiotic G418 sulfate (ThermoFisher, Catalog #10131035). Transfected cells were grown in F12 media (ThermoFisher, Catalog #11765054) with 10 mg/mL penicillin, 10 μg/mL streptomycin (Gibco, Catalog #21127-022), and 10% FBS (HYCLone Catalog #SH30071.01). Cell media was changed every 48 to 72 h depending on cell confluency levels. CHO-K1 transfected cells were then used in both the qPCR and ELISA protocols.

2.5. qPCR Protocol

Total RNA was extracted from the mutant and the wildtype CHO-K1 transfected cells using the SPLIT RNA Extraction Kit (Lexogen, Vienna, Wien, Austria, Catalog #008) and following the manufacturer guidelines. When the total RNA was purified and ready for quality control, the total RNA concentration was quantified using a NanoDrop spectrophotometer and the Agilent DNF-471 RNA Kit 15nt (Agilent, Santa Clara, CA, USA, Catalog #DNF-471-0500). Reverse transcription of the RNA into complementary DNA (cDNA) was then performed to convert the RNA molecules into their corresponding cDNA sequences using the High-Capacity cDNA Reverse Transcription Kit (Thermo Fisher Scientific, Waltham, MA, USA, Catalog #4374966). We then performed qPCR (PerfeCTa SYBR® Green SuperMix, Quantabio Beverly, MA, USA, Catalog #95054-500) to quantify gene expression levels, and cDNA concentration was quantified using the Agilent Femto Pulse. Forward and reverse primers (respectively GTAAAACGACGGCCAGT and ACTGGCCGTCGTTTTAC) were ordered from Life Technologies Corporation in March 2023. PILRA mRNA expression was normalized to total RNA to account for potential differences in qPCR amplification efficiency between tests. We calculated the relative expression of PILRA (∆Ct) by subtracting the PILRA counts (Ct) from a housekeeping gene, Glyceraldehyde 3-phosphate dehydrogenase (GAPDH; i.e., PILRA−GAPDH). True outliers were then removed to limit potential technical artifacts. Finally, we calculated the fold change in expression (∆∆Ct) [62] using the following equation with the average ∆Ct MUTANT and ∆Ct CONTROL across all replicates: ∆∆Ct = 2−(∆Ct MUTANT−∆Ct CONTROL).

2.6. ELISA Protocol

Proteins were extracted from the mutant and the wildtype CHO-K1 transfected cells, and the total protein concentration was quantified using the Pierce™ BCA Protein Assay (Thermo Fisher Scientific, Catalog #23225 and 23227) following the manufacturer guidelines. The human PILRA protein concentration was quantitively measured in the mutant and the wildtype CHO-K1 transfected cells using the Human PILR-alpha ELISA Kit (Thermo Fisher Scientific, Catalog #EH368RB) by following the manufacturer guidelines. The concentration of PILRA was then normalized to the total concentration of proteins to account for potential variation between tests.

3. Results

3.1. Ramp Sequence Variation Caused by Exonic GWAS Hits

Table 1 lists the 14 credibly causal exonic SNPs spanning 12 genes and 79 isoforms reported by Jansen, Savage [54]. Each SNP was previously associated with AD and is here reported with the following: the CADD [56] score from GRCh38-v1.6; highest MAF reported in Ensembl [55] from any population in 1000 G Phase 3 [63], NHLBI Exome Sequencing Project [64], and gnomAD [65]; the GERP [57] score from 91_mammals.gerp_conservation_score; RegulomeDB [58] score; and effect on ramp sequences. Six SNPs (rs2405442:T>C, rs12453:T>C, rs7982:A>G, rs1859788:A>G, rs12459419:C>T, and rs2296160:A>G) are in five genes (PILRA, MS4A6A, CR1, CLU, and CD33) with ramp sequences. While rs2405442:T>C, rs12453:T>C, rs1859788:A>G, and rs12459419:C>T change the ramp sequence length, only rs2405442:T>C has a severe impact on ramp sequences by destroying it in at least one tissue or cell type.

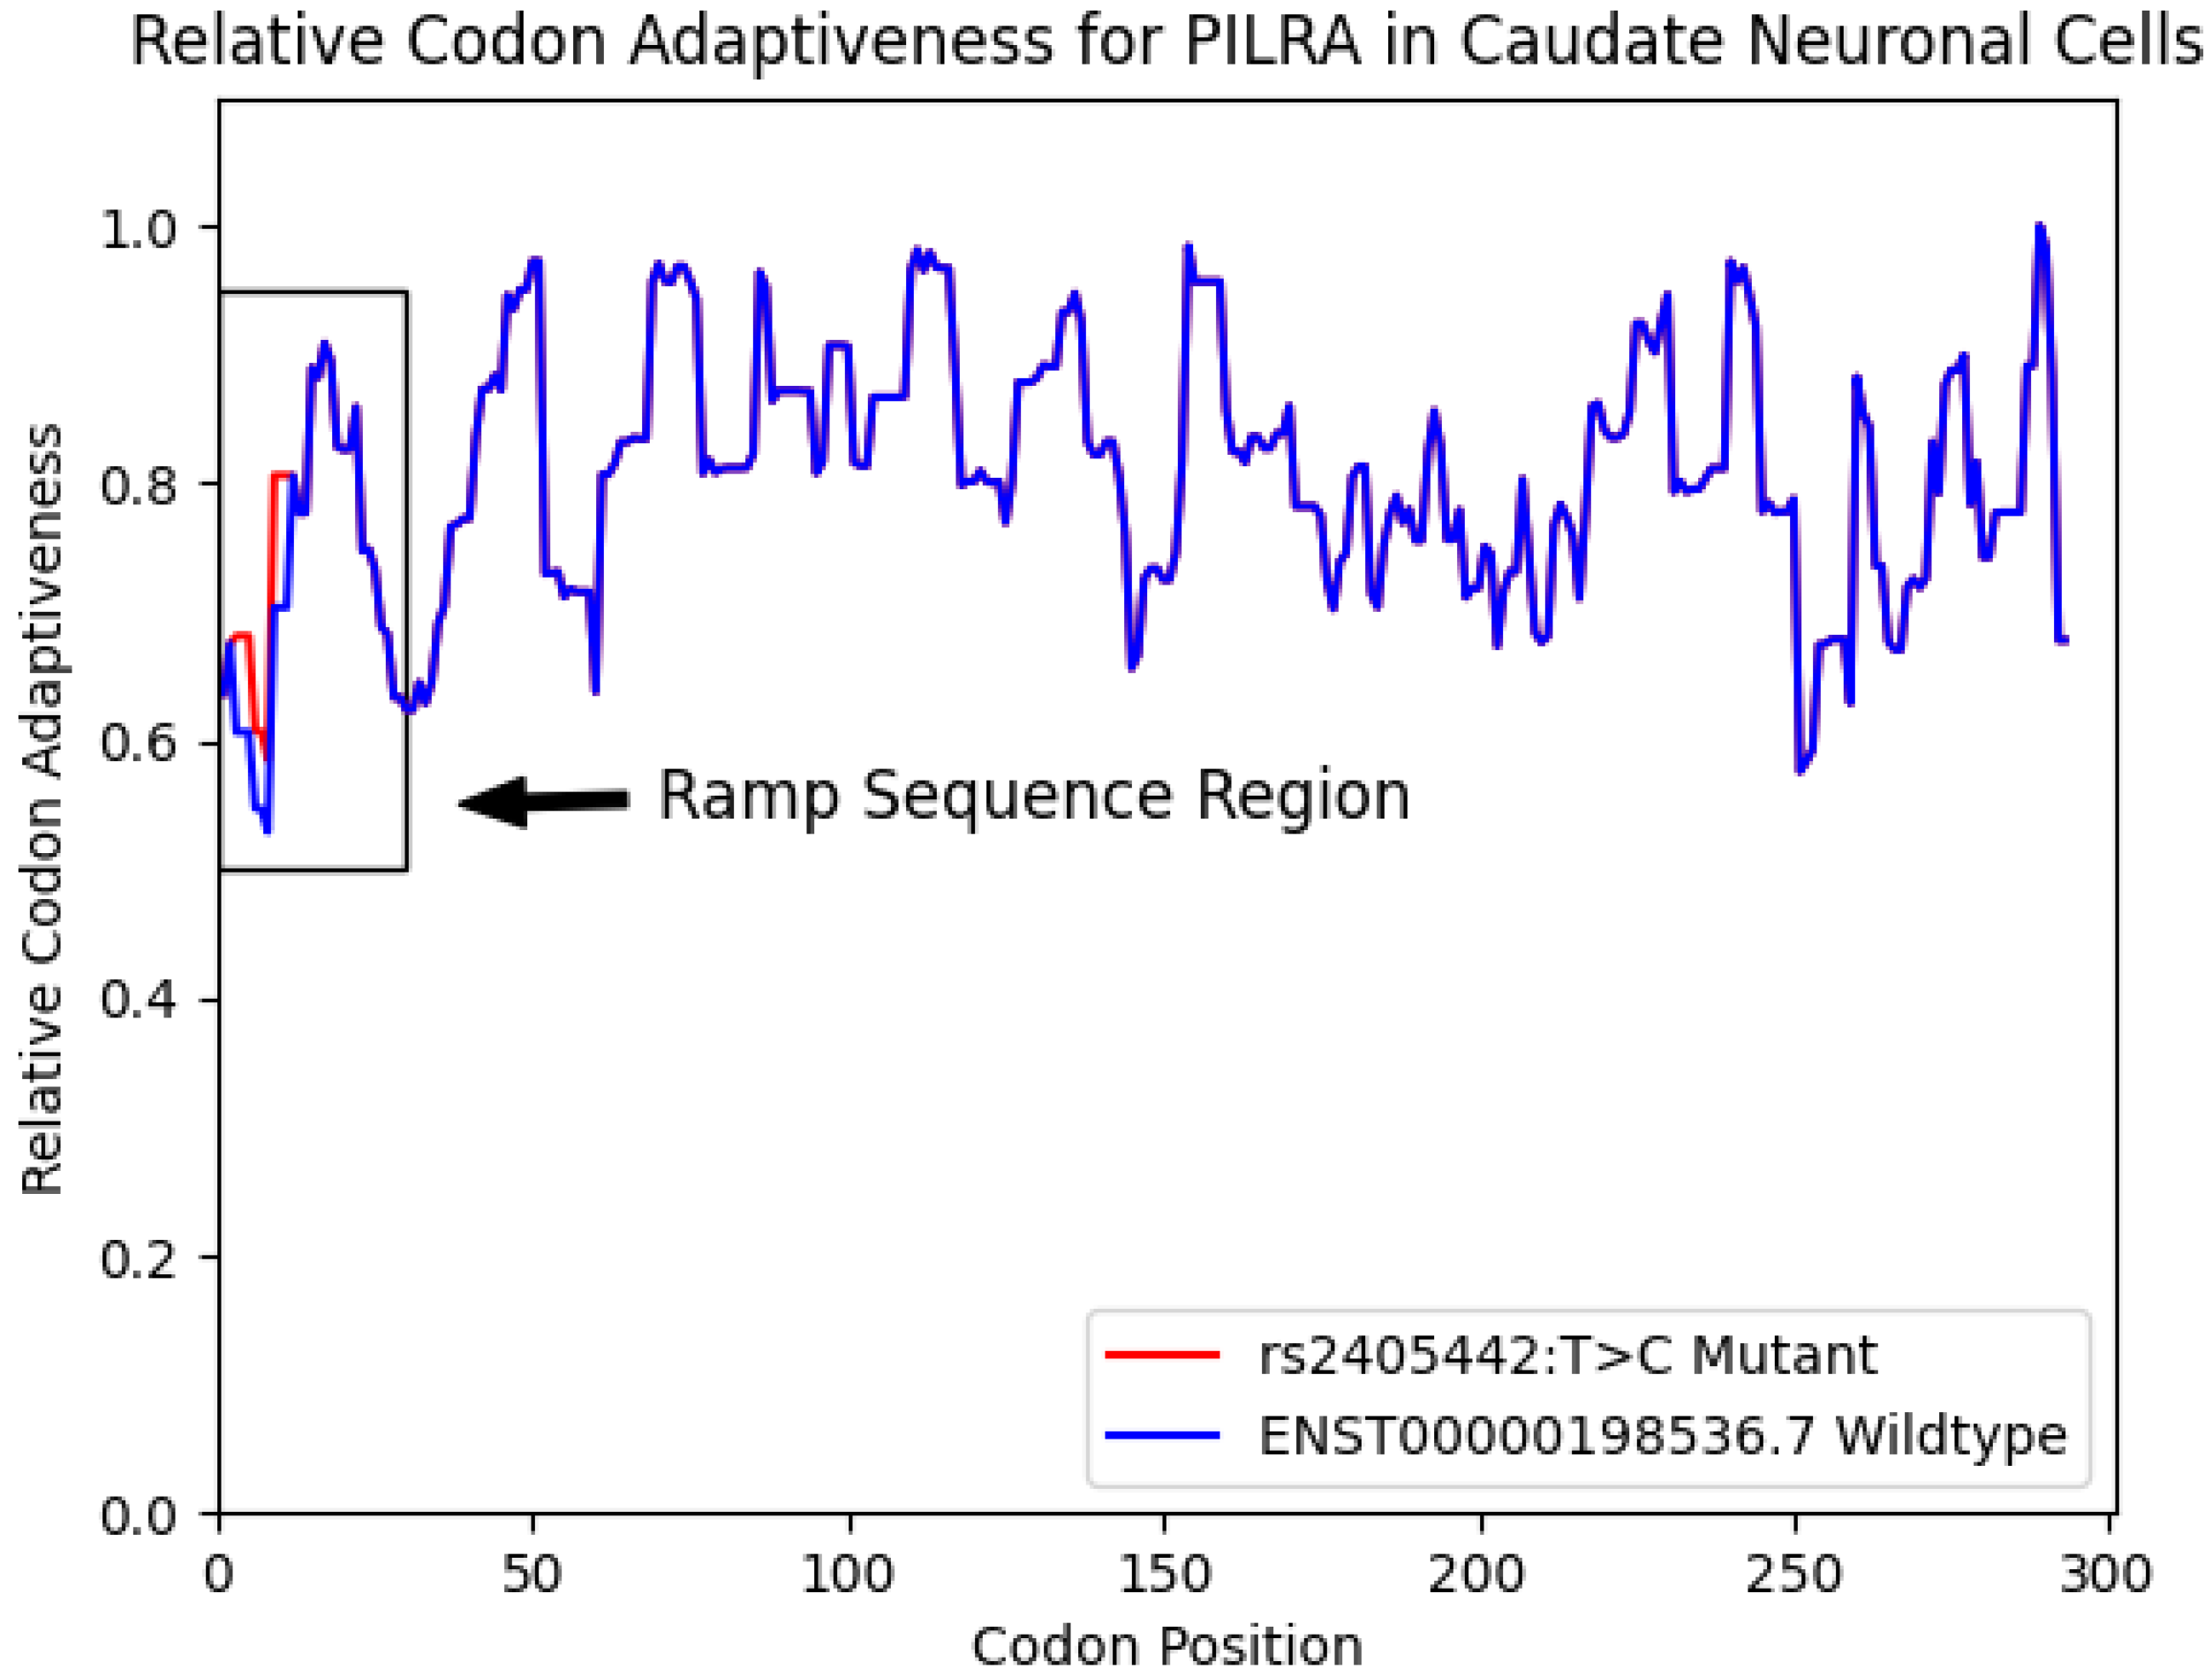
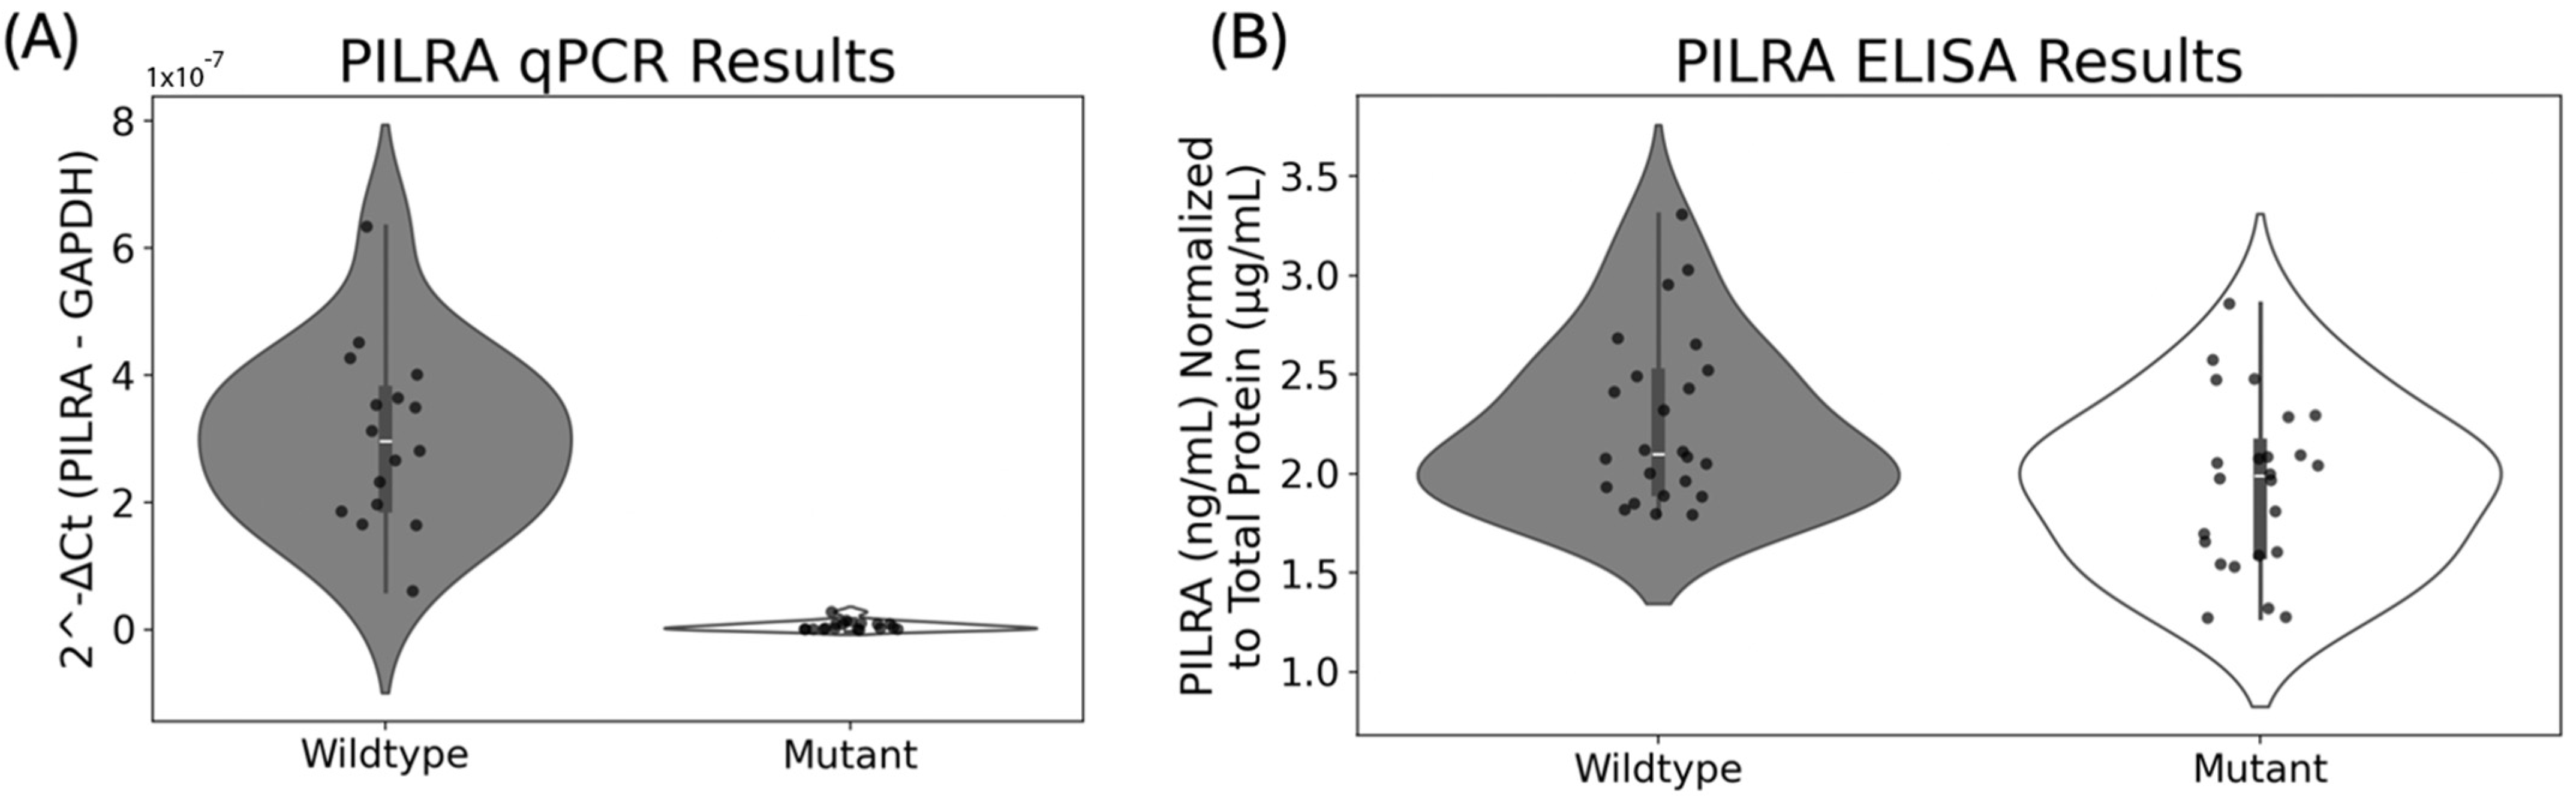
3.2. PILRA Ramp Sequence

Using ExtRamp, we calculated the relative codon adaptiveness of PILRA using all four isoforms in GRCh38. We then calculated the relative codon adaptiveness of PILRA with the synonymous variant rs2405442:T>C and found that a ramp sequence is present in the reference isoforms but not the mutant isoforms for all four transcripts. The PILRA SNP, rs2405442:T>C, increases regional mean translational efficiency at the 5′ end of PILRA, effectively destroying the ramp sequence (see Figure 1).
Using the consensus dataset consisting of gene expression from GTEx, FANTOM5, and the Human Protein Atlas, PILRA has a ramp sequence in 26/62 tissues. Using a single-cell dataset from the Human Protein Atlas, we also predicted that ramp sequences occur in PILRA in 20/66 cell types. The synonymous variant rs2405442:T>C destroyed the ramp sequence in all 46 tissues and cell types that normally contain a ramp sequence. Table 2 lists the 46 tissues or cell types with ramp sequences in PILRA that are affected by rs2405442:T>C (see Supplementary Table S1 for tissues and cell types without a PILRA ramp sequence). Specific neural cells that lost their ramp sequences include cerebellum Purkinje, hippocampus glial, caudate glial, and caudate neuronal cells. Lymphatic tissues and cells that lost their ramp sequences include the dendritic cells, monocytes, appendix lymphoid tissue, lymph node non-germinal center cells, and spleen cells in the red and white pulps.
In addition to ramp sequences, we also evaluated the effects of rs2405442:T>C on other codon usage biases such as the GC content, codon pairing [66], codon aversion [43,67,68,69], and codon translational speed. PILRA was not previously identified as having splicing quantitative trait loci (sQTLs) [70], so rs2405442:T>C is not predicted to impact splicing. The GC content is slightly increased in the mutant, which would normally indicate higher mRNA expression [71]. Additionally, rs2405442:T>C affects the twelfth codon in PILRA, changing it from an uncommon leucine-encoding codon, TTG, to the most common leucine-encoding codon, CTG, which would normally indicate a higher translational speed since common codons are generally translated faster than rare codons [72]. Similarly, identical codon pairing suggests that rs2405442:T>C would increase translational speed [66] since the mutation increases CTG codon pairing in the transcript from six instances in the wildtype to seven instances in the mutant. Since the synonymous variant does not change the amino acid sequence, co-tRNA codon pairings (i.e., co-occurring amino acid residues) [73] were not assessed. Based on codon usage biases, the ramp sequence indicates decreased mRNA and protein expression while the GC content and codon pairing would suggest increased mRNA and protein expression in the mutant versus the wildtype.
Since the synonymous variant rs2405442:T>C is the only credible causal synonymous variant with a predicted deleterious effect on a ramp sequence and is highly associated with AD, it was a good candidate for biological validation. We predicted that the destroyed ramp sequence would have an outsized effect due to ribosome-associated protein quality control induced by increased ribosome collisions [41], and we experimentally validated the predicted effects of rs2405442:T>C on PILRA mRNA and protein levels with qPCR and ELISA using CHO cells harboring the synonymous variant compared to wildtype cells without the variant.
Figure 2 shows that mRNA levels are significantly lower in the mutant than the wildtype (p = 1.9184 × 10⁻¹³). The fold change in expression (∆∆Ct) is ~131× higher in the wildtype than the mutant. Similarly, protein levels are also significantly higher in the wildtype than the mutant (p = 0.01296), with PILRA protein levels being, on average, 1.1635× higher in the wildtype cells than the mutant cells. Although the synonymous variant rs2405442:T>C has no effect on PILRA amino acid residues, it significantly decreases both mRNA and protein levels in the mutant versus the wildtype.

4. Discussion

Here, we provide a mechanistic explanation for the association of rs2405442:T>C with AD, including experimental validation of its biological effects. This study is the first time where ramp sequences have been used to prioritize disease-associated variants for biological validation.
We recognize that additional biological validation is needed to fully assess the impact of rs2405442:T>C on mRNA and protein levels. Additional validation using the Western blot, ribosome profiling, disome-seq, and different cell lines could provide further evidence to support the observed impact of this synonymous variant on PILRA. However, this study is the first to quantifiably assess the impact of rs2405442:T>C and provides strong evidence that rs2405442:T>C alone can impact PILRA mRNA and protein levels. Those direct effects may explain its previous association with Alzheimer’s disease, suggesting that rs2405442:T>C should not be discounted simply because it is a synonymous variant.
Since reduced PILRA inhibitory signaling has previously been shown to induce a protective effect against AD via reduced inhibitory signaling in microglia [53], it is likely that less PILRA expression induced by rs2405442:T>C would similarly reduce inhibition of immune cells and result in more efficient cell-mediated clearance of Aβ. Although rs2405442:T>C creates a more common codon that increases the GC content and codon pairing, which would generally increase mRNA and protein expression, the destroyed ramp sequence seems to outweigh the other codon usage biases producing the observed effects. The destruction of the ramp sequence is expected to increase the frequency of ribosomal collisions, leading to stalled proteins and triggering the recruitment of the ribosome-associated protein quality control [41,74] to degrade aberrant PILRA peptides.
PILRA gene expression in vivo is also likely affected by the distribution of tissue-specific mature tRNA pools. Some evidence suggests that mature tRNA pools change with environmental factors such as aging, stress, and diet, which would also change the relative codon adaptiveness and presence of a ramp sequence [75]. We show that rs2405442:T>C alone can significantly affect mRNA and protein levels independent of other genetic variants or changes in the tRNA pool and further provide a workflow to perform tissue and cell-specific computational analyses to investigate how a genetic variant impact gene-specific ramp sequences in different tissues and cells based on tRNA pool availability. Our tissue and cell-specific data show that after acquiring rs2405442:T>C, neural tissues such as caudate glial and neuronal cells, cerebellum Purkinje cells, and hippocampus glial cells are predicted to similarly lose their ramp sequences. Many lymphatic and immune-related tissues and cells are likewise expected to lose their PILRA ramp sequences after acquiring the synonymous variant, including dendritic cells, monocytes, PBMCs, appendix lymphoid tissue, lymph node non-germinal center cells, spleen cells in the red and white pulps, and tonsil non-germinal center cells. While we did not directly assess rs2405442:T>C effects in AD cell lines, we showed that the synonymous variant rs2405442:T>C decreases PILRA mRNA and protein levels in CHO-K1 cells by destroying a ramp sequence. Since PILRA ramp sequence loss similarly occurs in tissues and cell types known to impact AD, we hypothesize that the previously described association between rs2405442:T>C and AD may stem from rs2405442:T>C reducing PILRA inhibitory signaling in those tissues and cells by destroying the ramp sequence.
The synonymous variant rs2405442:T>C has a high minor allele frequency (MAF > 0.35 [63,65]), indicating that natural decreases in PILRA expression induced by this variant are well-tolerated in the general population. Therefore, ramp-mediated therapeutics targeting rs2405442:T>C may be viable methods to mitigate risk for AD and increase cell-mediated Aβ clearance without inducing other off-target effects.
Here, we show that a ramp sequence plays a crucial role in PILRA gene regulation, and the synonymous variant rs2405442:T>C alone causes a significant decrease in PILRA mRNA and protein levels by disrupting that regulatory mechanism. While synonymous variants are often overlooked in genome-wide association studies, they can significantly alter regulatory biases such as ramp sequences that can directly impact gene expression and protein levels. We outline how to analyze variant effects on ramp sequences, and we present a code repository at https://github.com/jmillerlab/PILRA_ramp to facilitate these types of analyses.

Supplementary Materials

The following supporting information can be downloaded at: https://www.mdpi.com/article/10.3390/biomedicines13030739/s1, Figure S1: Wildtype Sequence with Annotated Features; Figure S2: Mutant Sequence with Annotated Features; Table S1: Tissues and Cell Types Without a Ramp Sequence in PILRA.

Author Contributions

Conceptualization, J.B.M., P.G.R. and L.M.H.; methodology, J.B.M., J.A.B., L.M.H., J.D.G.M. and P.G.R.; software, J.B.M. and L.M.H.; validation, J.B.M., J.A.B., L.M.H., H.W.S., C.C.L., J.D.G.M., K.A.N., M.T.W.E. and P.G.R.; formal analysis, J.B.M., J.A.B., L.M.H., H.W.S., C.C.L., J.D.G.M., K.A.N. and P.G.R.; investigation, J.B.M., J.A.B., L.M.H., H.W.S., C.C.L., J.D.G.M., K.A.N. and P.G.R.; resources, J.B.M., S.H.P., M.T.W.E., J.S.K.K. and P.G.R.; data curation, J.B.M., J.A.B., L.M.H., J.D.G.M. and K.A.N.; writing—original draft preparation, J.B.M., J.A.B., L.M.H., H.W.S., C.C.L., J.D.G.M., K.A.N., S.H.P., M.T.W.E., J.S.K.K. and P.G.R.; writing—review and editing, J.B.M., J.A.B., L.M.H., H.W.S., C.C.L., J.D.G.M., K.A.N., S.H.P., M.T.W.E., J.S.K.K. and P.G.R.; visualization, J.B.M., H.W.S. and C.C.L.; supervision, J.B.M., S.H.P., M.T.W.E., J.S.K.K. and P.G.R.; project administration, J.B.M., S.H.P., M.T.W.E., J.S.K.K. and P.G.R.; funding acquisition J.B.M., M.T.W.E., J.S.K.K. and P.G.R. All authors have read and agreed to the published version of the manuscript.

Funding

This work was supported by the BrightFocus Foundation and its donors [A2020118F to Miller; A2020161S to Ebbert], the National Institutes of Health [1P30AG072946-01 to the University of Kentucky Alzheimer’s Disease Research Center; AG068331 to Ebbert; GM138636 to Ebbert], and the Alzheimer’s Association [2019-AARG-644082 to Ebbert].

Institutional Review Board Statement

Not applicable.

Informed Consent Statement

Not applicable.

Data Availability Statement

All scripts developed and used for these analyses are publicly available at https://github.com/jmillerlab/PILRA_ramp.

Acknowledgments

We appreciate the contributions of the University of Kentucky Sanders–Brown Center on Aging and Brigham Young University for providing the research space and resources to conduct these analyses. We acknowledge the Office of Research Computing at Brigham Young University and the Center for Computational Sciences at the University of Kentucky for providing computational infrastructure and technical support. We also thank the University of Kentucky Center for Computational Sciences and Information Technology Services Research Computing for their support and use of the Morgan Compute Cluster and associated research computing resources.

Conflicts of Interest

The authors declare no conflicts of interest. The funders had no role in the design of this study; in the collection, analyses, or interpretation of data; in the writing of the manuscript; or in the decision to publish the results.

Abbreviations

The following abbreviations are used in this manuscript:
ADAlzheimer’s disease
CHOChinese hamster ovary
RQCRibosome-associated protein quality control

References

  1. Gatz, M.; Reynolds, C.A.; Fratiglioni, L.; Johansson, B.; Mortimer, J.A.; Berg, S.; Fiske, A.; Pedersen, N.L. Role of Genes and Environments for Explaining Alzheimer Disease. Arch. Gen. Psychiatry 2006, 63, 168–174. [Google Scholar] [CrossRef] [PubMed]
  2. Bellenguez, C.; Kucukali, F.; Jansen, I.E.; Kleineidam, L.; Moreno-Grau, S.; Amin, N.; Naj, A.C.; Campos-Martin, R.; Grenier-Boley, B.; Andrade, V.; et al. New insights into the genetic etiology of Alzheimer’s disease and related dementias. Nat. Genet. 2022, 54, 412–436. [Google Scholar] [CrossRef] [PubMed]
  3. Balin, B.J.; Hudson, A.P. Etiology and Pathogenesis of Late-Onset Alzheimer’s Disease. Curr. Allergy Asthma Rep. 2014, 14, 417. [Google Scholar] [CrossRef]
  4. Marioni, R.E.; Harris, S.E.; Zhang, Q.; McRae, A.F.; Hagenaars, S.P.; Hill, W.D.; Davies, G.; Ritchie, C.W.; Gale, C.R.; Starr, J.M.; et al. GWAS on family history of Alzheimer’s disease. Transl. Psychiatry 2018, 8, 99. [Google Scholar] [CrossRef]
  5. Jun, G.; Naj, A.C.; Beecham, G.W.; Wang, L.S.; Buros, J.; Gallins, P.J.; Buxbaum, J.D.; Ertekin-Taner, N.; Fallin, M.D.; Friedland, R.; et al. Meta-analysis Confirms CR1, CLU, and PICALM as Alzheimer Disease Risk Loci and Reveals Interactions with APOE Genotypes. Arch. Neurol. 2010, 67, 1473–1484. [Google Scholar] [CrossRef]
  6. Hu, X.; Pickering, E.; Liu, Y.C.; Hall, S.; Fournier, H.; Katz, E.; Dechairo, B.; John, S.; van Eerdewegh, P.; Soares, H.; et al. Meta-Analysis for Genome-Wide Association Study Identifies Multiple Variants at the BIN1 Locus Associated with Late-Onset Alzheimer’s Disease. PLoS ONE 2011, 6, e16616. [Google Scholar] [CrossRef]
  7. Lambert, J.C.; Ibrahim-Verbaas, C.A.; Harold, D.; Naj, A.C.; Sims, R.; Bellenguez, C.; DeStafano, A.L.; Bis, J.C.; Beecham, G.W.; Grenier-Boley, B.; et al. Meta-analysis of 74,046 individuals identifies 11 new susceptibility loci for Alzheimer’s disease. Nat. Genet. 2013, 45, 1452–1458. [Google Scholar] [CrossRef]
  8. Ridge, P.G.; Hoyt, K.B.; Boehme, K.; Mukherjee, S.; Crane, P.K.; Haines, J.L.; Mayeux, R.; Farrer, L.A.; Pericak-Vance, M.A.; Schellenberg, G.D.; et al. Assessment of the genetic variance of late-onset Alzheimer’s disease. Neurobiol. Aging 2016, 41, 200.e13–200.e20. [Google Scholar] [CrossRef]
  9. Andrews, S.J.; Renton, A.E.; Fulton-Howard, B.; Podlesny-Drabiniok, A.; Marcora, E.; Goate, A.M. The complex genetic architecture of Alzheimer’s disease: Novel insights and future directions. EBioMedicine 2023, 90, 104511. [Google Scholar] [CrossRef]
  10. Escott-Price, V.; Sims, R.; Bannister, C.; Harold, D.; Vronskaya, M.; Majounie, E.; Badarinarayan, N.; Morgan, K.; Passmore, P.; Holmes, C.; et al. Common polygenic variation enhances risk prediction for Alzheimer’s disease. Brain 2015, 138 Pt 12, 3673–3684. [Google Scholar] [CrossRef]
  11. Bakulski, K.M.; Vadari, H.S.; Faul, J.D.; Heeringa, S.G.; Kardia, S.L.R.; Langa, K.M.; Smith, J.A.; Manly, J.J.; Mitchell, C.M.; Benke, K.S.; et al. Cumulative Genetic Risk and APOE ε4 Are Independently Associated With Dementia Status in a Multiethnic, Population-Based Cohort. Neurol. Genet. 2021, 7, e576. [Google Scholar] [CrossRef] [PubMed]
  12. Bredesen, D.E. Metabolic profiling distinguishes three subtypes of Alzheimer’s disease. Aging 2015, 7, 595–600. [Google Scholar] [CrossRef] [PubMed]
  13. Ferreira, D.; Verhagen, C.; Hernandez-Cabrera, J.A.; Cavallin, L.; Guo, C.J.; Ekman, U.; Muehlboeck, J.S.; Simmons, A.; Barroso, J.; Wahlund, L.O.; et al. Distinct subtypes of Alzheimer’s disease based on patterns of brain atrophy: Longitudinal trajectories and clinical applications. Sci. Rep. 2017, 7, 46263. [Google Scholar] [CrossRef] [PubMed]
  14. Eppig, J.S.; Edmonds, E.C.; Campbell, L.; Sanderson-Cimino, M.; Delano-Wood, L.; Bondi, M.W.; for the Alzheimer’s Disease Neuroimaging Initiative. Statistically derived subtypes and associations with cerebrospinal fluid and genetic biomarkers in mild cognitive impairment: A latent profile analysis. J. Int. Neuropsychol. Soc. 2017, 23, 564–576. [Google Scholar] [CrossRef]
  15. Squitti, R.; Ventriglia, M.; Gennarelli, M.; Colabufo, N.A.; El Idrissi, I.G.; Bucossi, S.; Mariani, S.; Rongioletti, M.; Zanetti, O.; Congiu, C. Non-ceruloplasmin copper distincts subtypes in Alzheimer’s disease: A genetic study of ATP7B frequency. Mol. Neurobiol. 2017, 54, 671–681. [Google Scholar] [CrossRef]
  16. Mao, Y.-F.; Guo, Z.-Y.; Pu, J.-L.; Chen, Y.-X.; Zhang, B.-R. Association of CD33 and MS4A cluster variants with Alzheimer’s disease in East Asian populations. Neurosci. Lett. 2015, 609, 235–239. [Google Scholar] [CrossRef]
  17. Mann, U.M.; Mohr, E.; Gearing, M.; Chase, T.N. Heterogeneity in Alzheimer’s disease: Progression rate segregated by distinct neuropsychological and cerebral metabolic profiles. J. Neurol. Neurosurg. Psychiatry 1992, 55, 956–959. [Google Scholar] [CrossRef]
  18. Na, H.K.; Kang, D.R.; Kim, S.; Seo, S.W.; Heilman, K.M.; Noh, Y.; Na, D.L. Malignant progression in parietal-dominant atrophy subtype of Alzheimer’s disease occurs independent of onset age. Neurobiol. Aging 2016, 47, 149–156. [Google Scholar] [CrossRef]
  19. Park, J.Y.; Na, H.K.; Kim, S.; Kim, H.; Kim, H.J.; Seo, S.W.; Na, D.L.; Han, C.E.; Seong, J.K.; Alzheimer’s Disease Neuroimaging Initiative. Robust Identification of Alzheimer’s Disease subtypes based on cortical atrophy patterns. Sci. Rep. 2017, 7, 43270. [Google Scholar] [CrossRef]
  20. Persson, K.; Eldholm, R.S.; Barca, M.L.; Cavallin, L.; Ferreira, D.; Knapskog, A.B.; Selbaek, G.; Braekhus, A.; Saltvedt, I.; Westman, E.; et al. MRI-assessed atrophy subtypes in Alzheimer’s disease and the cognitive reserve hypothesis. PLoS ONE 2017, 12, e0186595. [Google Scholar] [CrossRef]
  21. Varol, E.; Sotiras, A.; Davatzikos, C. HYDRA: Revealing heterogeneity of imaging and genetic patterns through a multiple max-margin discriminative analysis framework. NeuroImage 2017, 145, 346–364. [Google Scholar] [CrossRef] [PubMed]
  22. Mukherjee, S.; Mez, J.; Trittschuh, E.H.; Saykin, A.J.; Gibbons, L.E.; Fardo, D.W.; Wessels, M.; Bauman, J.; Moore, M.; Choi, S.-E.; et al. Genetic data and cognitively defined late-onset Alzheimer’s disease subgroups. Mol. Psychiatry 2018, 25, 2942–2951. [Google Scholar] [CrossRef]
  23. Warren, J.D.; Fletcher, P.D.; Golden, H.L. The paradox of syndromic diversity in Alzheimer disease. Nat. Rev. Neurol. 2012, 8, 451–464. [Google Scholar] [CrossRef]
  24. Jack, C.R., Jr.; Bennett, D.A.; Blennow, K.; Carrillo, M.C.; Feldman, H.H.; Frisoni, G.B.; Hampel, H.; Jagust, W.J.; Johnson, K.A.; Knopman, D.S.; et al. A/T/N: An unbiased descriptive classification scheme for Alzheimer disease biomarkers. Neurology 2016, 87, 539–547. [Google Scholar] [CrossRef]
  25. Bondareff, W.; Mountjoy, C.Q.; Roth, M.; Rossor, M.N.; Iversen, L.L.; Reynolds, G.P. Age and histopathologic heterogeneity in Alzheimer’s disease: Evidence for subtypes. Arch. Gen. Psychiatry 1987, 44, 412–417. [Google Scholar] [CrossRef]
  26. Crane, P.K.; Trittschuh, E.; Mukherjee, S.; Saykin, A.J.; Sanders, R.E.; Larson, E.B.; McCurry, S.M.; McCormick, W.; Bowen, J.D.; Grabowski, T.; et al. Incidence of cognitively defined late-onset Alzheimer’s dementia subgroups from a prospective cohort study. Alzheimer’s Dement. 2017, 13, 1307–1316. [Google Scholar] [CrossRef]
  27. Cummings, J.L. Cognitive and behavioral heterogeneity in Alzheimer’s disease: Seeking the neurobiological basis. Neurobiol. Aging 2000, 21, 845–861. [Google Scholar] [CrossRef]
  28. Larner, A.; Doran, M. Clinical phenotypic heterogeneity of Alzheimer’s disease associated with mutations of the presenilin–1 gene. J. Neurol. 2006, 253, 139–158. [Google Scholar] [CrossRef]
  29. Pillon, B.; Dubois, B.; Lhermitte, F.; Agid, Y. Heterogeneity of cognitive impairment in progressive supranuclear palsy, Parkinson’s disease, and Alzheimer’s disease. Neurology 1986, 36, 1179. [Google Scholar] [CrossRef]
  30. Purcell, S.M.; Wray, N.R.; Stone, J.L.; Visscher, P.M.; O’Donovan, M.C.; Sullivan, P.F.; Sklar, P.; Purcell, S.M.; Stone, J.L.; Sullivan, P.F.; et al. Common polygenic variation contributes to risk of schizophrenia and bipolar disorder. Nature 2009, 460, 748–752. [Google Scholar] [CrossRef]
  31. Lewis, C.M.; Vassos, E. Polygenic risk scores: From research tools to clinical instruments. Genome Med. 2020, 12, 44. [Google Scholar] [CrossRef] [PubMed]
  32. Dittmar, K.A.; Goodenbour, J.M.; Pan, T. Tissue-specific differences in human transfer RNA expression. PLoS Genet. 2006, 2, e221. [Google Scholar] [CrossRef] [PubMed]
  33. Waldman, Y.Y.; Tuller, T.; Shlomi, T.; Sharan, R.; Ruppin, E. Translation efficiency in humans: Tissue specificity, global optimization and differences between developmental stages. Nucleic Acids Res. 2010, 38, 2964–2974. [Google Scholar] [CrossRef] [PubMed]
  34. Tuller, T.; Zur, H. Multiple roles of the coding sequence 5’ end in gene expression regulation. Nucleic Acids Res. 2015, 43, 13–28. [Google Scholar] [CrossRef]
  35. Verma, M.; Choi, J.; Cottrell, K.A.; Lavagnino, Z.; Thomas, E.N.; Pavlovic-Djuranovic, S.; Szczesny, P.; Piston, D.W.; Zaher, H.S.; Puglisi, J.D.; et al. A short translational ramp determines the efficiency of protein synthesis. Nat. Commun. 2019, 10, 5774. [Google Scholar] [CrossRef]
  36. Miller, J.B.; Brase, L.R.; Ridge, P.G. ExtRamp: A novel algorithm for extracting the ramp sequence based on the tRNA adaptation index or relative codon adaptiveness. Nucleic Acids Res. 2019, 47, 1123–1131. [Google Scholar] [CrossRef]
  37. Tuller, T.; Veksler-Lublinsky, I.; Gazit, N.; Kupiec, M.; Ruppin, E.; Ziv-Ukelson, M. Composite effects of gene determinants on the translation speed and density of ribosomes. Genome Biol. 2011, 12, R110. [Google Scholar] [CrossRef]
  38. Tuller, T.; Carmi, A.; Vestsigian, K.; Navon, S.; Dorfan, Y.; Zaborske, J.; Pan, T.; Dahan, O.; Furman, I.; Pilpel, Y. An Evolutionarily Conserved Mechanism for Controlling the Efficiency of Protein Translation. Cell 2010, 141, 344–354. [Google Scholar] [CrossRef]
  39. Dana, A.; Tuller, T. The effect of tRNA levels on decoding times of mRNA codons. Nucleic Acids Res. 2014, 42, 9171–9181. [Google Scholar] [CrossRef]
  40. Park, H.; Subramaniam, A.R. Inverted translational control of eukaryotic gene expression by ribosome collisions. PLoS Biol. 2019, 17, e3000396. [Google Scholar] [CrossRef]
  41. Joazeiro, C.A.P. Mechanisms and functions of ribosome-associated protein quality control. Nat. Rev. Mol. Cell Biol. 2019, 20, 368–383. [Google Scholar] [CrossRef] [PubMed]
  42. McKinnon, L.M.; Miller, J.B.; Whiting, M.F.; Kauwe, J.S.K.; Ridge, P.G. A comprehensive analysis of the phylogenetic signal in ramp sequences in 211 vertebrates. Sci. Rep. 2021, 11, 622. [Google Scholar] [CrossRef] [PubMed]
  43. Hodgman, M.W.; Miller, J.B.; Meurs, T.E.; Kauwe, J.S.K. CUBAP: An interactive web portal for analyzing codon usage biases across populations. Nucleic Acids Res. 2020, 48, 11030–11039. [Google Scholar] [CrossRef] [PubMed]
  44. Miller, J.B.; Meurs, T.E.; Hodgman, M.W.; Song, B.; Miller, K.N.; Ebbert, M.T.W.; Kauwe, J.S.K.; Ridge, P.G. The Ramp Atlas: Facilitating tissue and cell-specific ramp sequence analyses through an intuitive web interface. NAR Genom. Bioinform. 2022, 4, lqac039. [Google Scholar] [CrossRef]
  45. Wang, J.; Shiratori, I.; Uehori, J.; Ikawa, M.; Arase, H. Neutrophil infiltration during inflammation is regulated by PILRα via modulation of integrin activation. Nat. Immunol. 2013, 14, 34–40. [Google Scholar] [CrossRef]
  46. Uhlén, M.; Fagerberg, L.; Hallström, B.M.; Lindskog, C.; Oksvold, P.; Mardinoglu, A.; Sivertsson, Å.; Kampf, C.; Sjöstedt, E.; Asplund, A.; et al. Tissue-based map of the human proteome. Science 2015, 347, 1260419. [Google Scholar] [CrossRef]
  47. Pontén, F.; Jirström, K.; Uhlen, M. The Human Protein Atlas—A tool for pathology. J. Pathol. 2008, 216, 387–393. [Google Scholar] [CrossRef]
  48. Kohyama, M.; Matsuoka, S.; Shida, K.; Sugihara, F.; Aoshi, T.; Kishida, K.; Ishii, K.J.; Arase, H. Monocyte infiltration into obese and fibrilized tissues is regulated by PILRα. Eur. J. Immunol. 2016, 46, 1214–1223. [Google Scholar] [CrossRef]
  49. Selkoe, D.J.; Hardy, J. The amyloid hypothesis of Alzheimer’s disease at 25 years. EMBO Mol. Med. 2016, 8, 595–608. [Google Scholar] [CrossRef]
  50. Huang, K.-l.; Marcora, E.; Pimenova, A.A.; Di Narzo, A.F.; Kapoor, M.; Jin, S.C.; Harari, O.; Bertelsen, S.; Fairfax, B.P.; Czajkowski, J.; et al. A common haplotype lowers PU.1 expression in myeloid cells and delays onset of Alzheimer’s disease. Nat. Neurosci. 2017, 20, 1052–1061. [Google Scholar] [CrossRef]
  51. Li, Y.; Laws, S.M.; Miles, L.A.; Wiley, J.S.; Huang, X.; Masters, C.L.; Gu, B.J. Genomics of Alzheimer’s disease implicates the innate and adaptive immune systems. Cell Mol. Life Sci. 2021, 78, 7397–7426. [Google Scholar] [CrossRef] [PubMed]
  52. Patel, T.; Brookes, K.J.; Turton, J.; Chaudhury, S.; Guetta-Baranes, T.; Guerreiro, R.; Bras, J.; Hernandez, D.; Singleton, A.; Francis, P.T.; et al. Whole-exome sequencing of the BDR cohort: Evidence to support the role of the PILRA gene in Alzheimer’s disease. Neuropathol. Appl. Neurobiol. 2018, 44, 506–521. [Google Scholar] [CrossRef] [PubMed]
  53. Rathore, N.; Ramani, S.R.; Pantua, H.; Payandeh, J.; Bhangale, T.; Wuster, A.; Kapoor, M.; Sun, Y.; Kapadia, S.B.; Gonzalez, L.; et al. Paired Immunoglobulin-like Type 2 Receptor Alpha G78R variant alters ligand binding and confers protection to Alzheimer’s disease. PLoS Genet. 2018, 14, e1007427. [Google Scholar] [CrossRef] [PubMed]
  54. Jansen, I.E.; Savage, J.E.; Watanabe, K.; Bryois, J.; Williams, D.M.; Steinberg, S.; Sealock, J.; Karlsson, I.K.; Hägg, S.; Athanasiu, L.; et al. Genome-wide meta-analysis identifies new loci and functional pathways influencing Alzheimer’s disease risk. Nat. Genet. 2019, 51, 404–413. [Google Scholar] [CrossRef]
  55. Harrison, P.W.; Amode, M.R.; Austine-Orimoloye, O.; Azov, A.G.; Barba, M.; Barnes, I.; Becker, A.; Bennett, R.; Berry, A.; Bhai, J. Ensembl 2024. Nucleic Acids Res. 2024, 52, D891–D899. [Google Scholar] [CrossRef]
  56. Rentzsch, P.; Witten, D.; Cooper, G.M.; Shendure, J.; Kircher, M. CADD: Predicting the deleteriousness of variants throughout the human genome. Nucleic Acids Res. 2019, 47, D886–D894. [Google Scholar] [CrossRef]
  57. Davydov, E.V.; Goode, D.L.; Sirota, M.; Cooper, G.M.; Sidow, A.; Batzoglou, S. Identifying a high fraction of the human genome to be under selective constraint using GERP++. PLoS Comput. Biol. 2010, 6, e1001025. [Google Scholar] [CrossRef]
  58. Dong, S.; Zhao, N.; Spragins, E.; Kagda, M.S.; Li, M.; Assis, P.; Jolanki, O.; Luo, Y.; Cherry, J.M.; Boyle, A.P. Annotating and prioritizing human non-coding variants with RegulomeDB v. 2. Nat. Genet. 2023, 55, 724–726. [Google Scholar] [CrossRef]
  59. Consortium, G. The GTEx Consortium atlas of genetic regulatory effects across human tissues. Science 2020, 369, 1318–1330. [Google Scholar] [CrossRef]
  60. Noguchi, S.; Arakawa, T.; Fukuda, S.; Furuno, M.; Hasegawa, A.; Hori, F.; Ishikawa-Kato, S.; Kaida, K.; Kaiho, A.; Kanamori-Katayama, M. FANTOM5 CAGE profiles of human and mouse samples. Sci. Data 2017, 4, 1–10. [Google Scholar] [CrossRef]
  61. Ingolia, N.T.; Ghaemmaghami, S.; Newman, J.R.; Weissman, J.S. Genome-wide analysis in vivo of translation with nucleotide resolution using ribosome profiling. Science 2009, 324, 218–223. [Google Scholar] [CrossRef] [PubMed]
  62. Livak, K.J.; Schmittgen, T.D. Analysis of relative gene expression data using real-time quantitative PCR and the 2(-Delta Delta C(T)) Method. Methods 2001, 25, 402–408. [Google Scholar] [CrossRef] [PubMed]
  63. Clarke, L.; Zheng-Bradley, X.; Smith, R.; Kulesha, E.; Xiao, C.; Toneva, I.; Vaughan, B.; Preuss, D.; Leinonen, R.; Shumway, M.; et al. The 1000 Genomes Project: Data management and community access. Nat. Methods 2012, 9, 459–462. [Google Scholar] [CrossRef] [PubMed]
  64. Auer, P.L.; Reiner, A.P.; Wang, G.; Kang, H.M.; Abecasis, G.R.; Altshuler, D.; Bamshad, M.J.; Nickerson, D.A.; Tracy, R.P.; Rich, S.S.; et al. Guidelines for Large-Scale Sequence-Based Complex Trait Association Studies: Lessons Learned from the NHLBI Exome Sequencing Project. Am. J. Hum. Genet. 2016, 99, 791–801. [Google Scholar] [CrossRef]
  65. Chen, S.; Francioli, L.C.; Goodrich, J.K.; Collins, R.L.; Kanai, M.; Wang, Q.; Alföldi, J.; Watts, N.A.; Vittal, C.; Gauthier, L.D.; et al. A genomic mutational constraint map using variation in 76,156 human genomes. Nature 2024, 625, 92–100. [Google Scholar] [CrossRef] [PubMed] [PubMed Central]
  66. Miller, J.B.; McKinnon, L.M.; Whiting, M.F.; Kauwe, J.S.K.; Ridge, P.G. Codon Pairs are Phylogenetically Conserved: A comprehensive analysis of codon pairing conservation across the Tree of Life. PLoS ONE 2020, 15, e0232260. [Google Scholar] [CrossRef]
  67. Miller, J.B.; McKinnon, L.M.; Whiting, M.F.; Ridge, P.G. Codon use and aversion is largely phylogenetically conserved across the tree of life. Mol. Phylogenet. Evol. 2020, 144, 106697. [Google Scholar] [CrossRef]
  68. Miller, J.B.; McKinnon, L.M.; Whiting, M.F.; Ridge, P.G. CAM: An alignment-free method to recover phylogenies using codon aversion motifs. PeerJ 2019, 7, e6984. [Google Scholar] [CrossRef]
  69. Miller, J.B.; Hippen, A.A.; Belyeu, J.R.; Whiting, M.F.; Ridge, P.G. Missing something? Codon aversion as a new character system in phylogenetics. Cladistics 2017, 33, 545–556. [Google Scholar] [CrossRef]
  70. Yamaguchi, K.; Ishigaki, K.; Suzuki, A.; Tsuchida, Y.; Tsuchiya, H.; Sumitomo, S.; Nagafuchi, Y.; Miya, F.; Tsunoda, T.; Shoda, H.; et al. Splicing QTL analysis focusing on coding sequences reveals mechanisms for disease susceptibility loci. Nat. Commun. 2022, 13, 4659. [Google Scholar] [CrossRef]
  71. Kudla, G.; Lipinski, L.; Caffin, F.; Helwak, A.; Zylicz, M. High guanine and cytosine content increases mRNA levels in mammalian cells. PLoS Biol. 2006, 4, e180. [Google Scholar] [CrossRef] [PubMed]
  72. Rodriguez, A.; Wright, G.; Emrich, S.; Clark, P.L. %MinMax: A versatile tool for calculating and comparing synonymous codon usage and its impact on protein folding. Protein Sci. 2018, 27, 356–362. [Google Scholar] [CrossRef] [PubMed]
  73. Cannarozzi, G.; Schraudolph, N.N.; Faty, M.; von Rohr, P.; Friberg, M.T.; Roth, A.C.; Gonnet, P.; Gonnet, G.; Barral, Y. A role for codon order in translation dynamics. Cell 2010, 141, 355–367. [Google Scholar] [CrossRef] [PubMed]
  74. Brandman, O.; Hegde, R.S. Ribosome-associated protein quality control. Nat. Struct. Mol. Biol. 2016, 23, 7–15. [Google Scholar] [CrossRef]
  75. Zhou, Z.; Sun, B.; Yu, D.; Bian, M. Roles of tRNA metabolism in aging and lifespan. Cell Death Dis. 2021, 12, 548. [Google Scholar] [CrossRef]
Figure 1. Relative codon adaptiveness for PILRA in caudate neuronal cells. Figure 1 shows the relative codon adaptiveness of the longest PILRA reference isoform and the mutant gene averaged over a nine-codon window in caudate neuronal cells. The mutant gene (rs2405442:T>C) has a higher codon adaptiveness at the beginning of the gene sequence compared to the wildtype gene.
Biomedicines 13 00739 g001
Figure 2. rs2405442:T>C’s effects on mRNA and protein levels in CHO cells harboring the synonymous variant compared to wildtype cells without the variant. Three independent sets of eight technical replicates were used to assess differences between the wildtype and the mutant using both qPCR and ELISA. (A) shows that PILRA mRNA levels are significantly lower in the mutant than the wildtype (p = 1.9184 × 10⁻¹³). Since high Ct values show lower expression, we converted the raw Ct values to the relative expression by using the formula 2−Ct, where Ct is the normalized expression of CPILRA−CGAPDH. While it is unclear why the wildtype exhibited larger variance than the mutant, all qPCR measurements from the mutant were lower than all measurements from the wildtype, indicating that the mutant decreased mRNA levels compared to the wildtype. Two outliers with higher expression from the wildtype were removed, but did not affect the conclusions; (B) shows that PILRA protein levels are also significantly lower in the mutant than the wildtype (p = 0.01296).
Biomedicines 13 00739 g002
Table 1. Credible Causal Exonic Variant Effects. Credible causality is defined and reported by Jansen, Savage [54]. “Loss of Ramp” indicates that the ramp sequence was destroyed in at least one transcript, while “Ramp Size” indicates that the length of the ramp sequence changed in at least one transcript. “Gene with Ramp” indicates that the SNP was located outside the ramp region, yet the gene has a ramp sequence in at least one transcript in at least one cell or tissue.
SNPChromosome/PositionNearest GeneTranscripts with Ramp SequenceMost Severe Variant EffectHighest MAFCADD ScoreGERP ScoreRegulomeDB ScoreMost Severe Ramp Effect
rs2405442:T>C7:100373690PILRA4/4 (100%)Synonymous0.50 (T)4.238−2.241fLoss of Ramp
rs12453:T>C11:60178272MS4A6A8/14 (57%)Synonymous0.50 (C)0.578−4.071fRamp Size
rs1859788:A>G7:100374211PILRA4/4 (100%)Missense0.50 (A)12.851.011fRamp Size
rs12459419:C>T19:51225221CD332/6 (33%)Missense0.48 (T)14.750.061fRamp Size
rs7982:A>G8:27604964CLU1/2 (50%)Missense0.49 (A)0.920−3.071fGene with Ramp
rs2296160:A>G1:207621975CR15/5 (100%)Missense0.35 (A)0.001−3.647Gene with Ramp
rs3752241:C>G19:1053525ABCA70/18 (0%)Synonymous0.29 (G)3.833−4.461fN/A
rs117618017:C>T15:63277703APH1B0/3 (0%)Missense0.31 (T)16.39−1.841fN/A
rs429358:T>C19:44908684APOE0/5 (0%)Missense0.38 (C)16.652.011fN/A
rs9268480:C>T6:32396067BTNL20/2 (0%)Synonymous0.35 (T)3.813−1.071fN/A
rs1135173:G>A2:233146227INPP5D0/2 (0%)Synonymous0.49 (A)4.311−3.251fN/A
rs157581:T>C19:44892457TOMM400/4 (0%)Missense0.50 (C)14.60−1.141fN/A
rs11556505:C>T19:44892887TOMM400/4 (0%)Missense0.18 (T)6.035−6.995N/A
rs75932628:C>T6:41161514TREM20/2 (0%)Missense0.02 (T)26.1NA2bN/A
Table 2. Tissues and cell types that normally have a ramp sequence in PILRA. The ramp sequence is universally destroyed in the mutant containing rs2405442:T>C.
Tissues with PILRA Ramp SequenceCell Types with PILRA Ramp Sequence
AmygdalaAppendix lymphoid tissue
Cerebral cortexCaudate glial
ColonCaudate neuronal
Corpus callosumCerebellum Purkinje
Ductus deferensCervix uterine glandular
DuodenumDendritic cells
EsophagusHippocampus glial
Fallopian tubeLung pneumocytes
GallbladderLymph node nongerminal center
Heart muscleMonocytes
Hippocampal formationOral mucosa squamous epithelial
HypothalamusPancreas islets of Langerhans
Olfactory regionProstate glandular
PancreasSeminal vesicle glandular
RetinaSkin1 fibroblasts
Salivary glandSkin keratinocytes
Seminal vesicleSkin melanocytes
Skeletal muscleSoft tissue1 fibroblasts
SkinSpleen cells in red pulp
Small intestineSpleen cells in white pulp
SpleenThyroid gland glandular
StomachTonsil nongerminal center
TongueTotal PBMC
Disclaimer/Publisher’s Note: The statements, opinions and data contained in all publications are solely those of the individual author(s) and contributor(s) and not of MDPI and/or the editor(s). MDPI and/or the editor(s) disclaim responsibility for any injury to people or property resulting from any ideas, methods, instructions or products referred to in the content.

