Article

Gene Expression Changes as Biomarkers of Immunosenescence in Bulgarian Individuals of Active Age

1
Department of Medical Genetics, Medical Faculty, Medical University, 1431 Sofia, Bulgaria
2
National Reference Laboratory of Immunology, National Center for Infectious and Parasitic Diseases, 1504 Sofia, Bulgaria
3
Department of Clinical Laboratory, Acibadem City Clinic Tokuda Hospital, 1407 Sofia, Bulgaria
*
Author to whom correspondence should be addressed.
Biomedicines 2025, 13(3), 721; https://doi.org/10.3390/biomedicines13030721
Submission received: 10 February 2025 / Revised: 6 March 2025 / Accepted: 11 March 2025 / Published: 15 March 2025
(This article belongs to the Special Issue Inflammaging and Immunosenescence: Mechanisms and Link)

Abstract

:
Background/Objectives: Immunosenescence implies innate and adaptive immunity dysfunction, which naturally occurs with aging. It is a complex multifactorial process which can be triggered by either genetic changes, immune changes or both. Numerous research studies have shown that the process of senescence goes alongside chronic immune activation. The purpose of this study is to analyze the changes in the expression of genes associated with adaptive and innate immune responses in order to identify reliable biomarkers for immune aging. Methods: For that aim, 55 clinically healthy individuals of active age (21–65 years) were distributed based on immunophenotyping in two groups, with and without signs of premature senescence. A gene expression analysis was subsequently made on those two groups, and the differentially expressed genes were presented and interpreted. Results: Altogether, forty-eight (48) genes exhibited differential expression between the two groups, most of which showed up-regulation (45) (fold change more than 2), and only three were down-regulated (fold change less than −2). The highest positive fold change showed IL-1β (10.76), BCL6 (13.25) and CCL4 (15.91), while the highest negative fold changes were documented for IL23R (−3.10), IL5 (−2.66) and PTGS2 (COX-2) (−2.15). Conclusions: Our results reveal that immunosenescence is positively associated with chronic inflammation, which is typical for the aging process. On the other hand, we identified markers of possible protective effects against oxidative stress and tumorigenesis. These findings can aid the early diagnosis of chronic degenerative diseases in subclinical phase, as well as the development of strategies to prevent the processes of premature immune aging.

1. Introduction

The steady increase in life expectancy throughout the world leads to the necessity to ensure good health and quality of life of the elderly population. In the EU, the share of the population over 65 is estimated to be 21.3%. Bulgaria has shown a constant demographic decline in the last 30 years, and by the end of 2023, the number of elderly people over 65 years was nearly 24% of the country’s population. The country has one of the highest mortality rates in Europe, partially due to the demographic aging. The cited mortality is attributable mainly to diseases of the blood circulation, neoplasms (cancer) and diseases of the respiratory system [1]. In line with these trends, the WHO has adopted a detailed Global Strategy and Action Plan on Aging and Human Health [2]. Five priority areas have been defined with an emphasis on “successful aging”, “improvement of approaches to assess, monitor and explain aging mechanisms”. In this aspect, the definition of reliable biomarkers characterizing “premature” immunological aging is a necessary basis to assess population immunological health and undertake further interventions to delay and prevent degenerative diseases associated with advanced age.
Immunosenescence is a process of innate and adaptive immunity dysfunction which naturally occurs with aging. It is a predecessor of poor vaccination efficacy, age-related diseases and neoplasms [3], susceptibility to infectious diseases and autoimmunity [4]. Chronic inflammation, referred to as “inflammaging”, and senescent T cell pool, including the reduced proportion of naïve and early memory T cells at the expense of terminally differentiated effectors with a CD28-CD57+ phenotype, are hallmarks of immunosenescence [3]. Immunosenescence is closely related to oxidative stress, described in 1961 as a condition in which the normal diploid cells “cease to proliferate after a limited number of divisions” [5]. The theory of oxidative stress explained senescence as the natural result of free radicals’ accumulation which compromises cellular functions. Later on, the idea was broadened by the concept of mitochondrial damage as the most plausible way to explain aging for the mitochondria being the organelles most vulnerable to oxidative stress [6]. Several mitochondrial miRNAs (mitomiRs) modulating organelles’ activity are involved in human inflammaging [7]. They regulate the expression of some key proteins (Bcl-2, OxPhos proteins of the electron-transport chains) thus affecting directly the production of ATP, free radicals and inflammaging.
Noteworthy, inflammaging reveals some obvious sex-related differences [8]. Women tend to live longer but experience an unhealthier lifestyle. Gender-related differences in life expectancy, disease progression and response to treatments could be explained by hormonal and genetic differences [9]. Sex differences in immune response directly affect their predisposition to age-related diseases. This results in higher vaccine efficacy and stronger innate and adaptive immune responses in women compared to men. Those differences are not only hormonal (oestrogens, progesterons and androgens), but also genetic. A very good example is TLR7, encoded by the X chromosome resulting in higher expression levels in females. On the other hand, men exhibit higher levels of natural killer cells [10]. The human X chromosome has a higher density of miRNAs when compared to autosomes; in contrast, the Y chromosome bears only 4 miRNA sequences [11].
It is important to understand that immunosenescence is a complicated process and all described possible reasons for it are interconnected. It is hypothesized that the diversity of genes might influence successful aging and longevity by modulating an individual’s response to life-threatening disorders [4]. The individual differences observed in adaptive immunity and the associated cytokine profiles logically raise the question about the extent of their genetic dependence. Genetic markers connected with senescence have been studied broadly by both international and Bulgarian research teams [12,13]. A transcriptomic study in mice revealed tissue-specific signatures of macrophage inflammaging associated with the differential expression of genes responsible for cytokines’ production, cell adhesion and antigen presentation [14].
Senescent cells can occur at any stage of an individual’s life, but definite markers of these cells are yet to be clarified. Aging is a complex process determined by multiple genetic and environmental factors, the latter of which are associated with a contemporary lifestyle, including chronic infectious and non-infectious diseases, excessive medication, unhealthy diet, environmental deterioration and stress, all leading to premature immune aging. Still, data on the altered production of some key cytokines and the role of specific genetic markers are incomplete. Moreover, there are no data on premature immune aging in healthy individuals of active age, and the genetic and epigenetic factors which determine this process. We analyzed the differential expression of immune-associated genes in people of active age in association with phenotypic signs of immunological senescence, with the aim to identify reliable biomarkers characterizing the process of premature aging. Our results will help the development of age-specific strategies for prevention and treatment, including age-adapted vaccine preparations and protocols, new antibiotics, targeted agents and anti-inflammatory foods.

2. Materials and Methods

2.1. Study Groups

This study included 55 healthy subjects (23 males and 32 females), after providing written informed consent. This study was approved by the Ethical Committee of the National Centre of Infectious and Parasitic Diseases, Sofia, Bulgaria (Institutional Review Board/Institutional Ethics Committee (IRB/IEC) number: IRB 00006384), protocol No 5/2020. All the participants were in the age range of active adults: 21–65 years (min–max), mean: 39.44 years, and reported a current professional activity. They were clinically healthy without a history of chronic diseases, hospitalization in the last 2 months, or usage of immunostimulatory or immunosuppressive drugs; they were without obesity (body mass index (BMI) < 30), with no deviations from the normal ranges for the WBC or biochemistry tests, no HIV, HSV, EBV or active CMV infection and no record of autoimmune disease, addictions or other dependencies.

2.2. Immunophenotyping

The share and absolute counts (AC) of lymphocytes (CD45+), T cells (CD3+), helper T cells (CD4+), cytotoxic T cells (CD8+), B-cells (CD19+) and NK cells (CD16+CD56+) were determinеd by BD Multitest 6-Color TBNK with BD Trucount Tubes (BD Bioscience, cat.# 337166). The proportion of regulatory T cells (CD4+CD25highCD127-, Treg), CD8+ CD57+ CD27-, CD4 and CD8 naïve (CD45RA+CCR7+), central memory (CD45RA-CCR7+), effector-memory (CD45RA-CCR7+), terminal effector (CD45RA+CCR7-) cells, as well as the expression of CD38 on CD4+ and CD8+ T cells, were determined by standard multicolor flow cytometry on a FACS Canto II flow cytometer using FACS Diva v. 6.1.3 (BD Biosciences, San Jose, CA, USA).
The following directly conjugated monoclonal antibodies were used in the multi-color flow cytometry panel: anti-hCD3 AmCyan (cat# 339186), anti-h CD4 (PE cat# 565999), anti-h CD4 APC (cat# 345771) anti-h CD25 (APC-Cy7 cat# 557753) anti-hCD45RA (FITC cat# 347723), anti-h CCR7 (PE-Cy cat# 557648), anti-h CD38 (PE cat# 345806); anti-h CD8APC (cat# 340659), anti-h CD27 (APC-H7 cat# 560222); anti-h CD127 (PcpCy5.5 cat# 560551) (BD Biosciences) anti-h CD8 (Pacific blue, cat# BL359871, Sysmex, Kobe, Japan) and anti-h CD57 (FITC cat#B49188, BeckmanCoulter, Brea, CA, USA). T lymphocyte activation was evaluated according to the number of CD38 molecules on CD4+ and CD8+ T cells. The quantitation of CD38 expression was performed using the Quantibrit PE CD38 calibration flow cytometry kit (BD Bioscience) according to the manufacturer’s instructions.
Gating strategy: lymphocytes were defined on a CD45 vs. SSC plot; the proportions of basic lymphocyte subsets (T, B, NK) were determined after plotting CD3 vs.CD19, CD3 vs. CD56+CD16, CD3 vs. CD4 and CD3 vs. CD8 expression, respectively. Naïve (CD45RA+ CCR7+), effector memory (EM, CD45RA-CCR7-), central-memory (CD45RA-CCR7+) and terminal effector (TE, CD45RA+ CCR7-) subsets were defined according to CD45RA vs. CCR7 expression within the gates of CD4+ and CD8+T cells. Treg were defined as CD25highCD127- cells within CD4+CD3+- gated lymphocytes. Senescent T cells were defined as CD3+CD8+- gated lymphocytes with CD57+CD27- phenotype.

2.3. Statistical Analysis

Between-group comparisons of quantitative values were performed by Student’s t-test for independent samples (for data with normal distribution), or Mann–Whitney test (for data without normal distribution). Data are presented as means (±standard deviation, SD) or medians (min, max), respectively. Categorical values (gender distribution) were compared by the chi-square test. Analyses were performed with GraphPad Prism v.9.

2.4. Isolation of RNA from PBMC of Each Sample, Quality Check and Preparation of cDNA

PBMC were isolated from whole blood by density-gradient media Ficoll-Paque®. RNA from isolated PBMC was extracted using the RNeasy Mini Kit (Cat. No./ID: 74104, Qiagen, Valencia, CA, USA) according to the manufacturer’s instructions (at sterile conditions and at 4 °C to prevent RNA degradation). Buffer RLT was supplemented with β-mercaptoethanol. Тhe RNA yield and quality were determined using a NanoDrop® 8000 Spectrophotometer. After the elimination of the residual genomic DNA by DNAse I, pooled RNA samples were created using aliquot RNA amounts. The pooled samples were transcribed into corresponding cDNAs by RT-PCR using 250 ng of the purified RNA and the RT2 First Strand Kit (Qiagen, CA, USA).

2.5. Pathway-Focused Gene Expression Analysis

In the next step, cDNAs were mixed with RT2 SYBR Green ROX qPCR Mastermix (Cat. No. 330529, Qiagen), and the mixtures were aliquoted into the wells of an RT2 Profiler PCR Array Human Innate & Adaptive Immune Responses (Cat. No. PAHS-077Z, QIAGEN). RT² Profiler PCR Arrays are highly reliable and sensitive gene expression profiling tools for analyzing focused panels of genes in signal transduction, biological processes or disease research pathways using real-time PCR. RT² Profiler PCR Array system examined the expression of 84 genes simultaneously in one plaque. The arrays are pre-optimized, which ensures better results; the procedure is quick and easy to perform using a standard quantitative real-time PCR tool.
RT2 Profiler PCR Array Human Innate & Adaptive Immune Responses includes genes for proteins participating in innate immunity: pattern recognition receptors (TLRs, NOD1, NOD2, NLRP3, etc.), cytokines (CCL2, CCL5, CSF2, CXCL10, IFNA1, IFNB1, IL18, IL1A, IL1B, IL2, CXCL8 and TNF), other innate immunity genes (CASP1, MAPK8, MYD88, NFKB1, STAT1, etc.); genes of the adaptive immunity: Th1 markers (CCR5, CD80, CXCR3, IL18 and IL23A), Th2 markers (CCR4, CCR8, CD87, GATA3, IFNB1, IL10, IL13, etc.), Treg markers (FOXP3, IL10, etc.), cytokines (CCL2, CCL5, CXCL10, IFNA1, etc.); genes for proteins participating in the inflammatory response (APCS, C3, CCL5, CRP, IL1A and TNF) and genes for defense against viruses and bacteria (CXCL10, MYD88, IFNB1, IFNG and IFNR1). Each array contains a panel of proprietary controls to monitor genomic DNA contamination (GDC) as well as the first strand synthesis (RTC) and real-time PCR efficiency (PPC). Reagents labeled with Sybr Green dye compatible with RT-PCR instrument are also included. The list of genes included in the RT2 Profiler PCR Array Human Innate & Adaptive Immune Responses, as well as their position on the PCR plate, are given in Table 1.

2.6. Аnalysis of the Results

After the PCR, all the built-in controls (RTC, PPC and GDC) on the array passed the validity criteria. The arithmetic means of the data from the assays for the housekeeping/reference genes listed in the table (ACTB, B2M, GAPGH, HPRT1 and RPLP0) were used to normalize the raw data. The relative expression was determined using the data from the real-time cycler and the ΔΔCt method which is recommended in such types of analyses [15]. It is based on the determination of ΔCt of each individual gene compared to the expression of a house-keeping gene. When comparing two groups of individuals, the ΔΔCt value for each gene is calculated, which practically shows the degree of the gene expression change. The differential expression of each gene is represented by a fold change or a fold regulation. The up-regulated genes have a fold change greater than one, while the down-regulated—less than one. The analysis was performed by RT2 Profiler Data Analysis Software (http://www.qiagen.com/geneglobe, Qiagen, Valencia, CA, USA), and the fold regulation threshold was set to 2. Generally, fold regulation values greater than 2 have genes which we consider to be up-regulated in the test group vs. the control group, while fold regulation values less than −2 represent the genes down-regulated in the test group of individuals.

3. Results

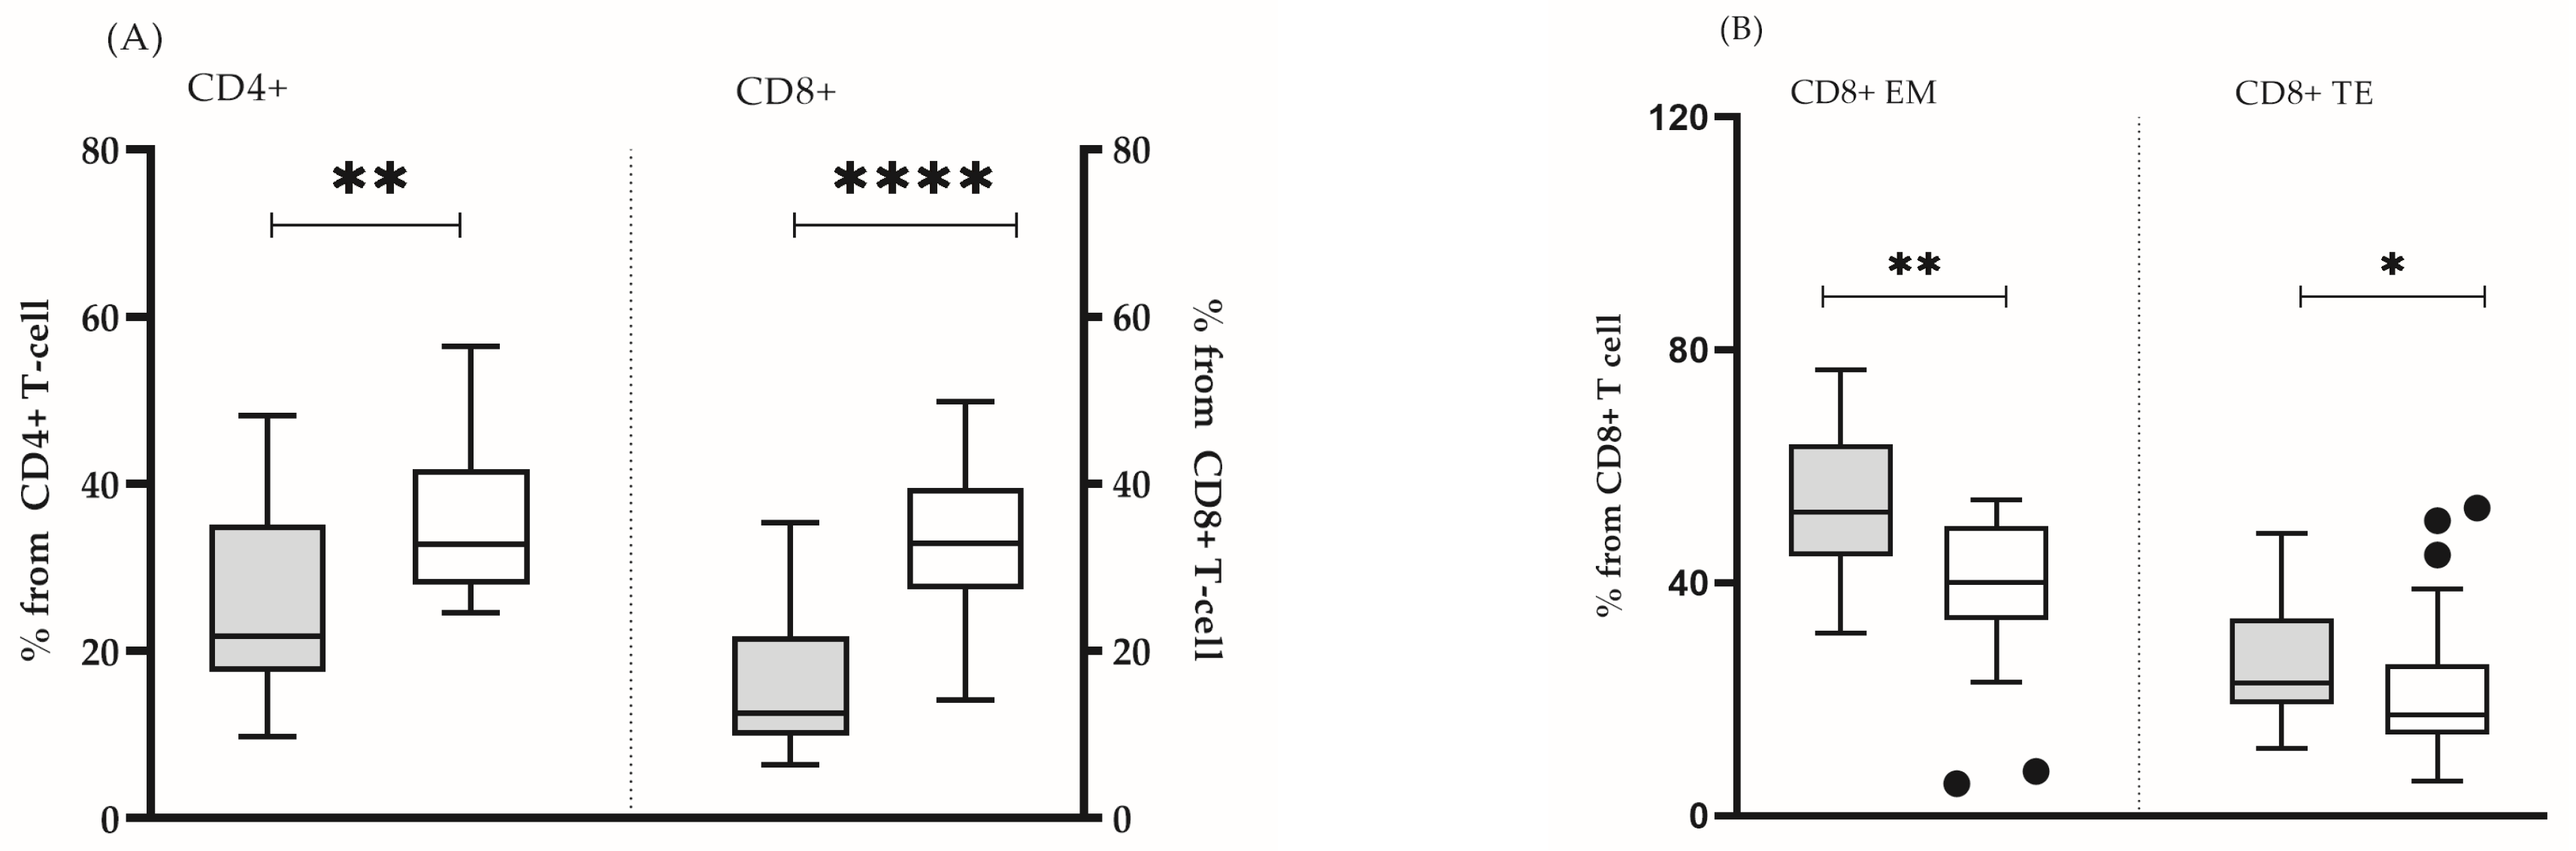
3.1. Definition of Individuals with Senescent Immunophenotype (“Test” Group)

In all the analyzed subjects, both the percentage and the absolute count of the main lymphocyte populations (T lymphocytes, B cells and NK cells) were within the reference range [16]. It was found that some clinically healthy individuals showed a significantly lower number of lymphocytes (mean ± SD 1912 ± 562 vs. 2227 ± 518, p = 0.05) (Figure 1A), CD4 T cells (mean ± SD 851 ± 213 vs. 1005 ± 258, p = 0.05) (Figure 1B), as well as naïve CD4 + (median (min–max): 21.8 (9.8–48.0) vs. 32.7 (24.6–56.0), p = 0.005) and CD8+ (median (min–max): 12.6 (6.4–35.3) vs. 32.9 (12.0–49.8), p = 0.0001) lymphocytes (Figure 2A). In this group, the lower proportion of naive CD8+ T- cells reflected a significantly higher proportion of effector memory (median (min-max): 52.1 (31.4–76.7) vs. 40.1 (5.5–54.2) p = 0.002) and terminally differentiated (median (min-max): 22.8 (11.6–48.5) vs. 17.4 (6.0–52.9) p = 0.047) CD8+ T cells (Figure 2B). In addition, we detected a higher proportion of CD57+CD8+ lymphocytes, yet, without statistical significance (median (min–max): 7.6 (1.9–48.2) vs. 8.1 (0.2–20.1), p = 0.206). Based on the obtained immunological results, and previously published phenotypic features of immunosenescent T cells [3], we characterized that group of individuals as “immunosenescent” (“test group”) (Table 2).

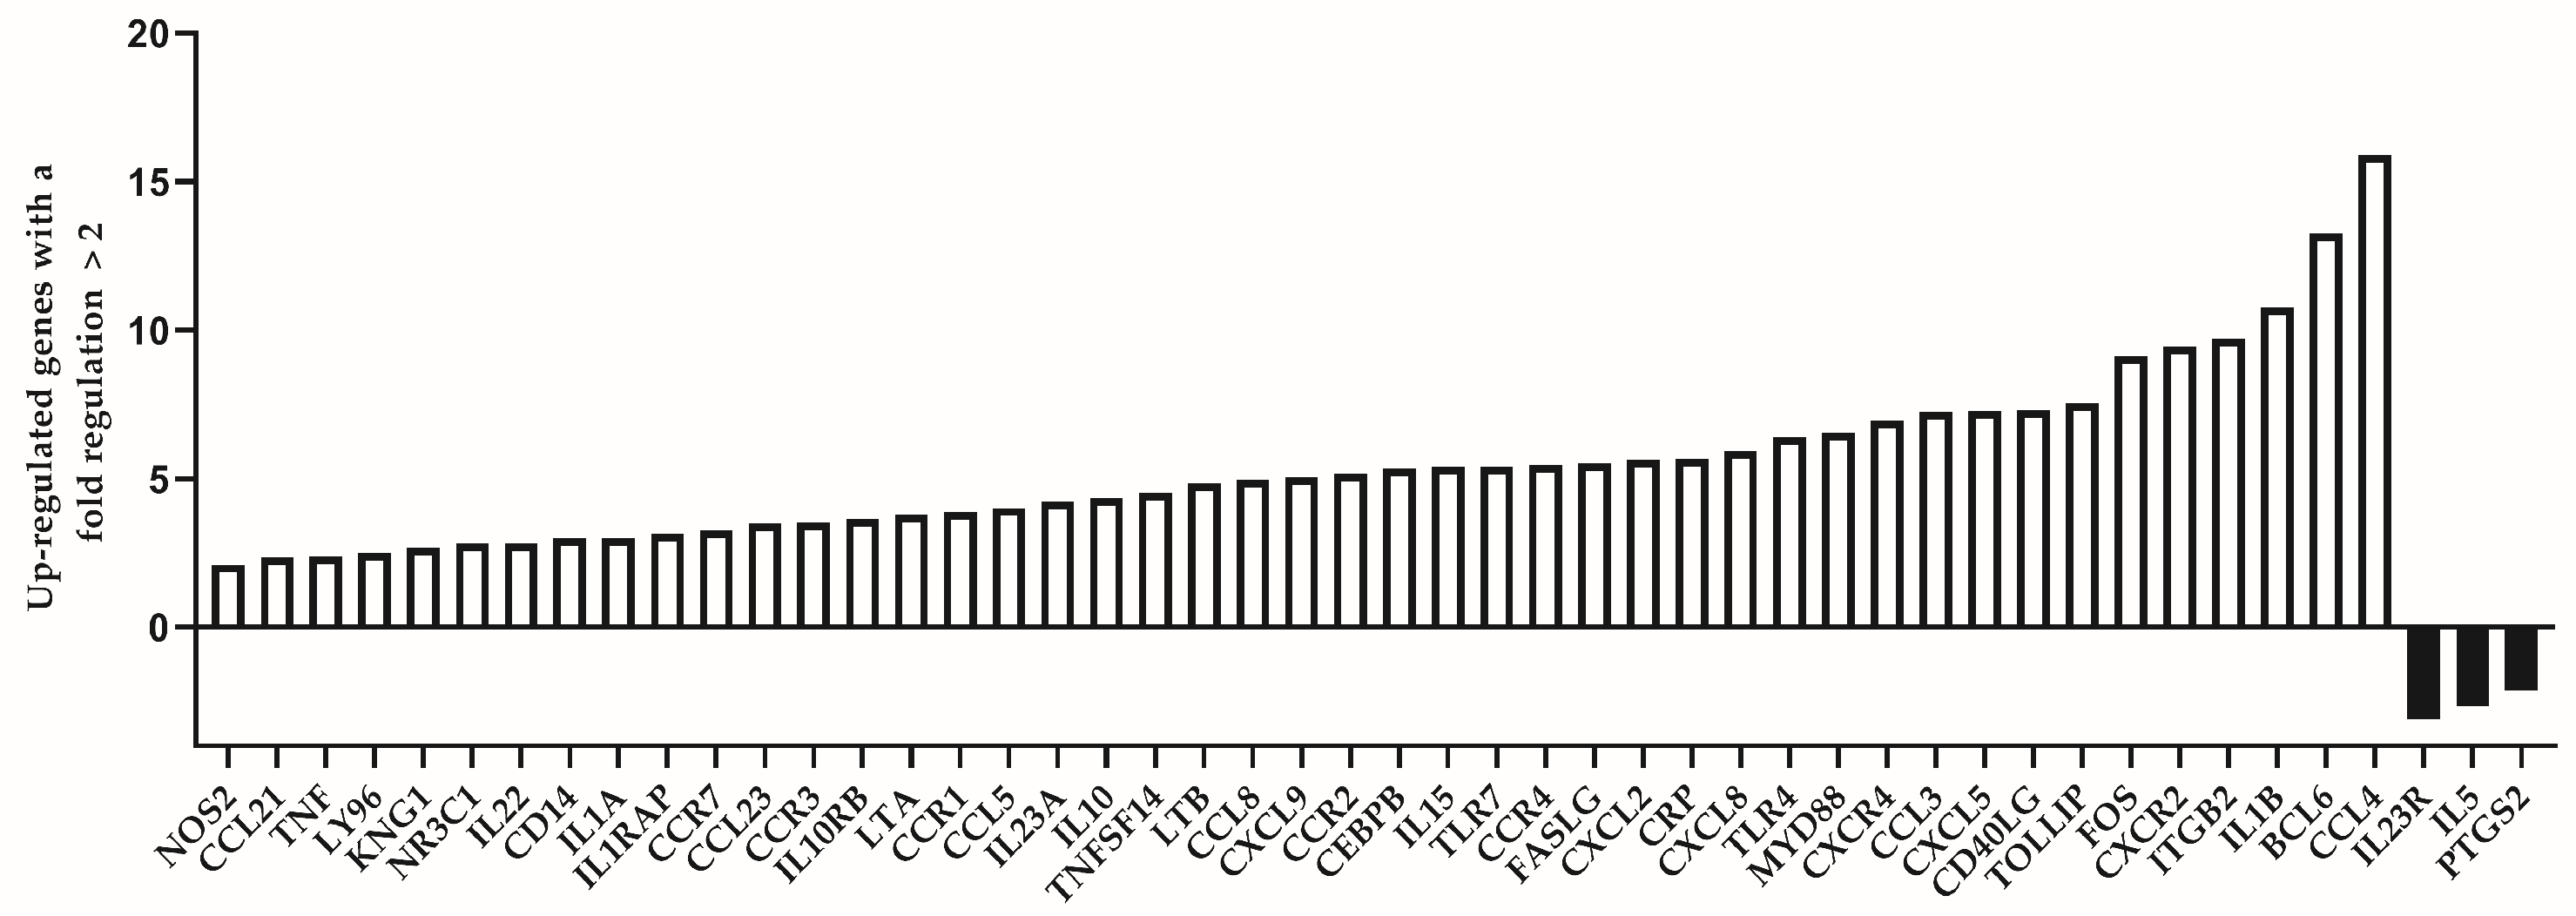
3.2. Gene Expression Analysis

We analyzed the expression level of 84 immune response-related genes in two pooled samples of both groups (39 individuals of the “control” group and 16 individuals of the “test” group, respectively). Among the group of individuals which are considered to be immunologically exhausted, we identified altogether 45 up-regulated genes. Of them, those with a fold regulation higher than 5 were 23. The genes with highest up-regulation values (more than 10) were IL1B (10.76), BCL6 (13.25) and CCL4 (15.91). Down-regulated genes were less in number—only three genes showed substantially decreased expression among test individuals (IL23R, IL5 and PTGS2). The list of up- and down-regulated genes is presented in Table 3.
The differentially expressed genes between the two analyzed groups are represented visually in Figure 3. The number of the up-regulated genes is substantially higher compared to the down-regulated ones (45:3).
The scatter plot graph compares the normalized expression of every gene on the PCR array between the two selected groups by plotting them against one another to visualize gene expression changes (Figure 4).

4. Discussion

Immunosenescence is а progressive decline in immune functions associated with increased susceptibility to age-related diseases and infections and low response to vaccines, that does not necessarily coincide with biological aging. The theories proposing different mechanisms of aging (DNA damage, mitochondrial dysfunction, thymic involution, impaired stress response etc.) finally converge to the establishment of low-grade chronic inflammation and immune activation known as “inflammaging” [17]. The neuroendocrine hypothesis defines aging as a neuronal loss of control over thypothalamic–pituitary–adrenal axis, inevitably affecting the immune cells through their hormonal receptors [18]. Triggering factors like chronic stress or recurrent viral infections (e.g., CMV infection) could accelerate aging and induce signs of premature immunosenescence in clinically healthy younger adults. The latter is characterized by a decrease in naïve at the expense of memory T cells, reduced repertoire of T- and B-cell antigen specific receptors and increased levels of proinflammatory cytokines. The immunosenescent T cells express certain phenotypic markers as CD57 combined with the loss of CD28 and CD27, and a low proliferative activity [19]. In our study, we accepted that changes at the gene expression level are an earlier and more sensitive indicator for this condition. Therefore, we studied the expression patterns of 84 immune response-related genes in healthy adults of active age showing phenotypic signs of premature immune aging.
We found substantially increased expression of three genes associated with the state of immunosenescence: CCL4, BCL6 and IL1B. Elevated chemokines levels commonly occur with aging but the mechanism underlying this age-associated change is not fully understood. It is probably connected with the increased systemic inflammation in the body and the appearance of chronic illnesses, when chemokines direct the lymphocyte migration from the bloodstream to lymphoid organs or to sites of inflammation [20]. Previously known as macrophage inflammatory protein (MIP-1β), CCL4 is released in response to inflammation by activated leucocytes, lymphocytes, endothelial and muscle cells. Several studies on ovarian and prostate cancer show that CCL4 creates instability in the tumor microenvironment and, probably, facilitates carcinogenesis by stimulating angiogenesis and tumor progression [21]. Wang et al. showed that CCL5 (CCL5 fold regulation 4.00 in our study) is connected with CCL4 in the process of metastasis of breast cancer cells [22]. Induced by a series of other cytokines as IL1A (IL1A fold regulation = 2.99), IL1B (IL1B fold regulation = 10.76), IL7, TNF (TNF fold regulation = 2.39), LPS or viral infections, CCL5 behaves like a proinflammatory cytokine. Monocytes and naïve CD8 T cells expressed higher levels of CCL4 and exhibited an age-related increase in this factor. CCL4 also could contribute to the age-related endothelial dysfunction provoked by oxidative stress and exhausted enzymatic systems of DNA repair, as well as endothelial inflammation.
Besides CCL4, other chemokines’ genes exhibiting higher expression levels in the prematurely aged were CCL21, CCL23, CCL5, CCL8 and CCL3 (Table 2). Recent data show their relation to chronic illnesses or injuries. Chen et al. describes CCL21 as a potential biomarker of cognitive impairment in spinal cord injury [23]. Its serum concentration is negatively correlated with the cognitive function and could be considered as an independent risk factor for cognitive impairment. Similarly to CCL21, CCL23 was associated with progression from mild cognitive impairment (MCI) to Alzheimer’s disease (AD) [24]. CCL5 (RANTES) is also a proinflammatory chemokine, mainly produced by T cells and monocytes. The CCL5/CCR5 combination has been related to specific processes in the pathogenesis of malignancies, such as angiogenesis, invasion and metastasis [25]. An interesting fact is that CCL2 (MCP-1), CCL7 (MCP-3), CCL8 and CCL13 are all known as CCR2 ligands (in our data, CCR2 fold change = 5.16). Together with CCR2, they have been detected in MS lesions [26]. A direct blocking effect of the axis CCL8-CCR8 has been demonstrated by Dangi A. et al. [27]. During allograft transplantation, donor kidney resident macrophages express a high level of CCL8, which, in turn, promotes recipient monocyte graft infiltration and the subsequent expression of CCL8. Blocking CCL8-CCR8 ensures a better short-term allograft functioning [27]. CCL3, also known as macrophage inflammatory protein 1α (MIP-1α), induces inflammatory cytokines to specific sites by binding to the CCR1/3/9 receptors [28]. Aging is related to memory deficits and CNS inflammation. CCL3 was recently shown to participate in both processes, and contribute to secondary damage after spinal cord injury [29]. It also accumulates in the bone marrow of aged mice and causes bone marrow adiposity [30].
BCL6 is an important factor in the formation of high affinity antibodies and for the functioning of B- and regulatory T cells. Germinative centers (GC) are extremely important in long-term antibody-mediated immunity. According to Fisher et al., aging was associated with accumulated Т follicular helper cells (Tfh) with a reduced expression of the transcription factor BCL6. When activated by aged antigen-presenting cells (APC), young CD4+ naïve T cells generate reduced numbers of activated cells with up-regulated CD40L, while Tfh cells in aging mice fail to up-regulate BCL6 expression after immunization [31]. In our data, both BCL6 and CD40L were highly up-regulated in prematurely aged adults (fold change of BCL6 = 13.25, and of CD40L = 7.31). This result is intriguing as it points to a key difference in the gene expression between aged individuals and individuals of immunosenescence in active age, the latter being able to stimulate the over-expression of BCL6 and CD40L. Chen Z. et al. defined BCL6 and VEGFA as “senescence regulators” [32]. Osteoarthritis (OA) progresses with age and is associated with a higher number of senescent cells in joint tissues. Cartilage cells in OA exhibit the up-regulation of both BCL6 and VEGFA, and, therefore, both genes “may be used as predictive biomarkers of OA”.
Among the genes with highest expression in our data were IL1B (fold change = 15.91) and IL15 (5.39), although many other genes encoding interleukins were also up-regulated (IL10, IL10RB, IL1A and IL22). IL1B levels correlate with age-related mortality in human studies. By blocking IL-1 signaling, the dysfunction of HSC could be slowed down [33]. In addition, IL1B promotes the decline of pancreatic beta cell function during the aging process [34] ultimately leading to diabetes. The plasma levels of pro-inflammatory cytokines (IL-6, TNF and IL-1β) are accepted as risk factors in cardiovascular and neurodegenerative diseases and increase in elderly with various comorbidities [35]. On the other hand, IL-15 has low levels in older individuals [36]. As IL-15 is associated with the defense against intracellular pathogens, as well as the reactivation of memory T cells, we presume that frequent and constant meeting with pathogens and the need for memory cell activation has led to its high expression in our data. It could also be associated with a mitochondrial signal for healing that generally decreases with age [37], or being overweight. In general, the up-regulated pro-inflammatory cytokine genes in our list pinpoint their key role in inflammatory aging.
The presence of significantly activated TLR genes (TLR7, TLR4 and TOLLIP) (Table 2) in our data is in accordance with previous findings that immunosenescence affects TLRs’ function leading to higher infectious morbidity and mortality in geriatric patients [38]. TLRs are an important class of pattern-recognition receptors (PRRs), which initiate innate immune response. TLR7 (TLR7 fold change = 5.40) induces the production of proinflammatory cytokines and interferon type I. It recognizes intracellular single-stranded RNA and promotes autoimmune diseases, such as systemic lupus erythematosus (SLE) and rheumatoid arthritis (RA), while its effects are MYD88-dependent (MYD88 fold change = 6.56) [39]. According to Chen et al., the high expression of TLR7 and its MYD88-dependent signaling is common in adult-onset Still’s disease [40]. Excessive TLR expression may have detrimental effects: the high expression of TLR7 induces demyelination and motor impairment [41]. Additionally, a member of FAS ligand’s family FASLG (FASLG fold change = 5.53) has also been implicated in the progression of several autoimmune diseases (such as SLE, ALPS (autoimmune lymphoproliferative syndrome) and immunodeficiency with autoinflammation) [42]. It is supposed that the dysfunction of the FAS-FASLG pathway could be caused by gene mutations. This could be an important point of future research.
TLR4, similarly to TLR7, (TLR4 fold change = 6.41) also activates pro-inflammatory cytokines and transcription factors NF-κB and AP-1 through MYD88. The chronic inflammatory response triggered by TLR4 contributes to the onset of age-related disorders, like Alzheimer’s disease, cancer, osteoarthritis, myocardial disorders and diabetes [43]. Toll-interacting protein TOLLIP (TOLLIP fold change 7.53) is an adaptor protein highly expressed in the CNS, specifically the cerebral cortex. It is associated with neurodegenerative diseases, pulmonary diseases, cardiovascular disease, inflammatory bowel disease and malignancy. Its mechanism of action is connected with autophagy and vacuole trafficking [44].
Among the overexpressed genes is also CRP (fold change 5.65)—a well-known marker of inflammation. Together with IL6 and TNF alpha, CRP is the most frequently studied marker of frailty [45]. Frailty, too, is a marker of aging and age-related changes in innate and adaptive immunity. Elevated CRP plasma levels are often associated with different diseases in older individuals and contribute to a higher mortality rate in the population. Highly elevated expression of CRP in our data unequivocally confirms the close link between immunological senescence and chronic systemic inflammation.
We detected only a few down-regulated genes in association with premature senescence. Senescent cells secrete inflammatory mediators that enhance tumor growth, among them being prostaglandins. PTGS2 (COX-2, cyclooxygenase 2) is a key part of the arachidonic acid cycle, involved in inflammation and pain response [46]. Several studies reported the down-regulation of COX-2. Ricciotti E. et al. report that the inhibition of COX-2 results in heart failure with preserved ejection fraction across zebrafish, mice and humans [47]. The down-regulation of PTGS2 is related to abnormal immunocyte infiltration and the occurrence of interstitial lung disease in systemic sclerosis (SSc-ILD) [48]. Certain polymorphisms in PTGS2 are involved in the pathogenesis of AD [49]. Moreover, PTGS2 acts through the NF-κB signaling pathway and vice-versa. Oxidative stress and the production of reactive oxygen species activate NF-κB and are related to a change in COX-2 expression [50]. Therefore, the down-regulation of COX-2 in our data could be interpreted as a protective mode against oxidative stress occurring during the aging process achieving a decrease in NF-κB activity.
IL23R is a proinflammatory protumor cytokine associated with autoimmune conditions and chronic inflammatory diseases (CID), such as inflammatory bowel disease (IBD), Crohn’s disease, axial spondyloarthritis and psoriasis (Pso). IL23 shows age-dependent rather than sex-dependent variability contributing to the individual susceptibility to IL-23 mediated inflammatory processes [51]. IL23 shows tumor-promoting effects and is highly expressed in Тreg cells of the TME (tumor microenvironment). The negative expression of IL23R in our data could be interpreted as a protective mechanism against tumor formation and activation of protumor Tregs.
IL5 is a cytokine produced mainly by activated Th2 cells, mast cells and eosinophils. It participates in the pathogenesis of allergic diseases and the development of eosinophilia in response to aeroallergens or parasites. IL5 could also play a role in IgA production and generation of mucosal immunity. Therefore, we suggest that the increase in the air pollution in current world, as well as the frequency of asthma or hypereosinophillic syndromes, could be associated with the decreased expression of IL5 in our data, as an evolving evolutionary factor for protection against environmental antigens [52].

4.1. Potential Interventions and Therapeutic Strategies

The findings of our study imply that targeting inflammatory pathways could help mitigate immune aging. The decreased immune potential facilitates bacterial and viral virulence mechanisms and suggests new approved approaches for personalized decisions. There are developed strategies of suppression for some of the genes we have identified as up-regulated. For example, a whole class of BCL6-targeted drugs have been approved, known as BCL6 inhibitors [53]. Another way to suppress the expression is by epigenetic mechanisms, such as the usage of miRNAs. miR-144-3p inhibits cell proliferation and delays the G1/S phase transition of colorectal cancer cells [54]. Moreover, the mi-RNA 125b is a negative regulator of CCL4 and its reduction in aging correlates inversely with the increased level of CCL4 [55]. In vitro experiments with mice show that CCL4 knockout generates anti-aging effects, such as improved wound healing [56]. The latter finding is extremely important from a practical point of view, as a potential CCL4 targeting agent could be promising against age-related vascular and dermal effects.
Some members of the TLR family are also up-regulated in our data. In an in vitro study with mice, a treatment with TLR4 antagonist improved memory loss in aged rats, while its induction activated macrophages, fibrosis and apoptosis. This once again confirms the potential inhibition of TLR4 as a promising weapon to suppress aging and its related chronic conditions. Immune inhibitors are used to suppress low-grade inflammation. Such could be, for example, mTOR inhibitors (rapamycin). It has been shown that the administration of rapamycin and its derivatives in humans can reverse immunosenescence [57].
Some down-regulated genes could have a protective impact on the process of immunosenescence and slow it down. In such a way, the silencing of PTGS2 (COX-2) by siRNA significantly decreased the frequency of post-senescence neoplastic emerging (PSNE) cells, thus showing a protective effect on keratinocytes with age. The silencing of PTGS2 has a similar protective effect against ischemic stroke in mice, promoting the angiogenesis of endothelial progenitor cells [58]. The suppression of IL23R increases the responsiveness to IL12, leading to more efficient antitumor immune responses [59]. Therefore, the axis IL-23/IL-23R is meant to be a promising therapeutic target for the destabilization of Treg cells [59,60]. The decrease in IL5 controls eosinophil development, maturation and activation, and will decrease the type 2 inflammatory response [61]. The suppressed expression of IL5 will inhibit allergen-provoked airway eosinophilia and hyperreactivity.
Another possible solution is the development of novel antibiotics with higher bioactivity and cytotoxicity (like Abaucin) [62]. In addition, we may not avoid mentioning the generation of targeted therapies in the face of monoclonal antibodies for the secondary prevention of bacterial infections. A good example is Bezlotoxumab targeting toxin B of C. difficile. Bezlotoxumab prevents the damage of C. difficile on colonic mucosa by neutralizing toxin B [63].
Caloric nutritional schemes and an intake of foods with anti-inflammatory properties could also help the immune system surveillance [64]. Some macro- and micro-nutrients, as well as bioactive compounds, could positively affect the immune response. They are not only involved in molecular aspects of immunity, but also influence in a good way the gut microbiota (plan-derived fibers, prebiotics, zink, orin, vitamins, etc.) [65].

4.2. Limitations of the Study

A major limitation of our study is the comparison of gene expression data only, without further protein validation. In addition, this study captures just a single time frame of gene expression, while tracking of immune aging markers over time has not been performed. As immunosenescence has been associated with the emergence of chronic (respiratory or cardio-vascular) illnesses, it would be intriguing to analyze the correlation of gene expression findings with clinical outcomes in future prospective studies.

5. Conclusions

In the current study, we analyzed the differential expression of genes related to adaptive and innate immune responses in active people with/without signs of immunosenescence. This is the first study analyzing gene expression not in elderly but in clinically healthy individuals with premature immunosenescence. Our results undoubtfully show a higher gene expression of markers of chronic inflammation, supporting the theory of the “immune exhaustion” as a main factor of immunosenescence. In addition, the observed down-regulation of a limited number of genes could be newly interpreted as a protective reaction against oxidative stress, tumor formation and hypereosinophilia in response to an increasing number of environmental allergens. In conclusion, our study confirmed established mechanisms of aging while proposing some new interpretations of this phenomenon in individuals of active age.

Author Contributions

All authors contributed significantly to the conception and design of the study. Material preparation and data collection were conducted by V.K.; Z.H. performed the RNA isolation and the quality check. Y.T. and M.A. executed immunophenotyping experiments. Y.T., M.N. and R.E. interpreted and analyzed the immunophenotyping results. D.N. and B.R. analyzed the results. D.N. interpreted the gene expression results and wrote the first draft of the manuscript. The manuscript was reviewed by M.N. All authors have read and agreed to the published version of the manuscript.

Funding

This study is a part of the project КП-06-Н33/17 from 21.12.2019 of the National Science Fund of the Ministry of Education, Bulgaria.

Institutional Review Board Statement

This study was conducted in accordance with the Declaration of Helsinki, and approved by the Ethical Committee of the National Centre of Infectious and Parasitic Diseases, Sofia, Bulgaria (Institutional Review Board/Institutional Ethics Committee (IRB/IEC) number: IRB 00006384), protocol No 5/2020.

Informed Consent Statement

Written informed consent was obtained from all the participants in this study.

Data Availability Statement

The authors confirm that the data supporting the findings of this study are available within the article.

Conflicts of Interest

The authors declare no conflicts of interest.

References

  1. Kandilarov, E. Bulgaria political briefing: Bulgaria’s Population Continues to Decline and Age. China-CEE Inst. 2024, 75, 1–9. [Google Scholar]
  2. Asia-Pacific Centre for Environment and Health in WPR (ACE). UN Decade of Healthy Ageing: Plan of Action (2021–2030). pp. 1–31. Available online: https://www.who.int/westernpacific/publications/m/item/un-decade-of-healthy-ageing-plan-of-action-2021-2030 (accessed on 10 March 2025).
  3. Liu, Z.; Liang, Q.; Ren, Y.; Guo, C.; Ge, X.; Wang, L.; Cheng, Q.; Luo, P.; Zhang, Y.; Han, X. Immunosenescence: Molecular mechanisms and diseases. Signal Transduct. Target. Ther. 2023, 8, 200. [Google Scholar] [CrossRef] [PubMed]
  4. Naumova, E.; Ivanova, M. Associations of Cytokine Polymorphisms with Immunosenescence. In Handbook on Immunosenescence: Basic Understanding and Clinical Applications; Fulop, T., Franceschi, C., Hirokawa, K., Pawelec, G., Eds.; Springer: Dordrecht, The Netherlands, 2009; pp. 615–629. Available online: https://www.researchgate.net/publication/286769660_Associations_of_cytokine_polymorphisms_with_immunosenescence/citation/download (accessed on 10 March 2025).
  5. Hayflick, L.; Moorhead, P.S. The serial cultivation of human diploid cell strains. Exp. Cell Res. 1961, 25, 585–621. [Google Scholar] [CrossRef] [PubMed]
  6. Escrig-Larena, J.I.; Delgado-Pulido, S.; Mittelbrunn, M. Mitochondria during T cell aging. Semin. Immunol. 2023, 69, 101808. [Google Scholar] [CrossRef] [PubMed]
  7. Giuliani, A.; Micolucci, L.; Olivieri, F.; Procopio, A.D.; Rippo, M.R. MitomiRs in Human Inflamm-Aging. In Handbook of Immunosenescence: Basic Understanding and Clinical Implications; Fulop, T., Franceschi, C., Hirokawa, K., Pawelec, G., Eds.; Springer International Publishing: Cham, Switzerland, 2018; pp. 1–29. [Google Scholar]
  8. Olivieri, F.; Marchegiani, F.; Matacchione, G.; Giuliani, A.; Ramini, D.; Fazioli, F.; Sabbatinelli, J.; Bonafè, M. Sex/gender-related differences in inflammaging. Mech. Ageing Dev. 2023, 211, 111792. [Google Scholar] [CrossRef] [PubMed]
  9. Mauvais-Jarvis, F.; Bairey Merz, N.; Barnes, P.J.; Brinton, R.D.; Carrero, J.J.; DeMeo, D.L.; De Vries, G.J.; Epperson, C.N.; Govindan, R.; Klein, S.L.; et al. Sex and gender: Modifiers of health, disease, and medicine. Lancet 2020, 396, 565–582. [Google Scholar] [CrossRef]
  10. Yalcinkaya, A.; Yalcinkaya, R.; Sardh, F.; Landegren, N. Immune dynamics throughout life in relation to sex hormones and perspectives gained from gender-affirming hormone therapy. Front. Immunol. 2024, 15, 1501364. [Google Scholar] [CrossRef]
  11. Di Palo, A.; Siniscalchi, C.; Salerno, M. What microRNAs could tell us about the human X chromosome. Cell. Mol. Life Sci. 2020, 77, 4069–4080. [Google Scholar] [CrossRef]
  12. Serbezov, D.; Balabanski, L.; Hadjidekova, S.; Toncheva, D. Genomics of longevity: Recent insights from research on centenarians. Biotechnol. Biotechnol. Equip. 2018, 32, 1359–1366. [Google Scholar] [CrossRef]
  13. Naumova, E.; Mihaylova, A.; Ivanova, M.; Michailova, S.; Penkova, K.; Baltadjieva, D. Immunological markers contributing to successful aging in Bulgarians. Exp. Gerontol. 2004, 39, 637–644. [Google Scholar] [CrossRef]
  14. Babagana, M.; Oh, K.S.; Chakraborty, S.; Pacholewska, A.; Aqdas, M.; Sung, M.H. Hedgehog dysregulation contributes to tissue-specific inflammaging of resident macrophages. Aging 2021, 13, 19207–19229. [Google Scholar] [CrossRef] [PubMed]
  15. Livak, K.J.; Schmittgen, T.D. Analysis of Relative Gene Expression Data Using Real-Time Quantitative PCR and the 2−ΔΔCT Method. Methods 2001, 25, 402–408. [Google Scholar] [CrossRef]
  16. Comans-Bitter, W.M.; de Groot, R.; van den Beemd, R.; Neijens, H.J.; Hop, W.C.; Groeneveld, K.; Hooijkaas, H.; van Dongen, J.J. Immunophenotyping of blood lymphocytes in childhood. Reference values for lymphocyte subpopulations. J. Pediatr. 1997, 130, 388–393. [Google Scholar] [CrossRef] [PubMed]
  17. Lee, K.A.; Flores, R.R.; Jang, I.H.; Saathoff, A.; Robbins, P.D. Immune Senescence, Immunosenescence and Aging. Front. Aging 2022, 3, 900028. [Google Scholar] [CrossRef] [PubMed]
  18. Hima, L.; Patel, M.N.; Kannan, T.; Gour, S.; Pratap, U.P.; Priyanka, H.P.; Vasantharekha, R.; ThyagaRajan, S. Age-associated decline in neural, endocrine, and immune responses in men and women: Involvement of intracellular signaling pathways. J. Neuroimmunol. 2020, 345, 577290. [Google Scholar] [CrossRef]
  19. Wrona, M.V.; Ghosh, R.; Coll, K.; Chun, C.; Yousefzadeh, M.J. The 3 I’s of immunity and aging: Immunosenescence, inflammaging, and immune resilience. Front. Aging 2024, 5, 1490302. [Google Scholar] [CrossRef]
  20. Chaudhary, J.K.; Danga, A.K.; Kumari, A.; Bhardwaj, A.; Rath, P.C. Role of chemokines in aging and age-related diseases. Mech. Ageing Dev. 2025, 223, 112009. [Google Scholar] [CrossRef]
  21. Mukaida, N.; Sasaki, S.I.; Baba, T. CCL4 Signaling in the Tumor Microenvironment. Adv. Exp. Med. Biol. 2020, 1231, 23–32. [Google Scholar] [CrossRef]
  22. Wang, Y.; Wang, S.; Li, Y.; Lai, G. Study on relationship between chemokines and immune activation phenotype of breast cancer. J. Clin. Oncol. 2021, 39, e12564. [Google Scholar] [CrossRef]
  23. Chen, Y.; Liang, L.; Cao, S.; Hou, G.; Zhang, Q.; Ma, H.; Shi, B. Serum CCL21 as a Potential Biomarker for Cognitive Impairment in Spinal Cord Injury. BioMed Res. Int. 2020, 2020, 6692802. [Google Scholar] [CrossRef]
  24. Faura, J.; Bustamante, A.; Penalba, A.; Giralt, D.; Simats, A.; Martinez-Saez, E.; Alcolea, D.; Fortea, J.; Lleo, A.; Teunissen, C.E.; et al. CCL23: A Chemokine Associated with Progression from Mild Cognitive Impairment to Alzheimer’s Disease. J. Alzheimer’s Dis. JAD 2020, 73, 1585–1595. [Google Scholar] [CrossRef] [PubMed]
  25. Jiao, X.; Velasco-Velazquez, M.A.; Wang, M.; Li, Z.; Rui, H.; Peck, A.R.; Korkola, J.E.; Chen, X.; Xu, S.; DuHadaway, J.B.; et al. CCR5 Governs DNA Damage Repair and Breast Cancer Stem Cell Expansion. Cancer Res. 2018, 78, 1657–1671. [Google Scholar] [CrossRef] [PubMed]
  26. Sato, F.; Omura, S.; Martinez, N.E.; Tsunoda, I. Chapter 3—Animal Models of Multiple Sclerosis. In Neuroinflammation, 2nd ed.; Minagar, A., Ed.; Academic Press: Cambridge, MA, USA, 2018; pp. 37–72. [Google Scholar] [CrossRef]
  27. Dangi, A.; Husain, I.; Jordan, C.Z.; Yu, S.; Natesh, N.; Shen, X.; Kwun, J.; Luo, X. Blocking CCL8-CCR8-Mediated Early Allograft Inflammation Improves Kidney Transplant Function. J. Am. Soc. Nephrol. JASN 2022, 33, 1876–1890. [Google Scholar] [CrossRef] [PubMed]
  28. Li, B.H.; Garstka, M.A.; Li, Z.F. Chemokines and their receptors promoting the recruitment of myeloid-derived suppressor cells into the tumor. Mol. Immunol. 2020, 117, 201–215. [Google Scholar] [CrossRef]
  29. Pelisch, N.; Rosas Almanza, J.; Stehlik, K.E.; Aperi, B.V.; Kroner, A. CCL3 contributes to secondary damage after spinal cord injury. J. Neuroinflammation 2020, 17, 362. [Google Scholar] [CrossRef]
  30. Yu, D.; Zhang, Z.; Ma, C.; Huang, S.; Xu, L.; Liang, J.; Li, H.; Fan, Q.; Liu, G.; Zhai, Z. CCL3 in the bone marrow microenvironment causes bone loss and bone marrow adiposity in aged mice. JCI Insight 2023, 18, e159107. [Google Scholar] [CrossRef]
  31. Fisher, J.S.; Adan-Barrientos, I.; Kumar, N.R.; Lancaster, J.N. The aged microenvironment impairs BCL6 and CD40L induction in CD4(+) T follicular helper cell differentiation. Aging Cell 2024, 23, e14140. [Google Scholar] [CrossRef]
  32. Chen, Z.; Wang, W.; Hua, Y. Identification and validation of BCL6 and VEGFA as biomarkers and ageing patterns correlating with immune infiltrates in OA progression. Sci. Rep. 2023, 13, 2558. [Google Scholar] [CrossRef]
  33. Mitchell, C.A.; Verovskaya, E.V.; Calero-Nieto, F.J.; Olson, O.C.; Swann, J.W.; Wang, X.; Herault, A.; Dellorusso, P.V.; Zhang, S.Y.; Svendsen, A.F.; et al. Stromal niche inflammation mediated by IL-1 signalling is a targetable driver of haematopoietic ageing. Nat. Cell Biol. 2023, 25, 30–41. [Google Scholar] [CrossRef]
  34. Böni-Schnetzler, M.; Méreau, H.; Rachid, L.; Wiedemann, S.J.; Schulze, F.; Trimigliozzi, K.; Meier, D.T.; Donath, M.Y. IL-1beta promotes the age-associated decline of beta cell function. iScience 2021, 24, 103250. [Google Scholar] [CrossRef]
  35. Tylutka, A.; Walas, L.; Zembron-Lacny, A. Level of IL-6, TNF, and IL-1beta and age-related diseases: A systematic review and meta-analysis. Front. Immunol. 2024, 15, 1330386. [Google Scholar] [CrossRef] [PubMed]
  36. Prado, G.H.J.D.; Sardeli, A.V.; Lord, J.M.; Cavaglieri, C.R. The effects of ageing, BMI and physical activity on blood IL-15 levels: A systematic review and meta-analyses. Exp. Gerontol. 2022, 168, 111933. [Google Scholar] [CrossRef] [PubMed]
  37. Wong, W.; Crane, E.D.; Kuo, Y.; Kim, A.; Crane, J.D. The exercise cytokine interleukin-15 rescues slow wound healing in aged mice. J. Biol. Chem. 2019, 294, 20024–20038. [Google Scholar] [CrossRef]
  38. Crooke, S.N.; Ovsyannikova, I.G.; Poland, G.A.; Kennedy, R.B. Immunosenescence: A systems-level overview of immune cell biology and strategies for improving vaccine responses. Exp. Gerontol. 2019, 124, 110632. [Google Scholar] [CrossRef] [PubMed]
  39. Yang, Z.; Ji, S.; Liu, L.; Liu, S.; Wang, B.; Ma, Y.; Cao, X. Promotion of TLR7-MyD88-dependent inflammation and autoimmunity in mice through stem-loop changes in Lnc-Atg16l1. Nat. Commun. 2024, 15, 10224. [Google Scholar] [CrossRef]
  40. Chen, D.Y.; Lin, C.C.; Chen, Y.M.; Lan, J.L.; Hung, W.T.; Chen, H.H.; Lai, K.L.; Hsieh, C.W. Involvement of TLR7 MyD88-dependent signaling pathway in the pathogenesis of adult-onset Still’s disease. Arthritis Res. Ther. 2013, 15, R39. [Google Scholar] [CrossRef]
  41. Lopez-Lee, C.; Kodama, L.; Fan, L.; Zhu, D.; Zhu, J.; Wong, M.Y.; Ye, P.; Norman, K.; Foxe, N.R.; Ijaz, L.; et al. Tlr7 drives sex differences in age- and Alzheimer’s disease-related demyelination. Science 2024, 386, eadk7844. [Google Scholar] [CrossRef]
  42. Magerus, A.; Bercher-Brayer, C.; Rieux-Laucat, F. The genetic landscape of the FAS pathway deficiencies. Biomed. J. 2021, 44, 388–399. [Google Scholar] [CrossRef]
  43. Kim, H.-J.; Kim, H.; Lee, J.-H.; Hwangbo, C. Toll-like receptor 4 (TLR4): New insight immune and aging. Immun. Ageing 2023, 20, 67. [Google Scholar] [CrossRef]
  44. Li, X.; Goobie, G.C.; Zhang, Y. Toll-interacting protein impacts on inflammation, autophagy, and vacuole trafficking in human disease. J. Mol. Med. 2021, 99, 21–31. [Google Scholar] [CrossRef]
  45. Tran Van Hoi, E.; De Glas, N.A.; Portielje, J.E.A.; Van Heemst, D.; Van Den Bos, F.; Jochems, S.P.; Mooijaart, S.P. Biomarkers of the ageing immune system and their association with frailty—A systematic review. Exp. Gerontol. 2023, 176, 112163. [Google Scholar] [CrossRef] [PubMed]
  46. Martín-Vázquez, E.; Cobo-Vuilleumier, N.; López-Noriega, L.; Lorenzo, P.I.; Gauthier, B.R. The PTGS2/COX2-PGE(2) signaling cascade in inflammation: Pro or anti? A case study with type 1 diabetes mellitus. Int. J. Biol. Sci. 2023, 19, 4157–4165. [Google Scholar] [CrossRef] [PubMed]
  47. Ricciotti, E.; Haines, P.G.; Beerens, M.; Kartoun, U.; Castro, C.; Tang, S.Y.; Ghosh, S.; Das, U.S.; Lahens, N.F.; Wang, T.; et al. Suppression of cyclooxygenase-2 predisposes to heart failure with preserved ejection fraction. bioRxiv 2024. [Google Scholar] [CrossRef]
  48. Xu, Z.; Chen, C. The Downregulation of PTGS2 Mediated by ncRNAs is Tightly Correlated with Systemic Sclerosis-Interstitial Lung Disease. Front. Genet. 2021, 12, 795034. [Google Scholar] [CrossRef] [PubMed]
  49. Pei, Y.; Chen, S.; Zhou, F.; Xie, T.; Cao, H. Construction and evaluation of Alzheimer’s disease diagnostic prediction model based on genes involved in mitophagy. Front. Aging Neurosci. 2023, 15, 1146660. [Google Scholar] [CrossRef]
  50. Kim, H.-J.; Kim, K.-W.; Yu, B.-P.; Chung, H.-Y. The effect of age on cyclooxygenase-2 gene expression: NF-κB activation and IκBα degradation. Free Radic. Biol. Med. 2000, 28, 683–692. [Google Scholar] [CrossRef]
  51. Audia, S.; Brescia, C.; Dattilo, V.; Torchia, N.; Trapasso, F.; Amato, R. The IL-23R and Its Genetic Variants: A Hitherto Unforeseen Bridge Between the Immune System and Cancer Development. Cancers 2025, 17, 55. [Google Scholar] [CrossRef]
  52. Nagase, H.; Ueki, S.; Fujieda, S. The roles of IL-5 and anti-IL-5 treatment in eosinophilic diseases: Asthma, eosinophilic granulomatosis with polyangiitis, and eosinophilic chronic rhinosinusitis. Allergol. Int. 2020, 69, 178–186. [Google Scholar] [CrossRef]
  53. Liongue, C.; Almohaisen, F.L.J.; Ward, A.C. B Cell Lymphoma 6 (BCL6): A Conserved Regulator of Immunity and Beyond. Int. J. Mol. Sci. 2024, 25, 10968. [Google Scholar] [CrossRef]
  54. Sun, N.; Zhang, L.; Zhang, C.; Yuan, Y. miR-144-3p inhibits cell proliferation of colorectal cancer cells by targeting BCL6 via inhibition of Wnt/β-catenin signaling. Cell. Mol. Biol. Lett. 2020, 25, 19. [Google Scholar] [CrossRef]
  55. Cheng, N.-L.; Weng, N.-P. MicroRNA-125b Modulates Inflammatory Chemokine CCL4 Expression and Its Reduction May Cause CCL4 Increase in Circulation with Age. In Handbook of Immunosenescence; Springer International Publishing: Cham, Switzerland, 2019; pp. 1225–1239. [Google Scholar] [CrossRef]
  56. Chang, T.T.; Lin, L.Y.; Chen, C.; Chen, J.W. CCL4 contributes to aging related angiogenic insufficiency through activating oxidative stress and endothelial inflammation. Angiogenesis 2024, 27, 475–499. [Google Scholar] [CrossRef] [PubMed]
  57. Mannick, J.B.; Teo, G.; Bernardo, P.; Quinn, D.; Russell, K.; Klickstein, L.; Marshall, W.; Shergill, S. Targeting the biology of ageing with mTOR inhibitors to improve immune function in older adults: Phase 2b and phase 3 randomised trials. Lancet. Healthy Longev. 2021, 2, e250–e262. [Google Scholar] [CrossRef] [PubMed]
  58. Zhou, Z.; Lu, C.; Meng, S.; Dun, L.; Yin, N.; An, H.; Xu, H.; Liu, G.; Cai, Y. Silencing of PTGS2 exerts promoting effects on angiogenesis endothelial progenitor cells in mice with ischemic stroke via repression of the NF-κB signaling pathway. J. Cell. Physiol. 2019, 234, 23448–23460. [Google Scholar] [CrossRef] [PubMed]
  59. Wight, A.E.; Sido, J.M.; Degryse, S.; Ao, L.; Nakagawa, H.; Qiu Vivian, Y.; Shen, X.; Oseghali, O.; Kim, H.J.; Cantor, H. Antibody-mediated blockade of the IL23 receptor destabilizes intratumoral regulatory T cells and enhances immunotherapy. Proc. Natl. Acad. Sci. USA 2022, 119, e2200757119. [Google Scholar] [CrossRef]
  60. Wertheimer, T.; Zwicky, P.; Rindlisbacher, L.; Sparano, C.; Vermeer, M.; de Melo, B.M.S.; Haftmann, C.; Rückert, T.; Sethi, A.; Schärli, S.; et al. IL-23 stabilizes an effector Treg cell program in the tumor microenvironment. Nat. Immunol. 2024, 25, 512–524. [Google Scholar] [CrossRef]
  61. Principe, S.; Benfante, A.; Calzetta, L.; Rogliani, P.; Scichilone, N. Age does not affect the efficacy of anti-IL-5/IL-5R in severe asthmatics. World Allergy Organ. J. 2019, 12, 100081. [Google Scholar] [CrossRef]
  62. Wong, F.; Zheng, E.J.; Valeri, J.A.; Donghia, N.M.; Anahtar, M.N.; Omori, S.; Li, A.; Cubillos-Ruiz, A.; Krishnan, A.; Jin, W.; et al. Discovery of a structural class of antibiotics with explainable deep learning. Nature 2024, 626, 177–185. [Google Scholar] [CrossRef]
  63. Johnson, S.; Gerding, D.N. Bezlotoxumab. Clin. Infect. Dis. Off. Publ. Infect. Dis. Soc. Am. 2019, 68, 699–704. [Google Scholar] [CrossRef]
  64. Cisneros, B.; Garcia-Aguirre, I.; Unzueta, J.; Arrieta-Cruz, I.; Gonzalez-Morales, O.; Dominguez-Larrieta, J.M.; Tamez-Gonzalez, A.; Leyva-Gomez, G.; Magana, J.J. Immune system modulation in aging: Molecular mechanisms and therapeutic targets. Front. Immunol. 2022, 13, 1059173. [Google Scholar] [CrossRef]
  65. Calder, P.C.; Ortega, E.F.; Meydani, S.N.; Adkins, Y.; Stephensen, C.B.; Thompson, B.; Zwickey, H. Nutrition, Immunosenescence, and Infectious Disease: An Overview of the Scientific Evidence on Micronutrients and on Modulation of the Gut Microbiota. Adv. Nutr. 2022, 13, S1–S26. [Google Scholar] [CrossRef]
Figure 1. Absolute count of lymphocytes (A) and CD4+ T cells (B) in the test group (grey bars) and in the control group (white bars). The boxplot bar represents median (min–max) (* p < 0.05).
Biomedicines 13 00721 g001
Figure 2. Proportions of naïve CD4+ and CD8+ T cells (A) and the share of effector memory and terminal effector CD8+ T cells (B) in test group (grey bars) and in control group (white bars). The boxplot bar represents median (min–max). (* p < 0.05; ** p ≤ 0.01; **** p ≤ 0.0001.)
Biomedicines 13 00721 g002
Figure 3. Differentially expressed genes with a fold regulation more than 2 (up-regulated) or less than −2 (down-regulated) in the group of individuals with premature immunosenescence (test group).
Biomedicines 13 00721 g003
Figure 4. Scatter Plot of the genes in the test group vs. the control group. The center diagonal line indicates unchanged gene expression, while outer lines indicate the selected fold regulation threshold. Genes with data points beyond the outer lines in the upper left and lower right corners are up-regulated or down-regulated, respectively. The represented points are more than the presented genes in Table 2 as we selected only the genes with a fold change more than 2 and less than −2. The red dots represent the up-regulated, the black ones—genes with no change in the gene expression and the green ones—down-regulated genes.
Biomedicines 13 00721 g004
Table 1. List of genes included on the Qiagen plate (RT2 Profiler PCR Array Human Innate & Adaptive Immune Responses); PTC—positive controls; and H01 to H06—house-keeping genes.
PositionRef Seq NumberSymbolDescription
A01NM_001706BCL6B-cell CLL/lymphoma 6
A02NM_000064C3Complement component 3
A03NM_004054C3AR1Complement component 3a receptor 1
A04NM_002986CCL11Chemokine (C-C motif) ligand 11
A05NM_005408CCL13Chemokine (C-C motif) ligand 13
A06NM_004590CCL16Chemokine (C-C motif) ligand 16
A07NM_002987CCL17Chemokine (C-C motif) ligand 17
A08NM_006274CCL19Chemokine (C-C motif) ligand 19
A09NM_002982CCL2Chemokine (C-C motif) ligand 2
A10NM_002989CCL21Chemokine (C-C motif) ligand 21
A11NM_002990CCL22Chemokine (C-C motif) ligand 22
A12NM_005064CCL23Chemokine (C-C motif) ligand 23
B01NM_002991CCL24Chemokine (C-C motif) ligand 24
B02NM_002983CCL3Chemokine (C-C motif) ligand 3
B03NM_002984CCL4Chemokine (C-C motif) ligand 4
B04NM_002985CCL5Chemokine (C-C motif) ligand 5
B05NM_006273CCL7Chemokine (C-C motif) ligand 7
B06NM_005623CCL8Chemokine (C-C motif) ligand 8
B07NM_001295CCR1Chemokine (C-C motif) receptor 1
B08NM_001123396CCR2Chemokine (C-C motif) receptor 2
B09NM_001837CCR3Chemokine (C-C motif) receptor 3
B10NM_005508CCR4Chemokine (C-C motif) receptor 4
B11NM_001838CCR7Chemokine (C-C motif) receptor 7
B12NM_000591CD14CD14 molecule
C01NM_001250CD40CD40 molecule, TNF receptor superfamily member 5
C02NM_000074CD40LGCD40 ligand
C03NM_005194CEBPBCCAAT/enhancer binding protein (C/EBP), beta
C04NM_000567CRPC-reactive protein, pentraxin-related
C05NM_000757CSF1Colony-stimulating factor 1 (macrophage)
C06NM_001511CXCL1Chemokine (C-X-C motif) ligand 1 (melanoma growth stimulating activity, alpha)
C07NM_001565CXCL10Chemokine (C-X-C motif) ligand 10
C08NM_002089CXCL2Chemokine (C-X-C motif) ligand 2
C09NM_002090CXCL3Chemokine (C-X-C motif) ligand 3
C10NM_002994CXCL5Chemokine (C-X-C motif) ligand 5
C11NM_002993CXCL6Chemokine (C-X-C motif) ligand 6 (granulocyte chemotactic protein 2)
C12NM_002416CXCL9Chemokine (C-X-C motif) ligand 9
D01NM_000634CXCR1Chemokine (C-X-C motif) receptor 1
D02NM_001557CXCR2Chemokine (C-X-C motif) receptor 2
D03NM_003467CXCR4Chemokine (C-X-C motif) receptor 4
D04NM_000639FASLGFas ligand (TNF superfamily, member 6)
D05NM_005252FOSFBJ murine osteosarcoma viral oncogene homolog
D06NM_000619IFNGInterferon, gamma
D07NM_000572IL10Interleukin 10
D08NM_000628IL10RBInterleukin 10 receptor, beta
D09NM_000585IL15Interleukin 15
D10NM_002190IL17AInterleukin 17A
D11NM_001562IL18Interleukin 18 (interferon-gamma-inducing factor)
D12NM_000575IL1AInterleukin 1, alpha
E01NM_000576IL1BInterleukin 1, beta
E02NM_000877IL1R1Interleukin 1 receptor, type I
E03NM_002182IL1RAPInterleukin 1 receptor accessory protein
E04NM_000577IL1RNInterleukin 1 receptor antagonist
E05NM_020525IL22Interleukin 22
E06NM_016584IL23AInterleukin 23, alpha subunit p19
E07NM_144701IL23RInterleukin 23 receptor
E08NM_000879IL5Interleukin 5 (colony-stimulating factor, eosinophil)
E09NM_000600IL6Interleukin 6 (interferon, beta 2)
E10NM_000565IL6RInterleukin 6 receptor
E11NM_000584CXCL8Interleukin 8
E12NM_000590IL9Interleukin 9
F01NM_000211ITGB2Integrin, beta 2 (complement component 3 receptor 3 and 4 subunit)
F02NM_000893KNG1Kininogen 1
F03NM_000595LTALymphotoxin alpha (TNF superfamily, member 1)
F04NM_002341LTBLymphotoxin beta (TNF superfamily, member 3)
F05NM_015364LY96Lymphocyte antigen 96
F06NM_002468MYD88Myeloid differentiation primary response gene (88)
F07NM_003998NFKB1Nuclear factor of kappa light polypeptide gene enhancer in B-cells 1
F08NM_000625NOS2Nitric oxide synthase 2, inducible
F09NM_000176NR3C1Nuclear receptor subfamily 3, group C, member 1 (glucocorticoid receptor)
F10NM_000963PTGS2Prostaglandin-endoperoxide synthase 2 (prostaglandin G/H synthase and cyclooxygenase)
F11NM_003821RIPK2Receptor-interacting serine-threonine kinase 2
F12NM_000450SELESelectin E
G01NM_001039661TIRAPToll-interleukin 1 receptor (TIR) domain containing adaptor protein
G02NM_003263TLR1Toll-like receptor 1
G03NM_003264TLR2Toll-like receptor 2
G04NM_003265TLR3Toll-like receptor 3
G05NM_138554TLR4Toll-like receptor 4
G06NM_003268TLR5Toll-like receptor 5
G07NM_006068TLR6Toll-like receptor 6
G08NM_016562TLR7Toll-like receptor 7
G09NM_017442TLR9Toll-like receptor 9
G10NM_000594TNFTumor necrosis factor
G11NM_003807TNFSF14Tumor necrosis factor (ligand) superfamily, member 14
G12NM_019009TOLLIPToll interacting protein
H01NM_001101ACTBActin, beta
H02NM_004048B2MBeta-2-microglobulin
H03NM_002046GAPDHGlyceraldehyde-3-phosphate dehydrogenase
H04NM_000194HPRT1Hypoxanthine phosphoribosyltransferase 1
H05NM_001002RPLP0Ribosomal protein, large, P0
H06SA_00105HGDCHuman Genomic DNA Contamination
H07SA_00104RTCReverse Transcription Control
H08SA_00104RTCReverse Transcription Control
H09SA_00104RTCReverse Transcription Control
H10SA_00103PPCPositive PCR Control
H11SA_00103PPCPositive PCR Control
H12SA_00103PPCPositive PCR Control
Table 2. Absolute counts and proportions of the studied lymphocyte subsets.
Healthy Individuals
(“Control Group”)
(n = 39)
Healthy Immunosenescent Individuals
(“Test Group”)
(n = 16)
p Value
years37.69 ± 10.044.00 ± 12.650.09
male/female18/215/110.47
Lymphocyte population
Lymphocyte (AC)2227 ± 5181912 ± 5620.05
CD3+CD4+ T (AC) 1005 ± 258851 ± 2130.05
CD3+CD8 T (AC) 492 ± 158461 ± 1880.44
B cells (AC)238 (89–716)186 (71–458)0.17
NK cells (AC)317 ± 163262 ± 1290.27
CD4/CD8 2.0 (1.1–3.7)2.76 (1.1–3.1)0.55
CD4+ naive32.7 (24.6–56.0)21.8 (9.8–48.0)0.005
CD4+ EM 31.8 (14.1–56.3)38.2 (5.0–55.5)0.076
CD4+ CM25.0 (6.1–46)27.3 (16.3–52.0)0.314
CD4+ TE5.7 (1.1–19.2)5.9 (1.4–21.8)0.545
CD8+ naive32.9 (12–49.8)12.6 (6.4–35.3)0.0001
CD8+ EM40.1 (5.5–54.2)52.1 (31.4–76.7)0.002
CD8+ CM4.0 (0.3–25.2)4.7 (1.3–8.3)0.360
CD8+ TE17.4 (6.0–52.9)22.8 (11.6–48.5)0.047
CD8+CD57+CD27-8.1 (0.2–21)7.6 (1.9–48.2)0.206
CD4+CD38ABS3417 (1817–4481)3662 (2568–7611)0.241
CD8+CD38ABS1903 (1048–2788)2154 (1270–8351)0.251
Statistical differences between the groups were verified with unpaired t-test, Mann–Whitney or Chi2 test, depending on the characteristics of the analyzed variables.
Table 3. Differentially expressed genes between the test group (individuals of immunological senescence) vs. the control group (individuals of no signs of immunosenescence).
NumberUp-Regulated Genes with a Fold Regulation > 2
SymbolFold Regulation
1NOS22.10
2CCL212.37
3TNF2.39
4LY962.49
5KNG12.68
6NR3C12.81
7IL222.83
8CD142.99
9IL1A2.99
10IL1RAP3.14
11CCR73.26
12CCL233.50
13CCR33.53
14IL10RB3.66
15LTA3.79
16CCR13.89
17CCL54.00
18IL23A4.24
19IL104.34
20TNFSF144.51
21LTB4.84
22CCL84.97
23CXCL95.05
24CCR25.16
25CEBPB5.34
26IL155.39
27TLR75.40
28CCR45.44
29FASLG5.53
30CXCL25.64
31CRP5.65
32CXCL85.92
33TLR46.41
34MYD886.56
35CXCR46.94
36CCL37.25
37CXCL57.26
38CD40LG7.31
39TOLLIP7.53
40FOS9.11
41CXCR29.43
42ITGB29.70
43IL1B10.76
44BCL613.25
45CCL415.91
Down-Regulated Genes with a Fold Regulation < −2
1IL23R−3.10
2IL5−2.66
3PTGS2−2.15
Disclaimer/Publisher’s Note: The statements, opinions and data contained in all publications are solely those of the individual author(s) and contributor(s) and not of MDPI and/or the editor(s). MDPI and/or the editor(s) disclaim responsibility for any injury to people or property resulting from any ideas, methods, instructions or products referred to in the content.

