


Development of PowerMag System II for Isolation of Circulating Tumor Cells with Improved Purity


Abstract
1. Introduction
2. Materials and Methods
2.1. Materials
2.2. Blood Collection
2.3. TaqMan Real-Time RT-PCR Assay
2.4. Preparation of Magnetic Beads Conjugated with Annexin V Protein (AnxV Beads)
2.5. Western Blot Analysis and Coomassie Blue Staining
2.6. Cell Culture
2.7. Staurosporine-Induced Apoptosis of Jurkat Cells
2.8. Flow Cytometry Analysis
2.9. PM I and PM II for CTCs Enrichment
2.10. Immunofluorescence Staining for CTC Enumeration
2.11. Analysis of CTCs Detection Limit
2.12. Genomic DNA Isolation
2.13. Whole-Genome Amplification (WGA)
2.14. NGS Sequencing and Bioinformatics Analysis
2.15. Statistical Analysis
3. Results
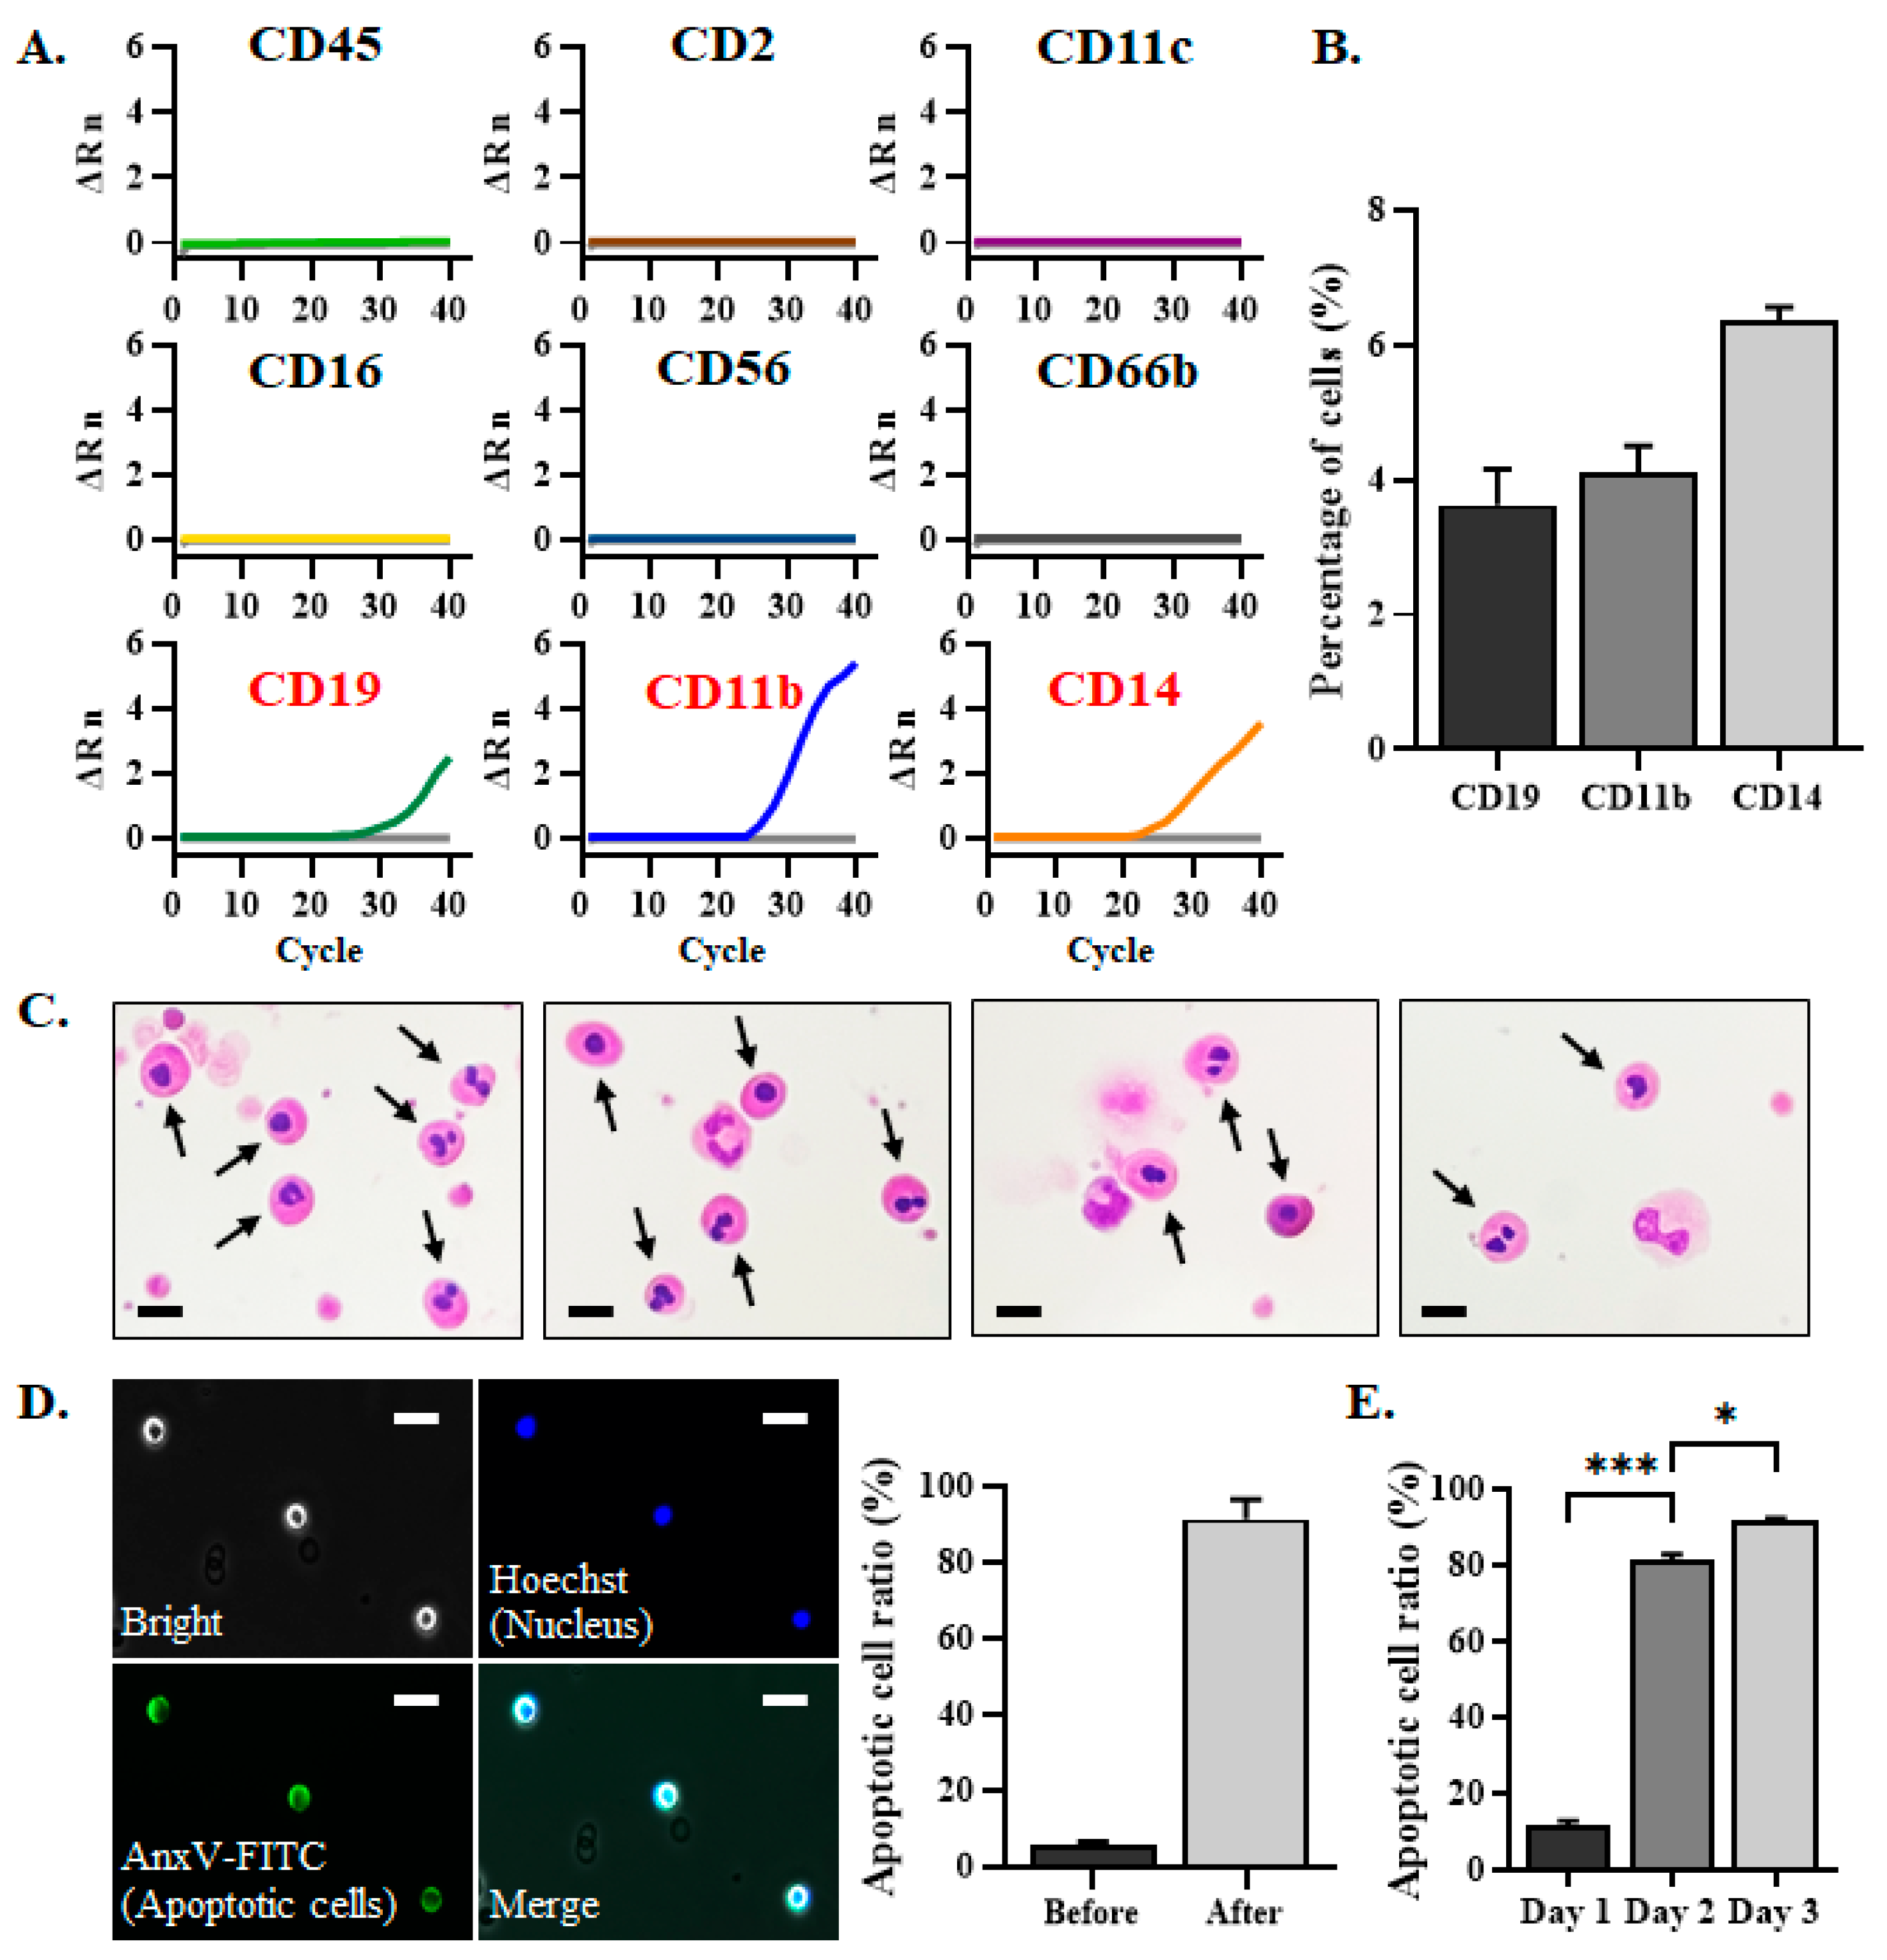
3.1. The EpCAM–CD45– Cells That Can Not Be Removed by PM Were Defined as Apoptotic Cells
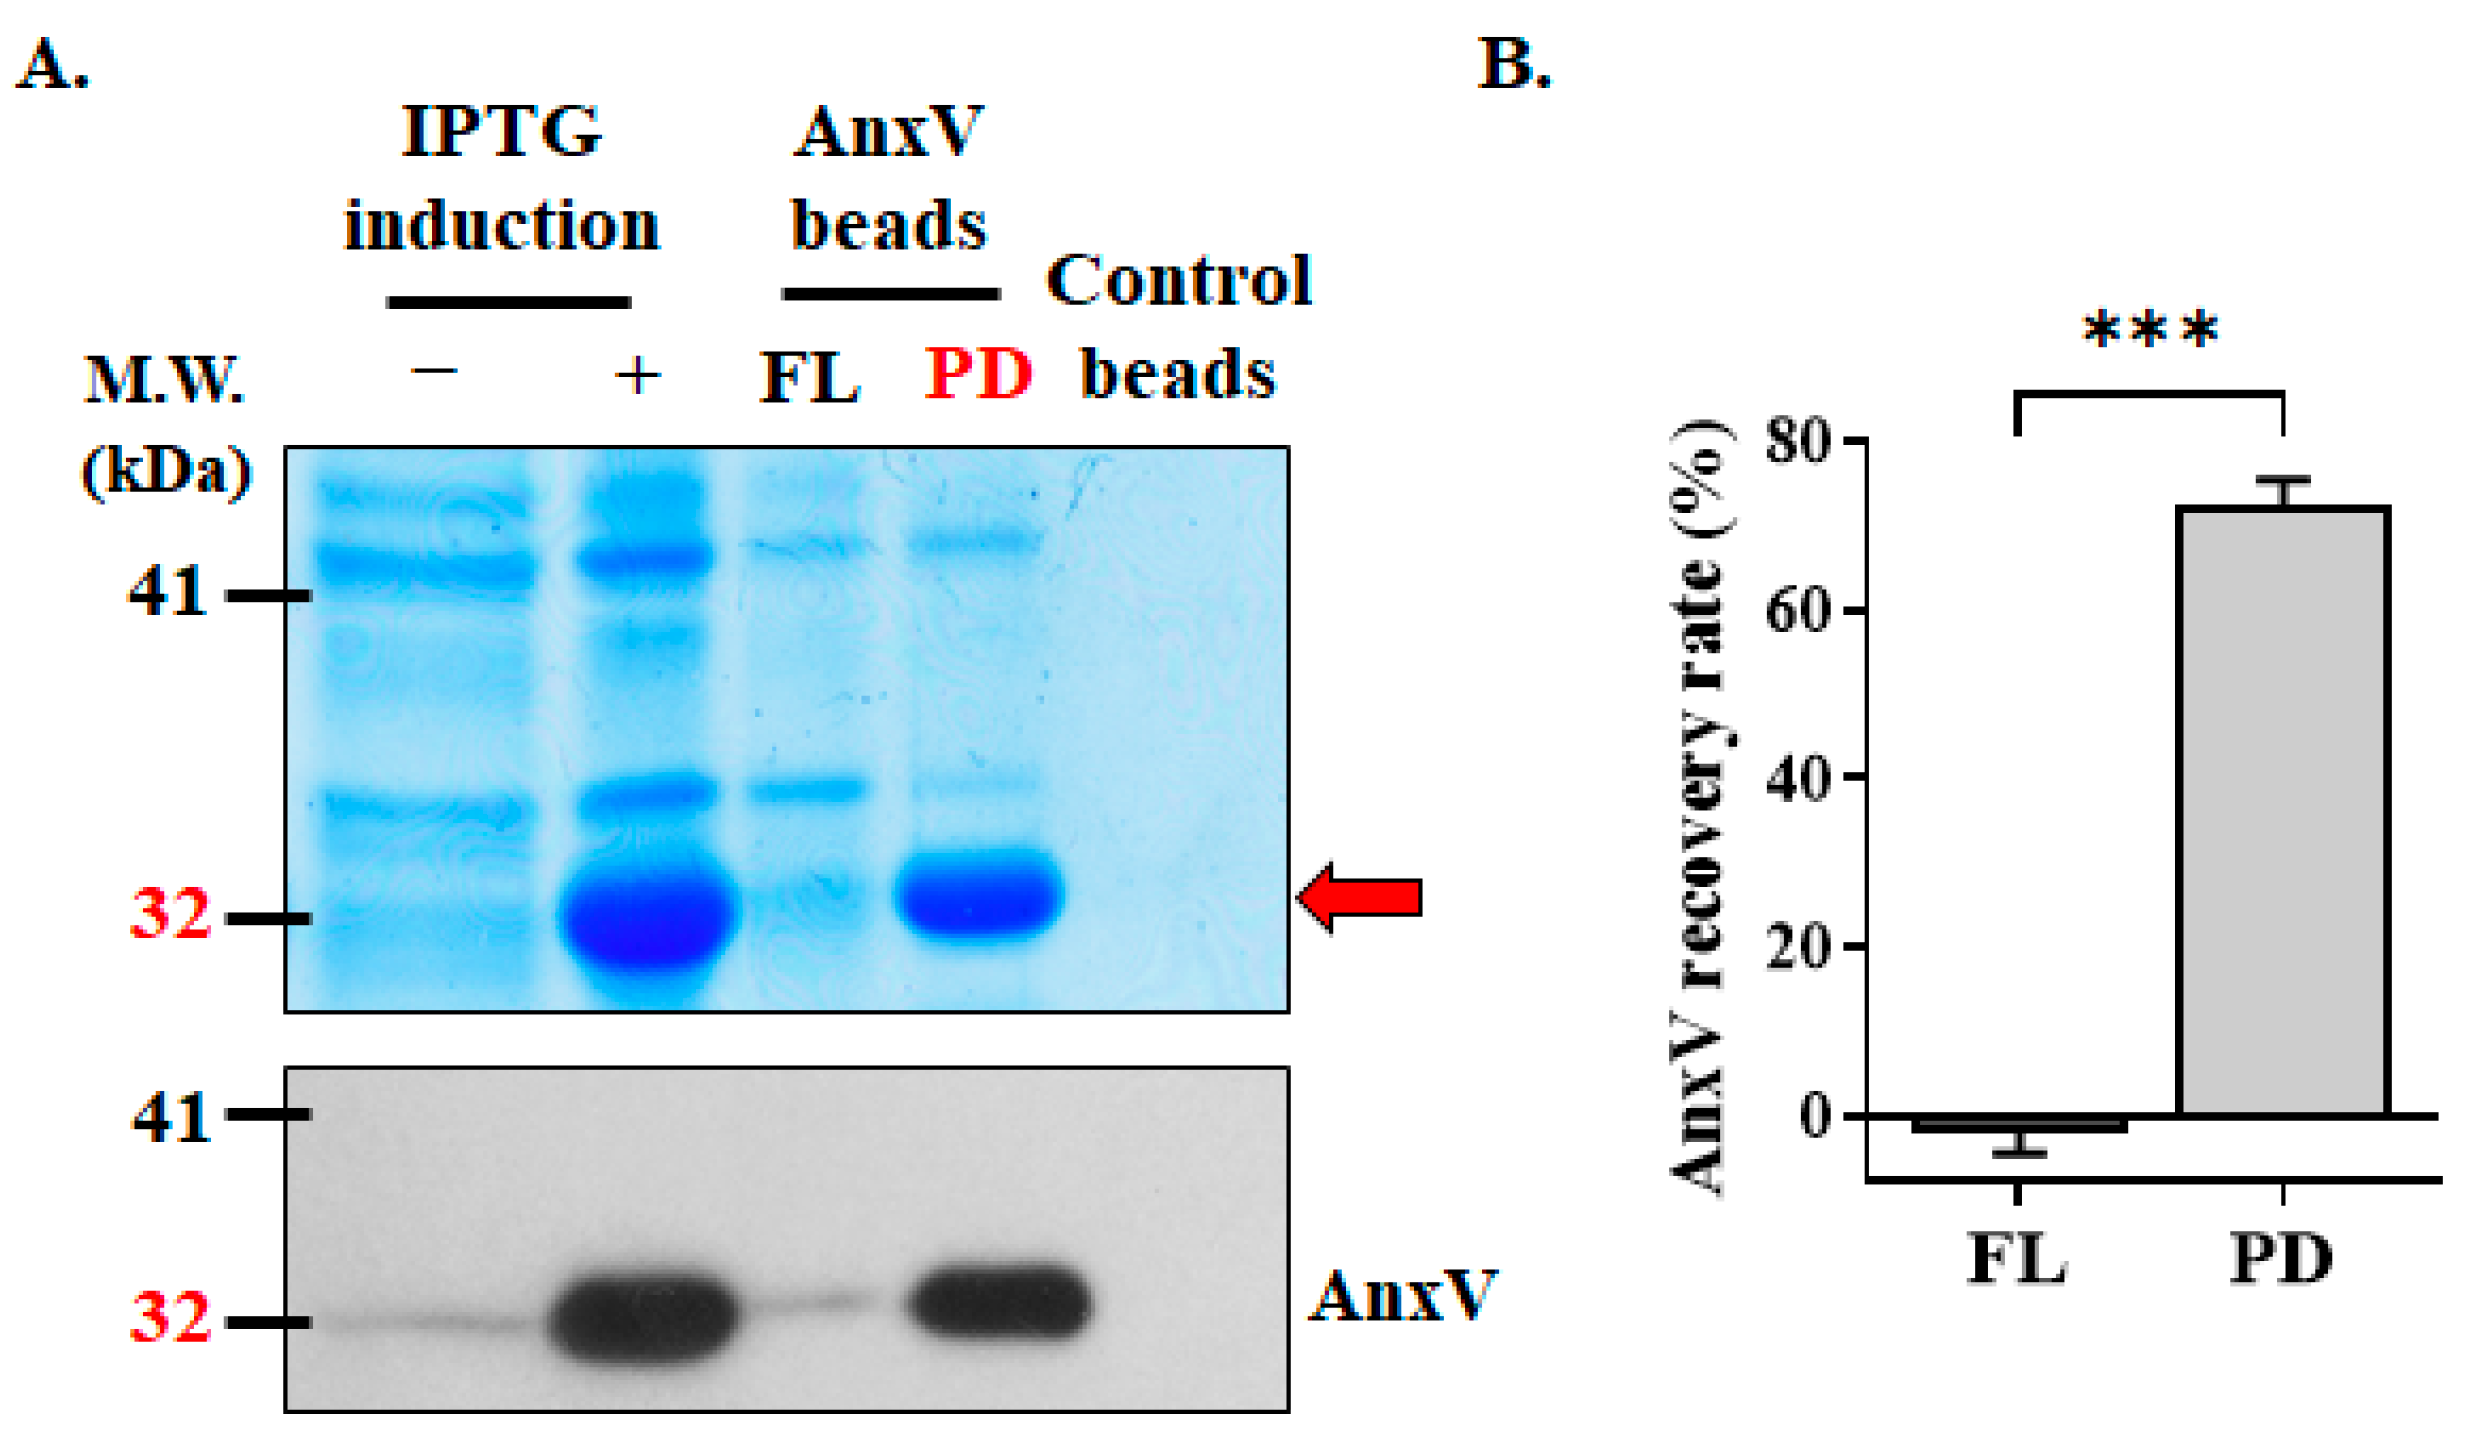
3.2. Preparation of In-House AnxV Beads for Binding and Elimination of Apoptotic Cells
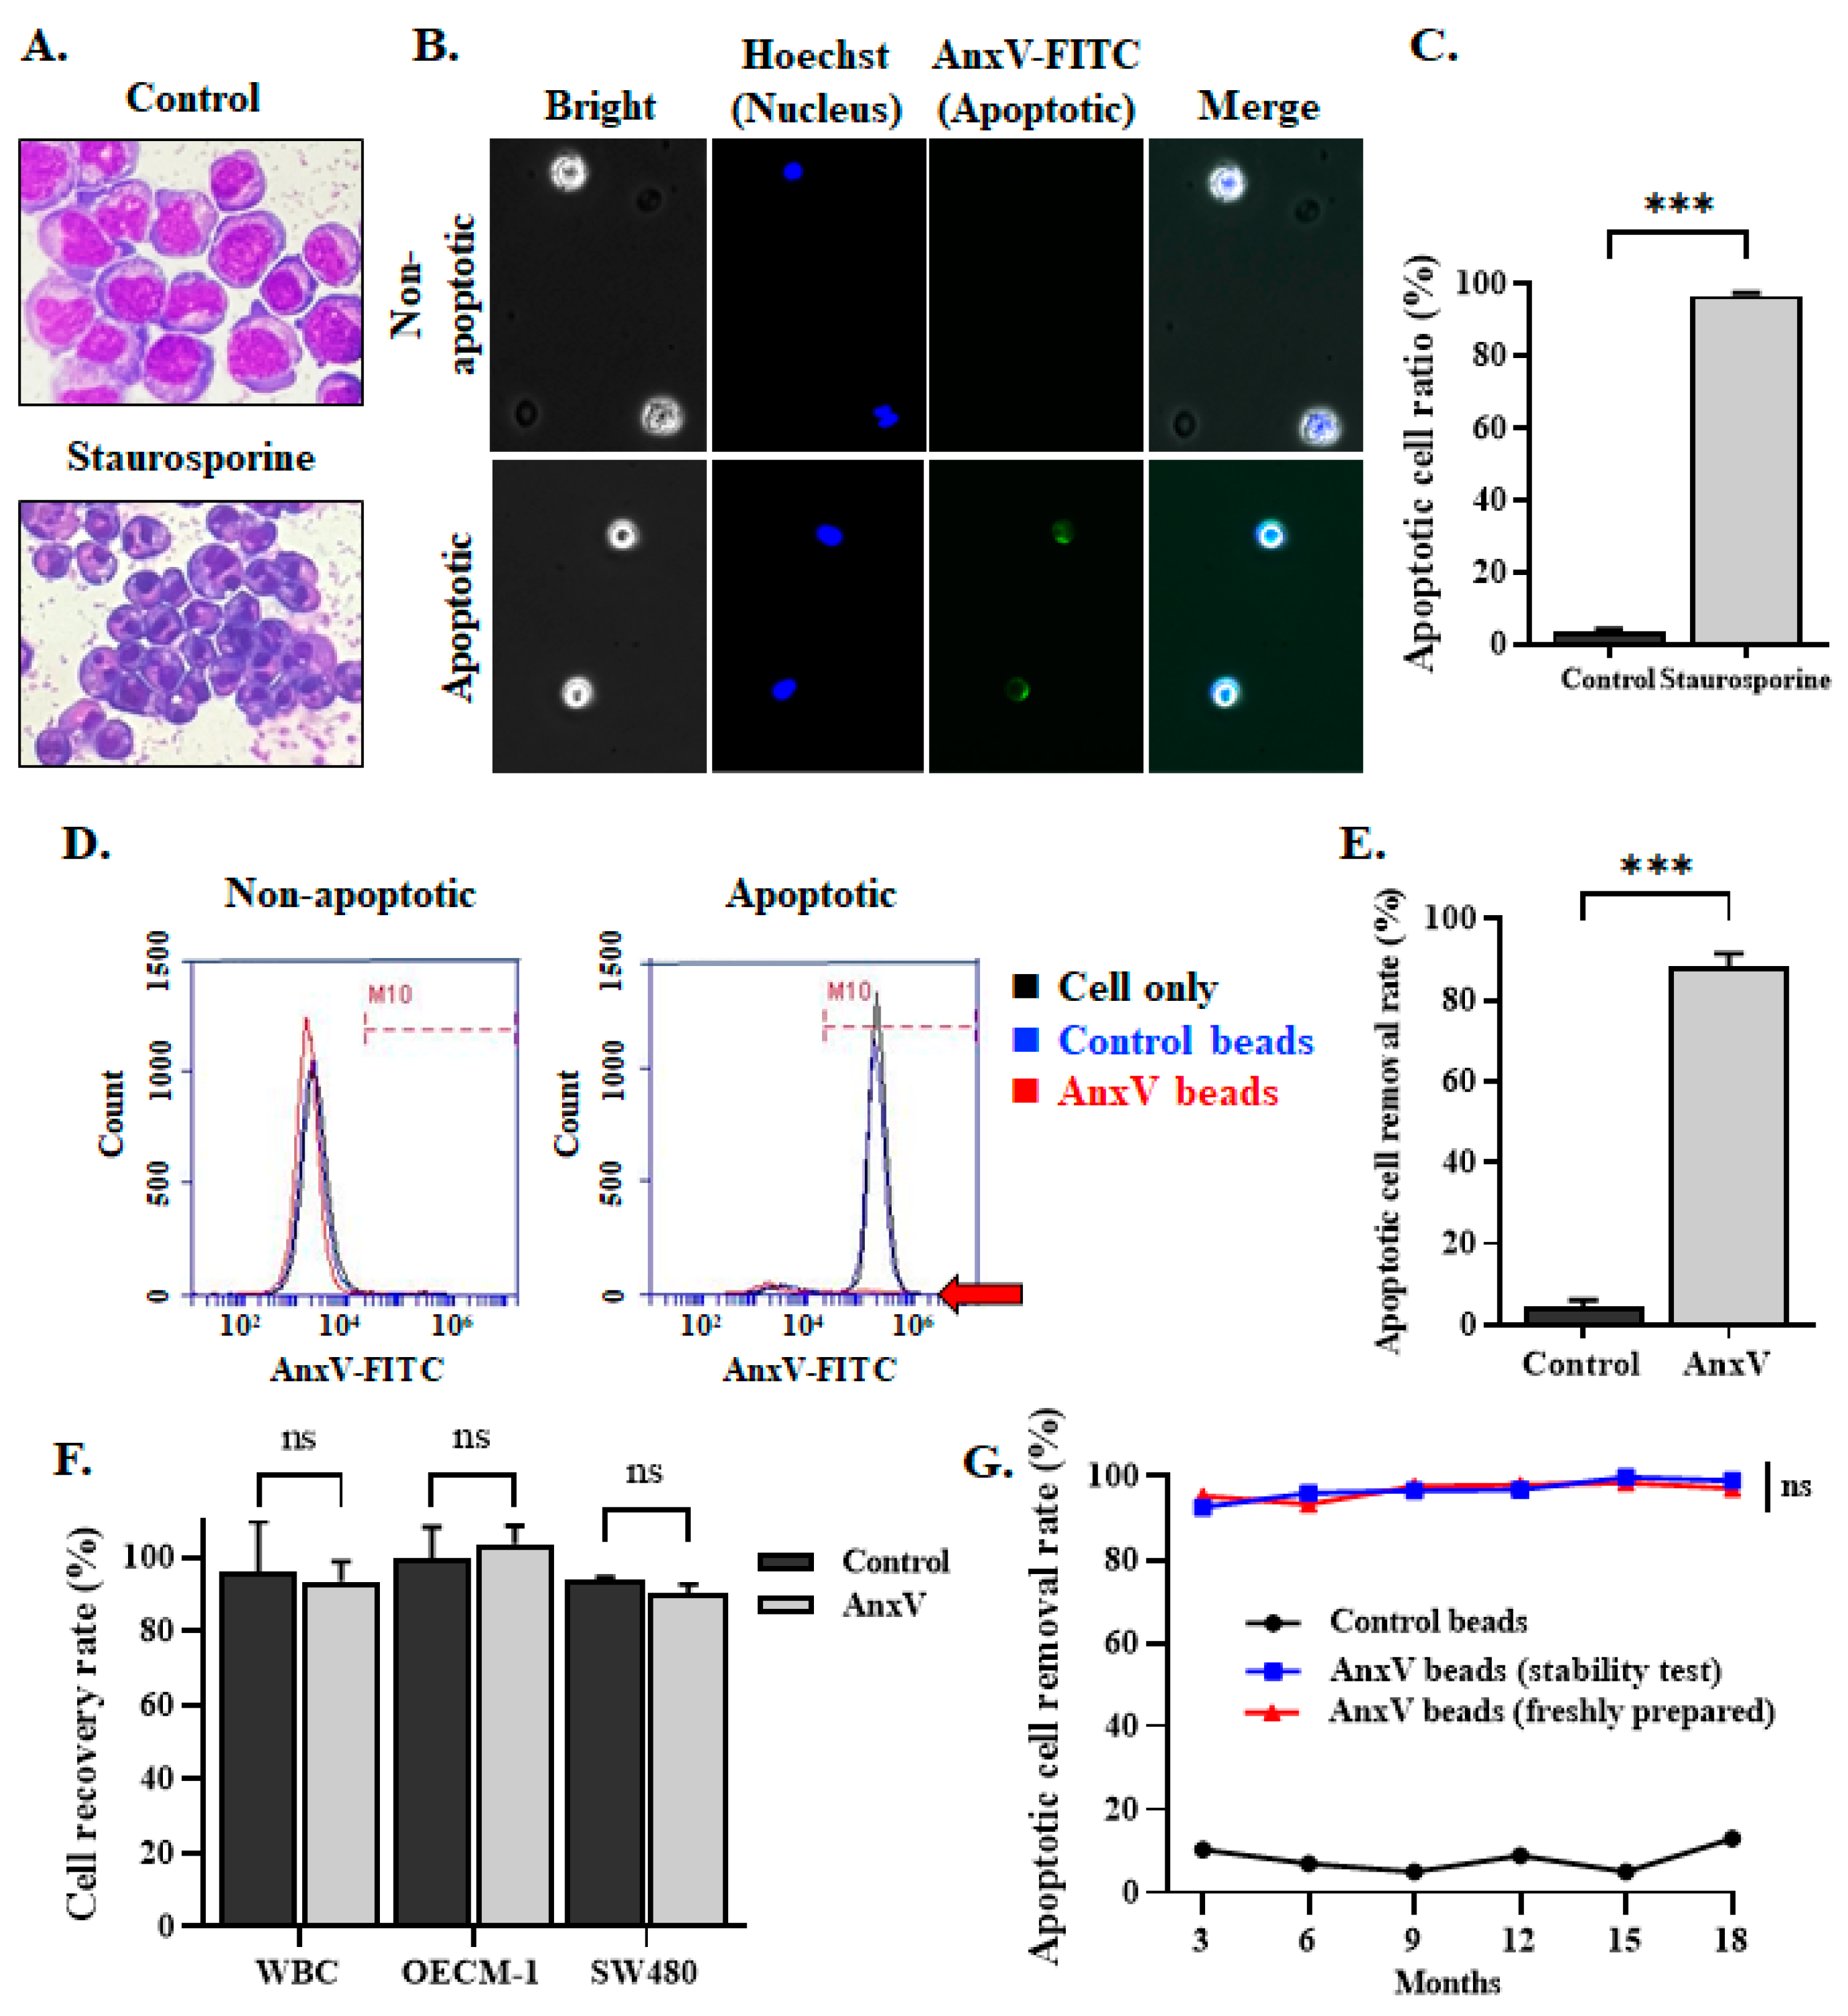
3.3. Integration of AnxV Beads into PM Effectively Depletes the Apoptotic Cells in the Cell Filtrates
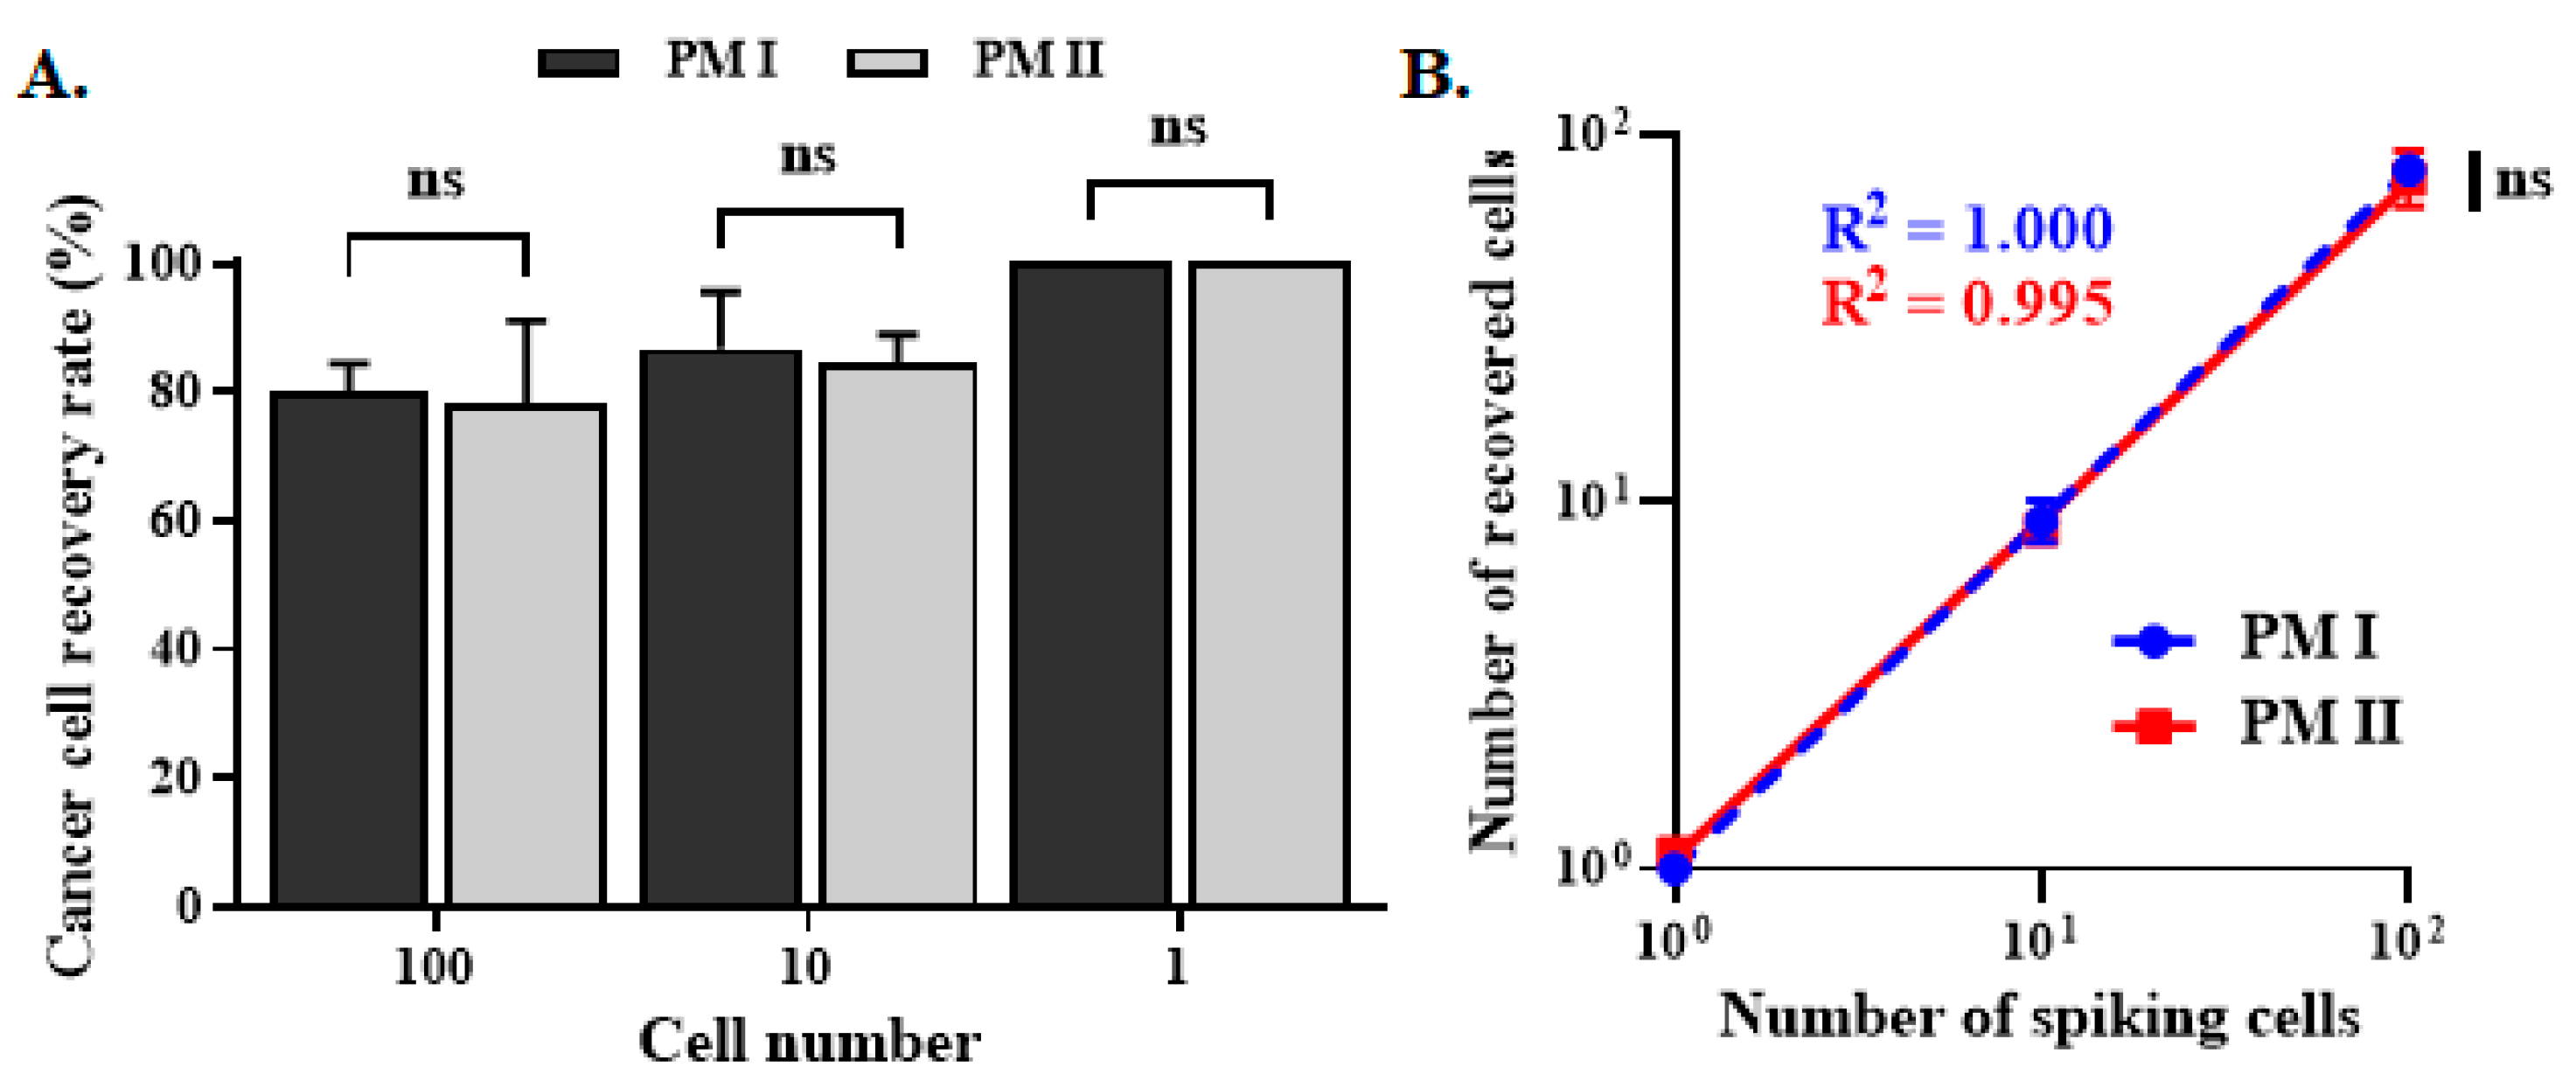
3.4. CTC Enumeration and Mutant Gene Detection of Clinical Specimens with PM II
4. Discussion
5. Conclusions
Author Contributions
Funding
Institutional Review Board Statement
Informed Consent Statement
Data Availability Statement
Acknowledgments
Conflicts of Interest
References
- Ashworth, T.R. A case of cancer in which cells similar to those in the tumors were seen in the blood after death. Aust. Med. J. 1869, 14, 146–147. [Google Scholar]
- Olmos, D.; Baird, R.D.; Yap, T.A.; Massard, C.; Pope, L.; Sandhu, S.K.; Attard, G.; Dukes, J.; Papadatos-Pastos, D.; Grainger, P.; et al. Baseline circulating tumor cell counts significantly enhance a prognostic score for patients participating in phase I oncology trials. Clin. Cancer Res. 2011, 17, 5188–5196. [Google Scholar] [CrossRef]
- Cristofanilli, M. Circulating tumor cells, disease progression, and survival in metastatic breast cancer. Semin. Oncol. 2006, 33, S9–S14. [Google Scholar] [CrossRef] [PubMed]
- Chaffer, C.L.; Weinberg, R.A. A perspective on cancer cell metastasis. Science 2011, 331, 1559–1564. [Google Scholar] [CrossRef] [PubMed]
- Shegekar, T.; Vodithala, S.; Juganavar, A. The emerging role of liquid biopsies in revolutionising cancer diagnosis and therapy. Cureus 2023, 15, e43650. [Google Scholar] [CrossRef]
- Martins, I.; Ribeiro, I.P.; Jorge, J.; Goncalves, A.C.; Sarmento-Ribeiro, A.B.; Melo, J.B.; Carreira, I.M. Liquid biopsies: Applications for cancer diagnosis and monitoring. Genes 2021, 12, 349. [Google Scholar] [CrossRef] [PubMed]
- Xie, W.; Suryaprakash, S.; Wu, C.; Rodriguez, A.; Fraterman, S. Trends in the use of liquid biopsy in oncology. Nat. Rev. Drug Discov. 2023, 22, 612–613. [Google Scholar] [CrossRef]
- Millner, L.M.; Linder, M.W.; Valdes, R., Jr. Circulating tumor cells: A review of present methods and the need to identify heterogeneous phenotypes. Ann. Clin. Lab. Sci. 2013, 43, 295–304. [Google Scholar]
- Banko, P.; Lee, S.Y.; Nagygyorgy, V.; Zrinyi, M.; Chae, C.H.; Cho, D.H.; Telekes, A. Technologies for circulating tumor cell separation from whole blood. J. Hematol. Oncol. 2019, 12, 48. [Google Scholar] [CrossRef]
- Vidlarova, M.; Rehulkova, A.; Stejskal, P.; Prokopova, A.; Slavik, H.; Hajduch, M.; Srovnal, J. Recent advances in methods for circulating tumor cell detection. Int. J. Mol. Sci. 2023, 24, 3902. [Google Scholar] [CrossRef]
- De Giorgi, V.; Pinzani, P.; Salvianti, F.; Panelos, J.; Paglierani, M.; Janowska, A.; Grazzini, M.; Wechsler, J.; Orlando, C.; Santucci, M.; et al. Application of a filtration- and isolation-by-size technique for the detection of circulating tumor cells in cutaneous melanoma. J. Investig. Dermatol. 2010, 130, 2440–2447. [Google Scholar] [CrossRef]
- Griwatz, C.; Brandt, B.; Assmann, G.; Zanker, K.S. An immunological enrichment method for epithelial cells from peripheral blood. J. Immunol. Methods 1995, 183, 251–265. [Google Scholar] [CrossRef] [PubMed]
- Desitter, I.; Guerrouahen, B.S.; Benali-Furet, N.; Wechsler, J.; Janne, P.A.; Kuang, Y.; Yanagita, M.; Wang, L.; Berkowitz, J.A.; Distel, R.J.; et al. A new device for rapid isolation by size and characterization of rare circulating tumor cells. Anticancer Res. 2011, 31, 427–441. [Google Scholar]
- Sequist, L.V.; Nagrath, S.; Toner, M.; Haber, D.A.; Lynch, T.J. The CTC-chip: An exciting new tool to detect circulating tumor cells in lung cancer patients. J. Thorac. Oncol. 2009, 4, 281–283. [Google Scholar] [CrossRef] [PubMed]
- Deng, G.; Herrler, M.; Burgess, D.; Manna, E.; Krag, D.; Burke, J.F. Enrichment with anti-cytokeratin alone or combined with anti-EpCAM antibodies significantly increases the sensitivity for circulating tumor cell detection in metastatic breast cancer patients. Breast Cancer Res. 2008, 10, R69. [Google Scholar] [CrossRef] [PubMed]
- Lin, H.C.; Hsu, H.C.; Hsieh, C.H.; Wang, H.M.; Huang, C.Y.; Wu, M.H.; Tseng, C.P. A negative selection system PowerMag for effective leukocyte depletion and enhanced detection of EpCAM positive and negative circulating tumor cells. Clin. Chim. Acta 2013, 419, 77–84. [Google Scholar] [CrossRef]
- Miller, M.C.; Doyle, G.V.; Terstappen, L.W. Significance of circulating tumor cells detected by the CellSearch system in patients with metastatic breast, colorectal and prostate Cancer. J. Oncol. 2010, 2010, 617421. [Google Scholar] [CrossRef]
- Nagrath, S.; Sequist, L.V.; Maheswaran, S.; Bell, D.W.; Irimia, D.; Ulkus, L.; Smith, M.R.; Kwak, E.L.; Digumarthy, S.; Muzikansky, A.; et al. Isolation of rare circulating tumour cells in cancer patients by microchip technology. Nature 2007, 450, 1235–1239. [Google Scholar] [CrossRef]
- Hsieh, J.C.; Lin, H.C.; Huang, C.Y.; Hsu, H.L.; Wu, T.M.; Lee, C.L.; Chen, M.C.; Wang, H.M.; Tseng, C.P. Prognostic value of circulating tumor cells with podoplanin expression in patients with locally advanced or metastatic head and neck squamous cell carcinoma. Head Neck 2015, 37, 1448–1455. [Google Scholar] [CrossRef] [PubMed]
- Lin, H.C.; Liou, M.J.; Hsu, H.L.; Hsieh, J.C.; Chen, Y.A.; Tseng, C.P.; Lin, J.D. Combined analysis of circulating epithelial cells and serum thyroglobulin for distinguishing disease status of the patients with papillary thyroid carcinoma. Oncotarget 2016, 7, 17242–17253. [Google Scholar] [CrossRef]
- Hsieh, C.H.; Lin, H.C.; Huang, S.B.; Hsueh, C.; Hsu, H.L.; Wang, H.M.; Wu, M.H.; Tseng, C.P.; Lin, J.D. Circulating epithelial cell enumeration facilitates the identification and follow-up of a patient with early stage papillary thyroid microcarcinoma: A case report. Clin. Chim. Acta 2016, 454, 107–111. [Google Scholar] [CrossRef] [PubMed]
- Tseng, C.P.; Leong, K.K.; Liou, M.J.; Hsu, H.L.; Lin, H.C.; Chen, Y.A.; Lin, J.D. Circulating epithelial cell counts for monitoring the therapeutic outcome of patients with papillary thyroid carcinoma. Oncotarget 2017, 8, 77453–77464. [Google Scholar] [CrossRef] [PubMed]
- Li, Y.R.; Tseng, C.P.; Hsu, H.L.; Lin, H.C.; Chen, Y.A.; Chen, S.T.; Liou, M.J.; Lin, J.D. Circulating epithelial cells as potential biomarkers for detection of recurrence in patients of papillary thyroid carcinoma with positive serum anti-thyroglobulin antibody. Clin. Chim. Acta 2018, 477, 74–80. [Google Scholar] [CrossRef]
- Lin, J.D.; Liou, M.J.; Hsu, H.L.; Leong, K.K.; Chen, Y.T.; Wang, Y.R.; Hung, W.S.; Lee, H.Y.; Tsai, H.J.; Tseng, C.P. Circulating epithelial cell characterization and correlation with remission and survival in patients with thyroid cancer. Thyroid 2018, 28, 1479–1489. [Google Scholar] [CrossRef] [PubMed]
- Rau, K.M.; Liu, C.T.; Hsiao, Y.C.; Hsiao, K.Y.; Wang, T.M.; Hung, W.S.; Su, Y.L.; Liu, W.C.; Wang, C.H.; Hsu, H.L.; et al. Sequential circulating tumor cell counts in patients with locally advanced or metastatic hepatocellular ccarcinoma: Monitoring the treatment response. J. Clin. Med. 2020, 9, 188. [Google Scholar] [CrossRef]
- Tsai, W.S.; Hung, W.S.; Wang, T.M.; Liu, H.; Yang, C.Y.; Wu, S.M.; Hsu, H.L.; Hsiao, Y.C.; Tsai, H.J.; Tseng, C.P. Circulating tumor cell enumeration for improved screening and disease detection of patients with colorectal cancer. Biomed. J. 2021, 44, S190–S200. [Google Scholar] [CrossRef] [PubMed]
- Liu, Z.; Fusi, A.; Klopocki, E.; Schmittel, A.; Tinhofer, I.; Nonnenmacher, A.; Keilholz, U. Negative enrichment by immunomagnetic nanobeads for unbiased characterization of circulating tumor cells from peripheral blood of cancer patients. J. Transl. Med. 2011, 9, 70. [Google Scholar] [CrossRef] [PubMed]
- Yang, L.; Lang, J.C.; Balasubramanian, P.; Jatana, K.R.; Schuller, D.; Agrawal, A.; Zborowski, M.; Chalmers, J.J. Optimization of an enrichment process for circulating tumor cells from the blood of head and neck cancer patients through depletion of normal cells. Biotechnol. Bioeng. 2009, 102, 521–534. [Google Scholar] [CrossRef]
- Wang, M.C.; Gong, G.Y.; Wang, C.L.; Ko, H.W.; Weng, R.X.; Chang, P.Y.; Chiou, C.C. Methods for collection of extracellular vesicles and their content RNA as liquid biopsy for lung cancer detection: Application of differential centrifugation and annexin A5 coated beads. Curr. Issues Mol. Biol. 2022, 44, 2374–2386. [Google Scholar] [CrossRef]
- English, D.; Andersen, B.R. Single-step separation of red blood cells. Granulocytes and mononuclear leukocytes on discontinuous density gradients of Ficoll-Hypaque. J. Immunol. Methods 1974, 5, 249–252. [Google Scholar] [CrossRef]
- Lanotte, M.; Martin-Thouvenin, V.; Najman, S.; Balerini, P.; Valensi, F.; Berger, R. NB4, a maturation inducible cell line with t(15;17) marker isolated from a human acute promyelocytic leukemia (M3). Blood 1991, 77, 1080–1086. [Google Scholar] [CrossRef] [PubMed]
- Picard, L.K.; Claus, M.; Fasbender, F.; Watzl, C. Human NK cells responses are enhanced by CD56 engagement. Eur. J. Immunol. 2022, 52, 1441–1451. [Google Scholar] [CrossRef] [PubMed]
- Xu, C.; Gu, X.; Padmanabhan, R.; Wu, Z.; Peng, Q.; DiCarlo, J.; Wang, Y. smCounter2: An accurate low-frequency variant caller for targeted sequencing data with unique molecular identifiers. Bioinformatics 2019, 35, 1299–1309. [Google Scholar] [CrossRef] [PubMed]
- Danecek, P.; Bonfield, J.K.; Liddle, J.; Marshall, J.; Ohan, V.; Pollard, M.O.; Whitwham, A.; Keane, T.; McCarthy, S.A.; Davies, R.M.; et al. Twelve years of SAMtools and BCFtools. GigaScience 2021, 10, giab008. [Google Scholar] [CrossRef] [PubMed]
- Quinlan, A.R.; Hall, I.M. BEDTools: A flexible suite of utilities for comparing genomic features. Bioinformatics 2010, 26, 841–842. [Google Scholar] [CrossRef]
- Khanna, A.; Larson, D.E.; Srivatsan, S.N.; Mosior, M.; Abbott, T.E.; Kiwala, S.; Ley, T.J.; Duncavage, E.J.; Walter, M.J.; Walker, J.R.; et al. Bam-readcount—Rapid generation of basepair-resolution sequence metrics. arXiv 2021, arXiv:2107.12817v1. [Google Scholar] [CrossRef]
- Bisong, E. Google Colaboratory. In Building Machine Learning and Deep Learning Models on Google Cloud Platform: A Comprehensive Guide for Beginners; Apress: Berkeley, CA, USA, 2019; pp. 59–64. [Google Scholar] [CrossRef]
- Chang, X.; Wang, K. wANNOVAR: Annotating genetic variants for personal genomes via the web. J. Med. Genet. 2012, 49, 433–436. [Google Scholar] [CrossRef]
- Sherry, S.T.; Ward, M.H.; Kholodov, M.; Baker, J.; Phan, L.; Smigielski, E.M.; Sirotkin, K. dbSNP: The NCBI database of genetic variation. Nucleic Acids Res. 2001, 29, 308–311. [Google Scholar] [CrossRef] [PubMed]
- Forbes, S.A.; Bhamra, G.; Bamford, S.; Dawson, E.; Kok, C.; Clements, J.; Menzies, A.; Teague, J.W.; Futreal, P.A.; Stratton, M.R. The Catalogue of Somatic Mutations in Cancer (COSMIC). Curr. Protoc. Hum. Genet. 2008, 57, 10.11.1–10.11.26. [Google Scholar] [CrossRef] [PubMed]
- Landrum, M.J.; Lee, J.M.; Benson, M.; Brown, G.R.; Chao, C.; Chitipiralla, S.; Gu, B.; Hart, J.; Hoffman, D.; Jang, W.; et al. ClinVar: Improving access to variant interpretations and supporting evidence. Nucleic Acids Res. 2017, 46, D1062–D1067. [Google Scholar] [CrossRef] [PubMed]
- Feng, Z.; Wu, J.; Lu, Y.; Chan, Y.T.; Zhang, C.; Wang, D.; Luo, D.; Huang, Y.; Feng, Y.; Wang, N. Circulating tumor cells in the early detection of human cancers. Int. J. Biol. Sci. 2022, 18, 3251–3265. [Google Scholar] [CrossRef] [PubMed]
- Ried, K.; Eng, P.; Sali, A. Screening for circulating tumour cells allows early detection of cancer and monitoring of treatment effectiveness: An observational study. Asian Pac. J. Cancer Prev. 2017, 18, 2275–2285. [Google Scholar] [CrossRef]
- Ko, J.M.Y.; Lam, K.O.; Kwong, D.L.W.; Wong, I.Y.; Chan, F.S.; Wong, C.L.; Chan, K.K.; Law, T.T.; Chiu, K.W.H.; Lam, C.C.S.; et al. Circulating tumor cell enumeration for serial monitoring of treatment outcomes for locally advanced esophageal squamous cell carcinoma. Cancers 2023, 15, 832. [Google Scholar] [CrossRef] [PubMed]
- Dhaka, S.; Tripathi, R.; Doval, D.C.; Mehta, A.; Maheshwari, U.; Koyyala, V.P.B.; Singh, J. Role of circulating tumor cells in determining prognosis in metastatic breast cancer. S. Asian J. Cancer 2023, 12, 62–67. [Google Scholar] [CrossRef] [PubMed]
- Nanduri, L.K.; Hissa, B.; Weitz, J.; Scholch, S.; Bork, U. The prognostic role of circulating tumor cells in colorectal cancer. Expert. Rev. Anticancer. Ther. 2019, 19, 1077–1088. [Google Scholar] [CrossRef]
- de Wit, S.; van Dalum, G.; Lenferink, A.T.; Tibbe, A.G.; Hiltermann, T.J.; Groen, H.J.; van Rijn, C.J.; Terstappen, L.W. The detection of EpCAM(+) and EpCAM(-) circulating tumor cells. Sci. Rep. 2015, 5, 12270. [Google Scholar] [CrossRef]
- Harb, W.; Fan, A.; Tran, T.; Danila, D.C.; Keys, D.; Schwartz, M.; Ionescu-Zanetti, C. Mutational analysis of circulating tumor cells using a novel microfluidic collection device and qPCR assay. Transl. Oncol. 2013, 6, 528–538. [Google Scholar] [CrossRef]
- Wu, Y.; Deighan, C.J.; Miller, B.L.; Balasubramanian, P.; Lustberg, M.B.; Zborowski, M.; Chalmers, J.J. Isolation and analysis of rare cells in the blood of cancer patients using a negative depletion methodology. Methods 2013, 64, 169–182. [Google Scholar] [CrossRef]
- Ozkumur, E.; Shah, A.M.; Ciciliano, J.C.; Emmink, B.L.; Miyamoto, D.T.; Brachtel, E.; Yu, M.; Chen, P.I.; Morgan, B.; Trautwein, J.; et al. Inertial focusing for tumor antigen-dependent and -independent sorting of rare circulating tumor cells. Sci. Transl. Med. 2013, 5, 179ra147. [Google Scholar] [CrossRef] [PubMed]
- Li, P.; Mao, Z.; Peng, Z.; Zhou, L.; Chen, Y.; Huang, P.H.; Truica, C.I.; Drabick, J.J.; El-Deiry, W.S.; Dao, M.; et al. Acoustic separation of circulating tumor cells. Proc. Natl. Acad. Sci. USA 2015, 112, 4970–4975. [Google Scholar] [CrossRef]
- Nelep, C.; Eberhardt, J. Automated rare single cell picking with the ALS cellcelector. Cytom. Part A 2018, 93, 1267–1270. [Google Scholar] [CrossRef] [PubMed]
- Kamal, M.; Saremi, S.; Klotz, R.; Iriondo, O.; Amzaleg, Y.; Chairez, Y.; Tulpule, V.; Lang, J.E.; Kang, I.; Yu, M. PIC&RUN: An integrated assay for the detection and retrieval of single viable circulating tumor cells. Sci. Rep. 2019, 9, 17470. [Google Scholar] [CrossRef]
- Campton, D.E.; Ramirez, A.B.; Nordberg, J.J.; Drovetto, N.; Clein, A.C.; Varshavskaya, P.; Friemel, B.H.; Quarre, S.; Breman, A.; Dorschner, M.; et al. High-recovery visual identification and single-cell retrieval of circulating tumor cells for genomic analysis using a dual-technology platform integrated with automated immunofluorescence staining. BMC Cancer 2015, 15, 360. [Google Scholar] [CrossRef] [PubMed]
- Cushing, K.; Undvall, E.; Ceder, Y.; Lilja, H.; Laurell, T. Reducing WBC background in cancer cell separation products by negative acoustic contrast particle immuno-acoustophoresis. Anal. Chim. Acta 2018, 1000, 256–264. [Google Scholar] [CrossRef]
- Manion, K.; Frey, T. Apoptosis of cells in aged samples as detected by the ProCOUNT reagent. Cytometry 1996, 26, 317–322. [Google Scholar] [CrossRef]
- Dransfield, I.; Buckle, A.M.; Savill, J.S.; McDowall, A.; Haslett, C.; Hogg, N. Neutrophil apoptosis is associated with a reduction in CD16 (Fc gamma RIII) expression. J. Immunol. 1994, 153, 1254–1263. [Google Scholar] [CrossRef] [PubMed]
- Dransfield, I.; Stocks, S.C.; Haslett, C. Regulation of cell adhesion molecule expression and function associated with neutrophil apoptosis. Blood 1995, 85, 3264–3273. [Google Scholar] [CrossRef]
- Giraldez, M.D.; Balaguer, F.; Bujanda, L.; Cuatrecasas, M.; Munoz, J.; Alonso-Espinaco, V.; Larzabal, M.; Petit, A.; Gonzalo, V.; Ocana, T.; et al. MSH6 and MUTYH deficiency is a frequent event in early-onset colorectal cancer. Clin. Cancer Res. 2010, 16, 5402–5413. [Google Scholar] [CrossRef] [PubMed]
- Shen, N.; Li, L.; Xu, W.; Tian, J.; Yang, Y.; Zhu, Y.; Gong, Y.; Ke, J.; Gong, J.; Chang, J.; et al. A missense variant in PTPN12 associated with the risk of colorectal cancer by modifying Ras/MEK/ERK signaling. Cancer Epidemiol. 2019, 59, 109–114. [Google Scholar] [CrossRef]
- Allen, T.A. The role of circulating tumor cells as a liquid biopsy for cancer: Advances, biology, technical challenges, and clinical relevance. Cancers 2024, 16, 1377. [Google Scholar] [CrossRef]
- Larson, C.J.; Moreno, J.G.; Pienta, K.J.; Gross, S.; Repollet, M.; O’hara, S.M.; Russell, T.; Terstappen, L.W. Apoptosis of circulating tumor cells in prostate cancer patients. Cytom. Part A 2004, 62, 46–53. [Google Scholar] [CrossRef] [PubMed]
- Kolenčík, D.; Narayan, S.; Thiele, J.A.; McKinley, D.; Gerdtsson, A.S.; Welter, L.; Hošek, P.; Ostašov, P.; Vyčítal, O.; Brůha, J.; et al. Circulating tumor cell kinetics and morphology from the liquid biopsy predict disease progression in patients with metastatic colorectal cancer following resection. Cancers 2022, 14, 642. [Google Scholar] [CrossRef] [PubMed]
- Qin, J.; Alt, J.R.; Hunsley, B.A.; Williams, T.L.; Fernando, M.R. Stabilization of circulating tumor cells in blood using a collection device with a preservative reagent. Cancer Cell Int. 2014, 14, 23. [Google Scholar] [CrossRef] [PubMed]
- Kallergi, G.; Konstantinidis, G.; Markomanolaki, H.; Papadaki, M.A.; Mavroudis, D.; Stournaras, C.; Georgoulias, V.; Agelaki, S. Apoptotic circulating tumor cells in early and metastatic breast cancer patients. Mol. Cancer Ther. 2013, 12, 1886–1895. [Google Scholar] [CrossRef] [PubMed]
- Grigoryeva, E.S.; Tashireva, L.A.; Alifanov, V.V.; Savelieva, O.E.; Vtorushin, S.V.; Zavyalova, M.V.; Cherdyntseva, N.V.; Perelmuter, V.M. The novel association of early apoptotic circulating tumor cells with treatment outcomes in breast cancer patients. Int. J. Mol. Sci. 2022, 23, 9475. [Google Scholar] [CrossRef]


| Sample | PM I | PM II | Improvement of Purity a | ||||
|---|---|---|---|---|---|---|---|
| Total Cell Number | CTCs Count | Purity | Total Cell Number | Ctcs Count | Purity | ||
| 1 | 49,623 | 2 | 0.004% | 3739 | 4 | 0.107% | 2575% |
| 2 | 4338 | 7 | 0.16% | 610 | 4 | 0.66% | 313% |
| 3 | 20,985 | 8 | 0.04% | 4390 | 3 | 0.07% | 75% |
| 4 | 29,706 | 7 | 0.02% | 4531 | 3 | 0.07% | 250% |
| 5 | 60,210 | 14 | 0.023% | 20,084 | 7 | 0.035% | 52% |
| 6 | 46,168 | 0 | 0.00% | 3081 | 1 | 0.032% | NA b |
| 7 | 32,622 | 0 | 0.00% | 6546 | 1 | 0.015% | NA |
| 8 | 17,641 | 0 | 0.00% | 6550 | 0 | 0.00% | NA |
| 9 | 6561 | 0 | 0.00% | 1553 | 0 | 0.00% | NA |
| ClinVar Database Colorectal-Related “Pathogenic Position” | Read Counts | |||||
|---|---|---|---|---|---|---|
| Sample | Gene Name | Gene Alternation | Protein Alternation | PM I | PM II | Improvement a |
| 1 | MUTYH | c.1103-2A>G | - | 13 | 100 | 669% |
| c.548G>A | p.Gly183Asp | 26 | 107 | 312% | ||
| c.544C>T | p.Arg182Cys | 9 | 110 | 1122% | ||
| c.452A>G | p.Tyr151Cys | 37 | 160 | 332% | ||
| MSH2 | c.942+2T>G | p.Leu310Pro | 724 | 942 | 30.8% | |
| MSH6 | c.718C>T | p.Arg240Ter | 78 | 134 | 71.8% | |
| PTPN12 | c.182A>G | p.Lys61Arg | 72 | 109 | 51.4% | |
| 2 | MSH2 | c.942+2T>G | p.Leu310Pro | 249 | 450 | 80.7% |
| 3 | MSH2 | c.942+2T>G | p.Leu310Pro | 166 | 212 | 27.7% |
| 4 | MSH6 | c.718C>T | p.Arg240Ter | 357 | 557 | 64.1% |
Disclaimer/Publisher’s Note: The statements, opinions and data contained in all publications are solely those of the individual author(s) and contributor(s) and not of MDPI and/or the editor(s). MDPI and/or the editor(s) disclaim responsibility for any injury to people or property resulting from any ideas, methods, instructions or products referred to in the content. |
© 2025 by the authors. Licensee MDPI, Basel, Switzerland. This article is an open access article distributed under the terms and conditions of the Creative Commons Attribution (CC BY) license (https://creativecommons.org/licenses/by/4.0/).
Share and Cite
Ho, C.-R.; Tsai, H.-J.; Wang, J.-R.; Wang, C.-T.; Chiou, C.-C.; Cheng, J.-C.; Chiang, S.-F.; Tseng, C.-P. Development of PowerMag System II for Isolation of Circulating Tumor Cells with Improved Purity. Biomedicines 2025, 13, 431. https://doi.org/10.3390/biomedicines13020431
Ho C-R, Tsai H-J, Wang J-R, Wang C-T, Chiou C-C, Cheng J-C, Chiang S-F, Tseng C-P. Development of PowerMag System II for Isolation of Circulating Tumor Cells with Improved Purity. Biomedicines. 2025; 13(2):431. https://doi.org/10.3390/biomedicines13020431
Chicago/Turabian StyleHo, Cheng-Rou, Hui-Ju Tsai, Jin-Ru Wang, Chia-Te Wang, Chiuan-Chian Chiou, Ju-Chien Cheng, Sum-Fu Chiang, and Ching-Ping Tseng. 2025. "Development of PowerMag System II for Isolation of Circulating Tumor Cells with Improved Purity" Biomedicines 13, no. 2: 431. https://doi.org/10.3390/biomedicines13020431
APA StyleHo, C.-R., Tsai, H.-J., Wang, J.-R., Wang, C.-T., Chiou, C.-C., Cheng, J.-C., Chiang, S.-F., & Tseng, C.-P. (2025). Development of PowerMag System II for Isolation of Circulating Tumor Cells with Improved Purity. Biomedicines, 13(2), 431. https://doi.org/10.3390/biomedicines13020431