Patient Demographics
In
Table 1, the demographic and clinical characteristics of patients with both COVID-19 and CDI are compared to those with COVID-19 alone. The average age of patients in the COVID and CDI group was 68.7 years (±12.9) compared to 66.2 years (±11.7) in the COVID-only group, although this difference was not statistically significant (
p = 0.16). The proportion of male patients was slightly higher in the COVID and CDI group (57.1%) compared to the COVID-only group (53.5%), but this difference did not reach statistical significance (
p = 0.55). Body Mass Index (BMI) was marginally higher in the COVID and CDI group (29.1 kg/m
2 ± 5.1) compared to the COVID-only group (27.8 kg/m
2 ± 4.9), approaching significance (
p = 0.07). Similarly, the prevalence of hypertension and diabetes mellitus was higher in the COVID and CDI group (74.5% and 52.0%, respectively) compared to the COVID-only group (63.4% and 40.1%), though these differences were not statistically significant (
p = 0.07 and
p = 0.08, respectively).
Clinically, patients with both COVID-19 and CDI experienced more severe outcomes. ICU admissions were significantly higher in the COVID and CDI group (38.8%) compared to the COVID-only group (20.5%) with a p-value of 0.002. Mechanical ventilation was required more frequently in the COVID and CDI cohort (24.5%) than in the COVID-only group (12.9%), which was statistically significant (p = 0.01). Mortality rates were also significantly elevated in the COVID and CDI group (22.4%) compared to the COVID-only group (10.6%) with a p-value of 0.01. Additionally, the length of hospital stay was longer for patients with both infections (16.0 days ± 5.9) compared to those with COVID-19 alone (13.5 days ± 5.1), and this difference was statistically significant (p = 0.002). These findings suggest that the presence of CDI in COVID-19 patients is associated with more severe clinical outcomes and longer hospitalization.
Table 2 presents a comparison of inflammatory markers and related indices between patients with both COVID-19 and CDI and those with COVID-19 alone. Patients with both infections exhibited significantly higher levels of CRP (92.6 mg/L ± 26.9 vs. 73.1 mg/L ± 24.4,
p < 0.001) and Interleukin-6 (IL-6) (65.3 pg/mL ± 18.8 vs. 50.9 pg/mL ± 16.2,
p < 0.001), indicating a heightened inflammatory response. Ferritin levels were also elevated in the COVID and CDI group (589 µg/L ± 161) compared to the COVID-only group (475 µg/L ± 139), with the difference being statistically significant (
p = 0.001). The NLR was higher in patients with both infections (7.9 ± 2.7) compared to those with COVID-19 alone (6.1 ± 2.1), and this difference was highly significant (
p < 0.001).
Conversely, patients with both COVID-19 and CDI had lower albumin levels (29.9 g/L ± 5.3) compared to the COVID-only group (33.6 g/L ± 5.5, p < 0.001), suggesting poorer nutritional status or greater disease severity. Platelet counts were reduced in the COVID and CDI group (198 × 109/L ± 55) versus the COVID-only group (225 × 109/L ± 60), with a significant p-value of 0.002. The CAR was significantly higher in the dual-infection group (3.10 ± 0.85 vs. 2.17 ± 0.72, p < 0.001), while the PNI was lower (33.6 ± 4.6 vs. 38.2 ± 5.1, p < 0.001). Additionally, the SII was elevated in patients with both infections (1362 × 103 ± 450) compared to those with COVID-19 alone (1087 × 103 ± 372, p < 0.001).
Table 3 compares the severity scores at admission between patients with both COVID-19 and CDI and those with COVID-19 alone. The APACHE II score was significantly higher in the COVID and CDI group (17.1 ± 5.2) compared to the COVID-only group (13.9 ± 4.8), with a
p-value of less than 0.001. Similarly, the CURB-65 score, which assesses pneumonia severity, was elevated in the dual-infection group (2.6 ± 1.0) compared to the COVID-only group (2.1 ± 0.9), and this difference was statistically significant (
p = 0.001). The NEWS, which predicts clinical deterioration, was also higher in patients with both infections (8.4 ± 2.5) compared to those with COVID-19 alone (6.9 ± 2.3), with a
p-value of less than 0.001.
Table 4 presents subgroup analyses focusing on elderly patients (aged ≥ 65 years), those with diabetes mellitus, and patients with cancer. Among the elderly subgroup, 67.3% of patients in the COVID and CDI group were aged 65 or older, compared to 55.6% in the COVID-only group; this difference approached statistical significance (
p = 0.06). ICU admissions within the elderly subgroup were significantly higher in the COVID and CDI group (42.4%) compared to the COVID-only group (21.5%), with a
p-value of 0.003. In patients with diabetes mellitus, 52.0% of the COVID and CDI group had diabetes compared to 40.1% of the COVID-only group, although this difference was not statistically significant (
p = 0.08). However, among diabetic patients, those with both COVID-19 and CDI had a significantly higher rate of ICU admission (45.1%) compared to diabetic patients with COVID-19 alone (24.6%,
p = 0.01). Regarding cancer, 17.3% of patients in the COVID and CDI group had cancer compared to 10.6% in the COVID-only group, but this difference was not statistically significant (
p = 0.14). Additionally, mortality among cancer patients was higher in the COVID and CDI group (41.2%) compared to the COVID-only group (20.0%), although this difference did not reach statistical significance (
p = 0.09).
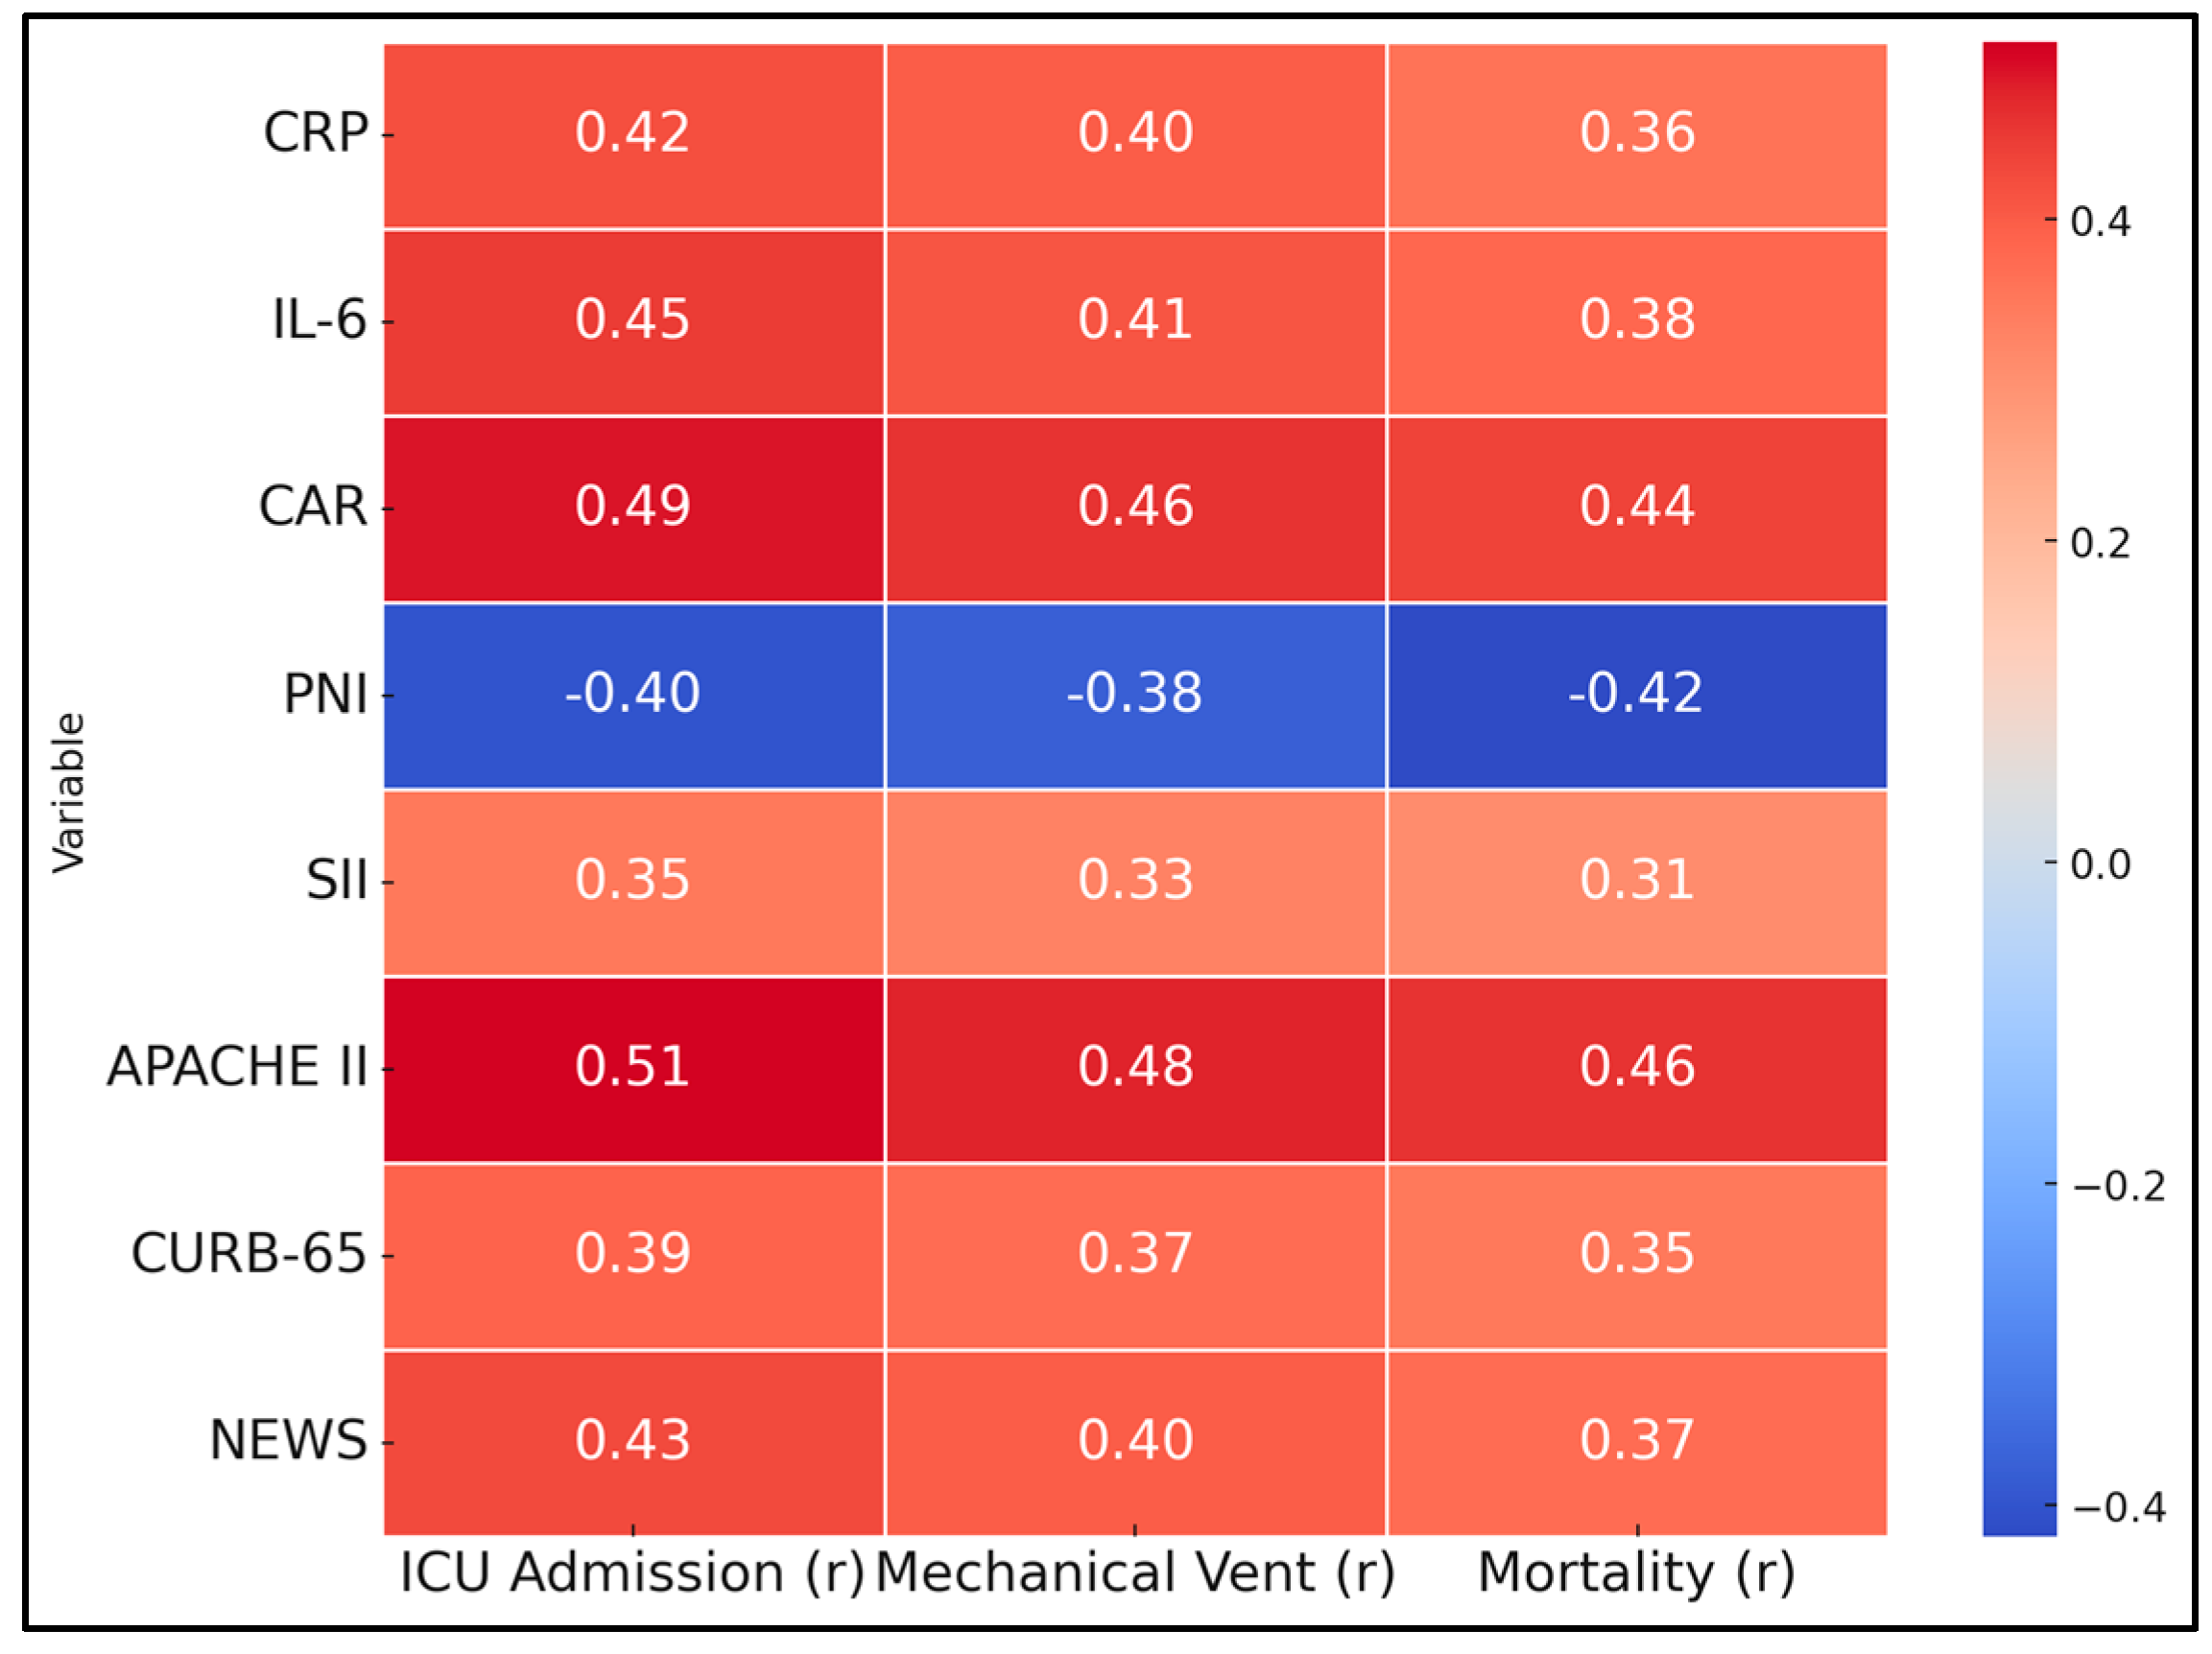
Table 5 explores the correlations between various inflammatory markers and severity scores with key clinical outcomes, including ICU admission, mechanical ventilation, and mortality. CRP showed a moderate positive correlation with ICU admission (r = 0.42,
p < 0.001), mechanical ventilation (r = 0.40,
p < 0.001), and mortality (r = 0.36,
p < 0.001). Interleukin-6 (IL-6) was similarly correlated with these outcomes, exhibiting correlations of r = 0.45 (
p < 0.001) for ICU admission, r = 0.41 (
p < 0.001) for mechanical ventilation, and r = 0.38 (
p < 0.001) for mortality. The CAR demonstrated strong positive correlations with ICU admission (r = 0.49,
p < 0.001), mechanical ventilation (r = 0.46,
p < 0.001), and mortality (r = 0.44,
p < 0.001).
Conversely, the PNI exhibited significant negative correlations with all three outcomes: ICU admission (r = −0.40,
p < 0.001), mechanical ventilation (r = −0.38,
p < 0.001), and mortality (r = −0.42,
p < 0.001). The Systemic Immune-Inflammation Index (SII) was positively correlated with ICU admission (r = 0.35,
p < 0.001), mechanical ventilation (r = 0.33,
p = 0.001), and mortality (r = 0.31,
p = 0.002). Severity scores also showed significant correlations with adverse outcomes: APACHE II (r = 0.51,
p < 0.001 for ICU admission; r = 0.48,
p < 0.001 for mechanical ventilation; r = 0.46,
p < 0.001 for mortality), CURB-65 (r = 0.39,
p < 0.001; r = 0.37,
p < 0.001; r = 0.35,
p < 0.001), and NEWS (r = 0.43,
p < 0.001; r = 0.40,
p < 0.001; r = 0.37,
p < 0.001); all demonstrated significant positive correlations with ICU admission, mechanical ventilation, and mortality (
Figure 1).
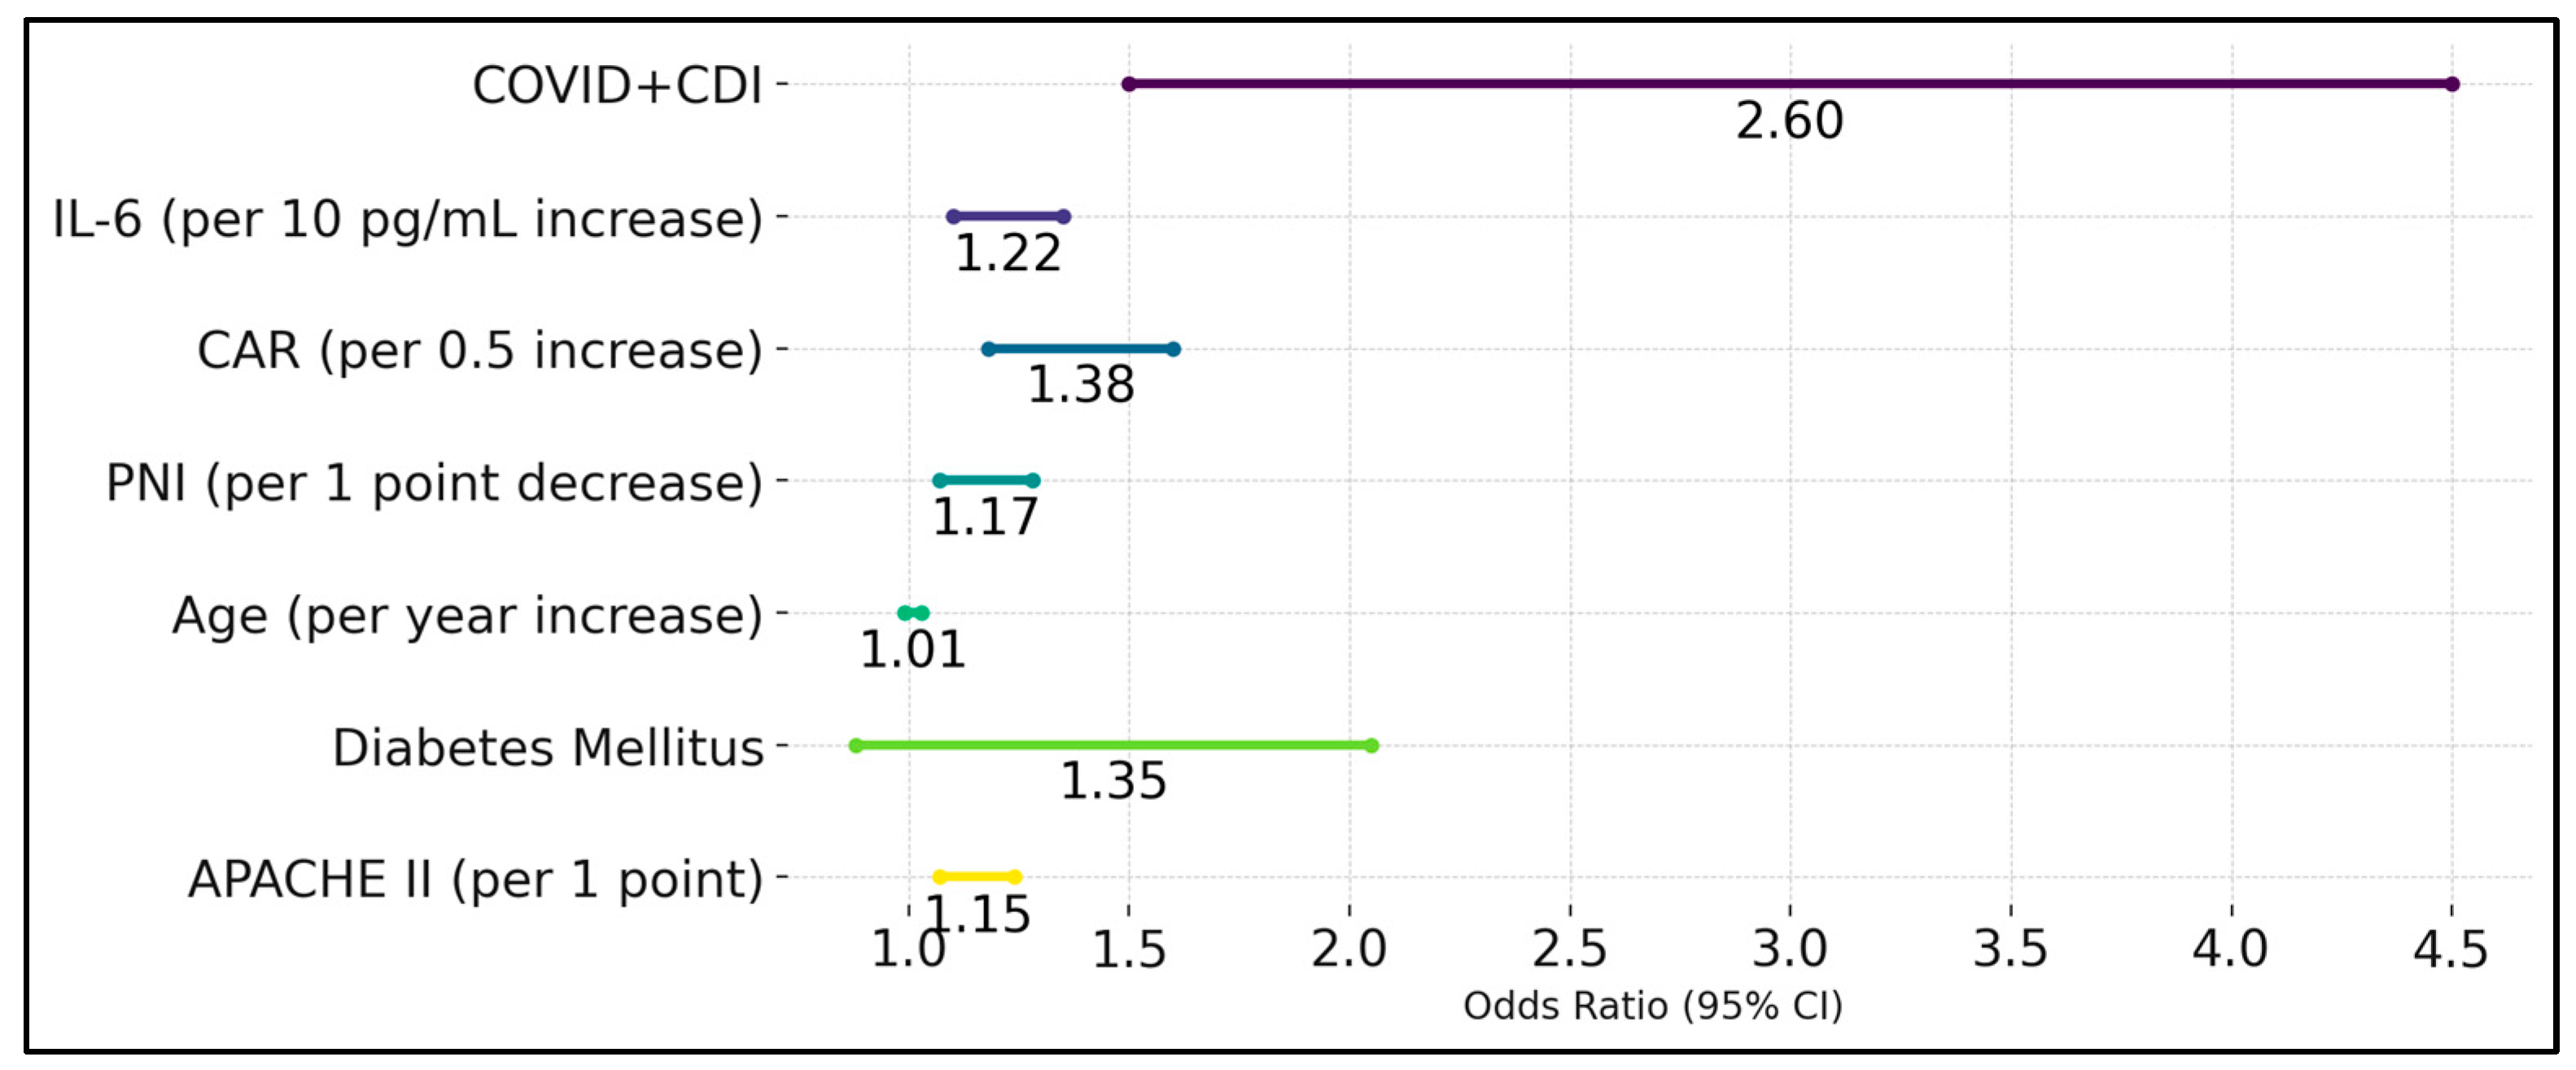
The presence of both COVID-19 and CDI was a significant predictor, with an odds ratio (OR) of 2.6 (95% CI: 1.50–4.50, p < 0.001), indicating that patients with dual infections were 2.6 times more likely to experience severe outcomes compared to those with COVID-19 alone. Interleukin-6 (IL-6) was also a significant predictor, with each 10 pg/mL increase in IL-6 associated with a 1.22-fold increase in the odds of severe outcomes (OR: 1.22, 95% CI: 1.10–1.35, p = 0.001). The CAR was another significant predictor, where each 0.5 increase in the CAR was associated with a 1.38-fold increase in the odds of severe outcomes (OR: 1.38, 95% CI: 1.18–1.60, p < 0.001).
The PNI was inversely related to severe outcomes, with each 1-point decrease in PNI associated with a 1.17-fold increase in the odds of severe outcomes (OR: 1.17, 95% CI: 1.07–1.28,
p = 0.001). Age was not a significant predictor in the multivariate model (OR: 1.01, 95% CI: 0.99–1.03,
p = 0.3), nor was diabetes mellitus (OR: 1.35, 95% CI: 0.88–2.05,
p = 0.15). The APACHE II score remained a significant predictor, with each 1-point increase in APACHE II associated with a 1.15-fold increase in the odds of severe outcomes (OR: 1.15, 95% CI: 1.07–1.24,
p < 0.001). These findings highlight that dual infection with COVID-19 and
C. diff, elevated IL-6 and CAR, lower PNI, and higher APACHE II scores are independent predictors of severe clinical outcomes in patients (
Table 6 and
Figure 2).
Table 7 illustrates the differences in inflammatory markers and severity scores between survivors and non-survivors among patients with CDI. Non-surviving patients exhibited significantly higher levels of CRP (101.2 ± 29.5 mg/L vs. 89.4 ± 25.1 mg/L,
p = 0.04) and IL-6 (73.3 ± 20.3 pg/mL vs. 63.5 ± 17.9 pg/mL,
p = 0.02), indicating a more pronounced inflammatory response. Additionally, the CAR was marginally higher in non-survivors (3.33 ± 0.88 vs. 3.02 ± 0.83,
p = 0.05), and the PNI was significantly lower (31.9 ± 4.3 vs. 34.2 ± 4.5,
p = 0.01), suggesting poorer nutritional status. Severity was further reflected in higher APACHE II scores among non-survivors (19.5 ± 5.3 vs. 16.4 ± 5.0,
p = 0.006). While the CURB-65 and NEWS were elevated in non-survivors, these differences did not reach statistical significance.


 ,
, 
