Article

Graph Convolutional Network with Neural Collaborative Filtering for Predicting miRNA-Disease Association

Major of Big Data Convergence, Division of Data Information Science, Pukyong National University, Busan 48513, Republic of Korea
Biomedicines 2025, 13(1), 136; https://doi.org/10.3390/biomedicines13010136
Submission received: 12 October 2024 / Revised: 1 January 2025 / Accepted: 7 January 2025 / Published: 8 January 2025
(This article belongs to the Special Issue Bioinformatics Analysis of RNA for Human Health and Disease)

Abstract

:
Background: Over the past few decades, micro ribonucleic acids (miRNAs) have been shown to play significant roles in various biological processes, including disease incidence. Therefore, much effort has been devoted to discovering the pivotal roles of miRNAs in disease incidence to understand the underlying pathogenesis of human diseases. However, identifying miRNA–disease associations using biological experiments is inefficient in terms of cost and time. Methods: Here, we discuss a novel machine-learning model that effectively predicts disease-related miRNAs using a graph convolutional neural network with neural collaborative filtering (GCNCF). By applying the graph convolutional neural network, we could effectively capture important miRNAs and disease feature vectors present in the network while preserving the network structure. By exploiting neural collaborative filtering, miRNAs and disease feature vectors were effectively learned through matrix factorization and deep learning, and disease-related miRNAs were identified. Results: Extensive experimental results based on area under the curve (AUC) scores (0.9216 and 0.9018) demonstrated the superiority of our model over previous models. Conclusions: We anticipate that our model could not only serve as an effective tool for predicting disease-related miRNAs but could be employed as a universal computational framework for inferring relationships across biological entities.

1. Introduction

MicroRNAs are small non-coding RNAs that are approximately 22 nucleotides in length. By binding to the 3′-untranslated regions (UTRs) of target messenger RNAs (mRNAs) via imperfect base-paring, miRNAs regulate gene expression [1,2,3,4,5]. MicroRNAs play two different roles; while they suppress protein translation by interfering with gene expression, they act as positive regulators [6]. Since the discovery of the first miRNA lin-4, many other miRNAs have been identified using high-throughput techniques [7,8]. Several studies have reported the important roles of miRNAs in various biological processes such as aging [9], apoptosis [10], development [11], and proliferation [12]. Therefore, identifying disease-related miRNAs is of great significance from a molecular biology perspective and for diagnosing complex human diseases. Considering the resources and time required for biological experiments, numerous studies have attempted to develop computational frameworks for detecting disease-related miRNAs.
To date, various studies have assumed that functionally similar miRNAs are highly related to phenotypically similar diseases to predict miRNA–disease associations (MDAs) [13,14].
Ha et al. employed a probabilistic matrix factorization model that integrates miRNA expression as implicit feedback to predict novel MDAs [15]. Additionally, they incorporated disease similarity information into the matrix factorization model, achieving improved performance in identifying MDAs [16]. Furthermore, the authors proposed a groundbreaking model by integrating neural collaborative filtering, based on a deep learning architecture, to infer relationships between miRNAs and diseases [17]. Jiang et al. introduced a novel framework that applies a hypergeometric distribution. To detect disease-related miRNAs, this model utilizes various heterogeneous networks, including miRNAs and diseases [18]. Shi et al. designed a random walk framework to detect disease-related miRNAs by using a bipartite network [19]. Mørk et al. reported an efficient model that utilizes protein associations between miRNAs and diseases [20]. This model gathers protein–miRNA and protein–disease associations via text mining. Xu et al. ranked disease-related miRNAs using disease genes and miRNA–target interaction data [21]. Xuan et al. reported a prediction model for HDMP by exploiting the k-nearest neighbors in a constructed network [22]. The HDMP assumes that miRNAs belonging to the same cluster are strongly associated with the same disease. Chen et al. introduced a prediction method to identify novel MDA (RWRMDA). In the RWRMDA, a random walk algorithm is implemented by constructing a global miRNA functional similarity network [23].
As machine learning is effectively applied in various scientific domains, various models have adopted it to perform research tasks in bioinformatics [24,25,26]. Chen et al. introduced an approach that utilized k-nearest neighbors to infer miRNA–disease associations [27]. This model integrates heterogeneous biological datasets and ranks disease-related miRNAs according to scores assigned by the support vector machine. Chen et al. applied hierarchical agglomerative clustering by considering miRNA–disease bias ratings [28]. This research group proposed a detection method called RLSMDA [29]. RLSMDA uses a semi-supervised classifier to predict miRNAs that are not associated with known diseases. Xiao et al. designed a prediction method that applied non-negative matrix factorization (MF) based on various heterogeneous omics data (GRNMF) [30]. When the recommender algorithm was applied, GRNMF performed well for both miRNAs with no known disease associations and diseases with no known miRNA associations. Li et al. introduced a matrix factorization framework, MCMDA, for disease-related miRNA identification [31]. MCMDA efficiently predicts disease-related miRNAs by updating the adjacency matrix of MDA. Chen et al. developed a method for potential miRNA–disease associations (HGIMDAs), in which various similarity values are used for comprehensive networks [32]. Ha et al. reported a prediction method for PMAMCA that exploits matrix factorization to infer disease-related miRNAs [33]. The authors adopted MF, a machine-learning algorithm that is actively applied in recommendation systems. Using MF, PMAMCA efficiently captured disease-related miRNAs by assigning miRNA expression values to the model. Chen et al. integrated the comprehensive similarity values of miRNA functional similarity, disease semantic similarity, and Gaussian interaction profile kernel similarity to efficiently infer disease-related miRNAs [34]. Chen et al. developed a disease-related miRNA detection method called MDHGI that integrates comprehensive similarity values [35]. Chen et al. developed an NC-MCMDA model to identify novel disease-related miRNAs. NCMCMDA adopts a matrix completion algorithm by combining comprehensive similarity values to reflect similarity-based neighborhood constraints [36]. However, a common drawback of the aforementioned computational models is their high dependence on known miRNA–disease information, and the performance of the models varies greatly depending on parameter selection. Ha et al. leveraged matrix factorization, a commonly employed machine learning approach in recommendation systems, to extract disease-associated miRNAs effectively by incorporating disease and miRNA similarity information [37]. The authors also proposed a machine learning-based model for identifying disease-associated miRNAs by employing metric learning techniques [38]. Ning et al. presented AMHMDA, a novel method integrating attention-aware multi-view similarity networks and hypergraph learning to predict miRNA–disease associations [39]. Jin et al. introduced MAMFGAT, a novel model leveraging adaptive modality fusion and graph attention networks to predict miRNA–disease associations by integrating multiple similarity and association networks [40]. Peng et al. proposed MHCLMDA, a novel method utilizing multiple hypergraph contrastive learning and variational auto-encoders to predict miRNA–disease associations by integrating consistent feature representations across multiple views [41].
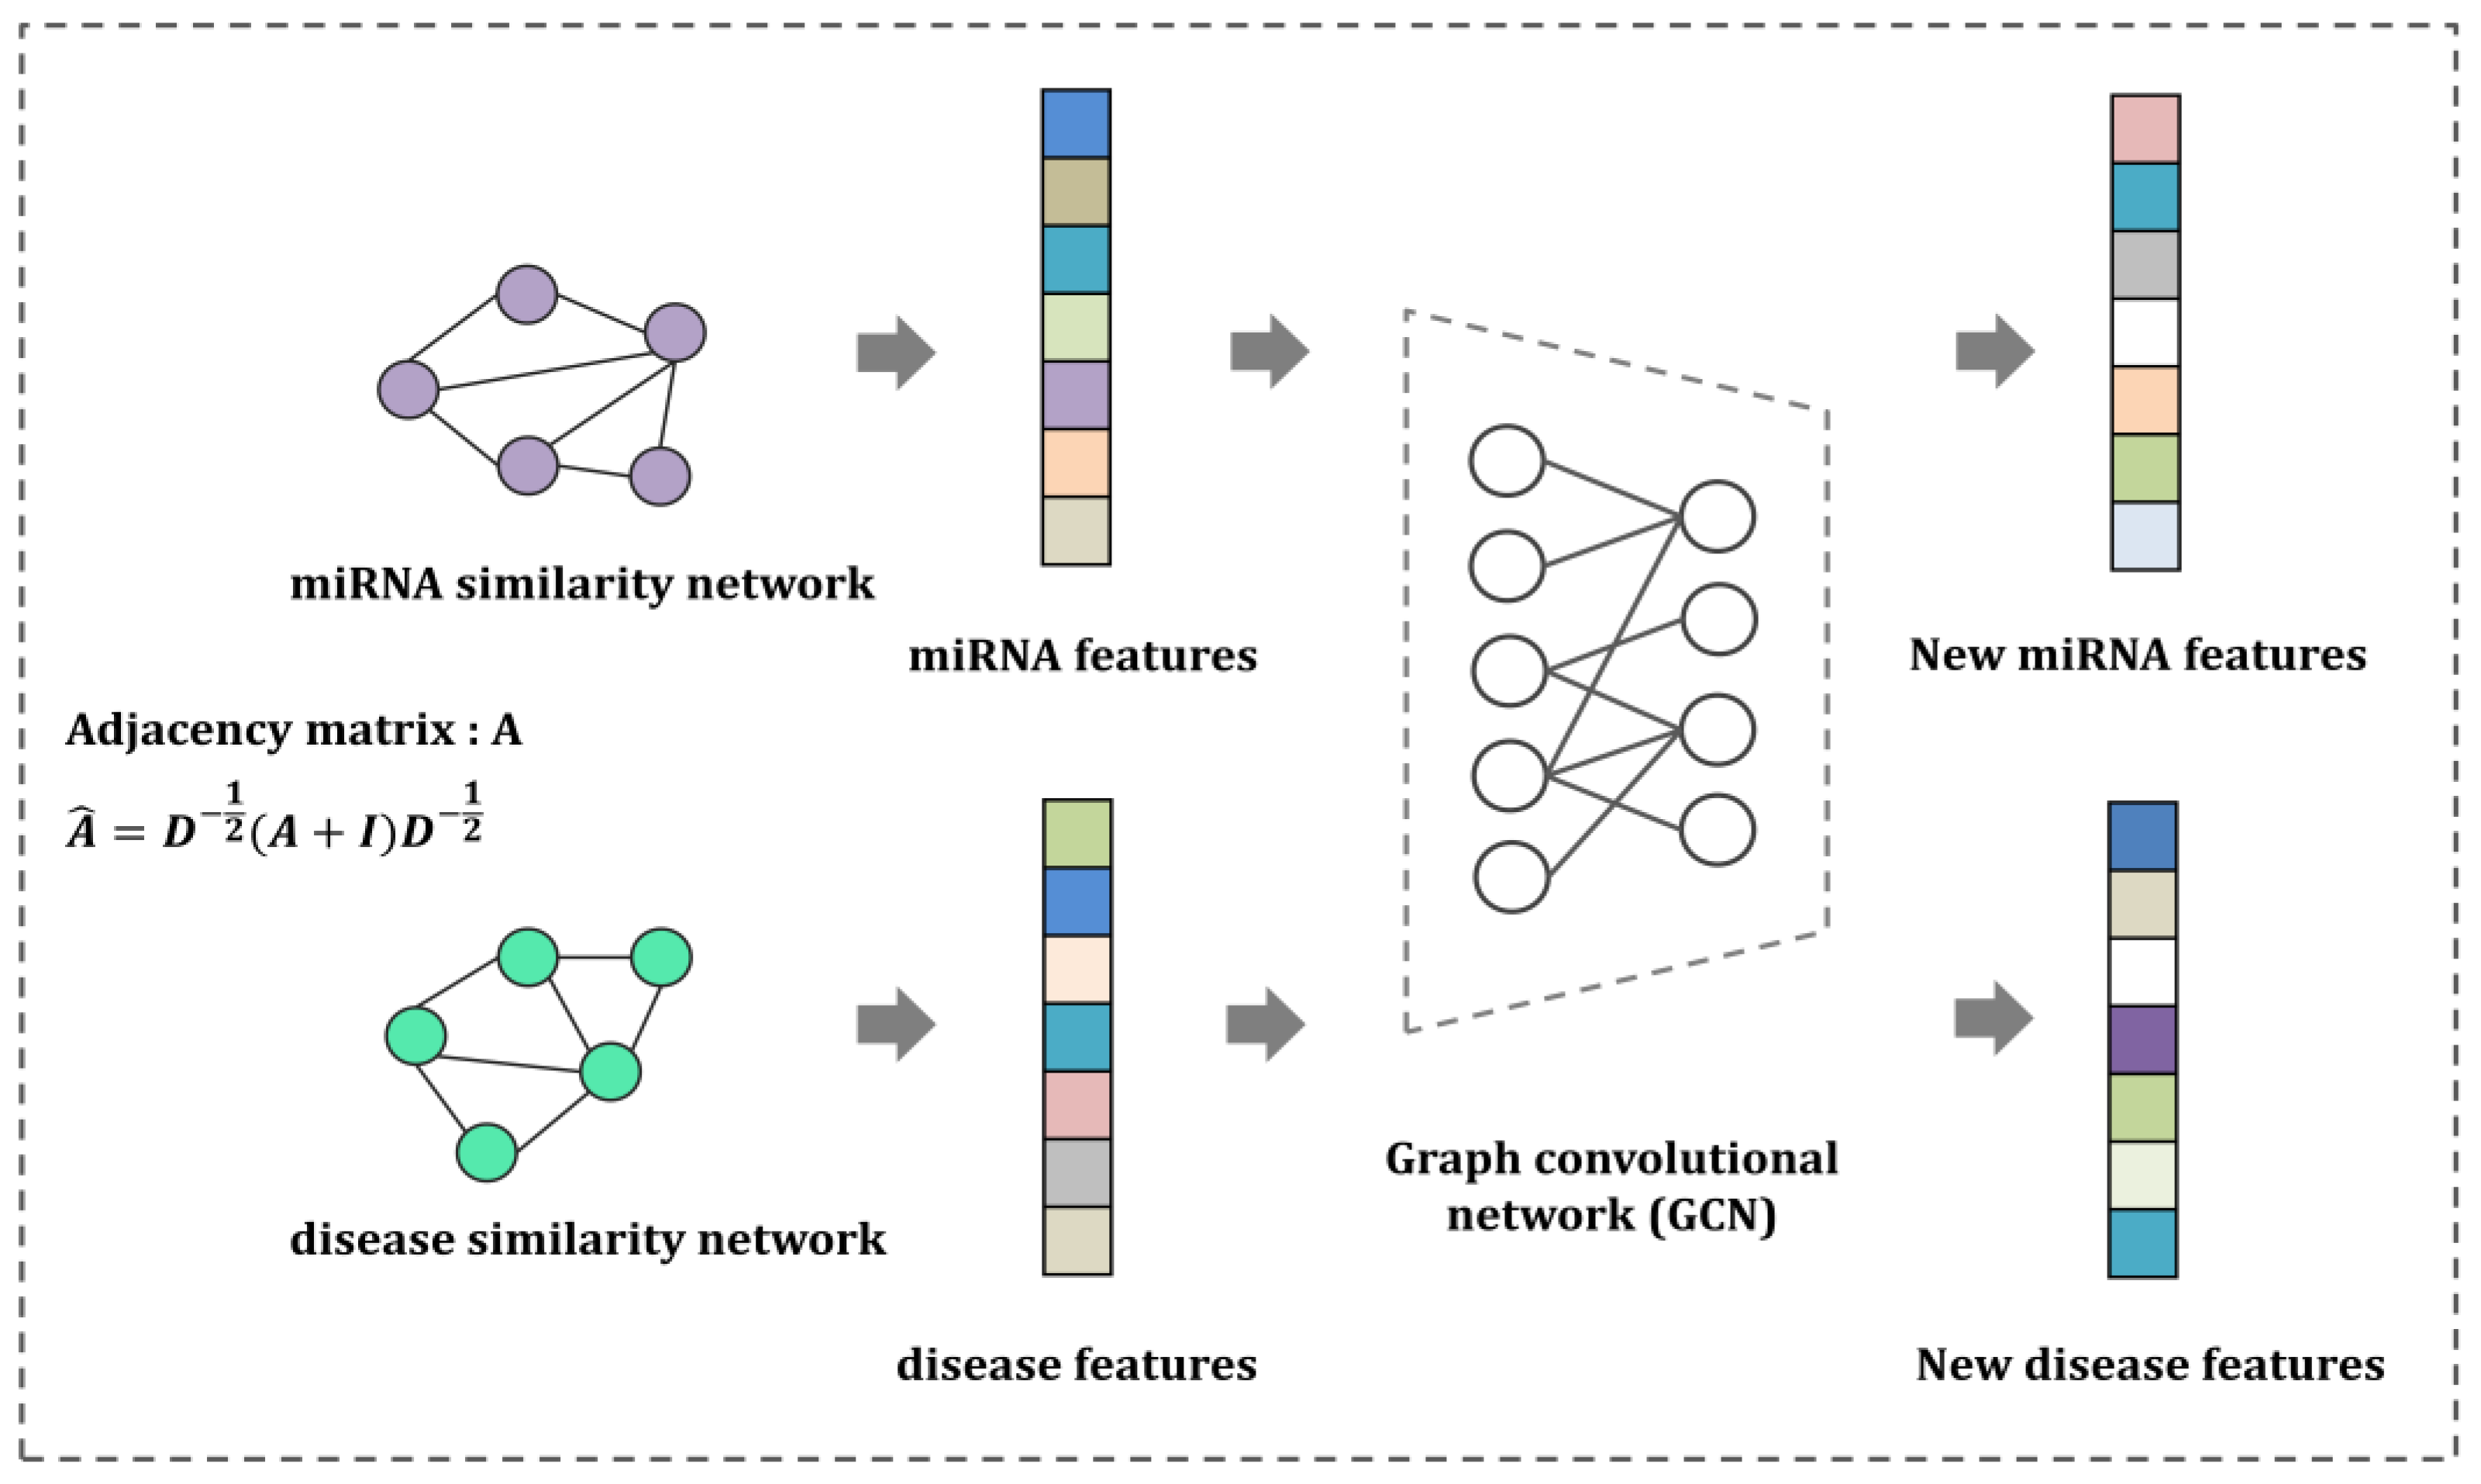
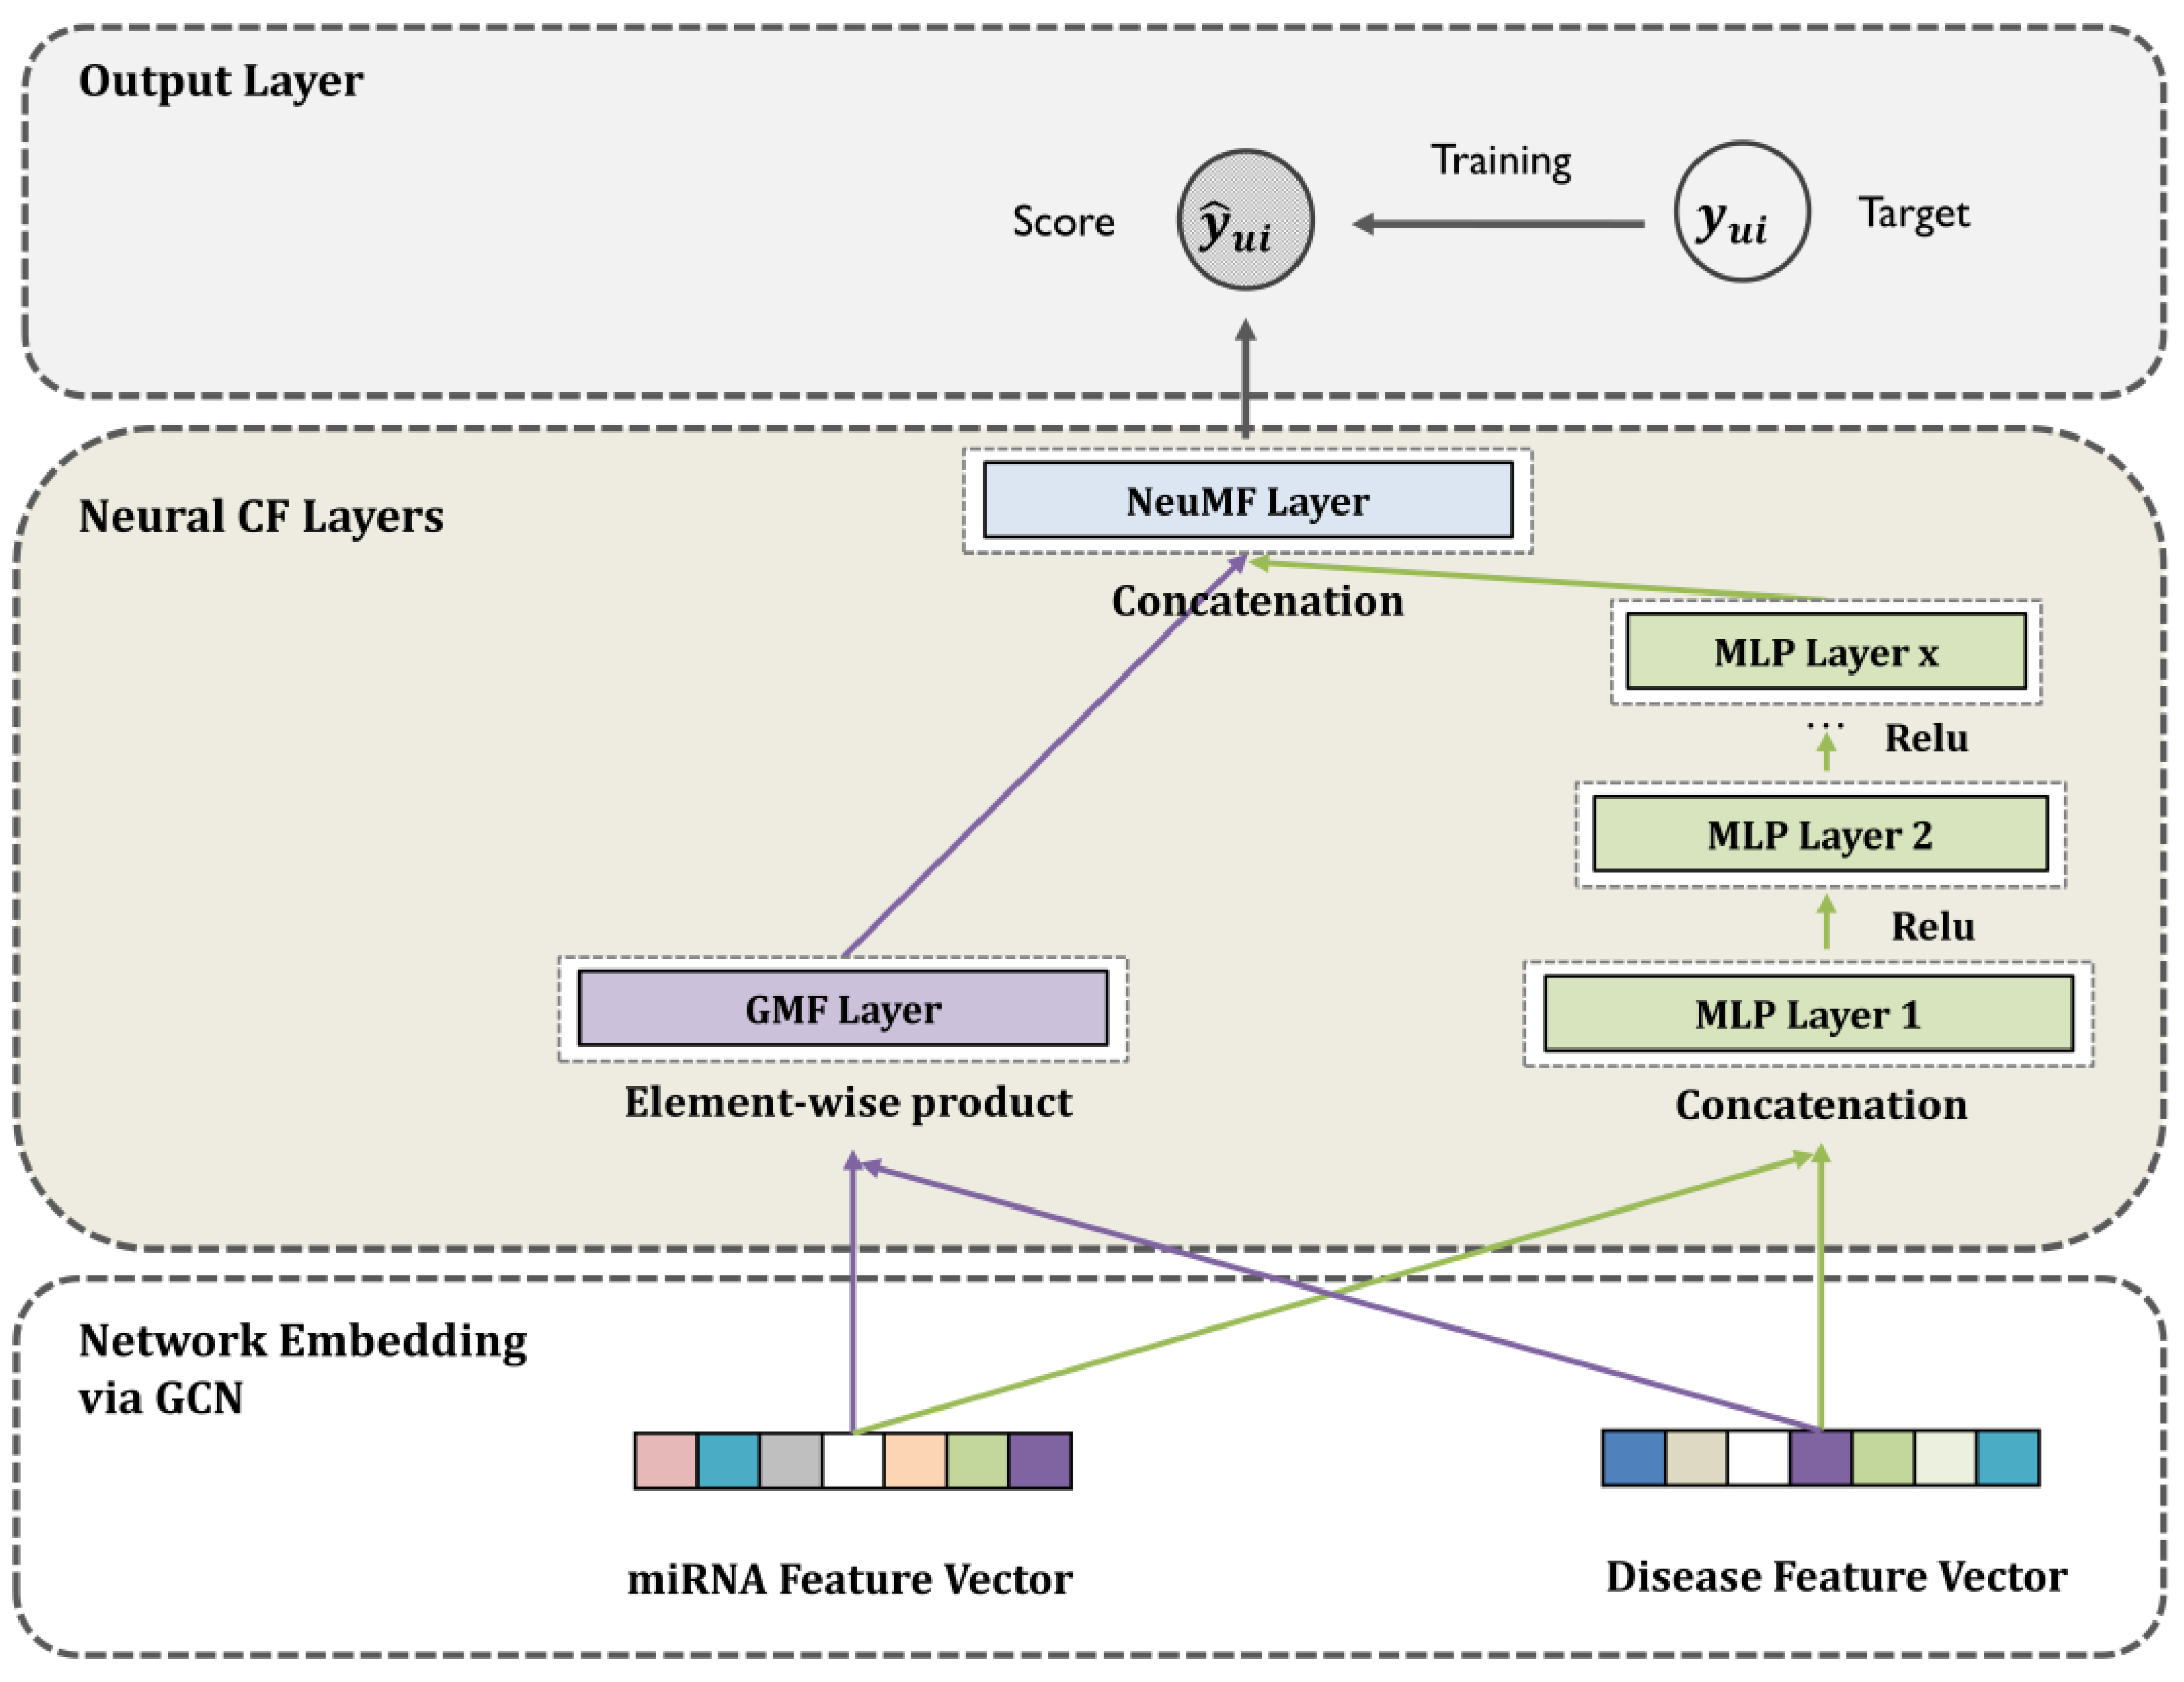
Here, we propose a novel and feasible machine learning framework using neural collaborative filtering (NCF) and a graph convolutional network (GCN) to infer miRNA–disease associations (GCNCF). This study aims to (1) overcome the limitations of the inner product score function, which violates the triangle inequality, and (2) build a feasible and effective machine learning approach to infer novel MDA while retaining the network structure and attributes. In this model, we first integrated heterogeneous similarity values such as miRNA functional similarity, disease semantic similarity, and Gaussian interaction profile kernel similarity to construct miRNA and disease similarity networks. Subsequently, a GCN is adopted to capture accurate network embeddings while retaining the structure and properties of the network. Finally, the NCF was applied to overcome the violation of the triangle inequality issue while enhancing the prediction accuracy. Consequently, GCNCF achieved reliable performance in detecting miRNA–disease associations, with AUC scores of 0.9273 and 0.9075 through global and local leave-one-out cross-validation (LOOCV). Moreover, extensive experiments based on evaluation measurements qualitatively confirmed the comparable GCNCF performance.

2. Materials and Methods

2.1. Human miRNA–Disease Association Data

We collected an MDA dataset from a public online database. HMDD v3.0 is a public database that provides 32281 miRNA–disease associations, including 1102 miRNAs and 850 diseases from 17412 papers [42]. The online database miR2Disease contains information on 3273 miRNA-disease associations for 349 miRNAs and 136 diseases [43]; dbDEMC v2.0 is an online database that provides information on 36 cancer types and 2224 miRNAs [44]. We removed duplicate entries and incorporated disease names via MeSH terms for use as gold standard data [45]. According to the collected miRNA–disease associations, a miRNA–disease association binary matrix was built, defined as follows (Equation (1)):
y i j = 1 , i f   t h e r e   e x i s t s   r e l a t i o n s h i p   b e t w e e n   m i R N A   i   a n d   d i s e a s e   j   0 , o t h e r w i s e

2.2. MiRNA Functional Similarity

An edge in a network implies a similarity between two nodes. Therefore, miRNA functional similarity data were obtained through MISIM and employed as edge information for the miRNA functional similarity network (FS) [46]. MISIM provides a pairwise similarity score that reflects the functional relationships between miRNAs based on shared biological pathways, co-regulated genes, and other functional annotations. The FS scores between miRNAs were expressed as FS(m(i),m(j)). These scores were directly used to construct the miRNA similarity network, where higher scores indicate stronger functional similarity.

2.3. Disease Semantic Similarity

We used a directed acyclic graph (DAG) to estimate similarity values across diseases. DAG is a directed graph with no directed cycle, wherein “directed” refers to the fact that each edge has a defined direction, and “acyclic” denotes the existence of no loop [46]. Using the DAG, we can express the disease DAG(P) as (P, A(P), EG(P)). A(P) denotes the ancestor nodes of node P, and EG(P) denotes all the edges from the parent node to the child node, which can be calculated as follows (Equations (2) and (3)):
D V ( P ) = c A ( P ) P P ( c )
P P ( c ) = 1 i f   c = P P P ( c ) = max { Δ * P P ( c ) | c c h i l d r e n   o f   c }   i f   c P
In the equations presented, ∆ represents the semantic contribution factor, which quantifies how the semantic value of a disease increases as the distance between two diseases decreases within a semantic framework. This factor reflects the assumption that diseases with closer proximity in a directed acyclic graph (DAG) structure are more likely to share similar characteristics. The scoring system builds on this principle, suggesting that the greater the overlap of elements shared within a DAG, the higher the similarity between the diseases. We define SS as the disease semantic similarity matrix, which provides a quantitative measure of similarity between pairs of diseases. Specifically, the semantic similarity between diseases i and j is mathematically expressed in Equation (4). This approach enables a systematic and scalable way to assess relationships among diseases based on their semantic context.
S S ( d ( i ) , d ( j ) ) = t A ( i ) A ( j ) ( P i ( t ) + P j ( t ) ) D V ( i ) + D V ( j )

2.4. Gaussian Interaction Profile Kernel

The Gaussian interaction profile (GIP) kernel is a widely used method in various domains, including genomics, disease analysis, and social network studies, to capture interaction patterns across entities such as genes, diseases, and users [47,48]. In our study, we adopted the GIP kernel to estimate similarity values between miRNAs and diseases, leveraging known miRNA–disease association data as the basis for this calculation. Here, IP(m(i)) represents the profile vector of miRNA m(i), indicating its association with a specific disease d(i). This profile vector effectively captures whether m(i) is linked to d(i) through known interactions. Using this information, we computed the GIP similarity (denoted as GS) between two miRNAs, m(i) and m(j), based on their respective interaction profiles. The mathematical formulation of GS is provided in Equation (5). By employing the GIP kernel, we ensure that the similarity metric is informed by the global interaction landscape, allowing for a robust and biologically meaningful comparison of miRNA–disease associations.
G S ( m ( i ) , m ( j ) ) = exp ( r l   I P ( m ( i ) ) I P ( m ( j ) )   2 )
In this context, r m represents the kernel bandwidth, a critical parameter that determines the sensitivity of the Gaussian interaction profile (GIP) kernel. Based on empirical findings from previous studies, we set r m to 1, as this value has been shown to provide reliable and consistent results across various applications. Using this predefined bandwidth, we computed the similarity information between diseases by applying the GIP kernel. This approach ensures that the similarity metric reflects the underlying interaction profiles effectively while maintaining computational efficiency. The detailed formulation of this similarity calculation is presented in Equation (6). By adopting this methodology, we leverage the robustness of the GIP kernel to derive meaningful insights into disease relationships, enabling a systematic evaluation of their associations within the dataset.
r l = r d 1 n l i = 1 n d | | I P ( m ( i ) | | 2

2.5. Integrated Similarity for miRNAs and Diseases

To construct a comprehensive miRNA similarity network, we integrated functional similarity (FS) information with Gaussian interaction profile (GIP) similarity (GS). This integration combines complementary perspectives, where FS captures biological functionality relationships and GS reflects interaction-based associations. The resulting miRNA similarity value, representing the strength of the connection between miRNAs in the network, was assigned to the edges of the miRNA similarity network. This unified similarity metric was calculated using the formulation presented in Equation (7).
S m ( m ( i ) , m ( j ) ) = F S ( m ( i ) , m ( j ) ) ,   i f   m ( i )   a n d   m ( j )   h a v e   f u n c t i o n a l   s i m i l a r i t y G S m ( m ( i ) , m ( j ) , o t h e r w i s e
Similarly, comprehensive disease similarity was measured by integrating multiple types of similarity information, combining complementary perspectives to enhance the accuracy and robustness of the analysis. This integrated similarity value captures both functional and interaction-based relationships among diseases. The formulation for calculating the comprehensive disease similarity is provided in Equation (8). This approach ensures that the resulting similarity metric reflects a holistic understanding of disease relationships, enabling more effective network-based analyses and predictions.
S d ( d ( i ) , d ( j ) ) = S S d ( d ( i ) , d ( j ) ) ,   i f   d ( i )   a n d   d ( j )   h a v e   s e m a n t i c   s i m i l a r i t y G S d ( d ( i ) , d ( j ) , o t h e r w i s e

2.6. GCNCF

2.6.1. Node-Level Embeddings via Graph Convolutional Network

Here, we systemically illustrate the design of an algorithm that can learn low-dimensional node representations while preserving the network topologies and neighboring structures of the nodes [49]. A GCN is a machine learning-based, semi-supervised learning method that is widely used to capture node feature vectors in graph-structured data. The GCN efficiently captures hidden layer representations while conserving both the node features and local graph structure. As shown in Figure 1, two inputs are required to implement the GCN: adjacency matrix A∈ R a   ×   a and feature matrix F∈ R a   ×   f , where a represents the number of nodes present in adjacency matrix A and f represents the feature dimensions. The feature matrix F was extracted from the vector information of each miRNA row and disease column in the miRNA–disease association matrix. A v is an edge-weighted similarity miRNA or disease network. Given a miRNA, we stack multiple layers to implement the GCN, which is expressed as follows (Equation (9)):
X v ( l + I ) = f ( X v ( l ) , A v ) =   σ ( A v X v ( l ) W v ( l ) , )
Xv(l) and Wv(l) denote the input and weight matrices in the lth GCN layer, respectively, where σ ( · ) is the nonlinear activation function. We transformed the adjacency matrix into Equation (10): A ^ v can be modified to A ^ v = A v + I v , where D ^ v is the diagonal node matrix of A ^ v and I v is an identity matrix that contains the significance of nodes through self-loops.
X v ( l + 1 ) = σ ( D ^ v 1 2 A ^ v D ^ v 1 2 X v ( l ) W v ( l ) )
Likewise, the disease-node embedding can be obtained as with disease adjacency matrix A t   (Equation (11)):
Y v ( l + 1 ) = σ ( D ^ t 1 2 A ^ t D ^ t 1 2 X t ( l ) W t ( l ) )

2.6.2. Generalized Matrix Factorization

The problem encountered in this study was how to accurately predict disease-related miRNAs with the application of linearity of MF and nonlinearity of a multi-layer perceptron (MLP). A common underlying idea of NCF is that we can endow a prediction model with linearity and nonlinearity using a variant of a deep learning model. The original matrix factorization captures the relationship between two objects by considering the inner product of two latent spaces. In this regard, we formulate generalized matrix factorization (GMF) as follows (Equation (12)):
f 1 ( m u , d i ) = m u d i
where, m u and d i stand for miRNA and disease feature vectors, respectively, which were obtained through GCN, and indicated element-wise product function.
f G M F = a o u t ( h T   m u   d i )   d i
Moreover, the meaning of h and a o u t can be interpreted as the weights of the output layer and activation function, respectively. Setting the activation function to the identity function implies that h becomes 1, yielding the same result as the MF (Equation (13)).

2.6.3. Multi-Layer Perceptron

Feature concatenation is widely used in existing multimodal deep-learning architectures [50,51]. However, concatenating vectors alone do not accurately reflect the relationship between two objects. To compensate for this shortcoming, we applied a multilayer perceptron (MLP) to endow the model with nonlinearity by stacking multiple hidden layers. The GCNCF can be expressed with Equation (14).
z 1 = f 1 m u ,   d i = m u d i ,
f 2 z 1 = a 2 W 2 T z 1 + b 2 ,
f L z L 1 = a L W L T z L 1 + b L ,
f M L P = σ h T f L ( z L 1 ) ,
where w x , a x , and b x denote the weight matrix, activation function, and bias vector of the xth layer, respectively. Based on the empirical experimental results, the performance of ReLU was observed to be comparable to that of other activation functions, such as the tanh and sigmoid functions. Therefore, the model adopts ReLU as an activation function.

2.6.4. Application of Neural Collaborative Filtering

The most straightforward method for fusing a GMF with an MLP is to share the same miRNA and disease input features. Therefore, we designed a hybrid model that fed the same miRNA and disease feature vectors through a GCN. The GCNCF formulation can be expressed with Equation (15), as follows:
f G M F = m u G · d i G
f M L P = a L ( W L T a L 1 a 2 W 2 T m u M d i M + b 2 + b L ) ,
y ´ u i = ( h T f G M F f M L P )
where m u G and m u M denote the network feature embeddings of the GMF and MLP, respectively, and d i G and d i M represent their network feature vectors, GMF and MLP. Figure 2 details the entire process, and Table 1 describes the notations.

3. Results

3.1. Parameter Settings (Hidden Layers)

The most important factor for an accurate performance evaluation is the variation in performance based on parameter selection. Adam optimizer was used to select the optimal parameter values for our model. Also, to select the model with the best performance, the latter is evaluated by introducing different numbers of hidden layers. As we stack more hidden layers in a deep neural network, we can endow the model with more nonlinearity, which is beneficial for improving performance. We set a series of values for the number of hidden layers and sequentially measured the AUC scores. MLP0 has no hidden layers, whereas MLP5 has five hidden layers. As shown in Table 2, the model with four hidden layers achieved the best performance. Therefore, all the experiments were conducted using a model with four hidden layers.
Several evaluation metrics were employed to evaluate the performance of the GCNCF. LOOCV is widely used to estimate model performance. It is generally divided into two types: global LOOCV considers all diseases simultaneously, whereas local LOOCV considers a specific disease simultaneously. To illustrate the performance of GCNCF clearly, we drew a receiver operating characteristic (ROC) curve, with the X- and Y-axes denoting the true positive rate (TPR) and false positive rate (FPR), respectively. Here, TP and FP refer to properly detected and poorly detected positive samples, respectively, whereas TN and FN indicate correctly identified and poorly predicted negative samples, respectively. We measured TPR and FPR using (Equations (16) and (17)). The AUC score was obtained based on the receiver operating characteristic (AUC) curve, which allowed us to determine the performance of the model.
F P R = F P F P +   T N
T P R = T P T P + F N
Additionally, the values under the PR curve (AUPR) were calculated based on precision and recall, which can be measured using Equations (18) and (19). A PR curve is often used when the classes are imbalanced. Additionally, extensive evaluation metrics such as accuracy (ACC) and Matthew’s correlation coefficient (MCC) were measured using Equations (20) and (21) to measure performance more accurately.
p r e c i s i o n = T P T P +   F P
r e c a l l = T P T P + F N
A C C = T P + T N T P + T N + F P + F N
M C C = T P × T N F P × F N ( T P + F P ) ( T P + F N ) ( T N + F P ) ( T N + F N )

3.2. Performance Evaluation with Existing Approaches

To accurately measure the performance of GCNCF, we conducted a comparative experiment with the latest studies, namely, NCMD [17], NCMCMDA [36], MDHGI [35], and GRNMF [30]. Based on the global LOOCV (Figure 3), GCNCF achieved a meaningful AUC score of 0.9216, which was superior to those of NCMD (0.9138), NCMCMDA (0.9097), MDHGI (0.8846), and GRNMF (0.8647). We used local LOOCV to demonstrate the performance of GCNCF in identifying novel disease-related miRNAs. As shown in Figure 4, the GCNCF obtained an AUC score of 0.9018, indicating that it performed better than NCMD (0.8886) and NCMCMDA (0. 8737), MDHGI (0.8621), and GRNMF (0.8496). Moreover, the performance of the model was measured quantitatively using AUPR, ACC, and MCC. As summarized in Table 3 and Table 4, we proved that GCNCF performed better based on various statistical values.

3.3. Ablation Study

The most straightforward way to accurately evaluate each machine-learning model component is to implement an ablation study. An ablation study is an experiment in which the components of a machine learning model are removed to assess the effect of the removed components on model performance. In this study, we propose a hybrid model that combines the GMF and MLP to ascertain the benefits of linearity and nonlinearity. To evaluate the performance of the GMF and MLP components, we removed the corresponding components from the model and evaluated their performances. The GMF model excludes the MLP module from the proposed GCNCF model, whereas the MLP model excludes the GMF module from the GCNCF model. One of the main contributions of this study is the proposed method of effectively capturing high-dimensional structural information from the input graph using graph convolutional networks (GCNs). This is particularly useful for modeling complex relationships between entities, especially in graph-based data, where interactions can be more accurately represented. To validate this approach, we conducted experiments comparing the performance of the model with and without the use of GCN. In our framework, GCN serves solely as a feature extractor and does not function as an independent predictor or classifier. In other words, GCN’s role is limited to extracting informative feature vectors from the input graph, which are then fed into the neural collaborative filtering (NCF) model for prediction. Therefore, using GCN alone does not yield meaningful predictive results, and we define the model without GCN as the ’NCF model’. The experimental results show that when GCN is used to extract feature vectors, the performance of the model significantly outperforms the NCF model that does not utilize GCN. This demonstrates that GCN is highly effective at extracting high-quality feature representations from the graph, which plays a crucial role in improving the predictive performance of the model. The results confirm that GCN is not only effective in processing graph data but also essential for optimizing model performance by providing rich feature vectors that enhance the overall accuracy of predictions. As illustrated in Figure 5, the model with the GMF, MLP, and GCN components (GCNCF) performed better than when each component was used alone.

3.4. Case Studies

To further demonstrate the GCNCF performance, we examined two major human cancers. Breast cancer (BC) is common in women and has a high fatality rate worldwide [52]. Various studies have shown that miRNAs are biological factors that significantly influence BC development. For example, miR-202 and miR-718 are highly expressed in patients with BC, indicating their significant roles as biomarkers for early BC [53]. Therefore, we performed a case study to determine whether the candidates predicted by the GCNCF were related to BC. Table 5 shows that all top-ranked candidates were related to BC using the gold standard dataset.
We conducted additional experiments on lung cancer (LC). LC is a malignant lung tumor and a major cause of cancer-related mortality [54]. Smoking tobacco is the primary cause of LC. Additionally, miRNAs play important roles in LC development [55]. Therefore, the top 50 candidates were ranked according to the predicted values obtained by the GCNCF. Consequently, all miRNAs were shown to be related to LC based on the gold-standard datasets (Table 6). Based on the experimental results, we demonstrated that GCNCF exhibited excellent performance in identifying disease biomarkers.

3.5. Pathway Analysis

Pathway analysis is a functional enrichment analysis method that provides information on the molecular interactions and underlying biology of differentially expressed genes and proteins. Our model was expected to predict disease-related miRNAs and provide clues for inferring miRNA-associated activities. Therefore, we performed a pathway analysis according to their targets. DIANA-miRPath v3.0, a web tool, provides information on controlled pathways and miRNA regulatory roles [56]. We used DIANA-miRPath v3.0, to evaluate the underlying biological roles of LC-related miRNA candidates. As shown in Table 7, most functions were associated with LC-related pathways. The Hippo signaling pathway regulates cell proliferation and death, which substantially affects LC incidence [57]. Hippo signaling plays a key role in lung disease and modulates various cellular functions [58]. Furthermore, we applied mirPathDB 2.0 to intuitively express the relationship between the miRNA target and the pathway using a heatmap [59]. The dark color in the heatmap indicates that the miRNA target and the corresponding pathway are closely related (Figure 6). Based on the experimental results, the excellent performance of the GCNCF in the extraction of disease-related miRNAs was validated.

4. Discussion and Conclusions

With the exponential growth in heterogeneous networks, the extraction of meaningful network embeddings via machine learning has become increasingly important. The crucial factors for network embedding are (1) learning low-dimensional representations for nodes in the network and (2) capturing the semantics behind the pairwise relationship (e.g., miRNA–disease association prediction). This study was motivated by the fact that the network implies node structural roles and attributes while learning the low-dimensional representations of nodes. Specifically, this study addresses the MDA prediction problem by formalizing neural collaborative filtering using GCNCF. GCNCF comprehensively integrates miRNA and disease similarities through miRNA functional similarity, disease semantic similarity, and a Gaussian interaction profile kernel to build miRNA and disease networks. We focused on modeling a network-embedding approach with a GCN that was suitable for learning low-dimensional vectors while aiming to capture the network structure and roles more accurately and realistically. Consequently, we systemically fused the linearities and non-linearities of miRNAs and disease feature vectors by designing neural collaborative filtering to predict novel miRNA–disease associations. The experimental results under various evaluation metrics validated that GCNCF outperformed the four previous models.
GCNCF leverages graph convolutional networks (GCNs) to capture higher-order structural information from the input graph, effectively modeling complex relationships between entities. Unlike NCMD and MDHGI, which primarily rely on matrix decomposition and feature aggregation, GCNCF dynamically updates node representations through neighborhood information propagation. Additionally, the integration of neural collaborative filtering (NCF) enables the modeling of nonlinear and latent interactions often overlooked by traditional matrix factorization methods like GRNMF. This synergistic combination of GCN and NCF provides dual benefits: GCN establishes a robust foundation for representation learning, while NCF enhances predictive accuracy by capturing intricate interaction dynamics. These advancements are validated by the experimental results, where GCNCF consistently outperforms referenced models across multiple evaluation metrics, as detailed in the Results section. We believe these enhancements clearly highlight the novel contributions of GCNCF and its advantages over existing approaches.
However, our model has room for further improvement, which could be explored in future work. The model can be broadly divided into two stages: the feature representation stage, where diseases and miRNAs are mapped to low-dimensional vectors, and the prediction stage, where the relationships between miRNAs and diseases are inferred. To improve the first stage, employing more advanced machine learning models for feature representation could provide more accurate and meaningful representations of these objects, making them more comprehensible to the computer. In addition, applying more sophisticated machine learning techniques in the relationship prediction model could enhance performance and offer significant potential for model improvement. Also, generalizing the model to new, unseen diseases remains challenging. Exploring transfer learning or integrating domain-specific knowledge could help improve performance for diseases with limited data.

Funding

This work was supported by a research grant from Pukyong National University (2023).

Institutional Review Board Statement

Not applicable.

Informed Consent Statement

Not applicable.

Data Availability Statement

Data derived from public domain resources [42].

Conflicts of Interest

The authors declare no conflicts of interest.

References

  1. Bartel, D.P. MicroRNAs: Genomics, biogenesis, mechanism; function. Cell 2004, 116, 281–297. [Google Scholar] [CrossRef] [PubMed]
  2. Meister, G.; Tuschl, T. Mechanisms of gene silencing by double-stranded RNA. Nature 2004, 431, 343–349. [Google Scholar] [CrossRef]
  3. Ambros, V. microRNAs: Tiny regulators with great potential. Cell 2001, 107, 823–826. [Google Scholar] [CrossRef] [PubMed]
  4. Ambros, V. The functions of animal microRNAs. Nature 2004, 431, 350–355. [Google Scholar] [CrossRef]
  5. Wightman, B.; Ha, I.; Ruvkun, G. Posttranscriptional regulation of the heterochronic gene lin-14 by lin-4 mediates temporal pattern formation in C. elegans. Cell 1993, 75, 855–862. [Google Scholar] [CrossRef]
  6. He, L.; Hannon, G.J. MicroRNAs: Small RNAs with a big role in gene regulation. Nat. Rev. Genet. 2004, 5, 522–531. [Google Scholar] [CrossRef] [PubMed]
  7. Jopling, C.L.; Yi, M.; Lancaster, A.M.; Lemon, S.M.; Sarnow, P. Modulation of hepatitis C virus RNA abundance by a liver-specific microRNA. Science 2005, 309, 1577–1581. [Google Scholar] [CrossRef] [PubMed]
  8. Vasudevan, S.; Tong, Y.; Steitz, J.A. Switching from repression to activation: microRNAs can up-regulate translation. Science 2007, 318, 1931–1934. [Google Scholar] [CrossRef]
  9. Bartel, D.P. MicroRNAs: Target recognition and regulatory functions. Cell 2009, 136, 215–233. [Google Scholar] [CrossRef] [PubMed]
  10. Miska, E.A. How microRNAs control cell division, differentiation and death. Curr. Opin. Genet. Dev. 2005, 15, 563–568. [Google Scholar] [CrossRef] [PubMed]
  11. Karp, X. DEVELOPMENTAL BIOLOGY: Enhanced: Encountering MicroRNAs in Cell Fate Signaling. Science 2005, 310, 1288–1289. [Google Scholar] [CrossRef] [PubMed]
  12. Cheng, A.M. Antisense inhibition of human miRNAs and indications for an involvement of miRNA in cell growth and apoptosis. Nucleic Acids Res. 2005, 33, 1290–1297. [Google Scholar] [CrossRef]
  13. Ha, J.; Kim, H.; Yoon, Y.; Park, S. A method of extracting disease-related microRNAs through the propagation algorithm using the environmental factor based global miRNA network. Bio Med. Mater. Eng. 2015, 26 (Suppl. S1), S1763–S1772. [Google Scholar] [CrossRef] [PubMed]
  14. Ha, J.; Park, C.; Park, C.; Park, S. Improved prediction of miRNA-disease associations based on matrix completion with network regularization. Cells 2020, 9, 881. [Google Scholar] [CrossRef]
  15. Ha, J.; Park, C.; Park, C.; Park, S. IMIPMF: Inferring miRNA-disease interactions using probabilistic matrix factorization. J. Biomed. Inform. 2020, 102, 103358. [Google Scholar] [CrossRef] [PubMed]
  16. Ha, J. MDMF: Predicting miRNA–disease association based on matrix factorization with disease similarity constraint. J. Pers. Med. 2022, 12, 885. [Google Scholar] [CrossRef] [PubMed]
  17. Ha, J.; Park, S. NCMD: Node2vec-based neural collaborative filtering for predicting miRNA-disease association. IEEE ACM Trans. Comp. Biol. Bioinform. 2023, 20, 1257–1268. [Google Scholar] [CrossRef] [PubMed]
  18. Jiang, Q.; Hao, Y.; Wang, G.; Juan, L.; Zhang, T.; Teng, M.; Liu, Y.; Wang, Y. Prioritization of disease microRNAs through a human phenome-microRNAome network. BMC Syst. Biol. 2010, 4 (Suppl. S1), S2. [Google Scholar] [CrossRef] [PubMed]
  19. Shi, H.; Xu, J.; Zhang, G.; Xu, L.; Li, C.; Wang, L.; Zhao, Z.; Jiang, W.; Guo, Z.; Li, X. Walking the interactome to identify human miRNA-disease associations through the functional link between miRNA targets and disease genes. BMC Syst. Biol. 2013, 7, 101. [Google Scholar] [CrossRef]
  20. Mørk, S.; Pletscher-Frankild, S.; Caro, A.P.; Gorodkin, J.; Jensen, L.J. Protein-driven inference of miRNA-disease associations. Bioinformatics 2014, 30, 392–397. [Google Scholar] [CrossRef] [PubMed]
  21. Xu, C.; Ping, Y.; Li, X.; Zhao, H.; Wang, L.; Fan, H.; Xiao, Y.; Li, X. Prioritizing candidate disease miRNAs by integrating phenotype associations of multiple diseases with matched miRNA and mRNA expression profiles. Mol. Biosyst. 2014, 10, 2800–2809. [Google Scholar] [CrossRef]
  22. Xuan, P.; Han, K.; Guo, M.; Guo, Y.; Li, J.; Ding, J.; Liu, Y.; Dai, Q.; Li, J.; Teng, Z.; et al. Prediction of microRNAs associated with human diseases based on weighted k most similar neighbors. PLoS ONE 2013, 8, e70204. [Google Scholar] [CrossRef] [PubMed]
  23. Chen, X.; Liu, M.-X.; Yan, G.-Y. RWRMDA: Predicting novel human microRNA–disease associations. Mol. Biosyst. 2012, 8, 2792–2798. [Google Scholar] [CrossRef] [PubMed]
  24. Chihyun, P.; Jihwan, H.; Sanghyun, P. Prediction of Alzheimer’s disease based on deep neural network by integrating gene expression and DNA methylation dataset. Expert Syst. Appl. 2020, 140, 112873. [Google Scholar]
  25. Cho, M.; Ha, J.; Park, C.; Park, S. Combinatorial feature embedding based on CNN and LSTM for biomedical named entity recognition. J. Biomed. Inform. 2020, 103, 103381. [Google Scholar] [CrossRef] [PubMed]
  26. Ha, J. LncRNA expression profile-based matrix factorization for identifying lncRNA-disease associations. IEEE Access 2024, 12, 70297–70304. [Google Scholar] [CrossRef]
  27. Chen, X.; Wu, Q.-F.; Yan, G.-Y. RKNNMDA: Ranking-based KNN for MiRNA-Disease Association prediction. RNA Biol. 2017, 14, 952–962. [Google Scholar] [CrossRef] [PubMed]
  28. Chen, X.; Xie, D.; Wang, L.; Zhao, Q.; You, Z.-H.; Liu, H. BNPMDA: Bipartite network projection for MiRNA–disease association prediction. Bioinformatics 2018, 34, 3178–3186. [Google Scholar] [CrossRef] [PubMed]
  29. Chen, X.; Yan, G.Y. Semi-supervised learning for potential human microRNA-disease associations inference. Sci. Rep. 2014, 4, 5501. [Google Scholar] [CrossRef]
  30. Xiao, Q.; Luo, J.; Liang, C.; Cai, J.; Ding, P. A graph regularized non-negative matrix factorization method for identifying microRNA-disease associations. Bioinformatics 2018, 34, 239–248. [Google Scholar] [CrossRef]
  31. Li, J.Q.; Rong, Z.-H.; Chen, X.; Yan, G.-Y.; You, Z.-H. MCMDA: Matrix completion for MiRNA-disease association prediction. Oncotarget 2017, 8, 21187–21199. [Google Scholar] [CrossRef] [PubMed]
  32. Chen, X.; Yan, C.C.; Zhang, X.; You, Z.-H.; Huang, Y.-A.; Yan, G.-Y. HGIMDA: Heterogeneous graph inference for miRNA-disease association prediction. Oncotarget 2016, 7, 65257–65269. [Google Scholar] [CrossRef] [PubMed]
  33. Ha, J.; Park, C.; Park, S. PMAMCA: Prediction of microRNA-disease association utilizing a matrix completion approach. BMC Syst. Biol. 2019, 13, 33. [Google Scholar] [CrossRef]
  34. Chen, X.; Wang, L.; Qu, J.; Guan, N.-N.; Li, J.-Q. Predicting miRNA–disease association based on inductive matrix completion. Bioinformatics 2018, 34, 4256–4265. [Google Scholar] [CrossRef]
  35. Chen, X.; Yin, J.; Qu, J.; Huang, L. MDHGI: Matrix decomposition and heterogeneous graph inference for miRNA-disease association prediction. PLOS Comput. Biol. 2018, 14, e1006418. [Google Scholar] [CrossRef] [PubMed]
  36. Chen, X.; Sun, L.-G.; Zhao, Y. NCMCMDA: miRNA–disease association prediction through neighborhood constraint matrix completion. Brief. Bioinform. 2021, 22, 485–496. [Google Scholar] [CrossRef] [PubMed]
  37. Ha, J. SMAP: Similarity-based matrix factorization framework for inferring miRNA-disease association. Knowl.-Based Syst. 2023, 263, 110295. [Google Scholar] [CrossRef]
  38. Ha, J.; Park, C. MLMD: Metric learning for predicting MiRNA-disease associations. IEEE Access 2021, 9, 78847–78858. [Google Scholar] [CrossRef]
  39. Ning, Q.; Zhao, Y.; Gao, J.; Chen, C.; Li, X.; Li, T.; Yin, M. AMHMDA: Attention aware multi-view similarity networks and hypergraph learning for miRNA–disease associations identification. Brief. Bioinform. 2023, 24, bbad094. [Google Scholar] [CrossRef] [PubMed]
  40. Jin, Z.; Wang, M.; Tang, C.; Zheng, X.; Zhang, W.; Sha, X.; An, S. Predicting miRNA-disease association via graph attention learning and multiplex adaptive modality fusion. Comput. Biol. Med. 2024, 169, 107904. [Google Scholar] [CrossRef]
  41. Peng, W.; He, Z.; Dai, W.; Lan, W. MHCLMDA: Multihypergraph contrastive learning for miRNA–disease association prediction. Brief. Bioinform. 2024, 25, bbad524. [Google Scholar] [CrossRef] [PubMed]
  42. Huang, Z.; Shi, J.; Gao, Y.; Cui, C.; Zhang, S.; Li, J.; Zhou, Y.; Cui, Q. HMDD v3. 0: A database for experimentally supported human microRNA–disease associations. Nucleic Acids Res. 2019, 47, D1013–D1017. [Google Scholar] [CrossRef]
  43. Jiang, Q.; Wang, Y.; Hao, Y.; Juan, L.; Teng, M.; Zhang, X.; Li, M.; Wang, G.; Liu, Y. miR2Disease: A manually curated database for microRNA deregulation in human disease. Nucleic Acids Res. 2009, 37, D98–D104. [Google Scholar] [CrossRef] [PubMed]
  44. Yang, Z.; Wu, L.; Wang, A.; Tang, W.; Zhao, Y.; Zhao, H.; Teschendorff, A.E. dbDEMC 2.0: Updated database of differentially expressed miRNAs in human cancers. Nucleic Acids Res. 2017, 45, D812–D818. [Google Scholar] [CrossRef]
  45. Lipscomb, C.E. Medical subject headings (MeSH). Bull. Med. Libr. Assoc. 2000, 88, 265–266. [Google Scholar]
  46. Wang, D.; Wang, J.; Lu, M.; Song, F.; Cui, Q. Inferring the human microRNA functional similarity and functional network based on microRNA-associated diseases. Bioinformatics 2010, 26, 1644–1650. [Google Scholar] [CrossRef]
  47. Chen, X.; Yan, G.Y. Novel human lncRNA-disease association inference based on lncRNA expression profiles. Bioinformatics 2013, 29, 2617–2624. [Google Scholar] [CrossRef]
  48. Chen, X.; Ren, B.; Chen, M.; Wang, Q.; Zhang, L.; Yan, G. NLLSS: Predicting synergistic drug combinations based on semi-supervised learning. PLOS Comput. Biol. 2016, 12, e1004975. [Google Scholar] [CrossRef]
  49. Ai, N.; Liang, Y.; Yuan, H.L.; Ou-Yang, D.; Liu, X.Y.; Xie, S.L.; Ji, Y.H. MHDMF: Prediction of miRNA–disease associations based on Deep Matrix Factorization with Multi-source Graph Convolutional Network. Comput. Biol. Med. 2022, 149, 106069. [Google Scholar] [CrossRef] [PubMed]
  50. Srivastava, N.; Salakhutdinov, R. Multimodal learning with deep Boltzmann machines. J. Mach. Learn. Res. 2014, 15, 2949–2980. [Google Scholar]
  51. Zhang, H.; Yang, Y.; Luan, H.; Yang, S.; Chua, T.-S. Start from scratch: Towards automatically identifying, modeling, and naming visual attributes. In Proceedings of the 22nd ACM international conference on Multimedia, Orlando, FL, USA, 3–7 November 2014; pp. 187–196. [Google Scholar]
  52. Siegel, R.L.; Miller, K.D.; Jemal, A. Cancer statistics, 2019. CA Cancer J. Clin. 2019, 69, 7–34. [Google Scholar] [CrossRef] [PubMed]
  53. Schrauder, M.G.; Strick, R.; Schulz-Wendtland, R.; Strissel, P.L.; Kahmann, L.; Loehberg, C.R.; Lux, M.P.; Jud, S.M.; Hartmann, A.; Hein, A.; et al. Circulating micro-RNAs as potential blood-based markers for early stage breast cancer detection. PLoS ONE 2012, 7, e29770. [Google Scholar] [CrossRef]
  54. Travis, W.D.; Travis, L.B.; Devesa, S.S. Lung cancer. Cancer 1995, 75, 191–202. [Google Scholar] [CrossRef] [PubMed]
  55. Lin, P.Y.; Yu, S.-L.; Yang, P.-C. MicroRNA in lung cancer. Br. J. Cancer 2010, 103, 1144–1148. [Google Scholar] [CrossRef] [PubMed]
  56. Vlachos, I.S.; Zagganas, K.; Paraskevopoulou, M.D.; Georgakilas, G.; Karagkouni, D.; Vergoulis, T.; Dalamagas, T.; Hatzigeorgiou, A.G. Diana-miRPath v3.0: Deciphering microRNA function with experimental support. Nucleic Acids Res. 2015, 43, W460–W466. [Google Scholar] [CrossRef]
  57. Wang, Y.; Ding, W.; Chen, C.; Niu, Z.; Pan, M.; Zhang, H. Roles of Hippo signaling in lung cancer. Indian J. Cancer 2015, 52 (Suppl. S1), e1–e5. [Google Scholar]
  58. Vázquez, P.F.; Carlini, M.J.; Daroqui, M.C.; Colombo, L.; Dalurzo, M.L.; Smith, D.E.; Grasselli, J.; Pallotta, M.G.; Ehrlich, M.; de Kier Joffé, E.D.B.; et al. TGF-beta specifically enhances the metastatic attributes of murine lung adenocarcinoma: Implications for human non-small cell lung cancer. Clin. Exp. Metastasis 2013, 30, 993–1007. [Google Scholar] [CrossRef]
  59. Kehl, T.; Kern, F.; Backes, C.; Fehlmann, T.; Stöckel, D.; Meese, E.; Lenhof, H.P.; Keller, A. miRPathDB 2.0: A novel release of the miRNA Pathway Dictionary Database. Nucleic Acids Res. 2020, 48, D142–D147. [Google Scholar] [CrossRef] [PubMed]
Figure 1. Workflow of node feature embedding. First, we constructed miRNA and disease similarity network through various similarity measuring methods. Next, we applied GCN to calculate new miRNAs and disease node feature embeddings that preserve network structure and properties. The arrows in the diagram indicate the transition from one step to the next in the workflow.
Biomedicines 13 00136 g001
Figure 2. Workflow of neural collaborative filtering for disease-related miRNA extraction. The arrows in the diagram indicate the transition from one step to the next in the workflow.
Biomedicines 13 00136 g002
Figure 3. Comparison of model performance based on global LOOCV.
Biomedicines 13 00136 g003
Figure 4. Comparison of model performance based on local LOOCV.
Biomedicines 13 00136 g004
Figure 5. Performance evaluation in the ablation study. GCNCF with GMF, MLP, and GCN modules achieved superior performance.
Biomedicines 13 00136 g005
Figure 6. Heatmap illustration based on lung cancer-related miRNAs.
Biomedicines 13 00136 g006
Table 1. Notations.
Table 1. Notations.
SymbolDescription
AAdjacency matrix
FFeature matrix
WWeight matrix
DDiagonal matrix of A
IIdentity matrix
Table 2. Performance evaluation by differentiating the number of hidden layers.
MLP0MLP1MLP2MLP3MLP4MLP5
AUC0.86580.88140.89570.91830.92160.9074
Table 3. Performance comparison based on various evaluation metrics (global LOOCV).
MethodAUCAUPRACCMCC
GCNCF0.92160.91240.90060.7819
NCMD0.91380.86020.87340.7514
NCMCMDA0.90970.86780.86130.7492
MDHGI0.88460.82810.82650.7252
GRNMF0.86470.83650.82090.7216
Table 4. Performance comparison based on various evaluation metrics (local LOOCV).
MethodAUCAUPRACCMCC
GCNCF0.90180.89310.88620.7547
NCMD0.88860.84680.85040.7269
NCMCMDA0.87370.85620.83720.7206
MDHGI0.86210.81170.80620.7186
GRNMF0.84960.83230.78760.6988
Table 5. Top 50 miRNA candidates observed to be related to breast cancer through GCNCF.
RankNameEvidenceRankNameEvidence
1hsa-mir-493-5pdbDEMC26hsa-mir-19bhmdd, dbDEMC
2hsa-mir-6510-3pdbDEMC27hsa-mir-1322dbDEMC
3hsa-mir-920dbDEMC28hsa-mir-297dbDEMC
4hsa-mir-590-5pdbDEMC29hsa-mir-766-3pdbDEMC
5hsa-mir-744dbDEMC30hsa-mir-485-5pdbDEMC
6hsa-mir-604dbDEMC31hsa-mir-365bhmdd
7hsa-mir-500dbDEMC32hsa-mir-523dbDEMC
8hsa-mir-4306hmdd, dbDEMC33hsa-mir-26bhmdd, dbDEMC
9hsa-mir-520bhmdd, dbDEMC34hsa-mir-205hmdd, miR2Disease, dbDEMC
10hsa-mir-4662a-5pdbDEMC35hsa-mir-515-2hmdd
11hsa-mir-371dbDEMC36hsa-mir-3614-5pdbDEMC
12hsa-mir-1224-3pdbDEMC37hsa-mir-409-3pdbDEMC
13hsa-mir-3150b-3pdbDEMC38hsa-mir-183-3pdbDEMC
14hsa-mir-21-3pdbDEMC39hsa-let-7a-1hmdd
15hsa-mir-200chmdd, miR2Disease, dbDEMC40hsa-mir-652hmdd
16hsa-mir-219-2-3pdbDEMC41hsa-mir-548qdbDEMC
17hsa-mir-106ahmdd, dbDEMC42hsa-mir-192-3pdbDEMC
18hsa-mir-1256dbDEMC43hsa-mir-503-5pdbDEMC
19hsa-mir-1277-3pdbDEMC44hsa-mir-1238dbDEMC
20hsa-mir-1306-5pdbDEMC45hsa-mir-1286dbDEMC
21hsa-mir-1-2hmdd46hsa-mir-517cdbDEMC
22hsa-mir-205-5pdbDEMC47hsa-mir-551b-3pdbDEMC
23hsa-mir-155hmdd, miR2Disease, dbDEMC48hsa-mir-203ahmdd, dbDEMC
24hsa-mir-362-3pdbDEMC49hsa-mir-663bdbDEMC
25hsa-mir-130b-3pdbDEMC50hsa-mir-653dbDEMC
Table 6. Top 50 miRNA candidates observed to be related to lung cancer through GCNCF.
RankNameEvidenceRankNameEvidence
1hsa-mir-31-5pdbDEMC26hsa-mir-181a-2-3pdbDEMC
2hsa-mir-758-3pdbDEMC27hsa-mir-370dbDEMC
3hsa-mir-199a-3pdbDEMC28hsa-mir-1303dbDEMC
4hsa-mir-29b-3pdbDEMC29hsa-mir-224hmdd, miR2Disease, dbDEMC
5hsa-mir-1306-3pdbDEMC30hsa-mir-34b-3pdbDEMC
6hsa-mir-625dbDEMC31hsa-mir-629hmdd, dbDEMC
7hsa-mir-193a-3pdbDEMC32hsa-mir-15bdbDEMC
8hsa-mir-299-5pdbDEMC33hsa-mir-500b-5pdbDEMC
9hsa-mir-1249-3pdbDEMC34hsa-mir-7-3hmdd
10hsa-mir-513-5pdbDEMC35hsa-mir-28dbDEMC
11hsa-mir-493-3pdbDEMC36hsa-mir-205hmdd, miR2Disease, dbDEMC
12hsa-mir-145-5pdbDEMC37hsa-mir-527dbDEMC
13hsa-mir-3917dbDEMC38hsa-mir-2110dbDEMC
14hsa-mir-1976dbDEMC39hsa-mir-378hmdd, dbDEMC
15hsa-mir-93-3pdbDEMC40hsa-mir-1201dbDEMC
16hsa-mir-363dbDEMC41hsa-mir-381hmdd, dbDEMC
17hsa-mir-144-5pdbDEMC42hsa-mir-645dbDEMC
18hsa-mir-196a-5pdbDEMC43hsa-mir-20a-3pdbDEMC
19hsa-mir-874-3pdbDEMC44hsa-mir-9-1hmdd
20hsa-mir-1245hmdd, dbDEMC45hsa-mir-4444dbDEMC
21hsa-mir-133ahmdd, dbDEMC46hsa-mir-599dbDEMC
22hsa-mir-148bhmdd, dbDEMC47hsa-mir-215hmdd, dbDEMC
23hsa-mir-7702dbDEMC48hsa-mir-4449dbDEMC
24hsa-mir-3684dbDEMC49hsa-let-7c-3pdbDEMC
25hsa-mir-141-3pdbDEMC50hsa-mir-192hmdd, miR2Disease, dbDEMC
Table 7. Enrichment results for lung cancer-related miRNAs.
KEGG Pathwayp-Value
Hippo signaling pathway4.02488531822 × 10−11
TGF-beta signaling pathway4.91330975548 × 10−7
Chronic myeloid leukemia0.00011125247798
ECM-receptor interaction0.000162660167095
Pathways in cancer0.000262647049558
Thyroid hormone signaling pathway0.000425690925118
Transcriptional misregulation in cancer0.000611500467761
FoxO signaling pathway0.00338511556088
Renal cell carcinoma0.00375870022186
Pancreatic cancer0.0182653781647
Small cell lung cancer0.0318225482279
Disclaimer/Publisher’s Note: The statements, opinions and data contained in all publications are solely those of the individual author(s) and contributor(s) and not of MDPI and/or the editor(s). MDPI and/or the editor(s) disclaim responsibility for any injury to people or property resulting from any ideas, methods, instructions or products referred to in the content.

