
High Expression of AhR and Environmental Pollution as AhR-Linked Ligands Impact on Oncogenic Signaling Pathways in Western Patients with Gastric Cancer—A Pilot Study

 ,
,  and
and 
Abstract
:1. Introduction
2. Materials and Methods
2.1. Patients and Tissue Samples
2.2. Total RNA Preparation and qRT-PCR
2.3. Immunohistochemistry
2.4. Cell Culture
2.5. Statistical Analysis
3. Results
3.1. Patient Characteristics
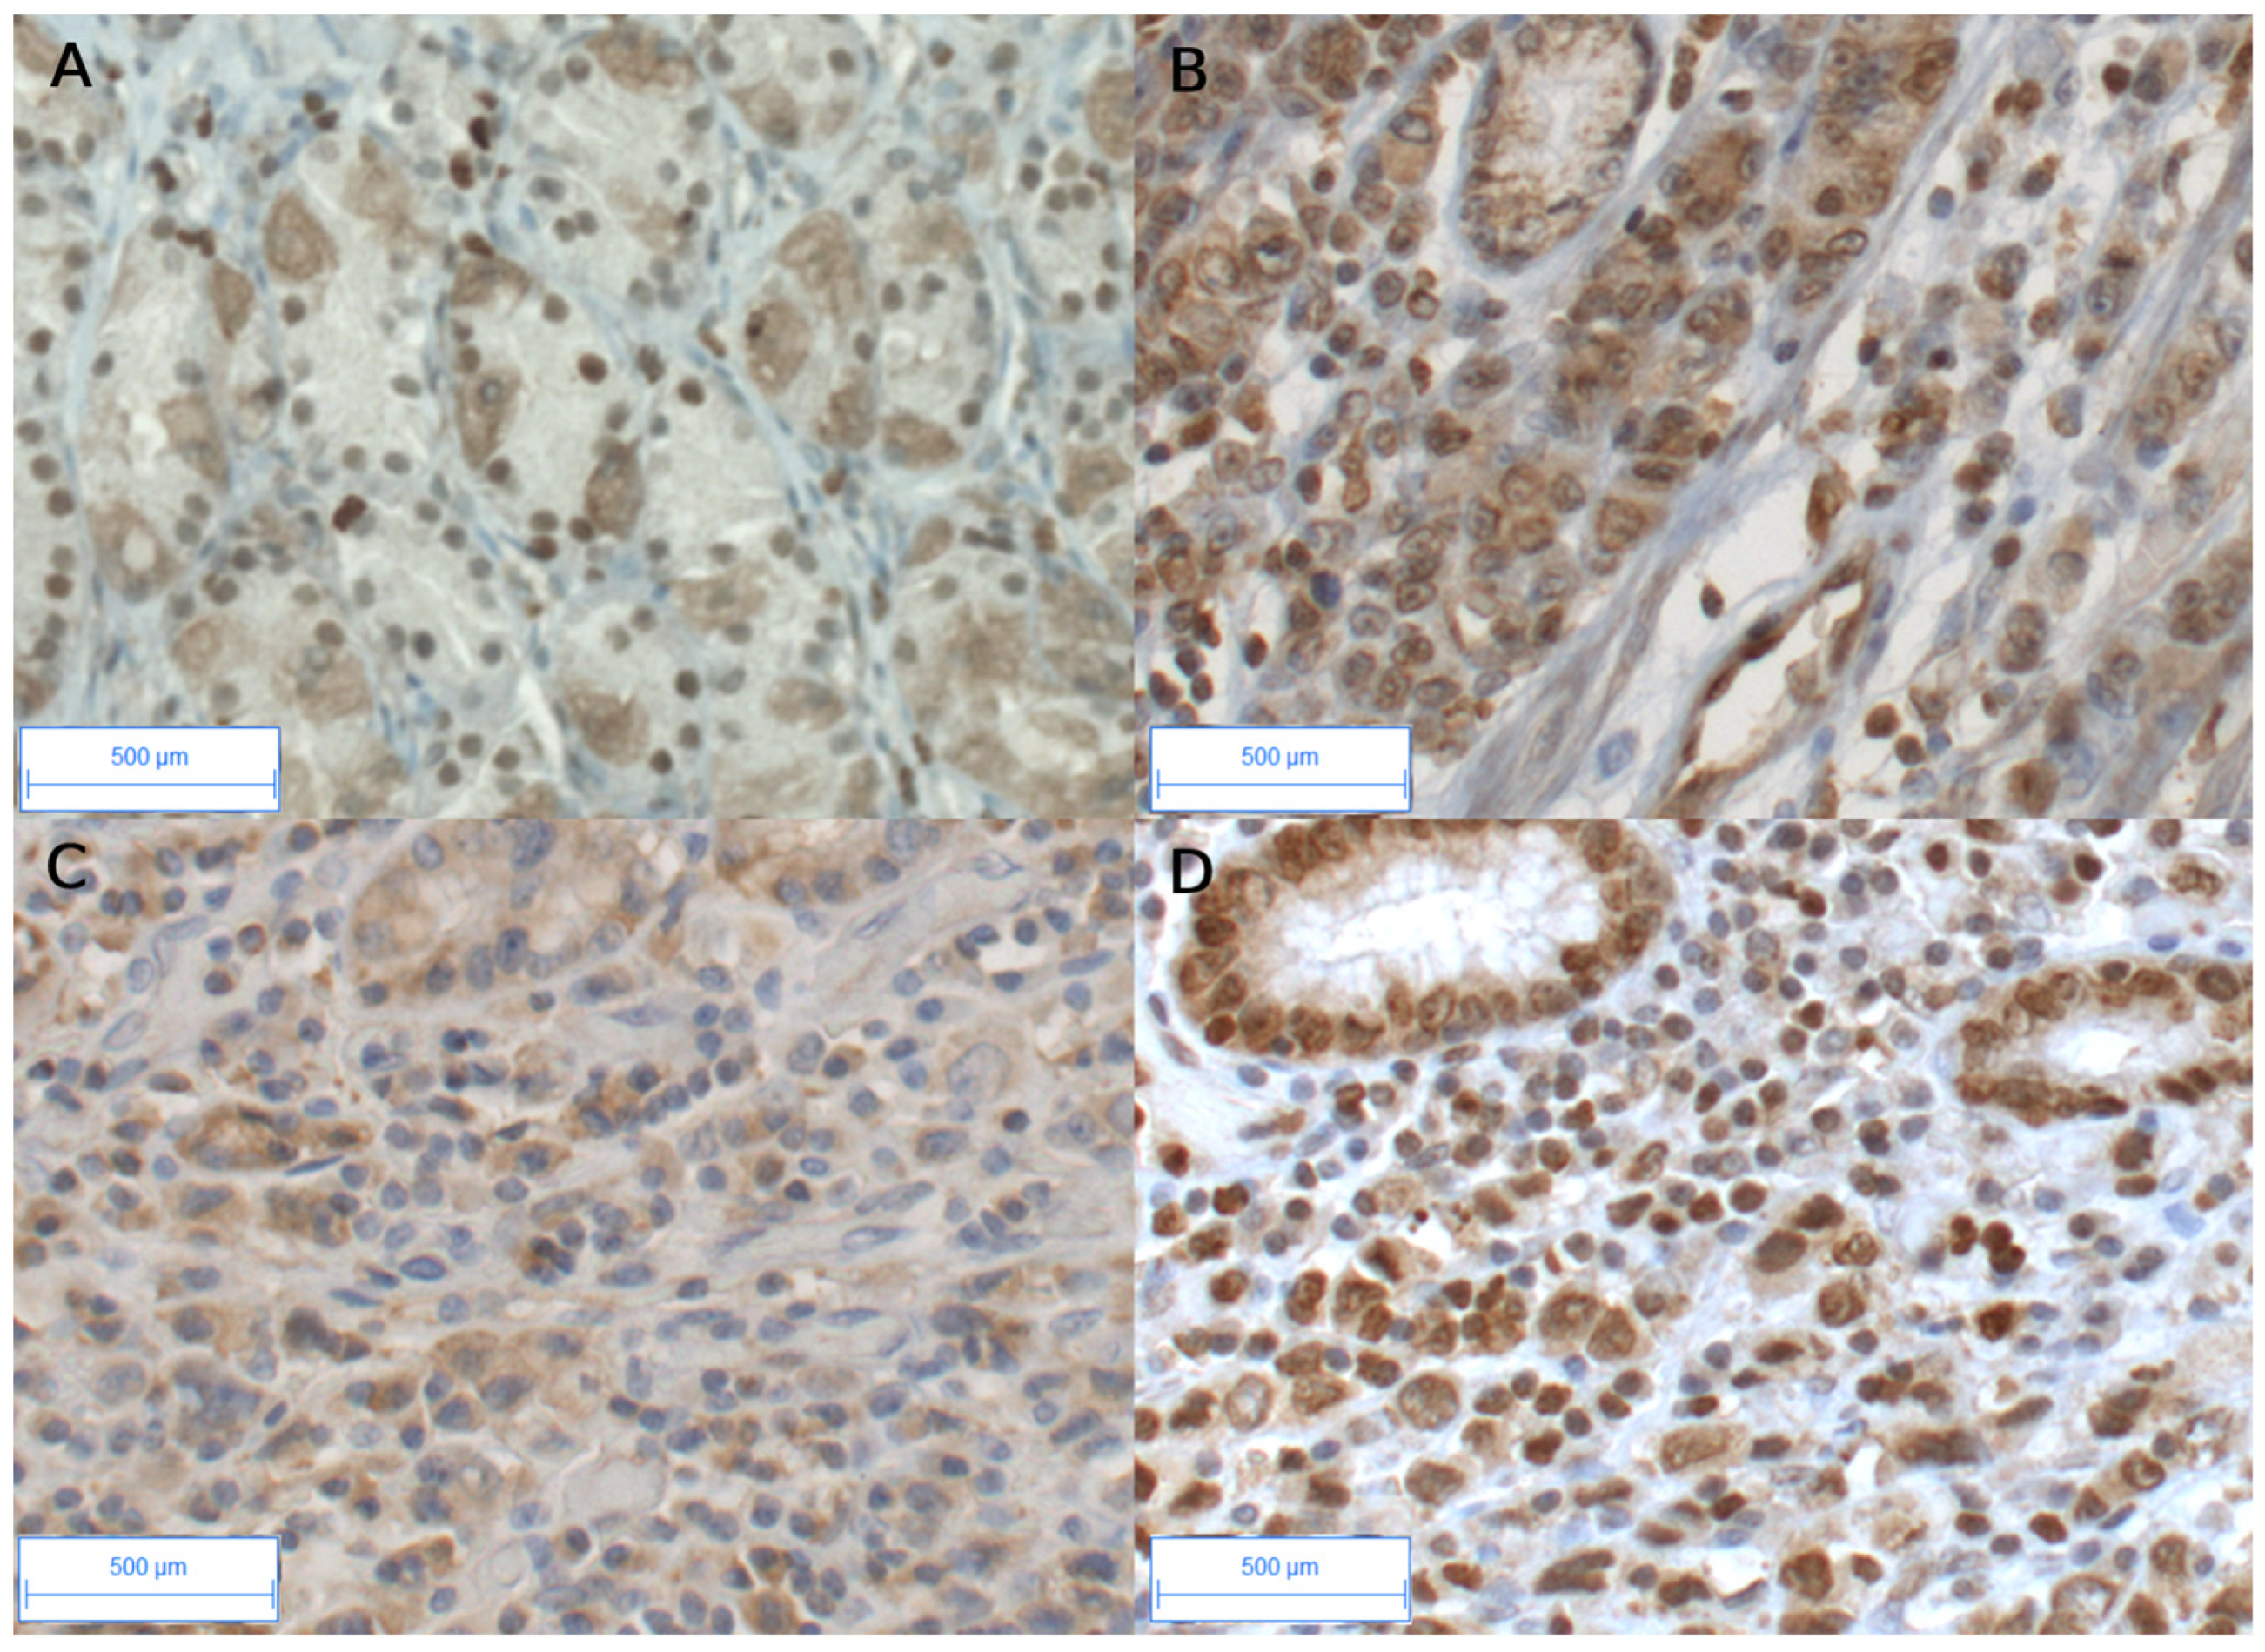
3.2. High AhR Expression in Gastric Tumors Both at the mRNA and Protein Levels
3.3. Expression of AhR-Target Genes Encoding Xenobiotic Metabolizing Enzymes in Gastric Cancers
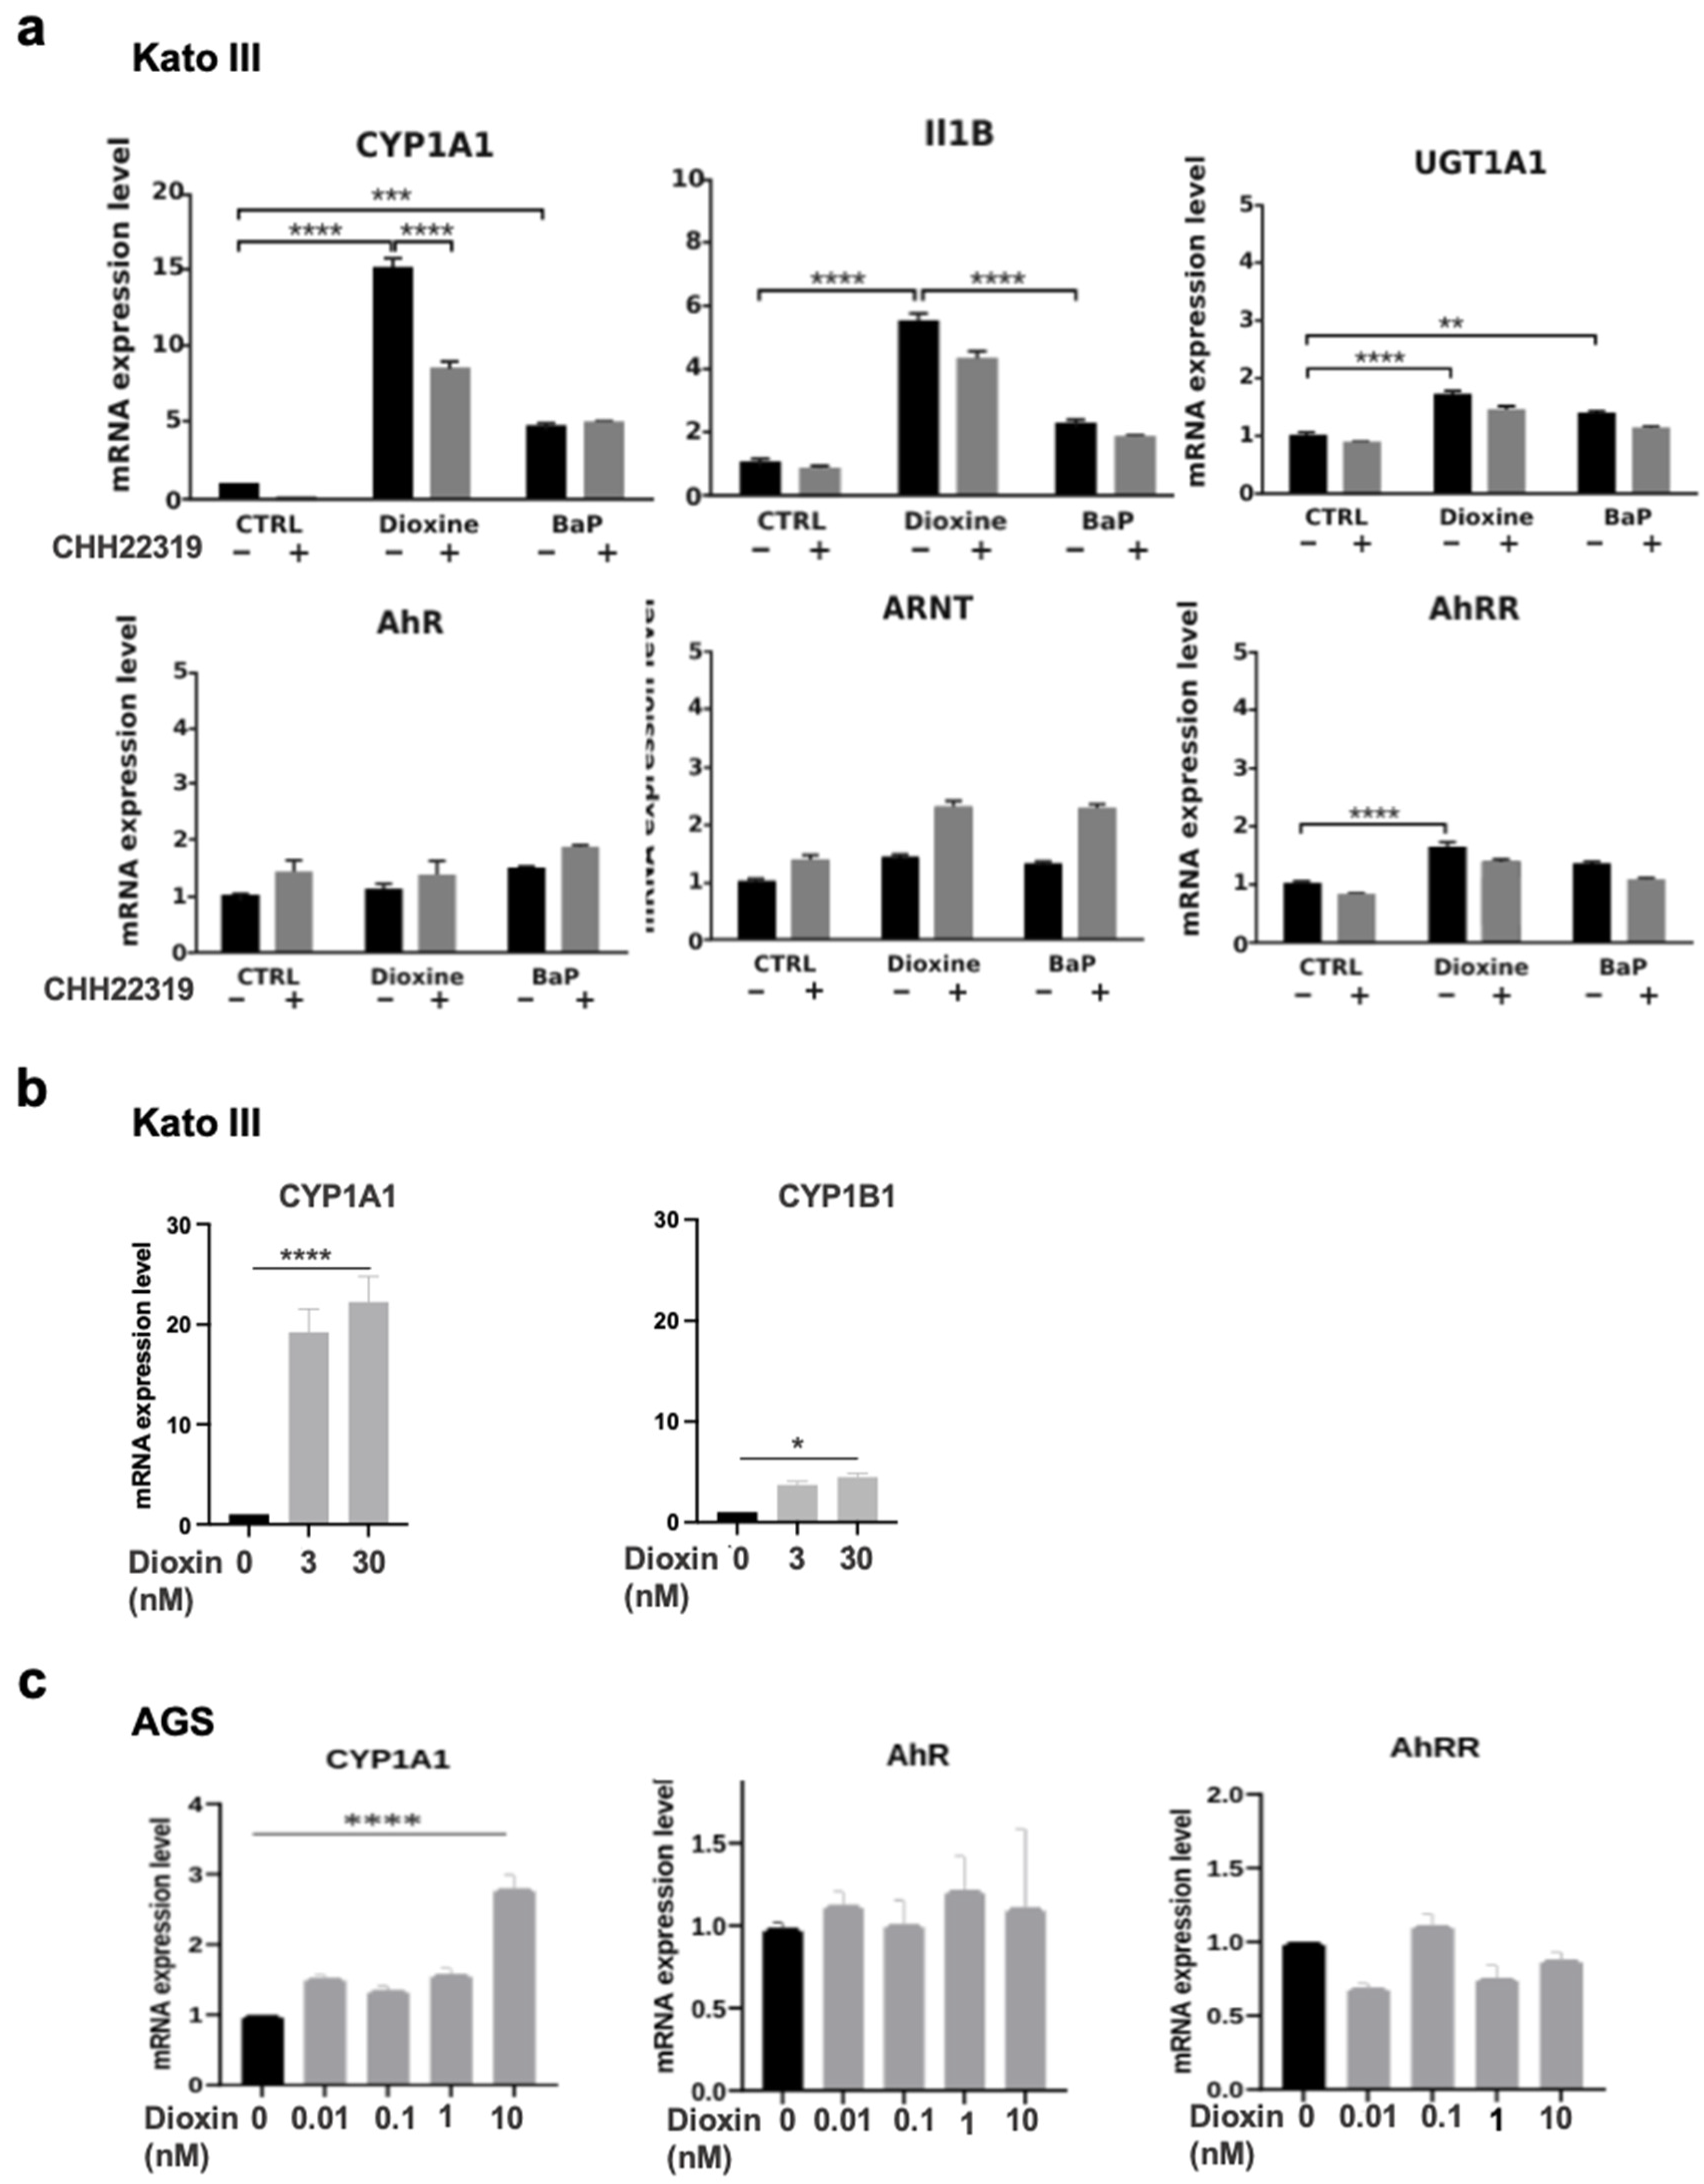
3.4. AhR Ligands Such as Environmental Ligands Induced mRNA Expression of CYP1A, IL1B, UGT1A1, and AhRR in Gastric Epithelial Cell Lines
3.5. Correlations of Expression of AhR, CYP1A1 and CYP1B1, AhRR with a Panel of Genes Involved in AhR-Related Signaling Pathways
4. Discussion
Supplementary Materials
Author Contributions
Funding
Institutional Review Board Statement
Informed Consent Statement
Data Availability Statement
Acknowledgments
Conflicts of Interest
References
- Bray, F.; Laversanne, M.; Sung, H.; Ferlay, J.; Siegel, R.L.; Soerjomataram, I.; Jemal, A. Global cancer statistics 2022: GLOBOCAN estimates of incidence and mortality worldwide for 36 cancers in 185 countries. CA Cancer J. Clin. 2024, 73, 229–263. [Google Scholar] [CrossRef]
- Thrift, A.P.; Wenker, T.N.; El-Serag, H.B. Global burden of gastric cancer: Epidemiological trends, risk factors, screening and prevention. Nat. Rev. Clin. Oncol. 2023, 20, 338–349. [Google Scholar] [CrossRef]
- Díaz Del Arco, C.; Estrada Muñoz, L.; Ortega Medina, L.; Molina Roldán, E.; Cerón Nieto, M.Á.; García Gómez de Las Heras, S.; Fernández Aceñero, M.J. Clinicopathological differences, risk factors and prognostic scores for western patients with intestinal and diffuse-type gastric cancer. World J. Gastrointest Oncol. 2022, 14, 1162–1174. [Google Scholar] [CrossRef]
- The Cancer Genome Atlas Research Network. Comprehensive molecular characterization of gastric adenocarcinoma. Nature 2014, 513, 202–209. [Google Scholar] [CrossRef] [PubMed]
- Lauren, P. The Two Histological Main Types of Gastric Carcinoma: Diffuse and So-Called Intestinal-Type Carcinoma. An Attempt at a Histo-Clinical Classification. Acta Pathol. Microbiol. Scand. 1965, 64, 31–49. [Google Scholar] [CrossRef]
- Piessen, G.; Messager, M.; Leteurtre, E.; Jean-Pierre, T.; Mariette, C. Signet ring cell histology is an independent predictor of poor prognosis in gastric adenocarcinoma regardless of tumoral clinical presentation. Ann. Surg. 2009, 250, 878–887. [Google Scholar] [CrossRef]
- Piessen, G.; Messager, M.; Le Malicot, K.; Robb, W.B.; Di Fiore, F.; Guilbert, M.; Moreau, M.; Christophe, V.; Adenis, A.; Mariette, C. Phase II/III multicentre randomised controlled trial evaluating a strategy of primary surgery and adjuvant chemotherapy versus peri-operative chemotherapy for resectable gastric signet ring cell adenocarcinomas-PRODIGE 19-FFCD1103-ADCI002. BMC Cancer 2013, 13, 281. [Google Scholar] [CrossRef]
- Henson, D.E.; Dittus, C.; Younes, M.; Nguyen, H.; Albores-Saavedra, J. Differential trends in the intestinal and diffuse types of gastric carcinoma in the United States, 1973–2000: Increase in the signet ring cell type. Arch. Pathol. Lab. Med. 2004, 128, 765–770. [Google Scholar] [CrossRef] [PubMed]
- Taghavi, S.; Jayarajan, S.N.; Davey, A.; Willis, A.I. Prognostic significance of signet ring gastric cancer. J. Clin. Oncol. 2012, 30, 3493–3498. [Google Scholar] [CrossRef] [PubMed]
- Perrot-Applanat, M.; Vacher, S.; Pimpie, C.; Chemlali, W.; Derieux, S.; Pocard, M.; Bieche, I. Differential gene expression in growth factors, epithelial mesenchymal transition and chemotaxis in the diffuse type compared with the intestinal type of gastric cancer. Oncol. Lett. 2019, 18, 674–686. [Google Scholar] [CrossRef]
- Pesatori, A.C.; Consonni, D.; Rubagotti, M.; Grillo, P.; Bertazzi, P.A. Cancer incidence in the population exposed to dioxin after the “Seveso accident”: Twenty years of follow-up. Environ. Health 2009, 8, 39. [Google Scholar] [CrossRef]
- Vacher, S.; Castagnet, P.; Chemlali, W.; Lallemand, F.; Meseure, D.; Pocard, M.; Bieche, I.; Perrot-Applanat, M. High AHR expression in breast tumors correlates with expression of genes from several signaling pathways namely inflammation and endogenous tryptophan metabolism. PLoS ONE 2018, 13, e0190619. [Google Scholar] [CrossRef] [PubMed]
- Perrot-Applanat, M.; Pimpie, C.; Cano-Sancho, G.; Antignac, J.P.; Pocard, M. Detection of Persistent Organic Pollutants in Omental Adipose Tissue from Patients with Diffuse-Gastric Cancer: A Pilot Study. Cancers 2021, 13, 4874. [Google Scholar] [CrossRef]
- Denison, M.S.; Nagy, S.R. Activation of the aryl hydrocarbon receptor by structurally diverse exogenous and endogenous chemicals. Annu. Rev. Pharmacol. Toxicol. 2003, 43, 309–334. [Google Scholar] [CrossRef]
- Denison, M.S.; Soshilov, A.A.; He, G.; DeGroot, D.E.; Zhao, B. Exactly the same but different: Promiscuity and diversity in the molecular mechanisms of action of the aryl hydrocarbon (dioxin) receptor. Toxicol. Sci. 2011, 124, 1–22. [Google Scholar] [CrossRef] [PubMed]
- Go, R.E.; Hwang, K.A.; Choi, K.C. Cytochrome P450 1 family and cancers. J. Steroid Biochem. Mol. Biol. 2015, 147, 24–30. [Google Scholar] [CrossRef]
- Fernandez-Salguero, P.; Pineau, T.; Hilbert, D.M.; McPhail, T.; Lee, S.S.; Kimura, S.; Nebert, D.W.; Rudikoff, S.; Ward, J.M.; Gonzalez, F.J. Immune system impairment and hepatic fibrosis in mice lacking the dioxin-binding Ah receptor. Science 1995, 268, 722–726. [Google Scholar] [CrossRef]
- Safe, S. Molecular biology of the Ah receptor and its role in carcinogenesis. Toxicol. Lett. 2001, 120, 1–7. [Google Scholar] [CrossRef] [PubMed]
- Roman, A.C.; Carvajal-Gonzalez, J.M.; Rico-Leo, E.M.; Fernandez-Salguero, P.M. Dioxin receptor deficiency impairs angiogenesis by a mechanism involving VEGF-A depletion in the endothelium and transforming growth factor-beta overexpression in the stroma. J. Biol. Chem. 2009, 284, 25135–25148. [Google Scholar] [CrossRef]
- Feng, S.; Cao, Z.; Wang, X. Role of aryl hydrocarbon receptor in cancer. Biochim. Biophys. Acta 2013, 1836, 197–210. [Google Scholar] [CrossRef]
- Quintana, F.J.; Sherr, D.H. Aryl hydrocarbon receptor control of adaptive immunity. Pharmacol. Rev. 2013, 65, 1148–1161. [Google Scholar] [CrossRef]
- Stockinger, B.; Di Meglio, P.; Gialitakis, M.; Duarte, J.H. The aryl hydrocarbon receptor: Multitasking in the immune system. Annu. Rev. Immunol. 2014, 32, 403–432. [Google Scholar] [CrossRef]
- Litzenburger, U.M.; Opitz, C.A.; Sahm, F.; Rauschenbach, K.J.; Trump, S.; Winter, M.; Ott, M.; Ochs, K.; Lutz, C.; Liu, X.; et al. Constitutive IDO expression in human cancer is sustained by an autocrine signaling loop involving IL-6, STAT3 and the AHR. Oncotarget 2014, 5, 1038–1051. [Google Scholar] [CrossRef]
- Andersson, P.; McGuire, J.; Rubio, C.; Gradin, K.; Whitelaw, M.L.; Pettersson, S.; Hanberg, A.; Poellinger, L. A constitutively active dioxin/aryl hydrocarbon receptor induces stomach tumors. Proc. Natl. Acad. Sci. USA 2002, 99, 9990–9995. [Google Scholar] [CrossRef] [PubMed]
- Andersson, P.; Rubio, C.; Poellinger, L.; Hanberg, A. Gastric hamartomatous tumours in a transgenic mouse model expressing an activated dioxin/Ah receptor. Anticancer Res. 2005, 25, 903–911. [Google Scholar] [PubMed]
- Brunnberg, S.; Andersson, P.; Lindstam, M.; Paulson, I.; Poellinger, L.; Hanberg, A. The constitutively active Ah receptor (CA-Ahr) mouse as a potential model for dioxin exposure--effects in vital organs. Toxicology 2006, 224, 191–201. [Google Scholar] [CrossRef] [PubMed]
- Labib, S.; Guo, C.H.; Williams, A.; Yauk, C.L.; White, P.A.; Halappanavar, S. Toxicogenomic outcomes predictive of forestomach carcinogenesis following exposure to benzo(a)pyrene: Relevance to human cancer risk. Toxicol. Appl. Pharmacol. 2013, 273, 269–280. [Google Scholar] [CrossRef]
- Peng, T.L.; Chen, J.; Mao, W.; Song, X.; Chen, M.H. Aryl hydrocarbon receptor pathway activation enhances gastric cancer cell invasiveness likely through a c-Jun-dependent induction of matrix metalloproteinase-9. BMC Cell Biol. 2009, 10, 27. [Google Scholar] [CrossRef]
- Perrot-Applanat, M.; Pimpie, C.; Vacher, S.; Bieche, I.; Pocard, M.; Baud, V. Differential Expression of Genes Involved in Metabolism and Immune Response in Diffuse and Intestinal Gastric Cancers, a Pilot Ptudy. Biomedicines 2022, 10, 240. [Google Scholar] [CrossRef] [PubMed]
- Washington, K. 7th edition of the AJCC cancer staging manual: Stomach. Ann. Surg. Oncol. 2010, 17, 3077–3079. [Google Scholar] [CrossRef]
- Sano, T.; Coit, D.G.; Kim, H.H.; Roviello, F.; Kassab, P.; Wittekind, C.; Yamamoto, Y.; Ohashi, Y. Proposal of a new stage grouping of gastric cancer for TNM classification: International Gastric Cancer Association staging project. Gastric Cancer 2017, 20, 217–225. [Google Scholar] [CrossRef] [PubMed]
- Shu, P.; Qin, J.; Shen, K.; Chen, W.; Liu, F.; Fang, Y.; Wang, X.; Wang, H.; Shen, Z.; Sun, Y.; et al. The IGCA staging system is more accurate than AJCC7 system in stratifying survival of patients with gastric cancer in stage III. BMC Cancer 2017, 17, 238. [Google Scholar] [CrossRef] [PubMed]
- Ji, X.; Bu, Z.D.; Yan, Y.; Li, Z.Y.; Wu, A.W.; Zhang, L.H.; Zhang, J.; Wu, X.J.; Zong, X.L.; Li, S.X.; et al. The 8th edition of the American Joint Committee on Cancer tumor-node-metastasis staging system for gastric cancer is superior to the 7th edition: Results from a Chinese mono-institutional study of 1663 patients. Gastric Cancer 2017, 21, 643–652. [Google Scholar] [CrossRef] [PubMed]
- Bieche, I.; Onody, P.; Laurendeau, I.; Olivi, M.; Vidaud, D.; Lidereau, R.; Vidaud, M. Real-time reverse transcription-PCR assay for future management of ERBB2-based clinical applications. Clin. Chem. 1999, 45, 1148–1156. [Google Scholar] [CrossRef] [PubMed]
- Yin, X.F.; Chen, J.; Mao, W.; Wang, Y.H.; Chen, M.H. Downregulation of aryl hydrocarbon receptor expression decreases gastric cancer cell growth and invasion. Oncol. Rep. 2013, 30, 364–370. [Google Scholar] [CrossRef]
- Nam, S.; Lee, Y.; Kim, J.H. RHOA protein expression correlates with clinical features in gastric cancer: A systematic review and meta-analysis. BMC Cancer 2022, 22, 798. [Google Scholar] [CrossRef] [PubMed]
- Kakiuchi, M.; Nishizawa, T.; Ueda, H.; Gotoh, K.; Tanaka, A.; Hayashi, A.; Yamamoto, S.; Tatsuno, K.; Katoh, H.; Watanabe, Y.; et al. Recurrent gain-of-function mutations of RHOA in diffuse-type gastric carcinoma. Nat. Genet. 2014, 46, 583–587. [Google Scholar] [CrossRef] [PubMed]
- Ridley, A.J. RhoA, RhoB and RhoC have different roles in cancer cell migration. J. Microsc. 2013, 251, 242–249. [Google Scholar] [CrossRef]
- Song, L.; Guo, Y.; Xu, B. Expressions of Ras Homolog Gene Family, Member A (RhoA) and Cyclooxygenase-2 (COX-2) Proteins in Early Gastric Cancer and Their Role in the Development of Gastric Cancer. Med. Sci. Monit. 2017, 23, 2979–2984. [Google Scholar] [CrossRef] [PubMed]
- Lawson, C.D.; Ridley, A.J. Rho GTPase signaling complexes in cell migration and invasion. J. Cell Biol. 2018, 217, 447–457. [Google Scholar] [CrossRef]
- Yoon, J.H.; Choi, W.S.; Kim, O.; Choi, B.J.; Nam, S.W.; Lee, J.Y.; Park, W.S. Gastrokine 1 inhibits gastric cancer cell migration and invasion by downregulating RhoA expression. Gastric Cancer 2017, 20, 274–285. [Google Scholar] [CrossRef]
- Wang, R.; Song, S.; Harada, K.; Ghazanfari Amlashi, F.; Badgwell, B.; Pizzi, M.P.; Xu, Y.; Zhao, W.; Dong, X.; Jin, J.; et al. Multiplex profiling of peritoneal metastases from gastric adenocarcinoma identified novel targets and molecular subtypes that predict treatment response. Gut 2020, 69, 18–31. [Google Scholar] [CrossRef]
- Murray, G.I.; Taylor, M.C.; McFadyen, M.C.; McKay, J.A.; Greenlee, W.F.; Burke, M.D.; Melvin, W.T. Tumor-specific expression of cytochrome P450 CYP1B1. Cancer Res. 1997, 57, 3026–3031. [Google Scholar]
- Murray, G.I.; Taylor, M.C.; Burke, M.D.; Melvin, W.T. Enhanced expression of cytochrome P450 in stomach cancer. Br. J. Cancer 1998, 77, 1040–1044. [Google Scholar] [CrossRef]
- Shimada, T.; Hayes, C.L.; Yamazaki, H.; Amin, S.; Hecht, S.S.; Guengerich, F.P.; Sutter, T.R. Activation of chemically diverse procarcinogens by human cytochrome P-450 1B1. Cancer Res. 1996, 56, 2979–2984. [Google Scholar] [PubMed]
- Buters, J.T.; Mahadevan, B.; Quintanilla-Martinez, L.; Gonzalez, F.J.; Greim, H.; Baird, W.M.; Luch, A. Cytochrome P450 1B1 determines susceptibility to dibenzo[a,l]pyrene-induced tumor formation. Chem. Res. Toxicol. 2002, 15, 1127–1135. [Google Scholar] [CrossRef] [PubMed]
- Shiizaki, K.; Kawanishi, M.; Yagi, T. Modulation of benzo[a]pyrene-DNA adduct formation by CYP1 inducer and inhibitor. Genes Environ. 2017, 39, 14. [Google Scholar] [CrossRef]
- Wang, Z.; Snyder, M.; Kenison, J.E.; Yang, K.; Lara, B.; Lydell, E.; Bennani, K.; Novikov, O.; Federico, A.; Monti, S.; et al. How the AHR Became Important in Cancer: The Role of Chronically Active AHR in Cancer Aggression. Int. J. Mol. Sci. 2020, 22, 387. [Google Scholar] [CrossRef]
- Nebert, D.W.; Shi, Z.; Galvez-Peralta, M.; Uno, S.; Dragin, N. Oral benzo[a]pyrene: Understanding pharmacokinetics, detoxication, and consequences–Cyp1 knockout mouse lines as a paradigm. Mol. Pharmacol. 2013, 84, 304–313. [Google Scholar] [CrossRef]
- Zhang, H.; Zhang, X.; Wang, Y.; Bai, P.; Hayakawa, K.; Zhang, L.; Tang, N. Characteristics and Influencing Factors of Polycyclic Aromatic Hydrocarbons Emitted from Open Burning and Stove Burning of Biomass: A Brief Review. Int. J. Environ. Res. Public Health 2022, 19, 3944. [Google Scholar] [CrossRef]
- Dere, E.; Lo, R.; Celius, T.; Matthews, J.; Zacharewski, T.R. Integration of genome-wide computation DRE search, AhR ChIP-chip and gene expression analyses of TCDD-elicited responses in the mouse liver. BMC Genom. 2011, 12, 365. [Google Scholar] [CrossRef] [PubMed]
- Eltom, S.E.; Larsen, M.C.; Jefcoate, C.R. Expression of CYP1B1 but not CYP1A1 by primary cultured human mammary stromal fibroblasts constitutively and in response to dioxin exposure: Role of the Ah receptor. Carcinogenesis 1998, 19, 1437–1444. [Google Scholar] [CrossRef] [PubMed]
- Sparfel, L.; Pinel-Marie, M.L.; Boize, M.; Koscielny, S.; Desmots, S.; Pery, A.; Fardel, O. Transcriptional signature of human macrophages exposed to the environmental contaminant benzo(a)pyrene. Toxicol. Sci. 2010, 114, 247–259. [Google Scholar] [CrossRef] [PubMed]
- Kwon, Y.J.; Baek, H.S.; Ye, D.J.; Shin, S.; Kim, D.; Chun, Y.J. CYP1B1 Enhances Cell Proliferation and Metastasis through Induction of EMT and Activation of Wnt/beta-Catenin Signaling via Sp1 Upregulation. PLoS ONE 2016, 11, e0151598. [Google Scholar] [CrossRef]
- Mohamed, H.T.; Gadalla, R.; El-Husseiny, N.; Hassan, H.; Wang, Z.; Ibrahim, S.A.; El-Shinawi, M.; Sherr, D.H.; Mohamed, M.M. Inflammatory breast cancer: Activation of the aryl hydrocarbon receptor and its target CYP1B1 correlates closely with Wnt5a/b-beta-catenin signalling, the stem cell phenotype and disease progression. J. Adv. Res. 2019, 16, 75–86. [Google Scholar] [CrossRef] [PubMed]
- Ohta, H.; Aoyagi, K.; Fukaya, M.; Danjoh, I.; Ohta, A.; Isohata, N.; Saeki, N.; Taniguchi, H.; Sakamoto, H.; Shimoda, T.; et al. Cross talk between hedgehog and epithelial-mesenchymal transition pathways in gastric pit cells and in diffuse-type gastric cancers. Br. J. Cancer 2009, 100, 389–398. [Google Scholar] [CrossRef]
- Katoh, M. Genomic testing, tumor microenvironment and targeted therapy of Hedgehog-related human cancers. Clin. Sci. 2019, 133, 953–970. [Google Scholar] [CrossRef] [PubMed]
- Weitzman, J.B. Co-regulation of mouse genes predicts function. J. Biol. 2004, 3, 19. [Google Scholar] [CrossRef]
- Ishida, M.; Mikami, S.; Kikuchi, E.; Kosaka, T.; Miyajima, A.; Nakagawa, K.; Mukai, M.; Okada, Y.; Oya, M. Activation of the aryl hydrocarbon receptor pathway enhances cancer cell invasion by upregulating the MMP expression and is associated with poor prognosis in upper urinary tract urothelial cancer. Carcinogenesis 2010, 31, 287–295. [Google Scholar] [CrossRef] [PubMed]
- Barouki, R.; Coumoul, X. Cell migration and metastasis markers as targets of environmental pollutants and the Aryl hydrocarbon receptor. Cell Adhes. Migr. 2010, 4, 72–76. [Google Scholar] [CrossRef]
- Otsuki, S.; Inokuchi, M.; Enjoji, M.; Ishikawa, T.; Takagi, Y.; Kato, K.; Yamada, H.; Kojima, K.; Sugihara, K. Vimentin expression is associated with decreased survival in gastric cancer. Oncol. Rep. 2011, 25, 1235–1242. [Google Scholar] [CrossRef]
- Ochieng, J.; Nangami, G.N.; Ogunkua, O.; Miousse, I.R.; Koturbash, I.; Odero-Marah, V.; McCawley, L.J.; Nangia-Makker, P.; Ahmed, N.; Luqmani, Y.; et al. The impact of low-dose carcinogens and environmental disruptors on tissue invasion and metastasis. Carcinogenesis 2015, 36, S128–S159. [Google Scholar] [CrossRef] [PubMed]
- Lagunas-Rangel, F.A.; Linnea-Niemi, J.V.; Kudlak, B.; Williams, M.J.; Jonsson, J.; Schioth, H.B. Role of the Synergistic Interactions of Environmental Pollutants in the Development of Cancer. Geohealth 2022, 6, e2021GH000552. [Google Scholar] [CrossRef]
- Li, S.; Yuan, J.; Che, S.; Zhang, L.; Ruan, Z.; Sun, X. Decabromodiphenyl ether induces ROS-mediated intestinal toxicity through the Keap1-Nrf2 pathway. J. Biochem. Mol. Toxicol. 2022, 36, e22995. [Google Scholar] [CrossRef]
- Li, Y.F.; Wang, D.D.; Zhao, B.W.; Wang, W.; Yuan, S.Q.; Huang, C.Y.; Chen, Y.M.; Zheng, Y.; Keshari, R.P.; Xia, J.C.; et al. Poor prognosis of gastric adenocarcinoma with decreased expression of AHRR. PLoS ONE 2012, 7, e43555. [Google Scholar] [CrossRef] [PubMed]
- Zudaire, E.; Cuesta, N.; Murty, V.; Woodson, K.; Adams, L.; Gonzalez, N.; Martinez, A.; Narayan, G.; Kirsch, I.; Franklin, W.; et al. The aryl hydrocarbon receptor repressor is a putative tumor suppressor gene in multiple human cancers. J. Clin. Investig. 2008, 118, 640–650. [Google Scholar] [CrossRef]
- Lagunas-Rangel, F.A.; Liu, W.; Schioth, H.B. Can Exposure to Environmental Pollutants Be Associated with Less Effective Chemotherapy in Cancer Patients? Int. J. Environ. Res. Public Health 2022, 19, 2064. [Google Scholar] [CrossRef]


| Total GC (n = 29) | Diffuse/Poorly Cohesive GC * (n = 13) (45%) | Intestinal-Subtype GC ** (n = 16) (55%) | p Value a | |
|---|---|---|---|---|
| Gender, n (%) | ||||
| Male | 13/29 | 6/13 (46%) | 7/16 (43%) | 0.90 (NS) |
| Female | 16/29 | 7/13 (54%) | 9/16 (56%) | |
| Age (years, median) | 63 ± 17 | 57 (27–71) | 75 (59–82) | 0.0004 b |
| Smoking | ||||
| Negative | 12/22 | 4/12 | 8/12 | 0.77 (NS) |
| Positive | 10/22 | 3/10 | 7/10 | |
| Tumor size (mm), n (%) | ||||
| <50 | 10/27 | 4/11 (36%) | 6/16 (37%) | 0.10 (NS) b |
| ≥50 | 17/27 | 7/11 (64%) | 10/16 (63%) | 0.95 (NS) |
| Depth tumor invasion (T) | ||||
| T1–T2 | 6/29 | 2/13 (15%) | 4/16 (33%) | 0.5 (NS) |
| T3–T4 | 23/29 | 11/13 (85%) | 12/16 (67%) | |
| Lymphatic invasion (N) | ||||
| Negative | 11/28 | 1/13 (7%) | 10/15 (67%) | 0.0014 |
| Positive | 17/28 | 12/13 (92%) | 5/15 (33%) | |
| Metastasis (M), n (%) | ||||
| Negative | 24/29 | 9/13 (69%) | 15/16 (94%) | 0.14 (NS) |
| Positive | 5/29 | 4/13 (31%) | 1/16 (6%) | |
| TNM status | ||||
| I–II | 16/29 | 5/13 (38.5%) | 11/16 (69%) | 0.10 (NS) |
| III–IV | 13/29 | 8/13 (61.5%) | 5/16 (31%) | |
| Vascular invasion, n + (%) | ||||
| Negative | 9/29 | 3/13 (23%) | 6/16 (38%) | 0.67 (NS) |
| Positive | 20/29 | 10/13 (77%) | 10/16 (62%) | |
| Neural invasion, n (%) | ||||
| Negative | 23/29 | 2/13 (15%) | 4/16 (25%) | 0.66 (NS) |
| Positive | 6/29 | 11/13 (68%) | 12/16 (75%) |
| Genes | Nontumoral Gastric Tissues (n = 11) | All Tumors (n = 29) | p Value a | Diffuse GC vs. PT (n = 13) | p Value a | Intestinal GC vs. PT (n = 16) | p Value a | p Value (GC Subtypes) |
|---|---|---|---|---|---|---|---|---|
| AhR and Target Genes | ||||||||
| AhR | 1 (0.37–1.64) | 1.94 (0.55–3.53) | 0.002 | 2.12 (0.55–3.35) | 0.001 | 1.60 (0.65–3.53) | 0.003 | 0.13 (NS) |
| CYP1B1 | 1 (0.52–2.90) | 1.45 (0.13–4.90) | 0.91 (NS) | 1.62 (0.43–4.90) | 0.014 | 1.22 (0.13–4.0) | 0.82 (NS) | 0.19 (NS) |
| CYP1A1 | 0 (0–5.6) | 1.37 (0–86) | 0.26 (NS) | 0.43 (0–30) | 0.73 (NS) | NS | ||
| AhRR | 1 (0.23–1.66) | 1.25 (0.19–3.93) | >0.999 (NS) | 2.65 (0.74–3.96) | 0.007 | 0.89 (0.19–3.85) | 0.88 (NS) | 0.017 |
| (A) | ||||||||
| All tumors, n = 29 | ||||||||
| AhRR | CYP1B1 | CYP1A1 | ||||||
| Gender | p = 0.75 | p = 0.47 | p = 0.063 | |||||
| Male (n = 13) | 1.63 (0.29–3.96) | 1.62 (0.13–4.03) | 1.37 (0–30.1) | |||||
| Female (n = 16) | 1.18 (0.29–3.85) | 1.34 (0.32–4.9) | 0 (0–86) | |||||
| Age | p = 0.27 | p = 0.18 | p = 0.97 | |||||
| <60 years (n = 9) | 1.66 (0.74–3.96) | 1.47 (1.23–4.9) | 0.67 (0–30.1) | |||||
| >60 years(n = 20) | 1.17 (0.19–3.85) | 1.21 (0.13–4) | 0.65 (0–86) | |||||
| Smoking | p = 0.54 | p = 0.34 | p = 0.42 | |||||
| Negative (n = 12) | 1.21 (0.42–1.67) | 1.63 (0.36–4) | 0.33 (0–1.98) | |||||
| Positive (n = 10) | 1.65 (0.29–3.85) | 0.98 (0.13–5) | 0.43 (0–86) | |||||
| Tumor invasion (T) | p = 0.11 | p = 0.18 | p = 0.63 | |||||
| T1–T2 (n = 6) | 0.43 (0.19–3.5) | 0.94 (0.13–2.44) | 0.47 (0–86) | |||||
| T3–T4 (n = 23) | 1.31 (0.42–3.87) | 1.47 (0.32–4.9) | 0.67 (0–30.1) | |||||
| Lymphatic invasion | p = 0.032 | p = 0.014 | p = 0.06 | |||||
| Negative (n = 11) | 0.74 (0.19–3.85) | 0.5 (0.3–2.5) | 0 (0–1.39) | |||||
| Positive (n = 17) | 1.67 (0.42–3.96) | 1.6 (0.4–4.9) | 1 (0–86) | |||||
| Metastasis (M) | p = 0.59 | p = 0.55 | p = 0.59 | |||||
| Negative (n = 24) | 1.28 (0.19–4.0) | 1.39 (0.13–4) | 0.68 (0–86) | |||||
| Positive (n = 5) | 1.15 (0.74–2.38) | 1.45 (0.43–4.9) | 0 (0–30.1) | |||||
| TNM | p = 0.35 | p = 0.045 | p = 0.10 | |||||
| I–II (n = 16) | 1.06 (0.19–3.96) | 1.19 (0.13–3) | 0.12 (0–4.01) | |||||
| III–IV (n = 13) | 1.63 (0.42–3.66) | 1.62 (0.43–4.9) | 1.37 (0–86) | |||||
| Vascular invasion, | p = 0.09 | p = 0.39 | p = 0.45 | |||||
| Negative (n = 9) | 0.74 (0.2–4) | 1.27 (0.36–2.32) | 0.61 (0–4.01) | |||||
| Positive (n = 20) | 1.65 (0.3–3.8) | 1.54 (0.13–4.9) | 0.71 (0–86) | |||||
| Neural invasion | p = 0.38 | p = 0.41 | p = 0.38 | |||||
| Negative (n = 6) | 0.79 (0.19–3.53) | 1.76 (0.72–2.51) | 1.04 (0–86) | |||||
| Positive (n = 23) | 1.31 (0.29–3.96) | 1.4 (0.13–4.9) | 0.61 (0–30.1) | |||||
| (B) | ||||||||
| Diffuse subtype GC, n = 13 | Intestinal subtype GC, n = 16 | |||||||
| n= | AhRR | CYP1B1 | CYP1A1 | n= | AhRR | CYP1B1 | CYP1A1 | |
| Gender | p = 0.42 | p = 0.92 | p = 0.83 | p = 0.88 | p = 0.67 | p = 0.058 | ||
| Male | 6 | 2.2 (1.23–3.96) | 1.76 (1.15–2.32) | 1.38 (0–4) | 7 | 0.93 (0.29–2.38) | 1.45 (0.13–4) | 0.76 (0–30.1) |
| Female | 7 | 2.65 (0.74–3.5) | 1.47 (0.43–4.9) | 0 (0–86) | 9 | 0.85 (0.19–3.85) | 1.16 (0.32–2.5) | 0 (0–1.39) |
| Age | p = 0.27 | p = 0.49 | p = 0.16 | ND | ND | ND | ||
| <60 years | 8 | 1.64 (0.74–3.96) | 1.68 (1.23–4.9) | 0.33 (0–4) | 1 | 2.38 | 1.45 | 30.1 |
| >60 years | 5 | 3.17 (1.15–3.66) | 1.62 (0.43–2.44) | 1.51 (0–86) | 15 | 0.85 (0.19–3.85) | 1.16 (0.13–4) | 0.25 (0–3.31) |
| Smoking | p = 0.46 | p = 0.23 | p = 0.40 | p = 0.84 | p = 0.054 | p = 0.86 | ||
| Negative | 4 | 1.43 (0.74–1.66) | 1.78 (1.31–2.32) | 0.33 (0–1.37) | 8 | 1.02 (0.42–1.67) | 1.63 (0.36–4) | 0.38 (0–1.98) |
| Positive | 3 | 3.17 (0.74–3.53) | 2.44 (1.85–4.9) | 62.55 (0–86) | 7 | 0.93 (0.29–3.85) | 0.49 (0.13–3) | 0.25 (0–30.1) |
| Tumor invasion | ND | ND | ND | p = 0.002 | p = 0.055 | p = 0.36 | ||
| T1–T2 | 2 | 3.35 (3.17–3.53) | 2.14 (1.85–2.44) | 74.3 (62.5–86) | 4 | 0.31 (0.19–0.53) | 0.46 (0.13–1.2) | 0.12 (0–0.7) |
| T3–T4 | 11 | 1.66 (0.74–3.96) | 1.47 (0.43–4.9) | 0.67 (0–4) | 12 | 1.22 (0.42–3.85) | 1.52 (0.32–4) | 0.68 (0–30.1) |
| Lymphatic invasion | ND | ND | ND | p = 0.25 | p = 0.019 | p = 0.04 | ||
| Negative | 1 | 1.63 | 2.32 | 1.37 | 10 | 0.73 (0.19–3.85) | 0.52 (0.13–2.5) | 0 (0–1.39) |
| Positive | 12 | 2.7 (0.74–3.96) | 1.54 (0.43–4.9) | 1.03 (0–86) | 5 | 1.31 (0.42–2.38) | 1.59 (1.27–4) | 1 (0–30.1) |
| Metastasis | p = 0.006 | p = 0.82 | p = 0.06 | ND | ND | ND | ||
| Negative | 9 | 3.17 (1.23–3.96) | 1.62 (1.15–2.44) | 1.51 (0–86) | 15 | 0.85 (0.19–3.85) | 1.16 (0.13–4) | 0.25 (0–3.31) |
| Positive | 4 | 0.94 (0.74–1.63) | 1.86 (0.43–4.9) | 0 (0–1.37) | 1 | 2.38 | 1.45 | 30.1 |
| TNM | p = 0.50 | p = 0.68 | p = 0.83 | p = 0.22 | p = 0.038 | p = 0.097 | ||
| I–II | 5 | 2.65 (1.23–3.96) | 1.47 (1.23–2.17) | 0.67 (0–4) | 11 | 0.74 (0.19–3.85) | 0.52 (0.13–3) | 0 (0–3.31) |
| III–IV | 8 | 2.19 (0.74–3.66) | 1.73 (0.43–4.9) | 1.38 (0–86) | 5 | 1.31 (0.42–2.38) | 1.59 (1.27–4) | 1 (0–30.1) |
| Vascular invasion | p = 0.84 | p = 0.57 | p > 0.9999 | p = 0.17 | p = 0.53 | p = 0.41 | ||
| Negative | 3 | 1.63 (0.74–3.96) | 1.9 (1.4–2.32) | 1.37 (0–4) | 6 | 0.62 (0.19–1.31) | 0.94 (0.36–1.6) | 0.30 (0–1) |
| Positive | 10 | 2.70 (0.74–3.66) | 1.54 (0.43–4.9) | 1.03 (0–86) | 10 | 1.09 (0.29–3.85) | 1.56 (0.13–4) | 0.5 (0–30.1) |
| Neural invasion | ND | ND | ND | p = 0.12 | p = 0.52 | p = 0.76 | ||
| Negative | 2 | 3.35 (3.17–3.53) | 2.14 (1.85–2.44) | 74.3 (62.5–86) | 4 | 0.63 (0.19–0.85) | 1.41 (0.72–2.5) | 0.35 (0–1.39) |
| Positive | 11 | 1.66 (0.74–3.96) | 1.47 (0.43–4.9) | 0.67 (0–4) | 12 | 1.22 (0.29–3.85) | 0.89 (0.13–4) | 0.43 (0–30.1) |
| (A) | ||||||||
| Diffuse GC | ||||||||
| Genes | AhR | AhR | AhRR | AhRR | CYP1B1 | CYP1B1 | CYP1A1 | CYP1A1 |
| r | p value | r | p value | r | p value | r | p value | |
| AhR | x | −0.031 | 0.92 | −0.066 | 0.83 | 0.181 | 0.553 | |
| AhRR | −0.031 | 0.92 | x | −0.107 | 0.73 | 0.711 | 0.007 | |
| CYP1B1 | −0.066 | 0.83 | −0.107 | 0.73 | x | 0.342 | 0.253 | |
| Growth factors and receptors (n = 10) | ||||||||
| IGF1 | 0.184 | 0.55 | 0.865 | 0.0001 | 0.155 | 0.71 | 0.846 | 0.001 |
| IGF1R | 0.596 | 0.032 | 0.267 | 0.38 | −0.159 | 0.6 | 0.345 | 0.24 |
| FGFR1 | −0.234 | 0.441 | 0.542 | 0.055 | 0.269 | 0.37 | 0.444 | 0.13 |
| FGF7 | 0 | 1 | 0.576 | 0.04 | −0.055 | 0.86 | 0.424 | 0.15 |
| IGF2 | 0.041 | 0.89 | 0.119 | 0.7 | −0.033 | 0.91 | −0.043 | 0.69 |
| IGFR2 | 0.562 | 0.046 | 0.375 | 0.21 | −0.06 | 0.84 | 0.655 | 0.015 |
| IRS1 | −0.259 | 0.39 | 0.457 | 0.12 | −0.121 | 0.69 | 0.384 | 0.19 |
| IRS2 | 0.259 | 0.39 | 0.501 | 0.08 | 0.005 | 0.99 | 0.623 | 0.02 |
| ERBB2 | 0.341 | 0.25 | 0.529 | 0.06 | −0.676 | 0.01 | 0.291 | 0.34 |
| EMT and migration (n = 10) | ||||||||
| VIM | 0.135 | 0.66 | 0.518 | 0.07 | 0.280 | 0.35 | 0.709 | 0.007 |
| CDH1 | 0.501 | 0.08 | 0.57 | 0.09 | −0.264 | 0.38 | 0.592 | 0.03 |
| SNAI1 | 0.239 | 0.43 | 0.102 | 0.74 | 0.066 | 0.83 | 0.131 | 0.67 |
| TGFB1 | 0.297 | 0.32 | 0.182 | 0.55 | −0.511 | 0.83 | −0.165 | 0.59 |
| RUNX3 | −0.771 | 0.8 | 0.202 | 0.51 | −0.313 | 0.30 | −0.065 | 0.83 |
| SNAI2 | 0.317 | 0.29 | 0.441 | 0.13 | 0.044 | 0.89 | 0.605 | 0.04 |
| TWIST2 | −0.005 | 0.99 | 0.667 | 0.013 | 0.115 | 0.71 | 0.504 | 0.08 |
| ZEB2 | 0.033 | 0.91 | 0.661 | 0.014 | −0.038 | 0.90 | 0.602 | 0.04 |
| RHOA | 0.600 | 0.034 | 0.176 | 0.56 | −0.203 | 0.50 | 0.484 | 0.09 |
| RHOB | −0.215 | 0.48 | 0.295 | 0.23 | 0.429 | 0.14 | 0.444 | 0.13 |
| Cell proliferation and migration (n = 3) | ||||||||
| Ki67 | 0.463 | 0.11 | 0.328 | 0.27 | −0.176 | 0.56 | 0.537 | 0.26 |
| MMP2 | −0.099 | 0.74 | 0.774 | 0.002 | 0.164 | 0.59 | 0.701 | 0.01 |
| MMP9 | 0.193 | 0.53 | 0.005 | 0.99 | −0.511 | 0.07 | −0.271 | 0.32 |
| Immunity (n = 5) | ||||||||
| IDO1 | 0.528 | 0.07 | −0.228 | 0.44 | −0.440 | 0.13 | −0.245 | 0.42 |
| TDO2 | 0.267 | 0.38 | 0.330 | 0.27 | −0.280 | 0.35 | 0.048 | 0.87 |
| PD1 | 0.534 | 0.06 | 0.033 | 0.92 | 0.115 | 0.71 | 0.209 | 0.49 |
| CD274 | 0.446 | 0.13 | −0.437 | 0.13 | −0.060 | 0.85 | −0.435 | 0.11 |
| PDL2 | 0.332 | 0.26 | 0.080 | 0.79 | 0.091 | 0.77 | 0.266 | 0.38 |
| Angiogenesis (n = 6) | ||||||||
| FLT1 | 0.559 | 0.047 | 0.303 | 0.31 | 0.214 | 0.48 | 0.319 | 0.29 |
| VEGF165 | 0.402 | 0.17 | 0.358 | 0.23 | 0.011 | 0.97 | 0.364 | 0.22 |
| VEGF189 | 0.306 | 0.31 | 0.088 | 0.77 | −0.137 | 0.65 | 0.114 | 0.71 |
| KDR | −0.187 | 0.54 | −0.151 | 0.62 | −0.368 | 0.22 | −0.387 | 0.19 |
| VEGFC | 0.179 | 0.56 | 0.328 | 0.27 | 0 | 1 | 0.199 | 0.51 |
| NRP1 | 0.185 | 0.55 | 0.614 | 0.02 | 0.033 | 0.91 | 0.411 | 0.16 |
| (B) | ||||||||
| Intestinal GC | ||||||||
| Genes | AhR | AhR | AhRR | AhRR | CYP1B1 | CYP1B1 | CYP1A1 | CYP1A1 |
| r | p value | r | p value | r | p value | r | p value | |
| AhR | 1 | 0.679 | 0.004 | 0.018 | 0.95 | 0.112 | 0.68 | |
| AhRR | 0.679 | 0.004 | 1 | 0.253 | 0.34 | 0.241 | 0.368 | |
| CYP1B1 | 0.018 | 0.95 | 0.253 | 0.34 | 1 | 0.655 | 0.006 | |
| Growth factors and receptors (n = 10) | ||||||||
| IGF1 | −0.113 | 0.68 | 0.168 | 0.53 | 0.765 | 0.001 | 0.371 | 0.16 |
| IGF1R | −0.053 | 0.84 | 0.077 | 0.78 | 0.667 | 0.005 | 0.521 | 0.04 |
| FGFR1 | −0.021 | 0.94 | 0.132 | 0.62 | 0.794 | <0.0001 | 0.455 | 0.08 |
| FGF7 | −0.127 | 0.64 | 0.047 | 0.86 | 0.721 | 0.002 | 0.401 | 0.12 |
| IGF2 | −0.093 | 0.73 | 0.144 | 0.59 | 0.774 | <0.0001 | 0.337 | 0.2 |
| IGFR2 | 0.169 | 0.53 | 0.018 | 0.95 | 0.524 | 0.037 | 0.364 | 0.15 |
| IRS1 | 0.056 | 0.84 | 0.471 | 0.07 | 0.915 | <0.0001 | 0.531 | 0.05 |
| IRS2 | 0.113 | 0.68 | 0.203 | 0.45 | 0.582 | 0.018 | 0.05 | 0.83 |
| ERBB2 | 0.533 | 0.03 | 0.288 | 0.28 | −0.141 | 0.602 | 0.097 | 0.72 |
| EMT and migration (n = 10) | ||||||||
| VIM | 0.186 | 0.49 | 0.132 | 0.62 | 0.812 | <0.0001 | 0.379 | 0.15 |
| CDH1 | 0.284 | 0.286 | 0.085 | 0.75 | 0.051 | 0.85 | 0.214 | 0.43 |
| SNAI1 | 0.087 | 0.75 | 0.068 | 0.8 | 0.577 | 0.02 | 0.241 | 0.37 |
| TGFB1 | 0.21 | 0.39 | −0.091 | 0.74 | 0.453 | 0.08 | 0.118 | 0.66 |
| RUNX3 | 0.195 | 0.47 | 0.081 | 0.76 | −0.199 | 0.46 | −0.071 | 0.8 |
| SNAI2 | 0.282 | 0.29 | 0.171 | 0.53 | 0.711 | 0.002 | 0.131 | 0.63 |
| TWIST2 | 0.121 | 0.66 | 0.109 | 0.69 | 0.827 | <0.0001 | 0.307 | 0.25 |
| ZEB2 | 0.133 | 0.62 | 0.242 | 0.37 | 0.477 | 0.001 | 0.462 | 0.07 |
| RHOA | 0.693 | 0.003 | 0.324 | 0.22 | −0.056 | 0.84 | 0.171 | 0.53 |
| RHOB | −0.094 | 0.73 | 0.041 | 0.88 | 0.559 | 0.02 | 0.201 | 0.45 |
| Cell proliferation and migration (n = 3) | ||||||||
| Ki67 | 0.277 | 0.3 | −0.135 | 0.61 | −0.665 | 0.006 | −0.381 | 0.1 |
| MMP2 | 0.121 | 0.65 | 0.118 | 0.66 | 0.800 | <0.0001 | 0.335 | 0.2 |
| MMP9 | 0.139 | 0.61 | 0.041 | 0.88 | 0.185 | 0.49 | 0.07 | 0.8 |
| Immunity (n = 5) | ||||||||
| IDO1 | 0.272 | 0.3 | −0.025 | 0.94 | −0.727 | 0.001 | −0.601 | 0.014 |
| TDO2 | 0.046 | 0.87 | 0.103 | 0.7 | 0.218 | 0.41 | 0.163 | 0.54 |
| PD1 | −0.155 | 0.56 | −0.132 | 0.62 | 0.056 | 0.84 | −0.261 | 0.25 |
| CD274 | 0.199 | 0.46 | 0.156 | 0.56 | −0.251 | 0.34 | −0.332 | 0.15 |
| PDL2 | −0.015 | 0.95 | −0.172 | 0.517 | 0.455 | 0.08 | −0.032 | 0.76 |
| Angiogenesis (n = 6) | ||||||||
| FLT1 | −0.407 | 0.12 | −0.394 | 0.13 | 0.032 | 0.91 | −0.176 | 0.51 |
| VEGF165 | −0.531 | 0.03 | −0.641 | 0.01 | −0.321 | 0.23 | −0.013 | 0.68 |
| VEGF189 | −0.181 | 0.51 | −0.238 | 0.37 | −0.156 | 0.56 | −0.046 | 0.86 |
| KDR | −0.081 | 0.77 | −0.079 | 0.77 | 0.482 | 0.06 | 0.061 | 0.82 |
| VEGFC | 0.01 | 0.88 | 0.132 | 0.63 | 0.788 | 0.0001 | 0.353 | 0.18 |
| NRP1 | 0.131 | 0.62 | 0.168 | 0.53 | 0.838 | <0.0001 | 0.324 | 0.22 |
Disclaimer/Publisher’s Note: The statements, opinions and data contained in all publications are solely those of the individual author(s) and contributor(s) and not of MDPI and/or the editor(s). MDPI and/or the editor(s) disclaim responsibility for any injury to people or property resulting from any ideas, methods, instructions or products referred to in the content. |
© 2024 by the authors. Licensee MDPI, Basel, Switzerland. This article is an open access article distributed under the terms and conditions of the Creative Commons Attribution (CC BY) license (https://creativecommons.org/licenses/by/4.0/).
Share and Cite
Perrot-Applanat, M.; Pimpie, C.; Vacher, S.; Pocard, M.; Baud, V. High Expression of AhR and Environmental Pollution as AhR-Linked Ligands Impact on Oncogenic Signaling Pathways in Western Patients with Gastric Cancer—A Pilot Study. Biomedicines 2024, 12, 1905. https://doi.org/10.3390/biomedicines12081905
Perrot-Applanat M, Pimpie C, Vacher S, Pocard M, Baud V. High Expression of AhR and Environmental Pollution as AhR-Linked Ligands Impact on Oncogenic Signaling Pathways in Western Patients with Gastric Cancer—A Pilot Study. Biomedicines. 2024; 12(8):1905. https://doi.org/10.3390/biomedicines12081905
Chicago/Turabian StylePerrot-Applanat, Martine, Cynthia Pimpie, Sophie Vacher, Marc Pocard, and Véronique Baud. 2024. "High Expression of AhR and Environmental Pollution as AhR-Linked Ligands Impact on Oncogenic Signaling Pathways in Western Patients with Gastric Cancer—A Pilot Study" Biomedicines 12, no. 8: 1905. https://doi.org/10.3390/biomedicines12081905
APA StylePerrot-Applanat, M., Pimpie, C., Vacher, S., Pocard, M., & Baud, V. (2024). High Expression of AhR and Environmental Pollution as AhR-Linked Ligands Impact on Oncogenic Signaling Pathways in Western Patients with Gastric Cancer—A Pilot Study. Biomedicines, 12(8), 1905. https://doi.org/10.3390/biomedicines12081905