Article

The Specific ROCK2 Inhibitor KD025 Alleviates Glycolysis through Modulating STAT3-, CSTA- and S1PR3-Linked Signaling in Human Trabecular Meshwork Cells

1
Departments of Ophthalmology, School of Medicine, Sapporo Medical University, S1W17, Chuo-ku, Sapporo 060-8556, Japan
2
Departments of Cardiovascular, Renal and Metabolic Medicine, Sapporo Medical University, S1W17, Chuo-ku, Sapporo 060-8556, Japan
3
Departments of Cellular Physiology and Signal Transduction, Sapporo Medical University, S1W17, Chuo-ku, Sapporo 060-8556, Japan
*
Author to whom correspondence should be addressed.
These authors contributed equally to this work.
Biomedicines 2024, 12(6), 1165; https://doi.org/10.3390/biomedicines12061165
Submission received: 22 April 2024 / Revised: 17 May 2024 / Accepted: 23 May 2024 / Published: 24 May 2024
(This article belongs to the Section Gene and Cell Therapy)

Abstract

:
To investigate the biological significance of Rho-associated coiled-coil-containing protein kinase (ROCK) 2 in the human trabecular meshwork (HTM), changes in both metabolic phenotype and gene expression patterns against a specific ROCK2 inhibitor KD025 were assessed in planar-cultured HTM cells. A seahorse real-time ATP rate assay revealed that administration of KD025 significantly suppressed glycolytic ATP production rate and increased mitochondrial ATP production rate in HTM cells. RNA sequencing analysis revealed that 380 down-regulated and 602 up-regulated differentially expressed genes (DEGs) were identified in HTM cells treated with KD025 compared with those that were untreated. Gene ontology analysis revealed that DEGs were more frequently related to the plasma membrane, extracellular components and integral cellular components among cellular components, and related to signaling receptor binding and activity and protein heterodimerization activity among molecular functions. Ingenuity Pathway Analysis (IPA) revealed that the detected DEGs were associated with basic cellular biological and physiological properties, including cellular movement, development, growth, proliferation, signaling and interaction, all of which are associated with cellular metabolism. Furthermore, the upstream regulator analysis and causal network analysis estimated IL-6, STAT3, CSTA and S1PR3 as possible regulators. Current findings herein indicate that ROCK2 mediates the IL-6/STAT3-, CSTA- and S1PR3-linked signaling related to basic biological activities such as glycolysis in HTM cells.

1. Introduction

Among the families of the serine-threonine protein kinase family, rho-associated coiled-coil-containing protein kinases, ROCKs are known as pivotal factors regulating remodeling of the actin cytoskeleton [1,2,3,4,5] and they function to regulate cell architecture/adhesion/motility, cell differentiation, cell apoptosis, and inflammation [6,7,8]. Two isoforms of ROCKs, ROCK1 and ROCK2, having homologous amino acid compositions of the C-termini, catalytic kinase domains and Rho-binding domains and distinct the coiled-coil regions are identified [9,10]. Despite having homologous compositions, ROCK1 and 2 may have diverse functions and distinct downstream targets. For instance, ROCK2, but not ROCK1, phosphorylates Ser19 residue of myosin light chain (MLC), that is also phosphorylated by MLC kinase (MLCK), resulting altering the Ca2+ sensitive skeletal muscle cell contraction [11].
Within ocular and peri-ocular tissues including the trabecular meshwork (TM), ciliary muscles, and retina, ROCKs are also expressed [9,10] and function in the ocular physiology and pathology of various ocular diseases including corneal dysfunction, cataract genesis and retinopathy [1,2,12,13,14,15]. Therefore, ROCKs may be promising therapeutic candidates for these ocular diseases, especially glaucoma. In fact, it has been shown that expression of both ROCK1 and ROCK2 are identified in human TM (HTM) cells [16] and that ROCK inhibitors (ROCK-is) substantially decrease intraocular pressure (IOP) in various animal models [17,18]. In Japan, ripasudil hydrochloride hydrate (Rip), a pan-ROCK-is is already used as a hypotensive therapy for patients with glaucoma as well as ocular hypertension [19,20]. As an underlying mechanism causing hypotensive activity by Rip, it was shown that Rip enhances outflow facility of humor (AH) by modulating the permeability at HTM in association with their disruption of tight junctions of HTM cells [21]. To support this mechanism, we independently developed an in vitro three-dimensionally (3D) cultured HTM model replicating the multi-layer sheets architecture of the HTM in addition to an in vitro model of an HTM monolayer by a two-dimensionally (2D) cell planar culture. Upon administering transforming growth factor-β2 (TGF-β2) or dexamethasone (DEX) to 2D and 3D cultured HTM cells, we observed the following effects; (1) significantly downsized and harder 3D HTM spheroids, (2) a substantial increase in the trans-epithelial electrical resistance (TEER) values, and (3) those changes were different between TGF-β2 and DEX treatments. Based on these results, we suggested that those models may become two different in vitro glaucomatous HTM models, that is, an in vitro primary open angle glaucoma (POAG) HTM model and a steroid-induced glaucoma (SG) HTM model, respectively [22]. Using these models, we found that the effects of TGF-β2 or DEX were substantially decreased by administration of pan-ROCK inhibitors, Rip and Y27632 [23], suggesting that pan-ROCK-is indeed have beneficial effects on AH outflow facility at TM levels. However, the efficacies of Rip and Y27632 were different, in which their inhibitory activities for ROCK1 or ROCK2 are diverse, that is, ROCK 1 inhibition is lower and higher that ROCK2 inhibition in Rip and Y-27632, respectively [24,25], suggesting that ROCK1 and ROCK2 diversely regulate the biological activities of the HTM. In fact, we also found that the effects of a specific ROCK2 inhibitor, KD025, on the physical aspects of glaucomatous HTM cell model treated by TGF-β2 or DEX was quite different from the effects of Rip [26,27]. However, as of this writing, there is limited information on the biological regulations of HTM physiology by ROCK2.
Therefore, to study the biological roles of ROCK2 in physiological properties of the HTM, we investigated functional effects of KD025 on planar-cultured HTM by performing real-time ATP rate assay using a Seahorse XFe analyzer (Agilent Technologies, Santa Clara, CA, USA). Furthermore, we performed RNA sequencing analysis to elucidate the link between altered metabolic functions and gene expression patterns in HTM cells treated or not treated with the selective ROCK2 inhibitor KD025.

2. Materials and Methods

2.1. Human Trabecular Meshwork (HTM) Cells

All experimental procedures using human-derived cells were taken place in compliance with the tenets of the Declaration of Helsinki and approved by the internal review board of Sapporo Medical University. Commercially available human trabecular meshwork (HTM, Applied Biological Materials Inc., Richmond, BC, Canada) was used in the present study. In advance, those HTM cells were confirmed to ensure truly TM cells as described by Keller et al. [28]

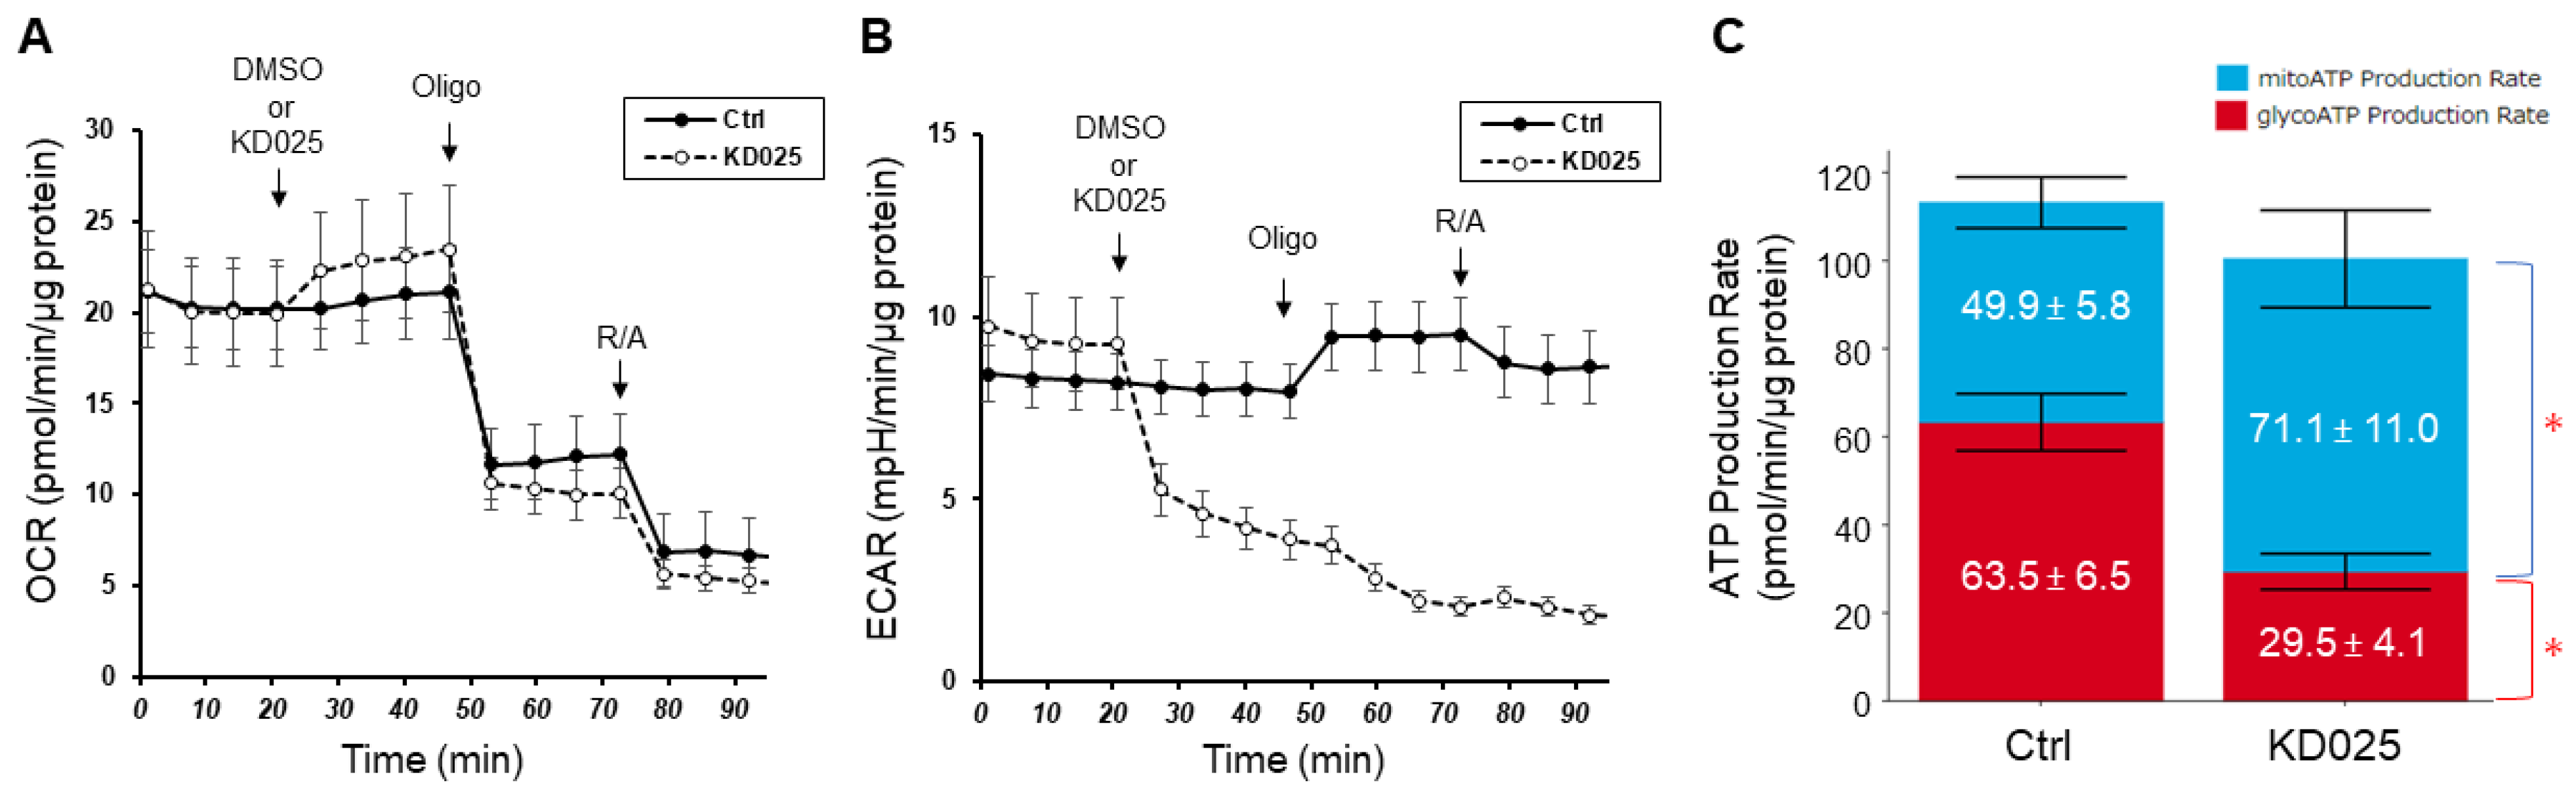
2.2. Real-Time ATP Rate Assay in Planar 2D Cultured HTM Cells by Using a Seahorse XF96e Analyzer

The 20,000 2D cultured HTM cells were placed in each well of an XFe96 Cell Culture Microplate (Agilent Technologies, #103794-100, Santa Clara, CA, USA) approximately 24 h before the assay, and the plate was incubated under standard humid and normoxia conditions (37 °C, 5% CO2). Assay buffer containing dimethyl sulfoxide (DMSO, control) or ROCK2 inhibitor KD025 (final concentration: 10 µM) was subjected to measurements of oxygen consumption rate (OCR) and extracellular acidification rate (ECAR) in the cells were simultaneously evaluated using a Seahorse XFe96 Bioanalyzer (Agilent Technologies, Santa Clara, CA, USA) as described previously [29,30]. The glycolytic and mitochondrial ATP production rates after adding DMSO or KD025 were calculated using Seahorse Analytics 1.0.0.-520 (https://seahorseanalytics.agilent.com).

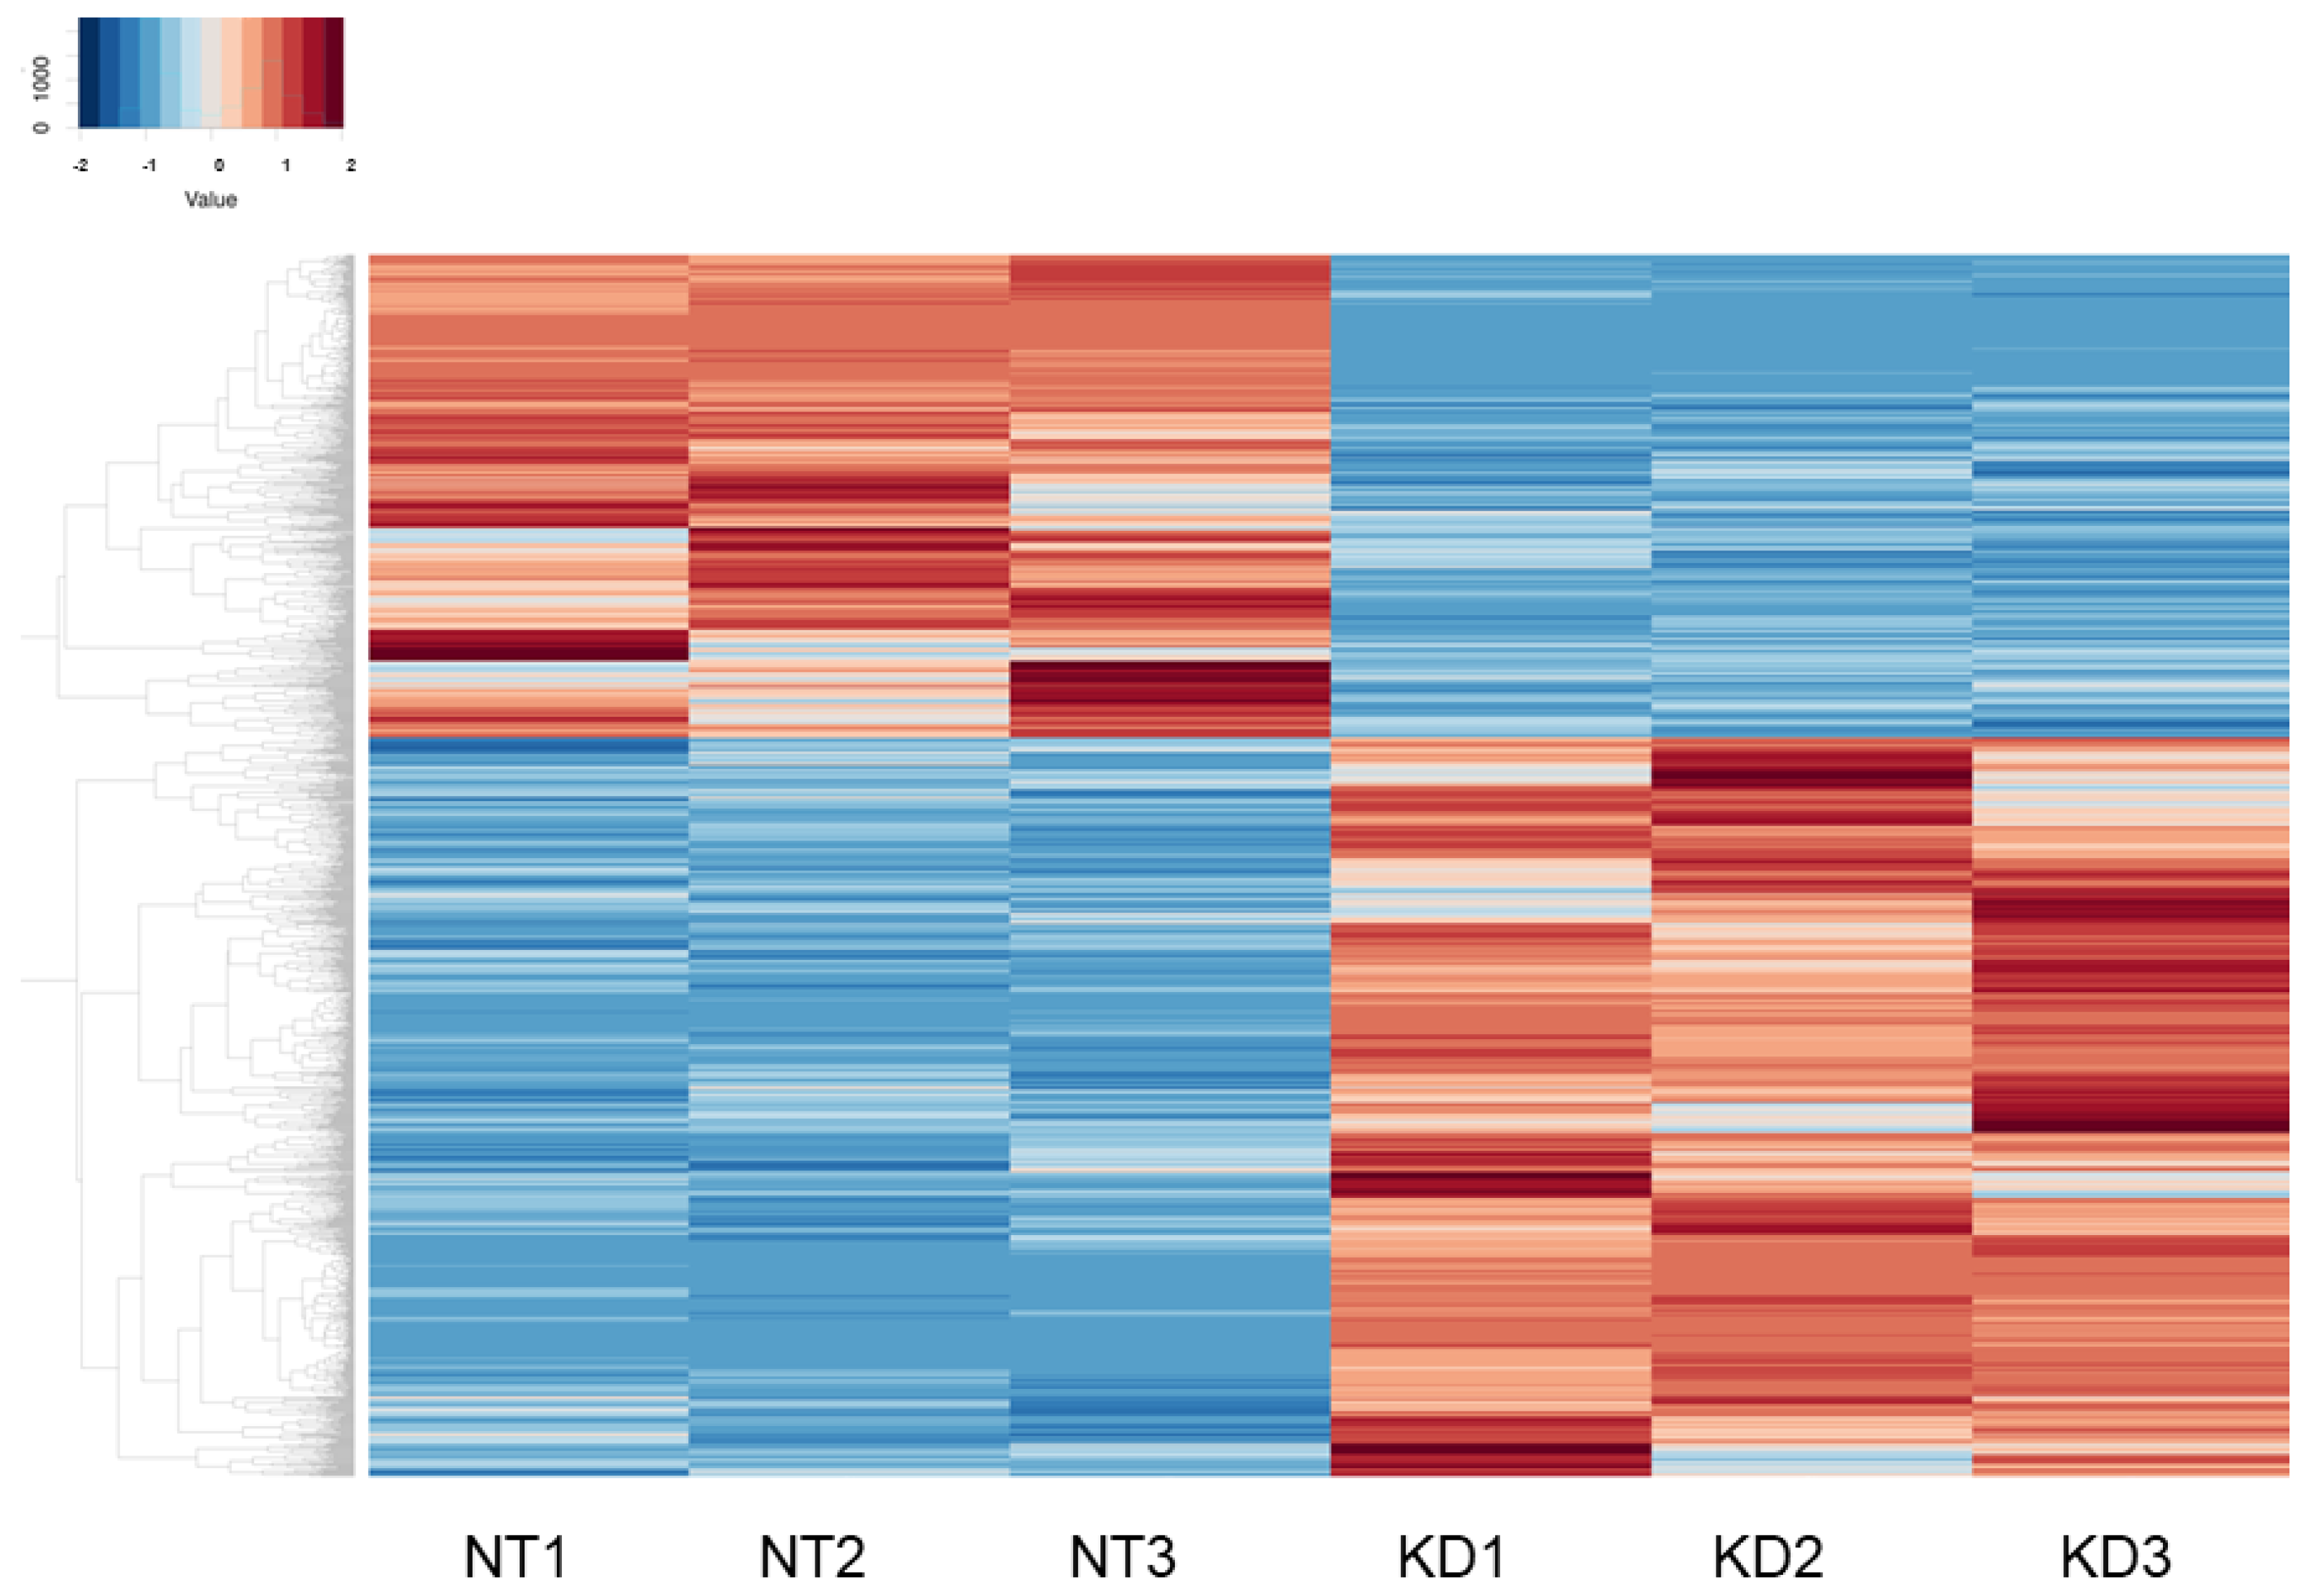
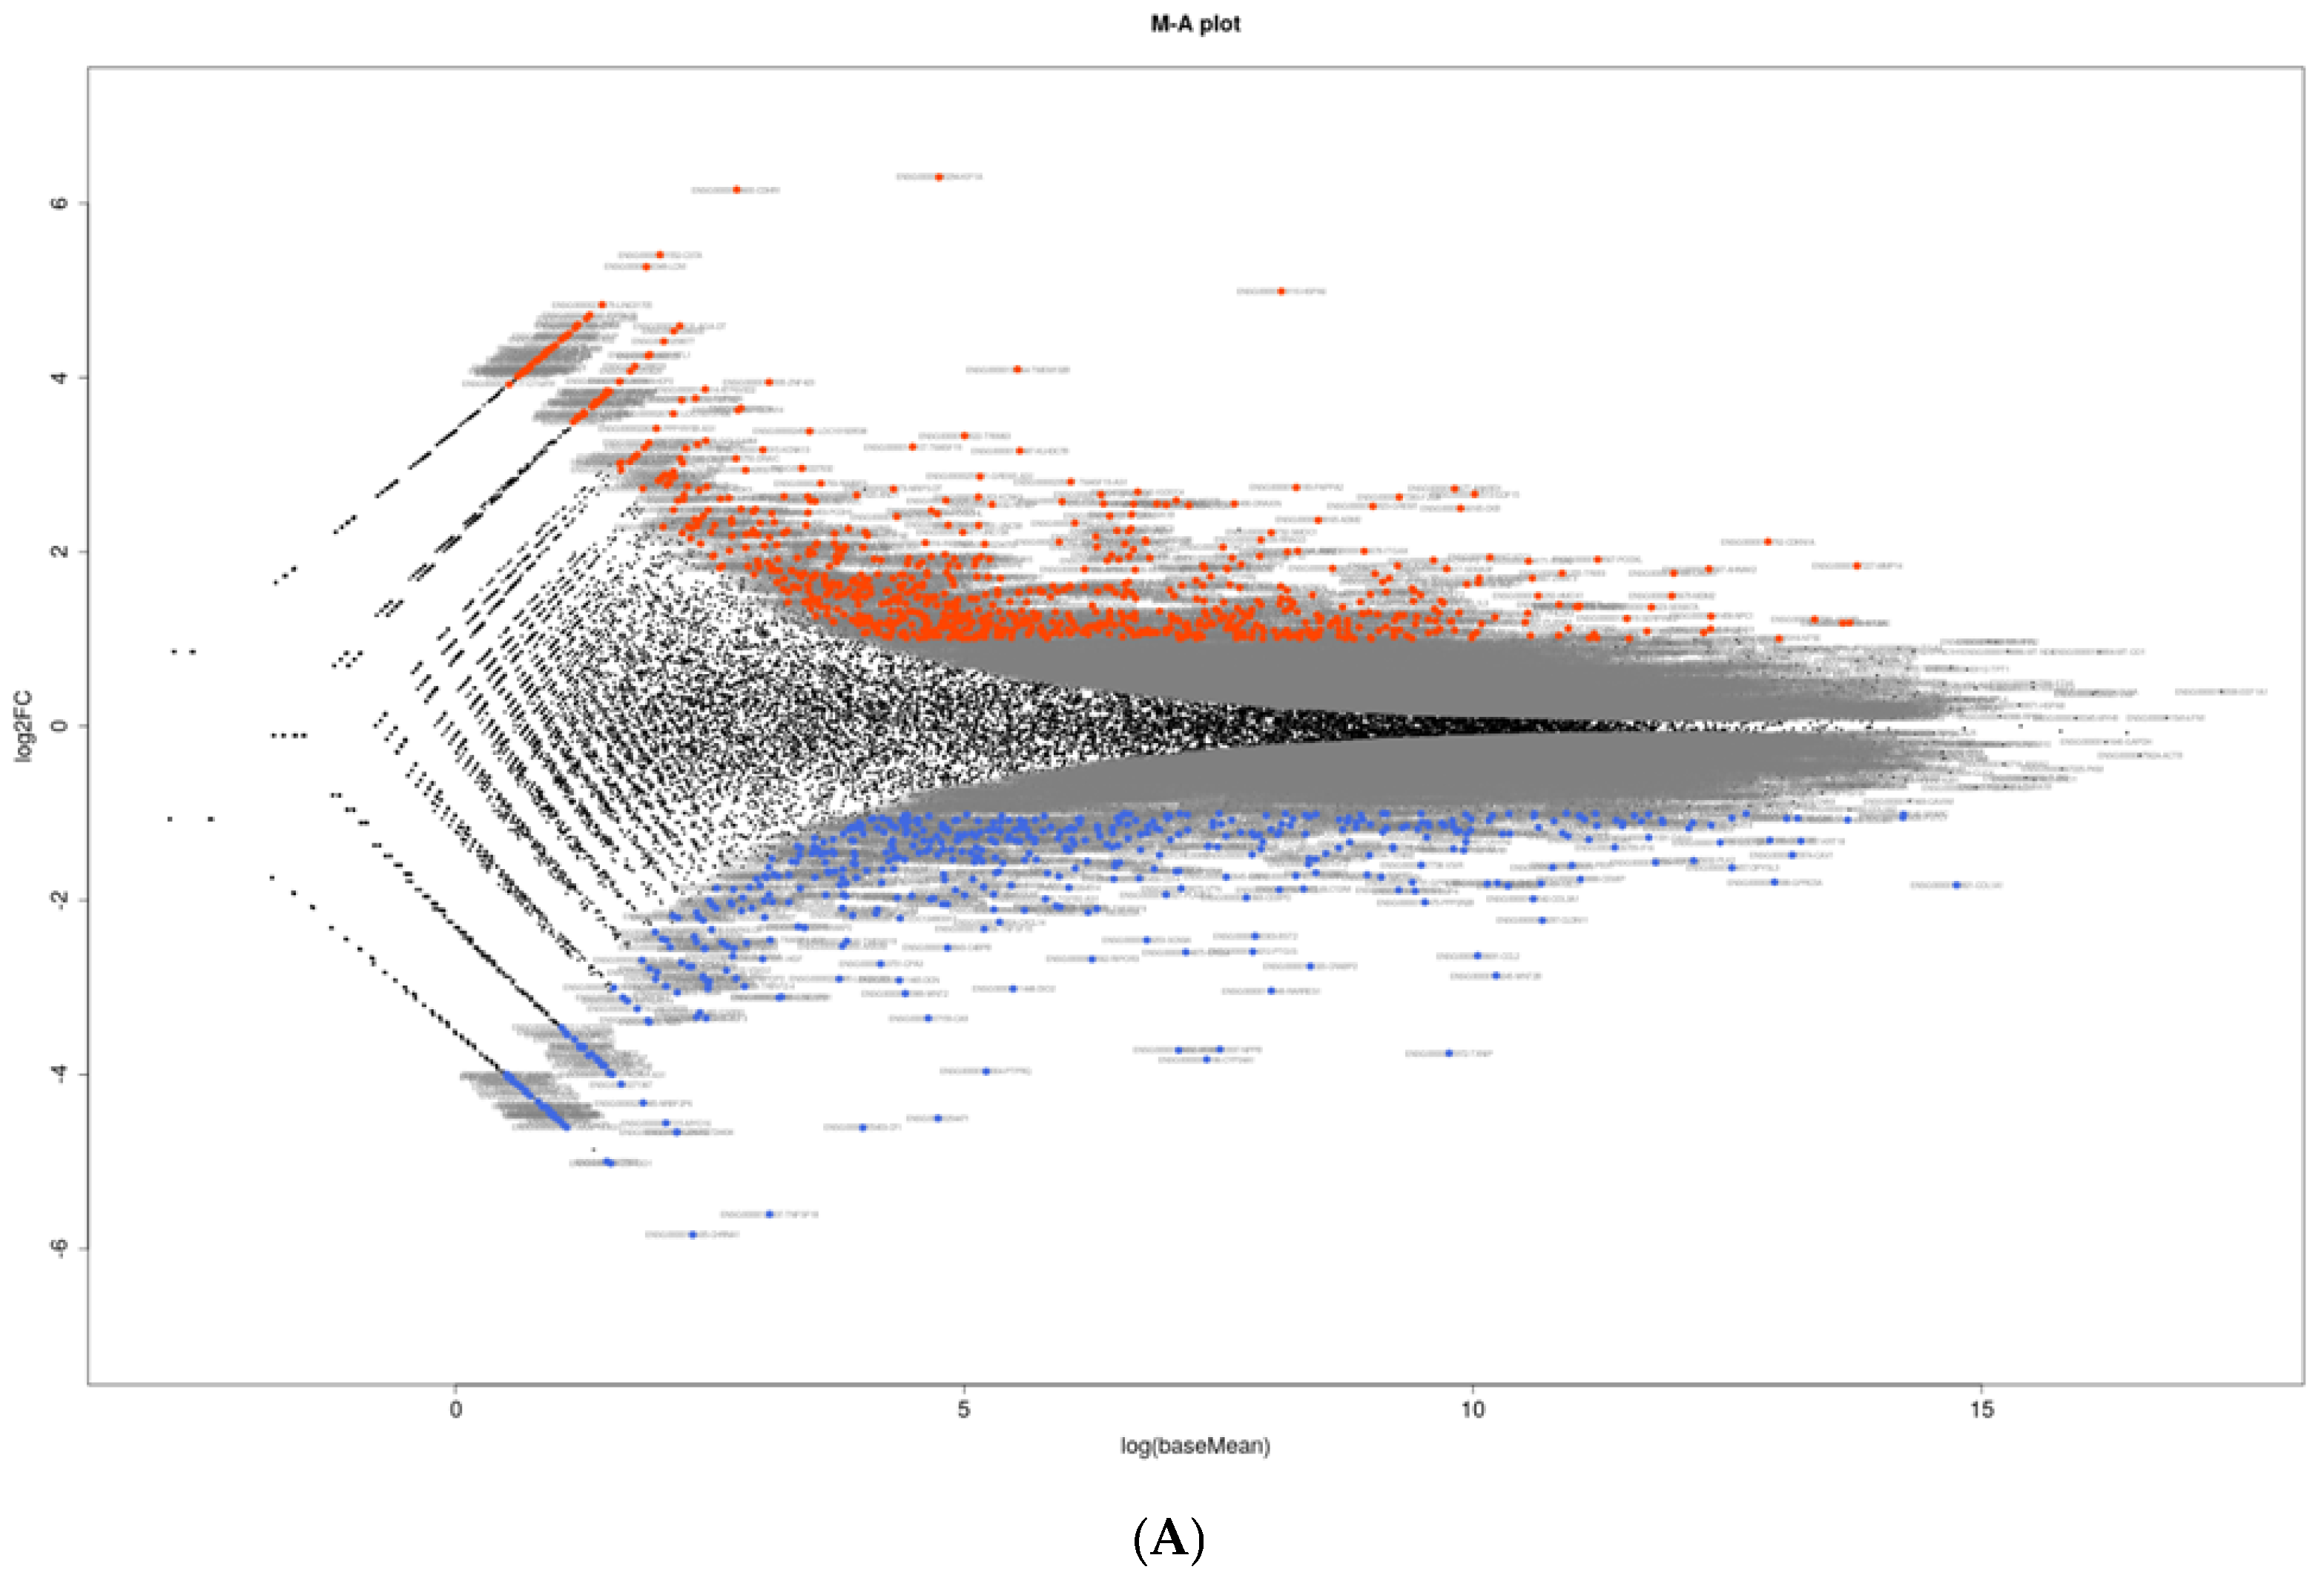
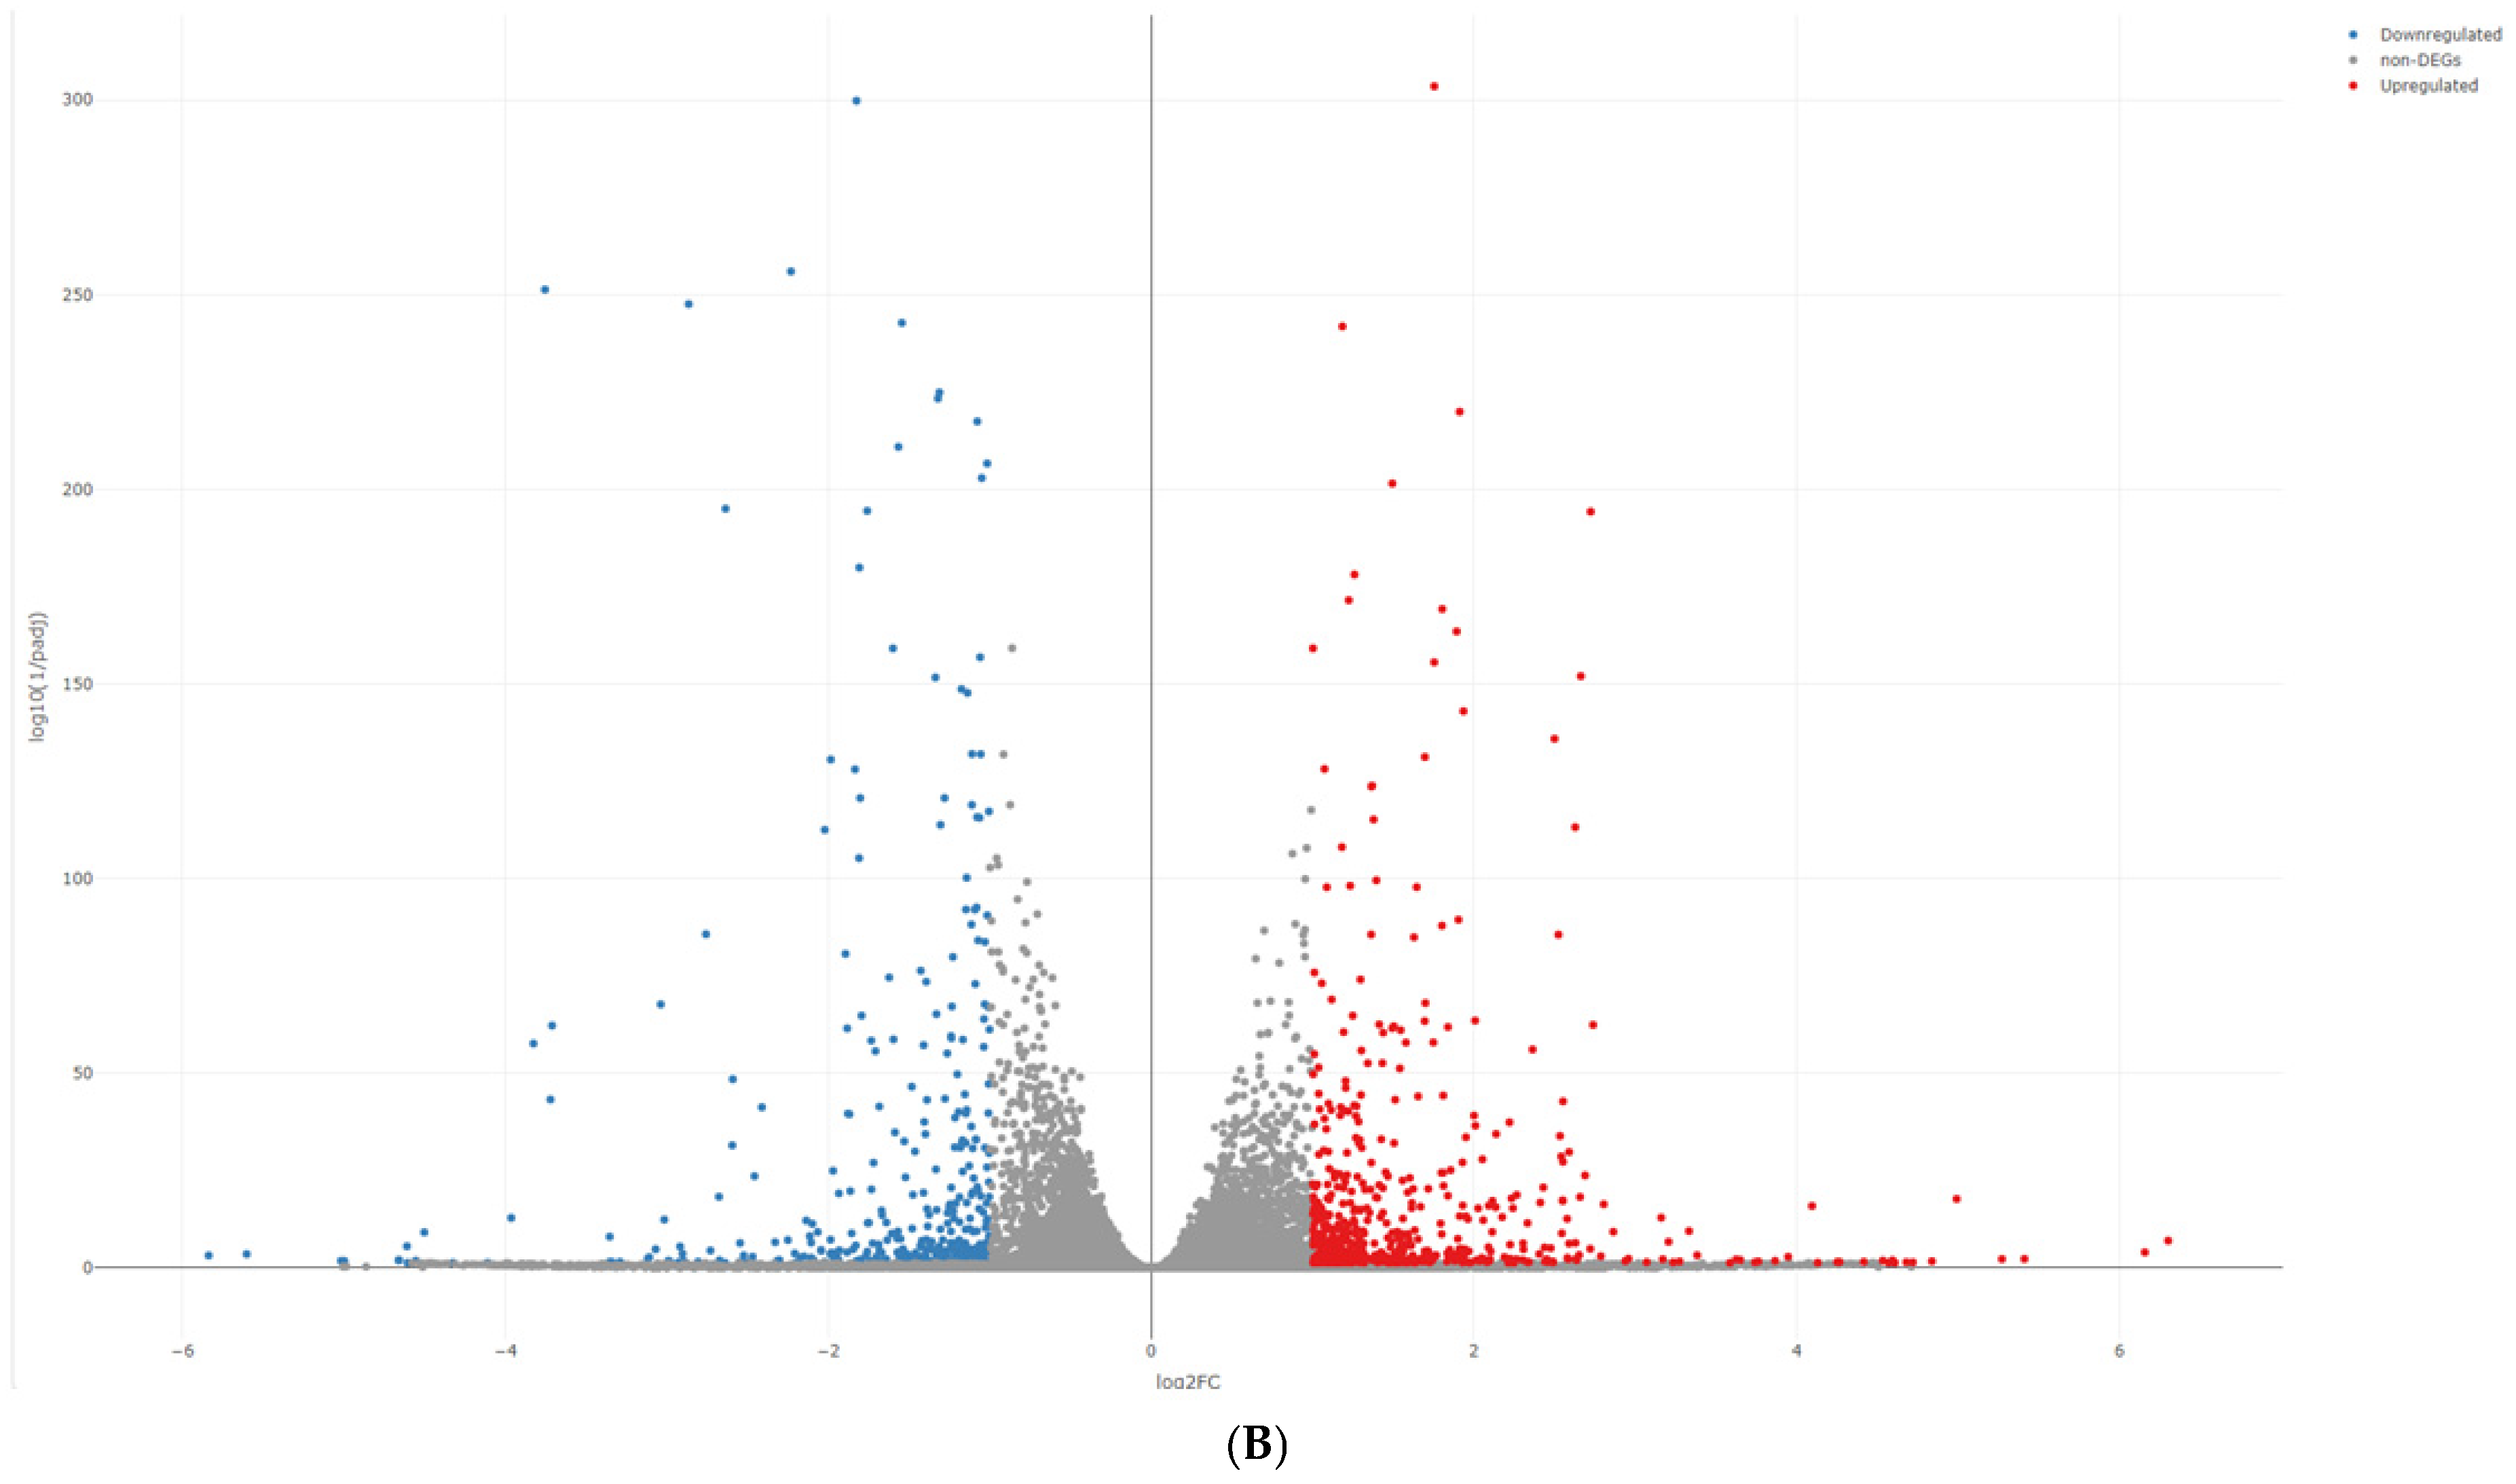
2.3. RNA Sequencing Analysis and IPA Gene Function and Pathway Analysis

Total RNA isolated from 2D confluent HTM cells untreated or treated with 10 μM KD025 for 24 h in a 150 mm dish as described above (n = 3) using an RNeasy mini kit (Qiagen, Valencia, CA, USA) according to the manufacturer’s instructions. Followingly, RNA extraction and next-generation sequencing were performed as described recently [31]. Obtained sequence data were filtered using FastQC software (version 0.11.7), checked their quality control by an Agilent 2100 Bioanalyzer (Agilent, CA, USA) and Trimmomatic (version 0.38) and mapped to the reference genome sequence (GRCh38) using HISAT2-2.1.1 tools software [32]. The read counting for each respective gene and statistical analysis were processed using featureCounts (version 1.6.3) and DESeq2 (version 1.24.0), respectively. Differentially expressed genes (DEGs) were determined as genes with fold-change ≥2.0 and false discovery rate (FDR)-adjusted p-value  <  0.05 and q  <  0.08 between groups.
Ingenuity pathway analysis (IPA, Qiagen, https://digitalinsights.qiagen.com/products-overview/discovery-insights-portfolio/analysis-and-visualization/qiagen-ipa/, the accessed date 9 February 2024) [33] was used for further analysis to predict various pathways by uploading the significant up-regulated and down-regulated DEGs excel file to IPA core analyses. Enrichment of the particular genes in networks in IPA was evaluated using Fisher’s exact test. In addition, the IPA software orders top functions related with each network based on the enrichment scores (z-score) and predicts possible upstream regulator and causal network regulator as shown in recent studies [33,34,35].

2.4. Other Analytical Methods

Real-time PCR were carried out essentially as previously reported [36,37] using predesigned primers (Supplemental Table S1). The expression of each respective gene was normalized by using the expression of a housekeeping gene 36B4 (Rplp0). As experimental data, the arithmetic mean ± the standard error of the mean (SEM) was used in conjugation with statistical analyses essentially as described in our previous reports [36,37].

3. Results

To identify the biological roles of ROCK2 in conventional AH outflow, especially at the TM level, initially we evaluated effects of specific ROCK2 inhibitor KD025 on cellular metabolic functions by assessing both glycolytic and mitochondrial ATP production rates in planar-cultured HTM cells. Addition of KD025 on HTM cells induced an increase in OCR values (Figure 1A) and a dramatical reduction in ECAR values (Figure 1B). Especially, compensatory increase in ECAR values by adding ATP synthase inhibitor oligomycin was abolished in the presence of KD025 (Figure 1B). Consistent with the overall results of OCR and ECAR values, the glycolytic ATP production rate after adding KD025 (29.5 ± 4.1 pmol/min/μg protein) was significantly and dramatically lower than that after adding DMSO (63.5 ± 6.5 pmol/min/μg protein) (Figure 1C). Conversely, the mitochondrial ATP production rate after adding KD025 (71.1 ± 11.0 pmol/min/μg protein) was significantly higher than that after adding DMSO (49.9 ± 5.8 pmol/min/μg protein) although there was a statistical difference in total ATP production rates between two groups (Figure 1C). These results suggest that KD025 has an effect in shifting the metabolism to produce ATP from glycolysis to mitochondrial respiration in planar-cultured HTM cells.
RNA sequencing analysis was performed using HTM cells not treated (NT, n = 3) and treated with KD025 (KD, n = 3). As shown in a heatmap (Figure 2) and in an M-A (Figure 3A) and a volcano plot (Figure 3B), there were 602 substantially up-regulated and 380 substantially down-regulated genes termed differentially expressed genes (DEGs) in NT cells and KD cells with a significance level of false discovery rate (FDR) less than 0.05 and an absolute fold-change more than 2 was identified (a list of all of the up-regulated or down-regulated DEGs is included in a Supplemental Excel File). As the most prominent DEGs, the top 10 of up-regulated and down-regulated DEGs are indicated in Table 1.
GO ontology analysis was performed to estimate unidentified biological effects of the specific ROCK 2 inhibitor KD025 on HTM cells. The detected DEGs were more abundantly categorized in GO terms related to plasma membrane, extracellular component and integral cellular component among the cellular components (Figure 4A) and those related to signaling receptor binding and activity and protein heterodimerization activity among the molecular functions (Figure 4B).
Next, we conducted Ingenuity Pathway Analysis (IPA) to estimate that what kinds of biological functions and networks are underlaid in the KD025-induced effects on HTM cells based upon 602 significantly up-regulated and 380 significantly down-regulated DEGs. The estimated molecular and cellular functions of the detected DEGs were related to basic cellular biological properties including cellular movement, development, growth, proliferation, signaling and interaction (Table 2), and they were associated with various diseases networks in addition to cell death and survival (Table 3). These results were quite rational because ROCKs mediate lots of pivotal cellular functions such as cell architecture, motility, secretion, proliferation, and gene expression, and those pathways are also related to other signaling pathways contributing to the pathogenesis of various systemic diseases [38].
To study further, we estimated what kinds of upstream regulatory mechanisms were involved. IPA analysis suggested various candidates of molecules and factors as the possible upstream and causal network regulators. However, most of those were chemical drugs, chemical reagents, chemical toxicants, peptides in addition to a few cytokines, growth factors, kinases and transcription regulators. Among the latter molecules, interleukin 6 (IL6) and signal transducer and activator of transcription 3 (STAT3), and cystatin A (CSTA) and sphingosine-1-phosphate (S1P) receptor 3 (S1PR3) were determined as possible upstream regulators and a possible causal network regulator, respectively, because changes of expression rates of those four factors (expression log ratio more than |1.5|, IL6; −1.688, STAT3; 1.51, CSTA; 5.41 and S1PR3; 1.52) were much larger than those of others (Table 4). As shown in Figure 5, upon administering 10 μM KD025, levels of gene expression of IL6 was moderately increased and those of other three genes were significantly decreased.

4. Discussion

It is shown that ROCK1 and ROCK2 are ubiquitously expressed throughout embryogenesis and in adult tissues [9,39]. Although both ROCKs are involved in the similar roles including cell adhesion and microfilament assembly, they are also differently involved in actin-mediated extracellular matrix formation [40,41] and cell adhesion to fibronectin [42,43]. Furthermore, both ROCKs are differently localized within various tissues and organs [44]. For instance, in thymus and blood, there is predominant ROCK1 expression and little or no ROCK2 expression despite highly expressed ROCK2 in the eyes and in cardiac and brain tissues [9,45,46]. Collectively, we assume that hypotensive effects of ROCK-is on IOP could primarily be induced by ROCK2 inhibition rather than ROCK1 inhibition. However, at present, insufficient information on ROCK1 has been available because specific ROCK1 inhibitors are present. In our preceding study, to elucidate which ROCK1 or ROCK2 inhibition of ROCK-is contributes on their hypotensive efficacy, we compared the effects of a pan-ROCK-i, Rip and KD025 on various physical and biochemical properties of in vitro glaucomatous HTM models using 2D and 3D cultured HTM cells [22] supplemented without or with TGF-β2 [23,26] or DEX [27]. As shown in Table 5, Rip and KD025 had significantly different effects in both TGF-β2 and DEX-treated models on 1) physical properties including TEER of 2D HTM monolayers and 3D HTM spheroids’ size and stiffness and 2) cellular metabolic functions related to mitochondria and glycolysis of 2D cultured HTM cells. Interestingly, these physical and cellular metabolic properties were greatly different between treatments with Rip and KD025, and even opposite effects of the two drugs on some of these properties, especially physical properties of 3D HTM spheroids, were observed. Here, IPA analysis suggested that STAT3 and IL6 are possible upstream regulators for KD025-induced DEGs. Interestingly, since STAT3- and IL6-related signaling are known to be pivotally involved in the mitochondrial function [47] and glycolysis [48], KD025-induced metabolic shift to produce ATP from glycolysis to mitochondrial respiration in HTM cells (Figure 1) was quite rationally understood. Furthermore, in our previous analysis of RNA sequencing of 2D and 3D cultured 3T3-L1 cells, STAT3 and IL6 were also estimated as the master upstream and causal network regulators for inducing 3D spheroid formation [49]. Therefore, taken together, if KD025 effects were indeed regulated by the STAT3- and IL6-related signaling axis, we rationally understood that the effects of KD025 in the in vitro glaucomatous HTM models were more apparent in the 3D spheroid model than in the 2D model.
It has been shown that IL6 signaling is not only involved in cancer, fibrosis, and chronic inflammation [50,51,52], but may also be related to glaucoma by regulation of IOP [53,54,55]. Classic and trans-signaling axes have been identified as the main signaling of IL-6 [56]. In the classic signaling, IL6 forms an IL6–mIL6R complex by binding to its membrane-bound receptor, mIL6R, and thereafter binds with the receptor subunit glycoprotein 130 (gp130) activating the canonical Janus Kinase (JAK)/ STAT or noncanonical mitogen-activated protein kinase (MAPK) [56,57]. In support of this finding, an increased effect of IL-6 on AH outflow facility was observed in perfused ex vivo organ cultures of porcine anterior segment [58]. On the other hand, in trans-signaling, IL6 binds to the soluble form of mIL6R (sIL6R), resulting unfavorable inflammation by binding binds with gp130 [56,57]. In fact, it was shown that the levels of sIL6R were increased in the AH of patients with POAG as compared with those in age-matched controls, [53] suggesting that IL6 trans-signaling may intricately affect AH homeostasis [58]. As of this writing, the underlying mechanisms of IL6-induced effects on AH homeostasis of HTM, especially glaucomatous phenotype models, have not been elucidated yet. However, a previous study showed that IL-6–mediated trans-signaling potently suppresses TGF-β signaling in HTM cells [53], and another study using an HTM cell model revealed a synergistic cross-linkage between lysophosphatidic acid (LPA) and IL6 trans-signaling mechanisms related to YAP, TAZ, and pSTAT3 [59]. It was also shown that ROCK2 signaling causes activation of IKKβ/NF-κB/IL-6/STAT3 by a positive feedback manner that results in resistance of anti-tumor drugs in hepatocellular carcinoma (HCC) cells [60]. Collectively, these observations strongly support the results of our study showing that IL6 and STAT3 are possible upstream regulators for ROCK2 activity of HTM cells.
In addition to IL6 and STAT3, sphingosine-1-phosphate (S1P) receptor 3 (S1PR3) was estimated as a possible causal network regulator. It was shown that S1P caused an increase in resistance of the AH outflow of both human and porcine eyes [61,62] by binding to S1P receptors [63]. Five subtypes of SIP receptors (S1PR1–5) have been identified, and it has been shown that S1PR1–3 are ubiquitously expressed, whereas S1PR4 is expressed only in lymphoid tissue and SIPR5 is expressed only in brain and skin tissues [64]. In TM cell culture models, S1P activates Rho, thereby facilitating phosphorylation of myosin light chain (MLC) and increasing stress fiber formation [61]. However, another study showed that activation of S1PR2, but not that of S1PR1 or S1PR3, increases conventional outflow resistance to regulate IOP [65]. Furthermore, a member of the cystatin superfamily of proteins, cystatin A (CSTA) that activates cysteine protease inhibitors [66] was identified as significant up-regulated DEG. Interestingly, a previous study indicated that CSTA could reduce cleavage of wild-type MYOC in primary TM cells. However, such CSTA-induced effects were not observed in an inactively mutated CSTA, suggesting that CSTA may become a potential biomarker and therapeutic target for MYOC-induced glaucoma [67]. However, as limitations of the present study, the following issues remain to be elucidated; (1) why ROCK2 inhibition by KD025 caused diverse effects in different types of in vitro glaucomatous HTM models, (2) roles of ROCK1 actions in HTM cells and (3) correlations of both S1PR3 and CSTA with ROCK2 activities in HTM cells. Furthermore, since KD025 is a selective, ATP-competitive inhibitor of human ROCK2 (IC50 value of 105 nM) with some effects on human ROCK1 (IC50 value of 24 µM) [68], some little inhibitory effects against ROCK1 (approximately 20–30%) in contrast to 90% inhibitory effects against ROCK2 may be non-negligible in the case of present experimental condition of 10 μM KD025. Therefore, additional investigations using specific inhibitors for downstream factors related to STAT3/IL6 and other candidates as well as another ROCK2-specific inhibitors will be carried out as our next research projects.
In conclusion, we found that a specific ROCK2 inhibitor, KD025, significantly suppressed glycolytic ATP production rate and increased mitochondrial ATP production rate in HTM cells. In addition, RNA sequencing analysis estimated that 602 up-regulated and 380 down-regulated DEGs between KD025 untreated and treated HTM cells. Based on IPA analysis of these DEGs, it was estimated that ROCK2 inhibition by KD025 modulated IL-6/STAT3-, CSTA- and S1PR3-linked signaling related to basic biological activities such as glycolysis in HTM cells.

Supplementary Materials

The following supporting information can be downloaded at: https://www.mdpi.com/article/10.3390/biomedicines12061165/s1, list of all of the up-regulated and down-regulated DEGs.

Author Contributions

M.W., T.S. conducted the experiments, analyzed data and prepared the paper. A.U., T.O., N.N., M.S., M.F. conducted experiments and analyzed data. H.O. designed the experiments, analyzed the data, and prepared the manuscript. All authors have read and agreed to the published version of the manuscript.

Funding

This research received no external funding.

Institutional Review Board Statement

Not applicable.

Informed Consent Statement

Not applicable.

Data Availability Statement

Experimental data will be available in case of request to corresponding author.

Conflicts of Interest

The authors declare no conflicts of interest.

References

  1. Bertrand, J.; Winton, M.J.; Rodriguez-Hernandez, N.; Campenot, R.B.; McKerracher, L. Application of Rho antagonist to neuronal cell bodies promotes neurite growth in compartmented cultures and regeneration of retinal ganglion cell axons in the optic nerve of adult rats. J. Neurosci. 2005, 25, 1113–1121. [Google Scholar] [CrossRef]
  2. Tan, H.-B.; Zhong, Y.-S.; Cheng, Y.; Shen, X. Rho/ROCK pathway and neural regeneration: A potential therapeutic target for central nervous system and optic nerve damage. Int. J. Ophthalmol. 2011, 4, 652–657. [Google Scholar] [CrossRef]
  3. Sagawa, H.; Terasaki, H.; Nakamura, M.; Ichikawa, M.; Yata, T.; Tokita, Y.; Watanabe, M. A novel ROCK inhibitor, Y-39983, promotes regeneration of crushed axons of retinal ganglion cells into the optic nerve of adult cats. Exp. Neurol. 2007, 205, 230–240. [Google Scholar] [CrossRef] [PubMed]
  4. Watabe, H.; Abe, S.; Yoshitomi, T. Effects of Rho-associated protein kinase inhibitors Y-27632 and Y-39983 on isolated rabbit ciliary arteries. Jpn. J. Ophthalmol. 2011, 55, 411–417. [Google Scholar] [CrossRef] [PubMed]
  5. Stiles, J.M.; Kurisetty, V.; Mitchell, D.C.; Bryan, B.A. Rho Kinase Proteins Regulate Global miRNA Expression in Endothelial Cells. Cancer Genom. Proteom. 2013, 10, 251–263. [Google Scholar]
  6. Cristancho, A.G.; Lazar, M.A. Forming functional fat: A growing understanding of adipocyte differentiation. Nat. Rev. Mol. Cell Biol. 2011, 12, 722–734. [Google Scholar] [CrossRef] [PubMed]
  7. Riento, K.; Ridley, A.J. Rocks: Multifunctional kinases in cell behaviour. Nat. Rev. Mol. Cell Biol. 2003, 4, 446–456. [Google Scholar] [CrossRef] [PubMed]
  8. Chun, K.H.; Araki, K.; Jee, Y.; Lee, D.H.; Oh, B.C.; Huang, H.; Park, K.S.; Lee, S.W.; Zabolotny, J.M.; Kim, Y.B. Regulation of glucose transport by ROCK1 differs from that of ROCK2 and is controlled by actin polymerization. Endocrinology 2012, 153, 1649–1662. [Google Scholar] [CrossRef] [PubMed]
  9. Nakagawa, O.; Fujisawa, K.; Ishizaki, T.; Saito, Y.; Nakao, K.; Narumiya, S. ROCK-I and ROCK-II, two isoforms of Rho-associated coiled-coil forming protein serine/threonine kinase in mice. FEBS Lett. 1996, 392, 189–193. [Google Scholar] [CrossRef]
  10. Fukiage, C.; Mizutani, K.; Kawamoto, Y.; Azuma, M.; Shearer, T.R. Involvement of Phosphorylation of Myosin Phosphatase by ROCK in Trabecular Meshwork and Ciliary Muscle Contraction. Biochem. Biophys. Res. Commun. 2001, 288, 296–300. [Google Scholar] [CrossRef]
  11. Amano, M.; Ito, M.; Kimura, K.; Fukata, Y.; Chihara, K.; Nakano, T.; Matsuura, Y.; Kaibuchi, K. Phosphorylation and activation of myosin by Rho-associated kinase (Rho-kinase). J. Biol. Chem. 1996, 271, 20246–20249. [Google Scholar] [CrossRef] [PubMed]
  12. Yokota, T.; Utsunomiya, K.; Taniguchi, K.; Gojo, A.; Kurata, H.; Tajima, N. Involvement of the Rho/Rho Kinase Signaling Pathway in Platelet-Derived Growth Factor BB-induced Vascular Endothelial Growth Factor Expression in Diabetic Rat Retina. Jpn. J. Ophthalmol. 2007, 51, 424–430. [Google Scholar] [CrossRef] [PubMed]
  13. Arita, R.; Hata, Y.; Nakao, S.; Kita, T.; Miura, M.; Kawahara, S.; Zandi, S.; Almulki, L.; Tayyari, F.; Shimokawa, H.; et al. Rho kinase inhibition by fasudil ameliorates diabetes-induced microvascular damage. Diabetes 2009, 58, 215–226. [Google Scholar] [CrossRef]
  14. Hollanders, K.; Van Bergen, T.; Kindt, N.; Castermans, K.; Leysen, D.; Vandewalle, E.; Moons, L.; Stalmans, I. The Effect of AMA0428, a Novel and Potent ROCK Inhibitor, in a Model of Neovascular Age-Related Macular Degeneration. Investig. Ophthalmol. Vis. Sci. 2015, 56, 1335–1348. [Google Scholar] [CrossRef]
  15. Okumura, N.; Koizumi, N.; Ueno, M.; Sakamoto, Y.; Takahashi, H.; Hamuro, J.; Kinoshita, S. The New Therapeutic Concept of Using a Rho Kinase Inhibitor for the Treatment of Corneal Endothelial Dysfunction. Cornea 2011, 30, S54–S59. [Google Scholar] [CrossRef] [PubMed]
  16. Wang, J.; Liu, X.; Zhong, Y. Rho/Rho-associated kinase pathway in glaucoma (Review). Int. J. Oncol. 2013, 43, 1357–1367. [Google Scholar] [CrossRef] [PubMed]
  17. Kameda, T.; Inoue, T.; Inatani, M.; Fujimoto, T.; Honjo, M.; Kasaoka, N.; Inoue-Mochita, M.; Yoshimura, N.; Tanihara, H. The Effect of Rho-Associated Protein Kinase Inhibitor on Monkey Schlemm’s Canal Endothelial Cells. Investig. Ophthalmol. Vis. Sci. 2012, 53, 3092–3103. [Google Scholar] [CrossRef]
  18. Van de Velde, S.; Van Bergen, T.; Sijnave, D.; Hollanders, K.; Castermans, K.; Defert, O.; Leysen, D.; Vandewalle, E.; Moons, L.; Stalmans, I. AMA0076, a Novel, Locally Acting Rho Kinase Inhibitor, Potently Lowers Intraocular Pressure in New Zealand White Rabbits with Minimal Hyperemia. Investig. Ophthalmol. Vis. Sci. 2014, 55, 1006–1016. [Google Scholar] [CrossRef] [PubMed]
  19. Inoue, T.; Tanihara, H. Rho-associated kinase inhibitors: A novel glaucoma therapy. Progress Retin. Eye Res. 2013, 37, 1–12. [Google Scholar] [CrossRef]
  20. Tanihara, H.; Inoue, T.; Yamamoto, T.; Kuwayama, Y.; Abe, H.; Suganami, H.; Araie, M.; K-115 Clinical Study Group. Intra-ocular pressure-lowering effects of a Rho kinase inhibitor, ripasudil (K-115), over 24 hours in primary open-angle glaucoma and ocular hypertension: A randomized, open-label, crossover study. Acta Ophthalmol. 2015, 93, e254–e260. [Google Scholar] [CrossRef]
  21. Kaneko, Y.; Ohta, M.; Inoue, T.; Mizuno, K.; Isobe, T.; Tanabe, S.; Tanihara, H. Effects of K-115 (Ripasudil), a novel ROCK inhibitor, on trabecular meshwork and Schlemm’s canal endothelial cells. Sci. Rep. 2016, 6, 19640. [Google Scholar] [CrossRef] [PubMed]
  22. Watanabe, M.; Ida, Y.; Ohguro, H.; Ota, C.; Hikage, F. Establishment of appropriate glaucoma models using dexamethasone or TGFβ2 treated three-dimension (3D) cultured human trabecular meshwork (HTM) cells. Sci. Rep. 2021, 11, 19369. [Google Scholar] [CrossRef]
  23. Ota, C.; Ida, Y.; Ohguro, H.; Hikage, F. ROCK inhibitors beneficially alter the spatial configuration of TGFβ2-treated 3D organoids from a human trabecular meshwork (HTM). Sci. Rep. 2020, 10, 20292. [Google Scholar] [CrossRef] [PubMed]
  24. Yang, J.; Ruan, F.; Zheng, Z. Ripasudil Attenuates Lipopolysaccharide (LPS)-Mediated Apoptosis and Inflammation in Pulmonary Microvascular Endothelial Cells via ROCK2/eNOS Signaling. Med. Sci. Monit. 2018, 24, 3212–3219. [Google Scholar] [CrossRef] [PubMed]
  25. Liang, H.; Liao, M.; Zhao, W.; Zheng, X.; Xu, F.; Wang, H.; Huang, J. CXCL16/ROCK1 signaling pathway exacerbates acute kidney injury induced by ischemia-reperfusion. Biomed. Pharmacother. 2018, 98, 347–356. [Google Scholar] [CrossRef] [PubMed]
  26. Watanabe, M.; Ida, Y.; Ohguro, H.; Ota, C.; Hikage, F. Diverse effects of pan-ROCK and ROCK2 inhibitors on 2 D and 3D cultured human trabecular meshwork (HTM) cells treated with TGFβ2. Sci. Rep. 2021, 11, 15286. [Google Scholar] [CrossRef] [PubMed]
  27. Watanabe, M.; Ida, Y.; Furuhashi, M.; Tsugeno, Y.; Hikage, F.; Ohguro, H. Pan-ROCK and ROCK2 Inhibitors Affect Dexamethasone-Treated 2D- and 3D-Cultured Human Trabecular Meshwork (HTM) Cells in Opposite Manners. Molecules 2021, 26, 6382. [Google Scholar] [CrossRef] [PubMed]
  28. Keller, K.E.; Bhattacharya, S.K.; Borrás, T.; Brunner, T.M.; Chansangpetch, S.; Clark, A.F.; Dismuke, W.M.; Du, Y.; Elliott, M.H.; Ethier, C.R.; et al. Consensus recommendations for trabecular meshwork cell isolation, characterization and culture. Exp. Eye Res. 2018, 171, 164–173. [Google Scholar] [CrossRef] [PubMed]
  29. Oouchi, Y.; Watanabe, M.; Ida, Y.; Ohguro, H.; Hikage, F. Rosiglitasone and ROCK Inhibitors Modulate Fibrogenetic Changes in TGF-β2 Treated Human Conjunctival Fibroblasts (HconF) in Different Manners. Int. J. Mol. Sci. 2021, 22, 7335. [Google Scholar] [CrossRef]
  30. Watanabe, M.; Sato, T.; Tsugeno, Y.; Higashide, M.; Furuhashi, M.; Ohguro, H. TGF-β-3 Induces Different Effects from TGF-β-1 and -2 on Cellular Metabolism and the Spatial Properties of the Human Trabecular Meshwork Cells. Int. J. Mol. Sci. 2023, 24, 4181. [Google Scholar] [CrossRef]
  31. Ichioka, H.; Hirohashi, Y.; Sato, T.; Furuhashi, M.; Watanabe, M.; Ida, Y.; Hikage, F.; Torigoe, T.; Ohguro, H. G-Protein-Coupled Receptors Mediate Modulations of Cell Viability and Drug Sensitivity by Aberrantly Expressed Recoverin 3 within A549 Cells. Int. J. Mol. Sci. 2023, 24, 771. [Google Scholar] [CrossRef] [PubMed]
  32. Kim, D.; Langmead, B.; Salzberg, S.L. HISAT: A fast spliced aligner with low memory requirements. Nat. Methods 2015, 12, 357–360. [Google Scholar] [CrossRef] [PubMed]
  33. Krämer, A.; Green, J.; Pollard, J., Jr.; Tugendreich, S. Causal analysis approaches in Ingenuity Pathway Analysis. Bioinformatics 2014, 30, 523–530. [Google Scholar] [CrossRef] [PubMed]
  34. Shao, Z.; Wang, K.; Zhang, S.; Yuan, J.; Liao, X.; Wu, C.; Zou, Y.; Ha, Y.; Shen, Z.; Guo, J.; et al. Ingenuity pathway analysis of differentially expressed genes involved in signaling pathways and molecular networks in RhoE gene-edited cardiomyocytes. Int. J. Mol. Med. 2020, 46, 1225–1238. [Google Scholar] [CrossRef] [PubMed]
  35. Alimadadi, A.; Aryal, S.; Manandhar, I.; Joe, B.; Cheng, X. Identification of Upstream Transcriptional Regulators of Ischemic Cardiomyopathy Using Cardiac RNA-Seq Meta-Analysis. Int. J. Mol. Sci. 2020, 21, 3472. [Google Scholar] [CrossRef] [PubMed]
  36. Ida, Y.; Hikage, F.; Itoh, K.; Ida, H.; Ohguro, H. Prostaglandin F2α agonist-induced suppression of 3T3-L1 cell adipogenesis affects spatial formation of extra-cellular matrix. Sci. Rep. 2020, 10, 7958. [Google Scholar] [CrossRef] [PubMed]
  37. Itoh, K.; Hikage, F.; Ida, Y.; Ohguro, H. Prostaglandin F2α Agonists Negatively Modulate the Size of 3D Organoids from Primary Human Orbital Fibroblasts. Investig. Ophthalmol. Vis. Sci. 2020, 61, 13. [Google Scholar] [CrossRef] [PubMed]
  38. Liao, J.K.; Seto, M.; Noma, K. Rho kinase (ROCK) inhibitors. J. Cardiovasc. Pharmacol. 2007, 50, 17–24. [Google Scholar] [CrossRef] [PubMed]
  39. Leung, T.; Chen, X.Q.; Manser, E.; Lim, L. The p160 RhoA-binding kinase ROK alpha is a member of a kinase family and is involved in the reorganization of the cytoskeleton. Mol. Cell. Biol. 1996, 16, 5313–5327. [Google Scholar] [CrossRef]
  40. Yoneda, A.; Multhaupt, H.A.; Couchman, J.R. The Rho kinases I and II regulate different aspects of myosin II activity. J. Cell Biol. 2005, 170, 443–453. [Google Scholar] [CrossRef]
  41. Yoneda, A.; Ushakov, D.; Multhaupt, H.A.; Couchman, J.R. Fibronectin matrix assembly requires distinct contributions from Rho kinases I and -II. Mol. Biol. Cell 2007, 18, 66–75. [Google Scholar] [CrossRef] [PubMed]
  42. Surma, M.; Wei, L.; Shi, J. Rho kinase as a therapeutic target in cardiovascular disease. Future Cardiol. 2011, 7, 657–671. [Google Scholar] [CrossRef] [PubMed]
  43. Hohenberger, P.; Eing, C.; Straessner, R.; Durst, S.; Frey, W.; Nick, P. Plant actin controls membrane permeability. Biochim. Biophys. Acta 2011, 1808, 2304–2312. [Google Scholar] [CrossRef] [PubMed]
  44. Liu, X.; Yu, X.; Zack, D.J.; Zhu, H.; Qian, J. TiGER: A database for tissue-specific gene expression and regulation. BMC Bioinform. 2008, 9, 271. [Google Scholar] [CrossRef] [PubMed]
  45. Di Cunto, F.; Imarisio, S.; Hirsch, E.; Broccoli, V.; Bulfone, A.; Migheli, A.; Atzori, C.; Turco, E.; Triolo, R.; Dotto, G.P.; et al. Defective neurogenesis in citron kinase knockout mice by altered cytokinesis and massive apoptosis. Neuron 2000, 28, 115–127. [Google Scholar] [CrossRef] [PubMed]
  46. Wei, L.; Roberts, W.; Wang, L.; Yamada, M.; Zhang, S.; Zhao, Z.; Rivkees, S.A.; Schwartz, R.J.; Imanaka-Yoshida, K. Rho kinases play an obligatory role in vertebrate embryonic organogenesis. Development 2001, 128, 2953–2962. [Google Scholar] [CrossRef] [PubMed]
  47. Jiang, T.; Peng, D.; Shi, W.; Guo, J.; Huo, S.; Men, L.; Zhang, C.; Li, S.; Lv, J.; Lin, L. IL-6/STAT3 Signaling Promotes Cardiac Dysfunction by Upregulating FUNDC1-Dependent Mitochondria-Associated Endoplasmic Reticulum Membranes Formation in Sepsis Mice. Front. Cardiovasc. Med. 2021, 8, 790612. [Google Scholar] [CrossRef] [PubMed]
  48. Sadrkhanloo, M.; Paskeh, M.D.A.; Hashemi, M.; Raesi, R.; Motahhary, M.; Saghari, S.; Sharifi, L.; Bokaie, S.; Mirzaei, S.; Entezari, M.; et al. STAT3 signaling in prostate cancer progression and therapy resistance: An oncogenic pathway with diverse functions. Biomed. Pharmacother. 2023, 158, 114168. [Google Scholar] [CrossRef] [PubMed]
  49. Ohguro, H.; Ida, Y.; Hikage, F.; Umetsu, A.; Ichioka, H.; Watanabe, M.; Furuhashi, M. STAT3 Is the Master Regulator for the Forming of 3D Spheroids of 3T3-L1 Preadipocytes. Cells 2022, 11, 300. [Google Scholar] [CrossRef]
  50. Valle, M.L.; Dworshak, J.; Sharma, A.; Ibrahim, A.S.; Al-Shabrawey, M.; Sharma, S. Inhibition of interleukin-6 trans-signaling prevents inflammation and endothelial barrier disruption in retinal endothelial cells. Exp. Eye Res. 2019, 178, 27–36. [Google Scholar] [CrossRef]
  51. Brooks, G.D.; McLeod, L.; Alhayyani, S.; Miller, A.; Russell, P.A.; Ferlin, W.; Rose-John, S.; Ruwanpura, S.; Jenkins, B.J. IL6 Trans-signaling Promotes KRAS-Driven Lung Carcinogenesis. Cancer Res. 2016, 76, 866–876. [Google Scholar] [CrossRef] [PubMed]
  52. Chen, W.; Yuan, H.; Cao, W.; Wang, T.; Chen, W.; Yu, H.; Fu, Y.; Jiang, B.; Zhou, H.; Guo, H.; et al. Blocking interleukin-6 trans-signaling protects against renal fibrosis by suppressing STAT3 activation. Theranostics 2019, 9, 3980–3991. [Google Scholar] [CrossRef] [PubMed]
  53. Inoue-Mochita, M.; Inoue, T.; Kojima, S.; Futakuchi, A.; Fujimoto, T.; Sato-Ohira, S.; Tsutsumi, U.; Tanihara, H. Interleukin-6-mediated trans-signaling inhibits transforming growth factor-β signaling in trabecular meshwork cells. J. Biol. Chem. 2018, 293, 10975–10984. [Google Scholar] [CrossRef] [PubMed]
  54. Ohira, S.; Inoue, T.; Shobayashi, K.; Iwao, K.; Fukushima, M.; Tanihara, H. Simultaneous increase in multiple proinflammatory cytokines in the aqueous humor in neovascular glaucoma with and without intravitreal bevacizumab injection. Investig. Ophthalmol. Vis. Sci. 2015, 56, 3541–3548. [Google Scholar] [CrossRef] [PubMed]
  55. Takai, Y.; Tanito, M.; Ohira, A. Multiplex cytokine analysis of aqueous humor in eyes with primary open-angle glaucoma, exfoliation glaucoma, and cataract. Investig. Ophthalmol. Vis. Sci. 2012, 53, 241–247. [Google Scholar] [CrossRef] [PubMed]
  56. Garbers, C.; Rose-John, S. Dissecting Interleukin-6 Classic- and Trans-Signaling in Inflammation and Cancer. Methods Mol. Biol. 2018, 1725, 127–140. [Google Scholar] [CrossRef] [PubMed]
  57. Garbers, C.; Aparicio-Siegmund, S.; Rose-John, S. The IL-6/gp130/STAT3 signaling axis: Recent advances towards specific inhibition. Curr. Opin. Immunol. 2015, 34, 75–82. [Google Scholar] [CrossRef] [PubMed]
  58. Liton, P.B.; Luna, C.; Bodman, M.; Hong, A.; Epstein, D.L.; Gonzalez, P. Induction of IL-6 expression by mechanical stress in the trabecular meshwork. Biochem. Biophys. Res. Commun. 2005, 337, 1229–1236. [Google Scholar] [CrossRef]
  59. Yemanyi, F.; Raghunathan, V. Lysophosphatidic Acid and IL-6 Trans-signaling Interact via YAP/TAZ and STAT3 Signaling Pathways in Human Trabecular Meshwork Cells. Investig. Ophthalmol. Vis. Sci. 2020, 61, 29. [Google Scholar] [CrossRef]
  60. Ma, W.; Sze, K.M.; Chan, L.K.; Lee, J.M.; Wei, L.L.; Wong, C.M.; Lee, T.K.; Wong, C.C.; Ng, I.O. RhoE/ROCK2 regulates chemoresistance through NF-κB/IL-6/ STAT3 signaling in hepatocellular carcinoma. Oncotarget 2016, 7, 41445–41459. [Google Scholar] [CrossRef]
  61. Mettu, P.S.; Deng, P.F.; Misra, U.K.; Gawdi, G.; Epstein, D.L.; Rao, P.V. Role of lysophospholipid growth factors in the modulation of aqueous humor outflow facility. Investig. Ophthalmol. Vis. Sci. 2004, 45, 2263–2271. [Google Scholar] [CrossRef] [PubMed]
  62. Stamer, W.D.; Read, A.T.; Sumida, G.M.; Ethier, C.R. Sphingosine-1-phosphate effects on the inner wall of Schlemm’s canal and outflow facility in perfused human eyes. Exp. Eye Res. 2009, 89, 980–988. [Google Scholar] [CrossRef]
  63. Lee, M.J.; Van Brocklyn, J.R.; Thangada, S.; Liu, C.H.; Hand, A.R.; Menzeleev, R.; Spiegel, S.; Hla, T. Sphingosine-1-phosphate as a ligand for the G protein-coupled receptor EDG-1. Science 1998, 279, 1552–1555. [Google Scholar] [CrossRef] [PubMed]
  64. Rosen, H.; Gonzalez-Cabrera, P.J.; Sanna, M.G.; Brown, S. Sphingosine 1-phosphate receptor signaling. Annu. Rev. Biochem. 2009, 78, 743–768. [Google Scholar] [CrossRef] [PubMed]
  65. Sumida, G.M.; Stamer, W.D. S1P2 receptor regulation of sphingosine-1-phosphate effects on conventional outflow physiology. Am. J. Physiol. Cell Physiol. 2011, 300, C1164–C1171. [Google Scholar] [CrossRef] [PubMed]
  66. Rivenbark, A.G.; Coleman, W.B. Epigenetic regulation of cystatins in cancer. Front. Biosci. 2009, 14, 453–462. [Google Scholar] [CrossRef] [PubMed]
  67. Kennedy, K.D.; AnithaChristy, S.A.; Buie, L.K.; Borrás, T. Cystatin a, a potential common link for mutant myocilin causative glaucoma. PLoS ONE 2012, 7, e36301. [Google Scholar] [CrossRef]
  68. Boerma, M.; Fu, Q.; Wang, J.; Loose, D.S.; Bartolozzi, A.; Ellis, J.L.; McGonigle, S.; Paradise, E.; Sweetnam, P.; Fink, L.M.; et al. Comparative gene expression profiling in three primary human cell lines after treatment with a novel inhibitor of Rho kinase or atorvastatin. Blood Coagul. Fibrinolysis Int. J. Haemost. Thromb. 2008, 19, 709–718. [Google Scholar] [CrossRef]
Figure 1. Real-time ATP rate assay after addition of 10 μM KD025 in HTM cells. OCR values (A) and ECAR values (B) in planar HTM cells. Solid lines and black circles indicate the control group that received DMSO from the injection port A (n = 6) and dotted lines and open circles indicate the group that received KD025 (final concentration: 10 μM) from the injection port A (n = 6). Calculated mitochondrial ATP production rate (blue color) and glycolytic ATP production rate (red color) using online Seahorse Analytics (https://seahorseanalytics.agilent.com) are indicated (C). Data are presented as means ± the standard error of the mean (SEM). * p < 0.05 (Student’s t-test).
Biomedicines 12 01165 g001
Figure 2. Heatmaps for DEGs for HTM cells not treated with KD025 (NT 1–3) and HTM cells treated with KD025 (KD 1–3). Differentially expressed genes (DEGs) in HTM cells not treated with KD025 (NT1~3) and HTM cells treated with KD025 (KD1~3) are shown by a hierarchical clustering heatmap. Colored points represent differentially expressed genes (cutoff FDR < 0.05) and/or the magnitude of change ≥2 that are either overexpressed (red) or underexpressed (blue) in KD HTM cells compared with their expression levels in NT HTM cells.
Biomedicines 12 01165 g002
Figure 3. M-A (A) and volcano (B) plots for untreated HTM cells vs. KD025-treated HTM cells. Differentially expressed genes (DEGs) in HTM cells not treated with KD025 (NT) and HTM cells treated with KD025 (KD) are shown by an M–A (A) and a volcano (B) plot. Red and blue points represent overexpressed and underexpressed in KD HTM cells in comparison with their expression levels in NT (non-treated control) HTM cells.
Biomedicines 12 01165 g003aBiomedicines 12 01165 g003b
Figure 4. Results in GO enrichment analysis. Bar charts showing the GO terms for cellular component (A) and molecular function (B). Bar color represent p adjusted values (<0.2) and x-axis represents numbers of DEGs.
Biomedicines 12 01165 g004
Figure 5. mRNA expression of STAT3, IL6, S1PR3 and CSTA in the absence and presence of 10 μM KD025. qPCR analysis of STAT3, IL6, S1PR3 and CSTA of 10 μM KD025-treated and untreated 2D HTM cells was performed in duplicate, and the expression ratio as compared with reference gene, 36B4 were plotted. * p < 0.05, ** p < 0.01.
Biomedicines 12 01165 g005
Table 1. Top 10 DEGs up-regulated and down-regulated in HTM cells not treated with KD025 and HTM cells treated with KD025.
Up Regulation Down Regulation
Moleculesp-Value Moleculesp-Value
KIF1A6.301 CHRNA1−5.838
CDHR16.156 TNFSF18−5.603
CSTA5.410 IDO1−5.018
LCN15.271 LOC105377155−4.997
HSPA64.990 LOC102724434−4.661
LINC017054.837 ENSG00000289492−4.658
PIP5K1B4.719 CFI−4.610
LINC025684.679 AKAP13-AS1−4.605
ZBBX4.607 MYO16−4.555
AGA-DT4.593 RP11_885L141−4.502
Table 2. TOP molecular and cellular functions.
Molecular and Cellular Functions
Namep-Value of RangeMolecules
Cellular Movement1.58 × 10−0.6–1.98 × 10−21278
Cellular Development1.47 × 10−0.6–4.12 × 10−19368
Cellular Function and Maintenance5.00 × 10−0.7–4.12× 10−19303
Cellular Growth and Proliferation1.24 × 10−0.6–4.12 × 10−19359
Cell-To-Cell Signaling and Interaction1.58 × 10−0.6–6.61 × 10−16227
Table 3. Top networks. A list of the top significant five networks with the IPA score more than 30.
Top Networks
No.Associated Network FunctionsScore
1Developmental Disorder, Hereditary Disorder, Organismal Injury and Abnormalities 41
2Cardiac Dilation, Cardiac Enlargement, Cardiovascular Disease33
3Nervous System Development and Function, Neurological Disease, Organismal Injury and Abnormalities33
4Organ Morphology, Organismal Development, Renal and Urological System Development and Function33
5Cell Death and Survival, Organismal Injury and Abnormalities, Skeletal and Muscular Disorders33
Table 4. Upstream regulator and causal network regulator.
Upstream RegulatorExpression Log RatioActivation z-Scorep Value of Overlap
IL6−1.688−2.4740.00002
STAT31.513.0610.00008
Causal Network RegulatorExpression Log RatioActivation z-Scorep Value of Overlap
CSTA5.413.3120.001
S1PR31.524.4270.002
Table 5. Summary of effects of Rip or KD025 on physical properties and cellular metabolic functions of dexamethasone (D)-treated and TGF-b2 (T)-treated HTM cells.
D + RipD + KDT + RipT + KD
TEER↑↑↑↓↓↓
Size↑↑↑↑↑↑↑↑
Stiffness↑↑↑↓↓↓↓↓↓↑↑↑
OCR↑↑
ECRA↓↓
Disclaimer/Publisher’s Note: The statements, opinions and data contained in all publications are solely those of the individual author(s) and contributor(s) and not of MDPI and/or the editor(s). MDPI and/or the editor(s) disclaim responsibility for any injury to people or property resulting from any ideas, methods, instructions or products referred to in the content.

