Article

Plasma and Urinary Metabolomic Analysis of Gout and Asymptomatic Hyperuricemia and Profiling of Potential Biomarkers: A Pilot Study

1
Department of Pathophysiology, Tokyo University of Pharmacy and Life Sciences, Tokyo 192-0392, Japan
2
Department of Pharmacy, International University of Health and Welfare, Tochigi 324-8501, Japan
3
Ryogoku Higashiguchi Clinic, Tokyo 130-0026, Japan
4
Tsuruoka Metabolomics Laboratory, National Cancer Center, Yamagata 997-0052, Japan
5
Department of Pharmacy, University of Tokyo Hospital, Faculty of Medicine, University of Tokyo, Tokyo 113-8655, Japan
6
Department of Integrative Physiology and Bio-Nano Medicine, National Defense Medical College, Saitama 359-8513, Japan
7
Division of Kidney and Hypertension, Department of Internal Medicine, Jikei University School of Medicine, Tokyo 105-8461, Japan
8
Chiba Health Promotion Center, East Japan Railway Company, Chiba 260-0045, Japan
*
Author to whom correspondence should be addressed.
Biomedicines 2024, 12(2), 300; https://doi.org/10.3390/biomedicines12020300
Submission received: 29 December 2023 / Revised: 20 January 2024 / Accepted: 25 January 2024 / Published: 27 January 2024

Abstract

:
Gout results from monosodium urate deposition caused by hyperuricemia, but most individuals with hyperuricemia remain asymptomatic. The pathogenesis of gout remains uncertain. To identify potential biomarkers distinguishing gout from asymptomatic hyperuricemia, we conducted a genetic analysis of urate transporters and metabolomic analysis as a proof-of-concept study, including 33 patients with gout and 9 individuals with asymptomatic hyperuricemia. The variant allele frequencies of rs72552713, rs2231142, and rs3733591, which are related to serum urate levels (SUA) and gout, did not differ between the gout and asymptomatic hyperuricemia groups. In metabolomic analysis, the levels of citrate cycle intermediates, especially 2-ketoglutarate, were higher in patients with gout than in those with asymptomatic hyperuricemia (fold difference = 1.415, p = 0.039). The impact on the TCA cycle was further emphasized in high-risk gout (SUA ≥ 9.0 mg/dL). Of note, urinary nicotinate was the most prominent biomarker differentiating high-risk gout from asymptomatic hyperuricemia (fold difference = 6.515, p = 0.020). Although urate transporters play critical roles in SUA elevation and promote hyperuricemia, this study suggests that the progression from asymptomatic hyperuricemia to gout might be closely related to other genetic and/or environmental factors affecting carbohydrate metabolism and urinary urate excretion.

1. Introduction

Gout is the most common inflammatory arthritis, and its prevalence is increasing globally [1]. The symptoms of acute inflammatory arthritis (gouty flare) are severe pain, swelling, heat, and joint dysfunction. Extreme pain with gouty flare is rated higher than 7 by patients on a 10-point pain scale, and this pain significantly impairs patients’ quality of life [2]. The pathogenesis of gout involves the formation and deposition of monosodium urate (MSU) crystals, and it is associated with hyperuricemia, which is defined as serum urate levels (SUA) exceeding 7.0 mg/dL, resulting in urate supersaturation in tissues. Therefore, hyperuricemia is a strong predictor of gouty flare. Indeed, the Normative Aging Study reported that the 5-year cumulative incidence of gout increased with increasing SUA (0.5% for SUA ≤ 6.0 mg/dL, 0.6% for SUA = 6.0–6.9 mg/dL, 2.0% for SUA = 7.0–7.9 mg/dL, 4.1% for SUA = 8.0–8.9 mg/dL, 19.8% for SUA = 9.0–9.9 mg/dL, and 30.5% for SUA = ≥10.0 mg/dL) [3]. Nevertheless, 78% of men with baseline SUA ≥ 9.0 mg/dL did not develop gouty flare over the subsequent 5 years [3]. According to a recent large-scale study, including 18,889 participants from four publicly available cohorts, approximately 50% of individuals with SUA ≥ 10.0 mg/dL, well above the physiologic concentration causing urate deposition, developed evident gouty flare over 15 years [4]. In addition, it has been reported that MSU deposition begins in the asymptomatic phase of hyperuricemia [5,6]. These findings suggest that the development of gout cannot be explained by elevated SUA alone, and other additional factors promote the progression of asymptomatic hyperuricemia to gout.
Metabolomics is the field of systems biology that comprehensively investigates metabolites produced by biological activities, and it has rapidly developed in recent years. In various pathological conditions, changes in biological responses attributable to disease cause metabolic changes and alter metabolite profiles specific to the disease. Because changes in metabolic profiles caused by diseases are believed to be reflected in blood and urinary metabolites, metabolomics is considered useful for identifying biomarkers of abnormalities in pathological conditions [7]. Metabolomics has identified pathways and metabolites playing important roles in regulating SUA [8]. To date, some differential metabolites have been identified in studies that compared metabolites between individuals with gout and healthy controls [9,10]. These studies notably identified metabolites and metabolic pathways involved in SUA elevation or gouty flare. Additionally, several metabolomics studies profiled metabolites to predict the progression from asymptomatic hyperuricemia to gout [11,12,13]. However, metabolomic studies in individuals with asymptomatic hyperuricemia and gout only focused on plasma metabolites, and metabolomic analysis of urinary metabolites comparing asymptomatic hyperuricemia to gout has not been conducted. Genome-wide association studies (GWAS) reported a variety of gout-related genes, with renal urate transporters being the most frequently associated genes [14,15]. Thus, urine potentially contains many meaningful metabolites that characterize the onset of gout.
In this study, we investigated the potential for metabolomics to detect differences between gout and asymptomatic hyperuricemia using both plasma and urinary samples as a proof-of-concept (PoC) study.

2. Materials and Methods

2.1. Study Design and Participants

This study was designed as a cross-sectional observational study. In total, 42 participants (gout, n = 33; asymptomatic hyperuricemia, n = 9) who were outpatients at Ryogoku Higashiguchi Clinic (Tokyo, Japan) were enrolled in this study from September 2019 to April 2020. No patients with COVID-19 were included in this study. All participants were diagnosed with hyperuricemia (SUA > 7.0 mg/dL), and all participants with gout were diagnosed according to the Japanese Guideline on the Management of Hyperuricemia and Gout, 3rd edition [16]. Because most patients with gout are men, the participants in the study, a small-scale PoC trial, were restricted to adult men (age > 20 years).

2.2. Data Collection

Data on age, sex, height, weight, body mass index, systolic and diastolic blood pressure, blood parameters (white blood cells, red blood cells, hematocrit, platelets, high-density lipoprotein cholesterol, low-density lipoprotein cholesterol, triglyceride, aspartate aminotransferase, alanine aminotransferase, gamma-glutamyl transpeptidase, hemoglobin A1c, serum creatinine [SCr], SUA, blood urea nitrogen, sodium, potassium, chlorine), and urinary parameters (urinary creatinine [UCr], urinary urate [UUA]) were obtained from patient’s medical records at study entry. We calculated the UUA/UCr ratio and fractional excretion of uric acid (UUA × SCr/SUA × UCr) as the indicators of urinary urate excretion. At the same time, medical questionnaires were used to investigate the durations of hyperuricemia and uric acid-lowering medication use.

2.3. Sample Preparation and Metabolomic Measurements Using Gas Chromatography–Tandem Mass Spectrometry (GC-MS/MS)

For GC-MS/MS, 50 μL of plasma and urine samples were collected from participants with gout or asymptomatic hyperuricemia. The samples, which were mixed with 10 μL (0.5 mg/mL) of 2-isopropylmalic acid (Sigma-Aldrich, St. Louis, MO, USA) as an internal standard, were additionally mixed with 1 L of a solvent mixture (MeOH/H2O/CHCl3 = 2.5/1/1, v/v/v). The mixture was centrifuged at 1200 rpm for 30 min at 37 °C followed by 16,000× g for 3 min at 4 °C. Then, a 600-μL aliquot of the supernatant was transferred to a clean tube, and 300 μL of water was added to the tube. After mixing, the solution was centrifuged at 16,000× g for 3 min at 4 °C. Next, 400 μL of the supernatant was transferred to a clean tube and then dried overnight using a spin dryer (TAITEC, Koshigaya, Japan). After drying, 100 μL (20 mg/mL) of methoxyamine hydrochloride in pyridine was added, and the resulting mixture was incubated for 90 min at 30 °C. For derivatization, 40 μL of MSTFA was added, and the mixture was incubated for 30 min at 37 °C.
The derivatized samples were eluted with 100 μL of n-hexane, and 1 μL of the derivatized solution was injected into a GC-MS device (GCMS-TQ8050, Shimadzu, Kyoto, Japan). Helium was used as a carrier gas at a constant flow rate of 39.0 cm/s. The transfer line and ion source temperatures were 280 and 200 °C, respectively. For MS, electron ionization was performed at 70 eV, and argon was used as a collision-induced dissociation gas. Metabolite detection was performed using the Smart Metabolites Database and GCMS Solution software (Ver. 4.45, Shimadzu, Kyoto, Japan).

2.4. Genetic Analysis

Approximately 5 mL of blood collected from each participant was centrifuged to isolate leukocytes (3500 rpm, 20 °C, 30 min). Thereafter, a lysis buffer containing 3 μg/mL proteinase K was added to the cells. After extraction with TE-saturated phenol, ethanol precipitation was performed to purify the genomic DNA.
In total, 2 exons of ATP-binding cassette subfamily G member 2 (ABCG2) and 13 exons of solute carrier family 2 member 9 (SLC2A9/GLUT9 variants 1 and 2) were analyzed. To analyze two common SNPs of ABCG2 (rs72552713 and rs2231142), we performed TaqMan-based probe qualitative real-time PCR for genotyping using a THUNDERBIRD Probe qPCR Mix kit (Toyobo, Osaka, Japan) and PikoReal 96 system (Thermo Fisher Scientific, Waltham, MA, USA) using 40 ng of extracted genomic DNA according to the manufacturer’s protocols. To sequence SLC2A9 exons, 100 ng of genomic DNA were amplified in a 50-μL volume containing 1.25 U of PrimeSTAR GXL DNA Polymerase (TaKaRa Bio, Siga, Japan), 200 μM dNTPs, and the primer pair (0.4 μM). Amplified PCR products were purified using 1% agarose gel in 1 × TAE buffer and a QIAquick Gel Extraction Kit (QIAGEN, Hilden, Germany). DNA sequencing was performed using an Applied Biosystems 3730xl DNA Analyzer (Thermo Fisher Scientific, Waltham, MA, USA).

2.5. Statistical Analysis

All participants (N = 42) were classified into three groups: high-risk gout (SUA ≥ 9.0 mg/dL. n = 16), low-risk gout (SUA < 9.0 mg/dL, n = 17), and asymptomatic hyperuricemia (n = 9). The cutoff for SUA was set at 9.0 mg/dL [3], as the risk of gout is believed to dramatically increase at SUA levels of 9.0 mg/dL or higher. Each continuous value was presented as the median unless otherwise noted. Participant characteristics (demographic, genetic, clinical, and metabolic characteristics) were compared using the Kruskal–Wallis test, Steel’s test, or Fisher’s exact test.
First, multivariate partial least squares (PLS) regression analysis was performed to select candidate metabolites associated with the progression from asymptomatic hyperuricemia to gout. After separating participants with gout and asymptomatic hyperuricemia by PLS regression, the metabolites that contributed to the separation were selected. The predictors (X) and response (Y) were metabolites detected by GC-MS/MS and participant classification (high-risk gout, low-risk gout, and asymptomatic hyperuricemia), respectively. The PLS components were constrained to be orthogonal. The dimensionality-reducing transformation builds a matrix in which columns represent the first P eigenvectors of the matrix formed by the covariance between X and Y [17]. Hence, PLS regression selected a subset of scores and loadings that most effectively summarized X and Y and described the correlation between them [17]. However, PLS-based methods cannot provide any statistical significance of variables expressed by p-values. Instead, we calculated the variable importance for projection (VIP), which reflects the influence of each variable on the response. In this study, we identified 30 metabolites with the highest VIP scores as candidate metabolites associated with the pathogenesis of gout derived from PLS regression.
Second, the univariate Mann–Whitney U test and Steel’s test were conducted for candidate metabolites, and fold differences of medians compared to the asymptomatic hyperuricemia group were calculated. p-values were adjusted using the Benjamini–Hochberg method to control the false discovery rate (FDR) [18]. To include any potential metabolites as comprehensively as possible, we employed adjusted p < 0.15 as the threshold for potential biomarkers distinguishing gout from asymptomatic hyperuricemia. For multivariate and univariate analyses, JMP Pro 15 (SAS Institute Inc., Cary, NC, USA) was used. There were no missing clinical parameters, and no detected metabolites by GC-MS/MS were calculated as zero.
Then, pathway analysis of the potential biomarkers was applied within MetaboAnalyst 5.0 (https://www.metaboanalyst.ca (accessed on 13 January 2023)). Pathway analysis was performed using the KEGG (http://www.kegg.jp (accessed on 13 January 2023)) Homo sapiens pathway library and the hypergeometric test. Among all perturbed pathways, those with an impact value > 0.1 and adjusted p < 0.05 were selected as perturbed metabolic pathways associated with the development of gout. The metabolites were mapped into the pathways associated with each significant metabolite.

3. Results

3.1. Demographic, Clinical, and Genetic Characteristics of the Enrolled Participants

The demographic characteristics (e.g., uric acid-lowering medication use, complications, and familial history of gout) of the participants, which were obtained from the questionnaires, are presented in Table 1. Six participants with gout were on uric acid-lowering therapies, namely xanthine oxidase (also known as xanthine oxidoreductase) inhibitors (allopurinol, febuxostat, or topiroxostat). Several participants with gout had urolithiasis and hypertension, whereas no participants with asymptomatic hyperuricemia had coincident diseases. A familial history of gout was more common in the asymptomatic hyperuricemia group than in the gout group (55.6% vs. 24.2%).
The clinical characteristics of the participants are presented in Table 2. All participants had SUA > 8.0 mg/dL (range, 8.1–10.7 mg/dL). Participants with gout were older than those with asymptomatic hyperuricemia. The duration of hyperuricemia was 4.0 (3.5–9.0), 7.0 (5.0–10.0), and 9.0 (4.1–13.8) years in the asymptomatic hyperuricemia, low-risk gout, and high-risk gout groups, respectively. Urinary uric acid excretion and fractional excretion of uric acid were low among the study participants, and they tended to be lower in participants with gout, albeit without significance.
The common dysfunctional variants of ABCG2 (rs72552713 and rs2231142) and synonymous (rs13113918, rs10939650, rs3733589, rs13125646) and non-synonymous variants (rs6820230, rs2276961, rs3733591, rs2280205) of SLC2A9 were analyzed (Table 3). The frequencies of ABCG2 dysfunctional variants were high among the participants, and they tended to be higher in participants with asymptomatic hyperuricemia than in those with gout.

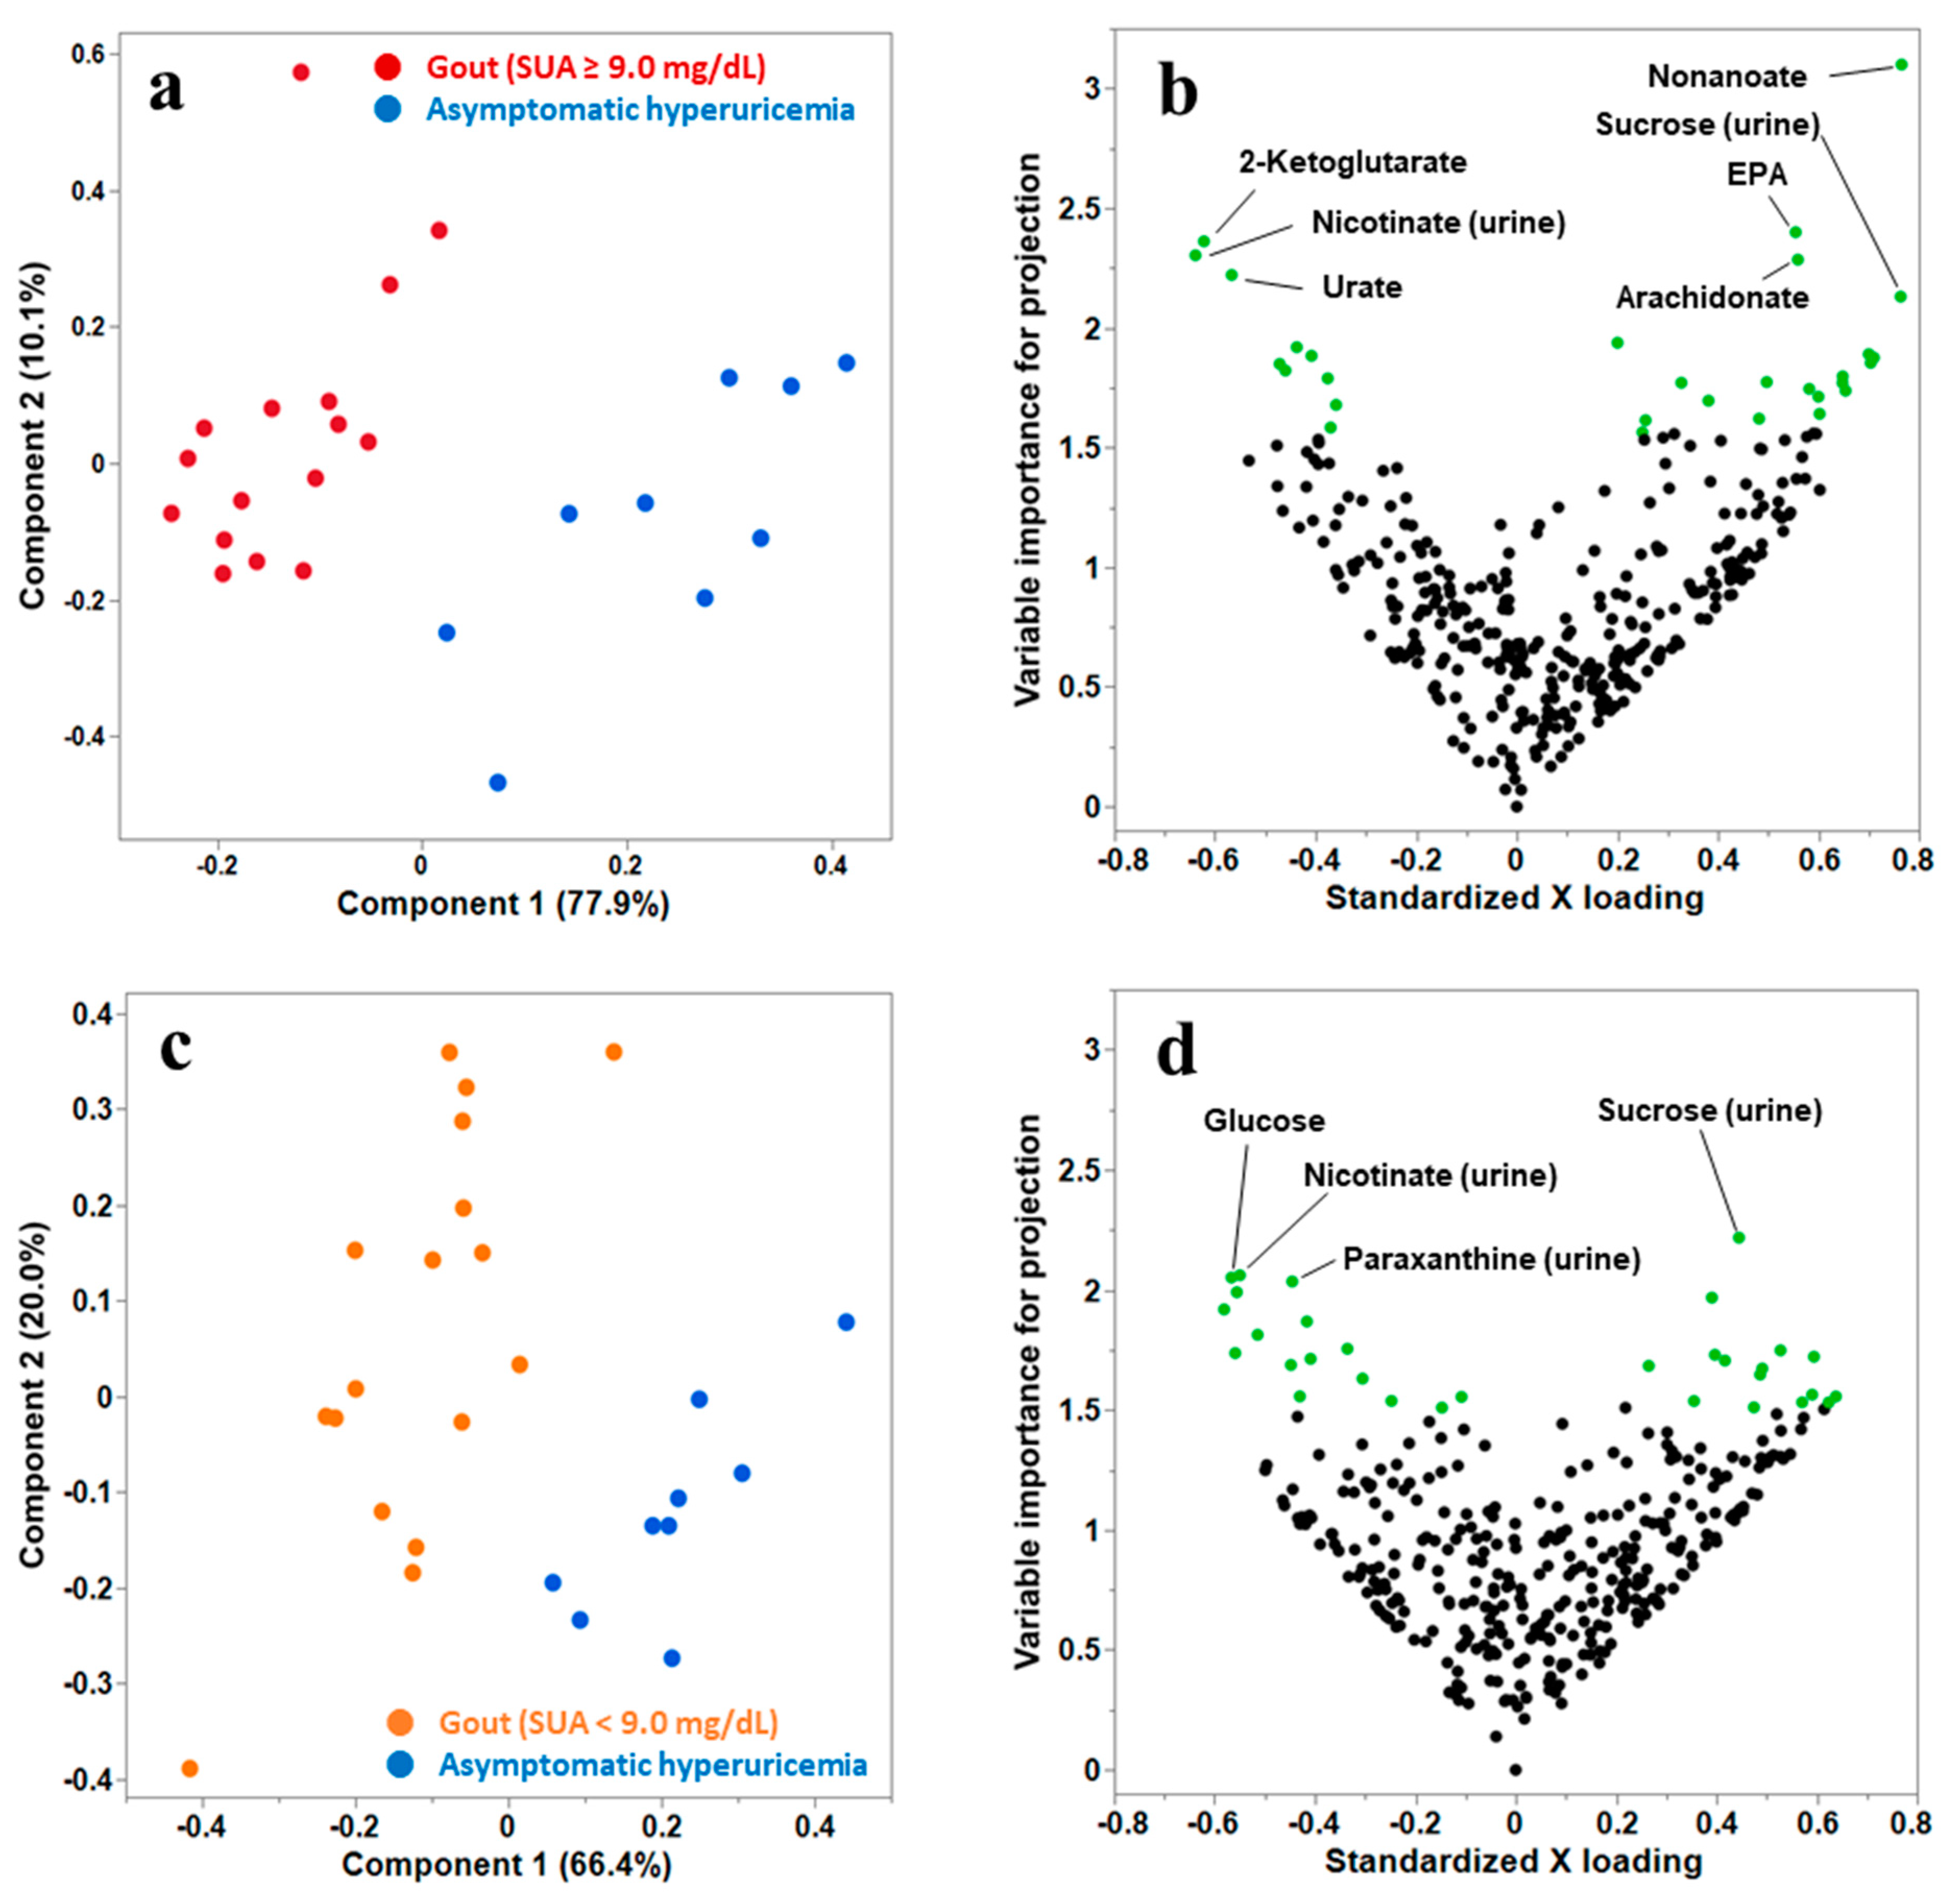
3.2. Multivariate PLS Discriminant Analysis (PLS-DA) to Select the Candidate Metabolites That Distinguish Gout from Asymptomatic Hyperuricemia

GC-MS/MS identified 149 metabolites in plasma and 211 metabolites in urine, and 135 metabolites were commonly detected in both plasma and urine samples (Supplementary Table S1). To extract the candidate metabolites associated with the development of gout, we performed PLS-DA to distinguish participants with gout from those with asymptomatic hyperuricemia.
First, we conducted PLS-DA between the high-risk gout and asymptomatic hyperuricemia groups. As presented in Figure 1a, high-risk gout samples could be distinguished from asymptomatic hyperuricemia samples. As illustrated in Figure 1b, 30 metabolites contributing to the differentiation of the groups were extracted as the candidate metabolites. Among these 30 metabolites, the metabolites that notably contributed to the discrimination (VIP > 2.0) were nonanoate, eicosapentaenoate, 2-ketoglutarate, arachidonate, and urate in plasma and nicotinate and sucrose in urine. Then, we conducted PLS-DA between low-risk gout and asymptomatic hyperuricemia groups (Figure 1c), and 30 candidate metabolites were extracted (Figure 1d). The metabolites that notably contributed to the discrimination (VIP > 2.0) were glucose in plasma and nicotinate, sucrose, and paraxanthine in urine. Of the 30 candidate metabolites extracted in both analyses, 10 common metabolites were identified: 1,5-anhydroglucitol, 2-ketoglutarate, glucose, eicosapentaenoate, nonanoate, and phosphorate in plasma and nicotinate, sucrose, creatinine, and hydroxylamine in urine. Finally, 49 metabolites were selected for the subsequent univariate and metabolic pathway analyses.

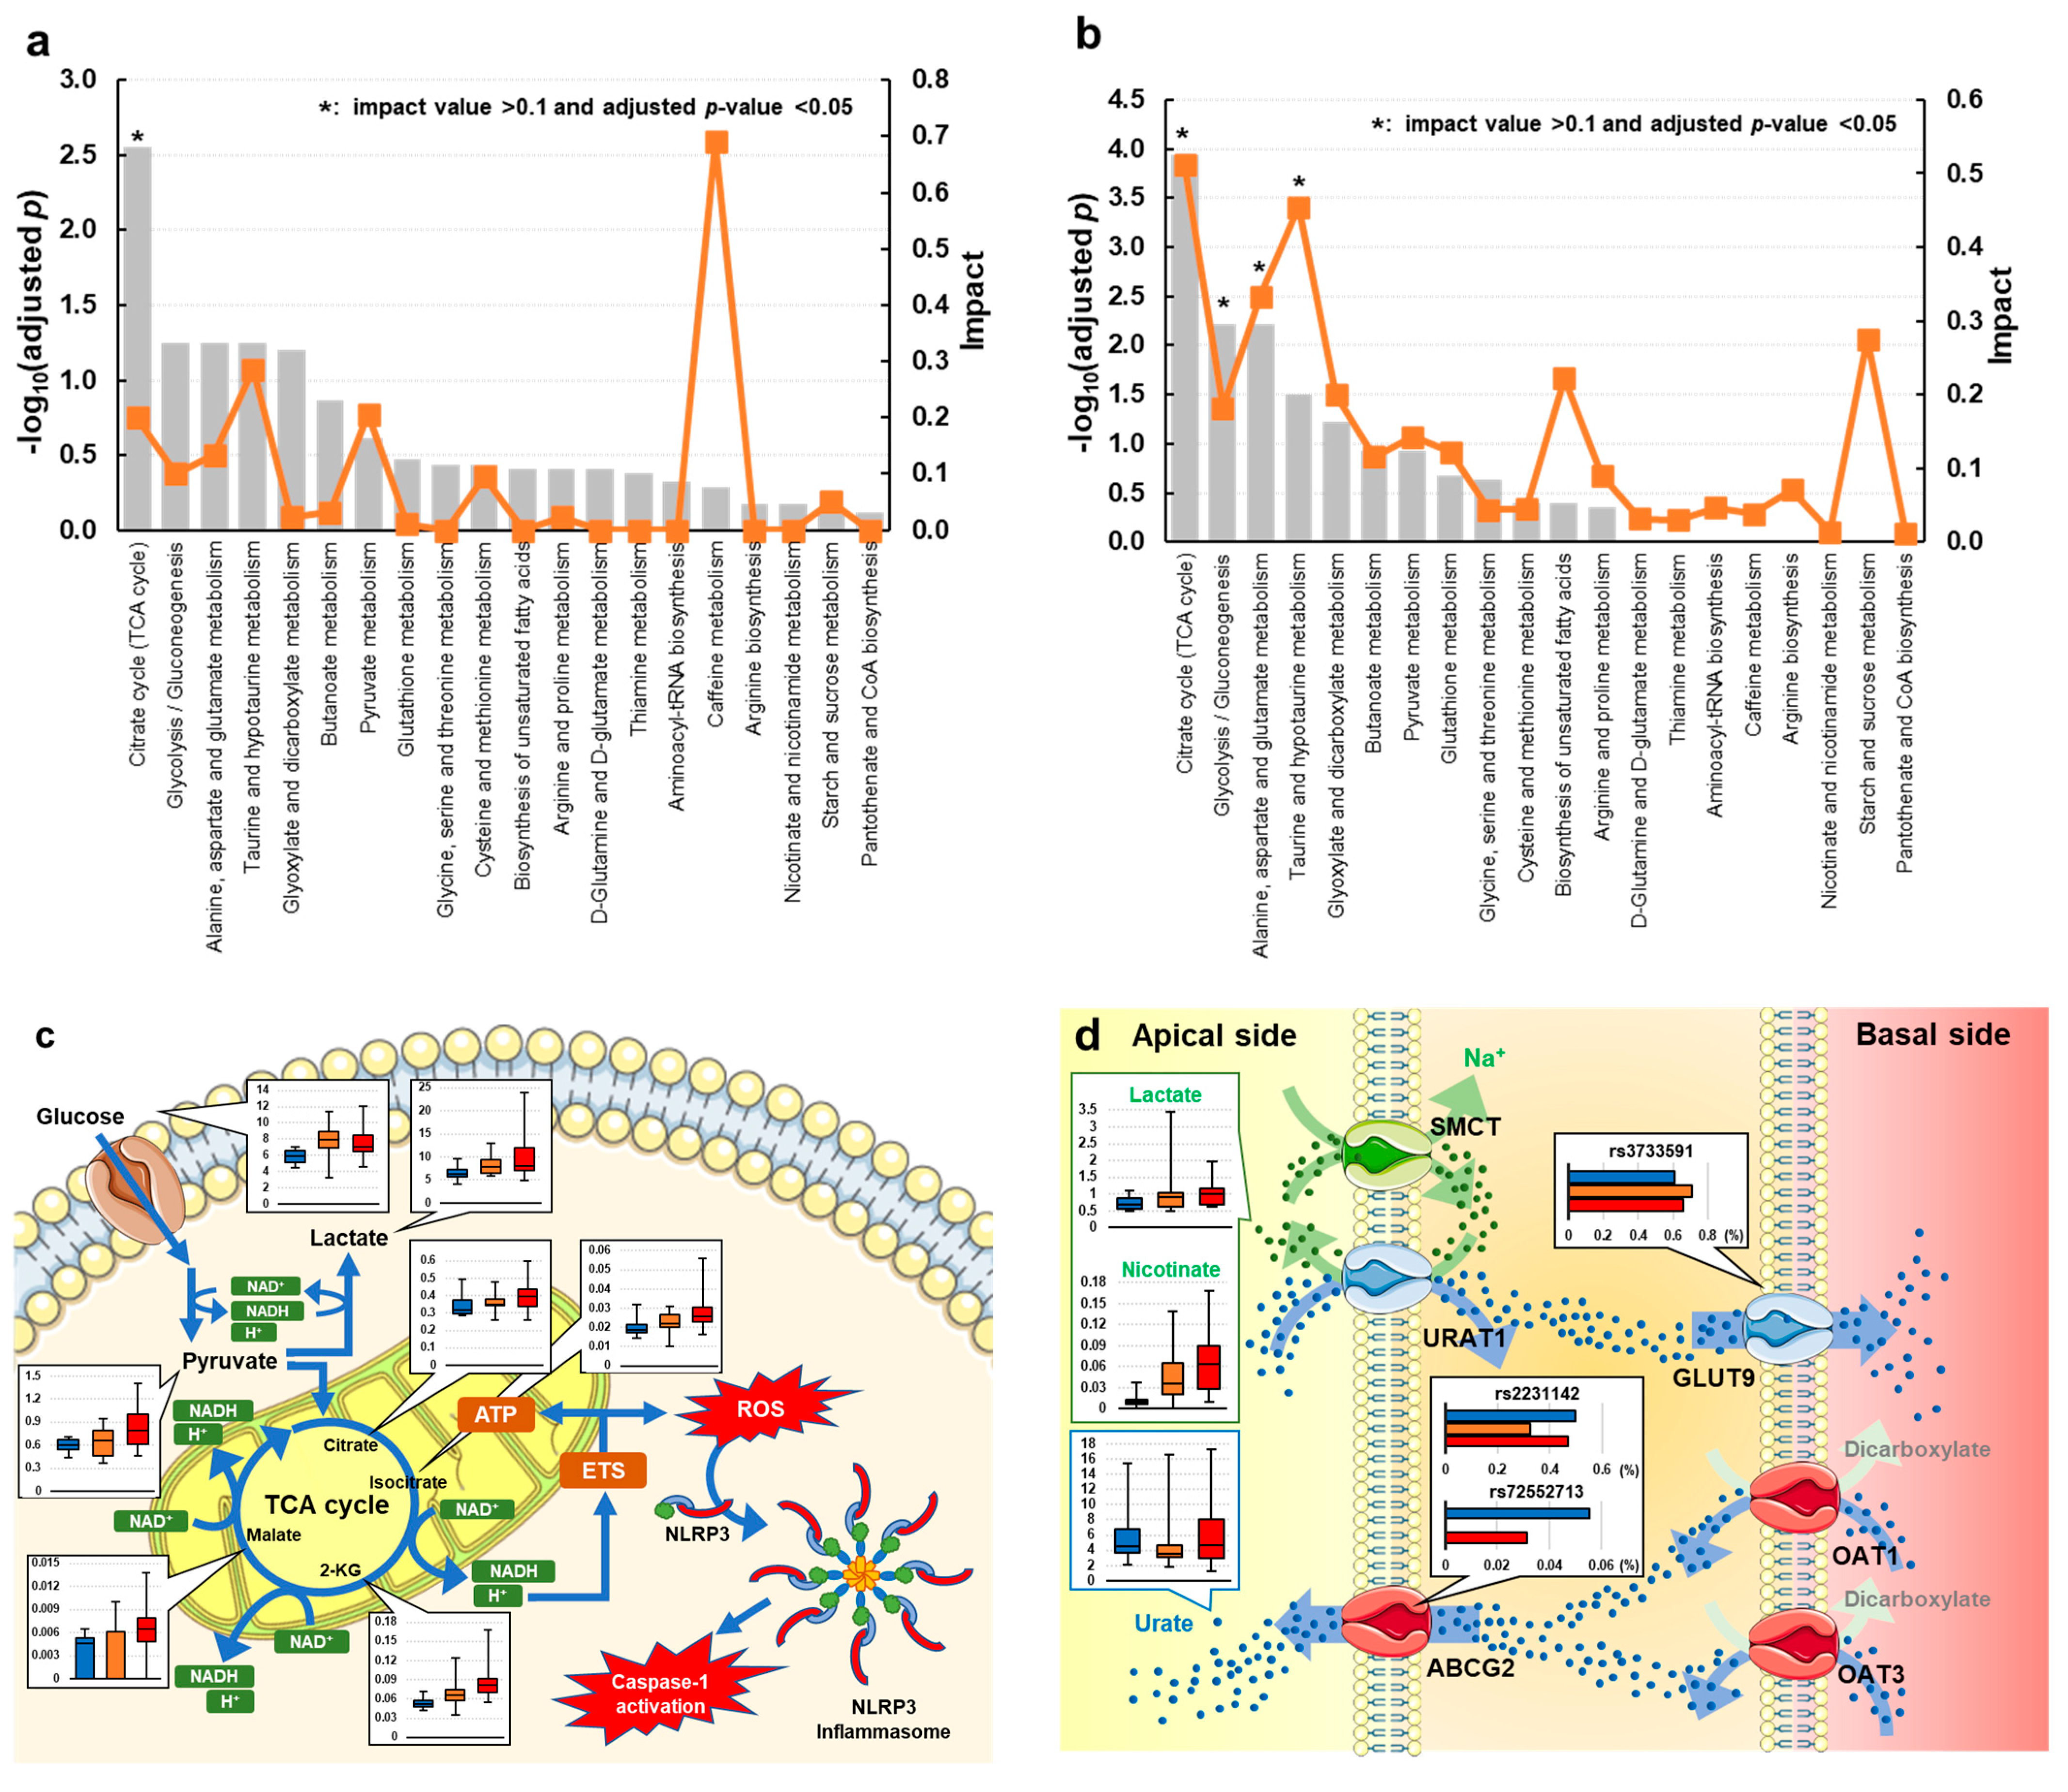
3.3. Univariate and Metabolic Pathway Analyses of Gout and Asymptomatic Hyperuricemia

To further extract the potential biomarkers distinguishing gout from asymptomatic hyperuricemia, we initially summarized the 49 candidate metabolites and tested each candidate metabolite for increasing or decreasing trends between gout and asymptomatic hyperuricemia groups (Table 4). In particular, there were clear increasing trends in plasma 2-ketoglutarate (raw p < 0.001) and urinary nicotinate levels (raw p = 0.001) in the gout group compared to the findings in the asymptomatic hyperuricemia group.
We used the univariate Mann–Whitney U test to analyze 49 candidate metabolites identified via PLS-DA. Twenty-six potential biomarkers satisfying FDR = 0.15 were found in univariate analysis (Table 4). In the gout group, 2-ketoglutarate (fold difference = 1.415, raw p < 0.001) and nicotinate (fold difference = 5.475, raw p = 0.001) were especially accumulated and excessively excreted compared to the findings in the asymptomatic hyperuricemia group (Table 5).
Furthermore, Steel’s test was conducted to compare the levels of the 49 candidate metabolites among the asymptomatic hyperuricemia, low-risk gout, and high-risk gout groups. Eighteen potential biomarkers discriminating high-risk gout and asymptomatic hyperuricemia that satisfied the FDR threshold were found, but no potential biomarker discriminating low-risk gout and asymptomatic hyperuricemia was identified (Table 5).
According to the results of pathway analysis using potential biomarkers distinguishing gout from asymptomatic hyperuricemia, the TCA cycle (impact = 0.200, adjusted p = 0.003) was perturbed (Figure 2a and Table S3). Additionally, we performed pathway analysis using potential biomarkers to distinguish high-risk gout from asymptomatic hyperuricemia (Figure 2b and Table S4). In the high-risk gout group, the impact on the TCA cycle in gout was further emphasized (impact = 0.512, adjusted p < 0.001). In addition to the TCA cycle, glyoxylate and dicarboxylate metabolism (impact = 0.182, adjusted p = 0.006); alanine, aspartate, and glutamate metabolism (impact = 0.333, adjusted p = 0.006); and pyruvate metabolism (impact = 0.455, adjusted p = 0.031) were identified as gout-related metabolic pathways (Figure 2b and Table S4). We mapped the perturbed pathway and compared potential biomarkers among the high-risk gout, low-risk gout, and asymptomatic hyperuricemia groups (Figure 2c,d).

4. Discussion

Gout progression can be defined in gradual pathological stages: asymptomatic hyperuricemia without evidence of MSU crystal deposition, asymptomatic hyperuricemia with evidence of MSU deposition, MSU deposition with prior or current symptoms of acute gouty flares, and advanced gout characterized by tophi and chronic gouty arthritis [19]. The pathophysiology of gout is based on the deposition of MSU crystals, which form in the presence of elevated SUA; i.e., hyperuricemia is the most critical predictor of gout. However, gouty flares do not develop in all individuals with hyperuricemia, and most cases of hyperuricemia remain asymptomatic [3,4]. Epidemiological evidence indicates that there are modifying factors in the stages from normouricemia to asymptomatic hyperuricemia and from asymptomatic hyperuricemia to gout. In this study, a GC-MS/MS-based metabolomic investigation using both plasma and urine samples was conducted as a PoC study to identify differential features between gout and asymptomatic hyperuricemia.
Gout is associated with both environmental and genetic factors [20,21,22,23,24]. GWAS and epidemiological studies identified several genes associated with gout [14,15,20], including the two most prominent urate transporters (ABCG2 and SLC2A9). Most GWAS compared gout to normouricemia (or without strict separation from asymptomatic hyperuricemia), and few GWAS investigated genetic factors associated with the progression from asymptomatic hyperuricemia to gout [25]. Previous GWAS using participants with gout and asymptomatic hyperuricemia detected the loci of genes encoding urate transporters (ABCG2 and SLC2A9) as genetic factors aggravating normouricemia into gout [25]. In addition, three genes (CNTN5, MIR302F, and ZNF724) were detected as ‘gout vs. asymptomatic hyperuricemia’-specific genetic factors [25]. This suggests that mechanisms other than SUA elevation are involved in the progression from asymptomatic hyperuricemia to gout. In this study, we also investigated ABCG2 and SLC2A9 in participants with gout and asymptomatic hyperuricemia. Although the variant allele frequencies of the dysfunctional SNPs of ABCG2 (rs72552713 and rs2231142) were high, there were no differences in the frequencies of ABCG2 variants associated with SUA elevation between the gout and asymptomatic hyperuricemia groups (Table 3). The pathogenic variants of SLC2A9 were assessed in all participants, and the frequency of rs3733591, which has been reported to be related to SUA [26,27,28], was not significantly different between the gout and asymptomatic hyperuricemia groups. This result suggests that other factors, including other urate transporters and environmental factors, contribute to the progression from asymptomatic hyperuricemia to gout, although the urate transporters ABCG2 [20,29,30,31] and SLC2A9 [32] play an important role in regulating SUA.
Additionally, a previous network analysis identified a cluster of genes involved in glucose metabolism as gout-related factors [14]. Our metabolomic analysis also suggested that carbohydrate metabolism is enhanced in high-risk gout (Figure 2a,b). This result was consistent with that of the previous study. Several studies found that plasma glucose is positively and negatively related to SUA and urinary urate clearance, respectively, via insulin resistance [33,34,35,36]. Insulin is the hormone that promotes the utilization of glucose and lowers blood glucose levels. Although insulin concentrations were not measured in this study, the levels of glucose, TCA cycle intermediates, and pyruvate and lactate, which are the main products of glycolysis, tended to be higher in patients with gout. In particular, lactate is interpreted as a marker of typical anaerobic glycolysis, and its accumulation usually implies a high energy demand in biological systems; e.g., glycolysis activation accompanied by hypoxia or inflammation increases the accumulation of lactate [37]. In the present study, plasma lactate levels tended to be higher in the gout group, suggesting that the accumulation of lactate reflects the low utilization and/or increased intake of glucose and facilitates the induction of gouty flare via decreased pH. In the gout group, 2-ketoglutarate, isocitrate, and malate tended to accumulate compared to the findings in the asymptomatic hyperuricemia group (Table 4 and Table 5). The accumulation of these TCA cycle intermediates requires the reduction of nicotinamide adenine dinucleotide (NAD+) for subsequent reductions. By contrast, the plasma levels of other TCA cycle intermediates (citrate, succinate, and fumarate) that do not require NAD+ reduction were not significantly different between gout and asymptomatic hyperuricemia groups (Tables S1 and S2). This imbalance also suggests that gout onset is at least partially related to carbohydrate metabolism, including mitochondrial internal respiration. Acute gouty flare is initiated by synovial resident macrophages, which are innate immune cells. The deposition of MSU crystals induces nucleotide-binding domain, leucine-rich-containing family, and pyrin domain-containing 3 (NLRP3) inflammasome formation and mediates localized acute inflammation [38]. In addition to localized inflammation, NLRP3 inflammasome activation leads to a persistent systemic inflammatory response, including cardiovascular dysfunction. In epidemiological studies, high SUA levels were linked to cardiovascular dysfunction [39,40,41]. Indeed, gout flares in the preceding days have been reported to increase the risk of cardiovascular events [42]. Although the association between mitochondria function and NLRP3-associated inflammations, including gout and cardiovascular events, has been reported [43,44,45,46], it remains controversial because NAD+, which reflects mitochondrial internal respirational function, was not measured in this study.
It has been reported that the main pathology of hyperuricemia in patients with gout is decreased urate excretion in the kidneys and intestine [29,47]. The regulation of urate excretion, especially by a cluster of urate transporters in the kidneys, is important in the homeostasis of SUA [48], which has been corroborated by the presence of type I and type II renal hypouricemia caused by SLC22A12 [49,50,51] and SLC2A9 dysfunction [32,52], respectively. In urate reabsorption, SLC22A12, which is expressed at the apical membrane of proximal tubule cells, transports urate inside the cell in conjunction with the outward transport of monocarboxylate (Figure 2d). In addition, SLC5A8 transports monocarboxylate, which is essential as the counterpart in urate reabsorption, from urine into proximal tubule cells [53]. Namely, SLC22A12 and SLC5A8 act cooperatively in urate reabsorption mediated by monocarboxylate. Indeed, it has been reported that excess blood lactate is excreted in exchange for reabsorbed urate [54]. Of note, urinary nicotinate was identified as the metabolite that most prominently differentiated gout from asymptomatic hyperuricemia in this study (Table 4 and Table 5). Although we cannot discuss causality because this was a non-interventional and cross-sectional observation, this result might reflect the association between gout and the accumulation of monocarboxylates, including lactate and nicotinate, the renal excretion of which is coupled to urate reabsorption.
However, some limitations of the present study must be acknowledged, and several problems and issues must be addressed for future full-scale metabolomics studies. First, the results of this study were based on a small sample size, limiting the robustness of the findings. In particular, the sample size must be increased to facilitate the identification of potential biomarkers distinguishing low-risk gout from asymptomatic hyperuricemia. The reason is that the pathophysiology of gout is based on asymptomatic hyperuricemia, and the metabolic features of these conditions are similar. In addition, our results were not adjusted for other effect modifiers, including age. Future full-scale metabolomics studies should be conducted with sufficient sample sizes permitting adjustment for effect modifiers, including age. The second is consideration of the duration of hyperuricemia. Naturally, the cumulative risks of progression to gout increase with the duration of hyperuricemia [3]. Therefore, a more sensitive discriminant analysis might be feasible by comparing individuals who remain asymptomatic despite a long duration of hyperuricemia and patients with gout who experience flares despite a short duration of hyperuricemia. Because this study did not include many such individuals, this is proposed as a future issue. Third, genetic factors other than urate transporters should be investigated. Although we found that carbohydrate metabolism was perturbed in patients with high-risk gout, we did not clarify whether this is attributable to genetic or environmental factors. Our pilot study identified glucose metabolism factors that have been implicated in gout as genetic factors to be investigated in future full-scale studies. Finally, we must acknowledge the limitations of our results regarding confounders and generalization. Six patients with gout received xanthine oxidase inhibitors within 2 weeks of enrollment. Xanthine oxidase inhibitors have been reported to reduce the incidence of cardiovascular events as well as gout flares [55,56,57]. It is undeniable that this external intervention might have confounded the results (e.g., inflammatory biomarker levels) of this study. In addition, the entire discovery dataset in this study consisted of data from only men, which limits the generalizability of the findings. Despite these limitations, this study comprehensively profiled both plasma and urinary metabolism and attempted to differentiate gout and asymptomatic hyperuricemia. In conclusion, our pilot study suggests that glycolysis compounds, TCA cycle intermediates, and urinary nicotinate, which are related to urinary urate excretion, are potential biomarkers distinguishing gout from asymptomatic hyperuricemia.

Supplementary Materials

The following supporting information can be downloaded at: https://www.mdpi.com/article/10.3390/biomedicines12020300/s1. Table S1: Summary of metabolites detected by GC-MS/MS in this study; Table S2: Summary of multivariate and univariate analysis results among asymptomatic hyperuricemia, gout with SUA < 9.0 mg/dL, and gout with SUA ≥ 9.0 mg/dL groups; Table S3: Summary of pathway analysis using potential biomarkers distinguishing overall gout and asymptomatic hyperuricemia groups; Table S4: Summary of pathway analysis using potential biomarkers distinguishing gout with SUA ≥ 9.0 mg/dL and asymptomatic hyperuricemia groups.

Author Contributions

Conceptualization, Y.O., H.O., H.M. (Hideki Makinoshima) and K.I.; methodology, Y.O. and K.I.; formal analysis, Y.O.; investigation, Y.O. and H.M. (Hideki Makinoshima); resources, H.O.; supervision, K.I.; writing, Y.O. and K.I.; supervision/mentoring, T.T., H.M. (Hirotaka Matsuo) and K.I. All authors have read and agreed to the published version of the manuscript.

Funding

This study was supported by grants from the Japan Society for the Promotion of Science, including the Fund for the Promotion of Joint International Research (22KK0152). This study was also supported in part by research funds from the Yamagata Prefectural Government, the City of Tsuruoka. The funders did not have a role in study design, data collection, analysis, reporting, or the decision to submit for publication.

Institutional Review Board Statement

The study was conducted in accordance with the Declaration of Helsinki and approved by the Institutional Review Board (IRB)/Ethics Committee of Tokyo University of Pharmacy and Life Sciences (approval code #19-02) and Jikei University School of Medicine [approval code #31-040 (9539)]. The proxy review for the Ryogoku Higashiguchi Clinic was conducted by the IRB/Ethics Committee of the Jikei University School of Medicine.

Informed Consent Statement

Written informed consent has been obtained from the patients to publish this paper.

Data Availability Statement

The datasets generated or analyzed during the current study are available from the corresponding author upon reasonable request.

Acknowledgments

We express our gratitude to all of the participants involved in this study.

Conflicts of Interest

Kimiyoshi Ichida was employed by the East Japan Railway Company. The remaining authors declare that the research was conducted in the absence of any commercial or financial relationships that could be construed as a potential conflict of interest. East Japan Railway Company and all funders had no role in the design of the study; in the collection, analyses, or interpretation of data; in the writing of the manuscript, or in the decision to publish the results.

References

  1. Dehlin, M.; Jacobsson, L.; Roddy, E. Global epidemiology of gout: Prevalence, incidence, treatment patterns and risk factors. Nat. Rev. Rheumatol. 2020, 16, 380–390. [Google Scholar] [CrossRef] [PubMed]
  2. Taylor, W.J.; Fransen, J.; Jansen, T.L.; Dalbeth, N.; Schumacher, H.R.; Brown, M.; Louthrenoo, W.; Vazquez-Mellado, J.; Eliseev, M.; McCarthy, G.; et al. Study for Updated Gout Classification Criteria: Identification of Features to Classify Gout. Arthritis Care Res. 2015, 67, 1304–1315. [Google Scholar] [CrossRef] [PubMed]
  3. Campion, E.W.; Glynn, R.J.; DeLabry, L.O. Asymptomatic hyperuricemia. Risks and consequences in the Normative Aging Study. Am. J. Med. 1987, 82, 421–426. [Google Scholar] [CrossRef] [PubMed]
  4. Dalbeth, N.; Phipps-Green, A.; Frampton, C.; Neogi, T.; Taylor, W.J.; Merriman, T.R. Relationship between serum urate concentration and clinically evident incident gout: An individual participant data analysis. Ann. Rheum. Dis. 2018, 77, 1048–1052. [Google Scholar] [CrossRef]
  5. Dalbeth, N.; House, M.E.; Aati, O.; Tan, P.; Franklin, C.; Horne, A.; Gamble, G.D.; Stamp, L.K.; Doyle, A.J.; McQueen, F.M. Urate crystal deposition in asymptomatic hyperuricaemia and symptomatic gout: A dual energy CT study. Ann. Rheum. Dis. 2015, 74, 908–911. [Google Scholar] [CrossRef]
  6. Wang, P.; Smith, S.E.; Garg, R.; Lu, F.; Wohlfahrt, A.; Campos, A.; Vanni, K.; Yu, Z.; Solomon, D.H.; Kim, S.C. Identification of monosodium urate crystal deposits in patients with asymptomatic hyperuricemia using dual-energy CT. RMD Open 2018, 4, e000593. [Google Scholar] [CrossRef]
  7. Li, Y.; Ju, L.; Hou, Z.; Deng, H.; Zhang, Z.; Wang, L.; Yang, Z.; Yin, J.; Zhang, Y. Screening, verification, and optimization of biomarkers for early prediction of cardiotoxicity based on metabolomics. J. Proteome Res. 2015, 14, 2437–2445. [Google Scholar] [CrossRef]
  8. Albrecht, E.; Waldenberger, M.; Krumsiek, J.; Evans, A.M.; Jeratsch, U.; Breier, M.; Adamski, J.; Koenig, W.; Zeilinger, S.; Fuchs, C.; et al. Metabolite profiling reveals new insights into the regulation of serum urate in humans. Metabolomics 2014, 10, 141–151. [Google Scholar] [CrossRef]
  9. Li, Q.; Wei, S.; Wu, D.; Wen, C.; Zhou, J. Urinary Metabolomics Study of Patients with Gout Using Gas Chromatography-Mass Spectrometry. BioMed Res. Int. 2018, 2018, 3461572. [Google Scholar] [CrossRef]
  10. Huang, Y.; Xiao, M.; Ou, J.; Lv, Q.; Wei, Q.; Chen, Z.; Wu, J.; Tu, L.; Jiang, Y.; Zhang, X.; et al. Identification of the urine and serum metabolomics signature of gout. Rheumatology 2020, 59, 2960–2969. [Google Scholar] [CrossRef]
  11. Zhang, Y.; Zhang, H.; Chang, D.; Guo, F.; Pan, H.; Yang, Y. Metabolomics approach by 1H NMR spectroscopy of serum reveals progression axes for asymptomatic hyperuricemia and gout. Arthritis Res. Ther. 2018, 20, 111. [Google Scholar] [CrossRef] [PubMed]
  12. Luo, Y.; Wang, L.; Liu, X.Y.; Chen, X.; Song, Y.X.; Li, X.H.; Jiang, C.; Peng, A.; Liu, J.Y. Plasma profiling of amino acids distinguishes acute gout from asymptomatic hyperuricemia. Amino Acids 2018, 50, 1539–1548. [Google Scholar] [CrossRef] [PubMed]
  13. Shen, X.; Wang, C.; Liang, N.; Liu, Z.; Li, X.; Zhu, Z.J.; Merriman, T.R.; Dalbeth, N.; Terkeltaub, R.; Li, C.; et al. Serum Metabolomics Identifies Dysregulated Pathways and Potential Metabolic Biomarkers for Hyperuricemia and Gout. Arthritis Rheumatol. 2021, 73, 1738–1748. [Google Scholar] [CrossRef] [PubMed]
  14. Kottgen, A.; Albrecht, E.; Teumer, A.; Vitart, V.; Krumsiek, J.; Hundertmark, C.; Pistis, G.; Ruggiero, D.; O’Seaghdha, C.M.; Haller, T.; et al. Genome-wide association analyses identify 18 new loci associated with serum urate concentrations. Nat. Genet. 2013, 45, 145–154. [Google Scholar] [CrossRef] [PubMed]
  15. Matsuo, H.; Yamamoto, K.; Nakaoka, H.; Nakayama, A.; Sakiyama, M.; Chiba, T.; Takahashi, A.; Nakamura, T.; Nakashima, H.; Takada, Y.; et al. Genome-wide association study of clinically defined gout identifies multiple risk loci and its association with clinical subtypes. Ann. Rheum. Dis. 2016, 75, 652–659. [Google Scholar] [CrossRef] [PubMed]
  16. Hisatome, I.; Ichida, K.; Mineo, I.; Ohtahara, A.; Ogino, K.; Kuwabara, M.; Ishizaka, N.; Uchida, S.; Kurajoh, M.; Kohagura, K.; et al. Japanese Society of Gout and Uric & Nucleic Acids 2019 Guidelines for Management of Hyperuricemia and Gout 3rd edition. Gout Uric Nucleic Acids 2020, 44, sp-1–sp-40. [Google Scholar] [CrossRef]
  17. Worley, B.; Powers, R. Multivariate Analysis in Metabolomics. Curr. Metabolomics 2013, 1, 92–107. [Google Scholar] [CrossRef] [PubMed]
  18. Benjamini, Y.; Drai, D.; Elmer, G.; Kafkafi, N.; Golani, I. Controlling the false discovery rate in behavior genetics research. Behav. Brain Res. 2001, 125, 279–284. [Google Scholar] [CrossRef]
  19. Dalbeth, N.; Stamp, L. Hyperuricaemia and gout: Time for a new staging system? Ann. Rheum. Dis. 2014, 73, 1598–1600. [Google Scholar] [CrossRef]
  20. Matsuo, H.; Takada, T.; Ichida, K.; Nakamura, T.; Nakayama, A.; Ikebuchi, Y.; Ito, K.; Kusanagi, Y.; Chiba, T.; Tadokoro, S.; et al. Common defects of ABCG2, a high-capacity urate exporter, cause gout: A function-based genetic analysis in a Japanese population. Sci. Transl. Med. 2009, 1, 5ra11. [Google Scholar] [CrossRef]
  21. Choi, H.K.; Atkinson, K.; Karlson, E.W.; Curhan, G. Obesity, weight change, hypertension, diuretic use, and risk of gout in men: The health professionals follow-up study. Arch. Intern. Med. 2005, 165, 742–748. [Google Scholar] [CrossRef] [PubMed]
  22. Choi, H.K.; Atkinson, K.; Karlson, E.W.; Willett, W.; Curhan, G. Alcohol intake and risk of incident gout in men: A prospective study. Lancet 2004, 363, 1277–1281. [Google Scholar] [CrossRef] [PubMed]
  23. Liberopoulos, E.N.; Miltiadous, G.A.; Elisaf, M.S. Alcohol intake, serum uric acid concentrations, and risk of gout. Lancet 2004, 364, 246–247. [Google Scholar] [CrossRef]
  24. Williams, P.T. Effects of diet, physical activity and performance, and body weight on incident gout in ostensibly healthy, vigorously active men. Am. J. Clin. Nutr. 2008, 87, 1480–1487. [Google Scholar] [CrossRef] [PubMed]
  25. Kawamura, Y.; Nakaoka, H.; Nakayama, A.; Okada, Y.; Yamamoto, K.; Higashino, T.; Sakiyama, M.; Shimizu, T.; Ooyama, H.; Ooyama, K.; et al. Genome-wide association study revealed novel loci which aggravate asymptomatic hyperuricaemia into gout. Ann. Rheum. Dis. 2019, 78, 1430–1437. [Google Scholar] [CrossRef]
  26. Park, J.W.; Noh, J.H.; Kim, J.M.; Lee, H.Y.; Kim, K.A.; Park, J.Y. Gene Dose-Dependent and Additive Effects of ABCG2 rs2231142 and SLC2A9 rs3733591 Genetic Polymorphisms on Serum Uric Acid Levels. Metabolites 2022, 12, 1192. [Google Scholar] [CrossRef]
  27. Wan Rohani, W.T.; Mahfudzah, A.; Nazihah, M.Y.; Tan, H.L.; Wan Syamimee, W.G.; Amanda Jane, P.G.; Tony Richard, M. Association of solute carrier family 2, member 9 (SLC2A9) genetic variant rs3733591 with gout in a Malay sample set. Med. J. Malaysia 2018, 73, 307–310. [Google Scholar]
  28. Yang, H.J.; Liu, M.; Kim, M.J.; Park, S. The haplotype of SLC2A9_rs3733591, PKD2_rs2725220 and ABCG2_rs2231142 increases the hyperuricaemia risk and alcohol, chicken and processed meat intakes and smoking interact with its risk. Int. J. Food Sci. Nutr. 2021, 72, 391–401. [Google Scholar] [CrossRef]
  29. Ichida, K.; Matsuo, H.; Takada, T.; Nakayama, A.; Murakami, K.; Shimizu, T.; Yamanashi, Y.; Kasuga, H.; Nakashima, H.; Nakamura, T.; et al. Decreased extra-renal urate excretion is a common cause of hyperuricemia. Nat. Commun. 2012, 3, 764. [Google Scholar] [CrossRef]
  30. Ohashi, Y.; Toyoda, M.; Saito, N.; Koizumi, M.; Kanai, G.; Komaba, H.; Kimura, M.; Wada, T.; Takahashi, H.; Takahashi, Y.; et al. Evaluation of ABCG2-mediated extra-renal urate excretion in hemodialysis patients. Sci. Rep. 2023, 13, 93. [Google Scholar] [CrossRef]
  31. Eckenstaler, R.; Benndorf, R.A. The Role of ABCG2 in the Pathogenesis of Primary Hyperuricemia and Gout-An Update. Int. J. Mol. Sci. 2021, 22, 6678. [Google Scholar] [CrossRef]
  32. Matsuo, H.; Chiba, T.; Nagamori, S.; Nakayama, A.; Domoto, H.; Phetdee, K.; Wiriyasermkul, P.; Kikuchi, Y.; Oda, T.; Nishiyama, J.; et al. Mutations in glucose transporter 9 gene SLC2A9 cause renal hypouricemia. Am. J. Hum. Genet. 2008, 83, 744–751. [Google Scholar] [CrossRef] [PubMed]
  33. Cook, D.G.; Shaper, A.G.; Thelle, D.S.; Whitehead, T.P. Serum uric acid, serum glucose and diabetes: Relationships in a population study. Postgrad Med. J. 1986, 62, 1001–1006. [Google Scholar] [CrossRef]
  34. Han, T.; Lan, L.; Qu, R.; Xu, Q.; Jiang, R.; Na, L.; Sun, C. Temporal relationship between hyperuricemia and insulin resistance and its impact on future risk of hypertension. Hypertension 2017, 70, 703–711. [Google Scholar] [CrossRef] [PubMed]
  35. Bombelli, M.; Quarti-Trevano, F.; Tadic, M.; Facchetti, R.; Cuspidi, C.; Mancia, G.; Grassi, G. Uric acid and risk of new-onset metabolic syndrome, impaired fasting glucose and diabetes mellitus in a general Italian population: Data from the Pressioni Arteriose Monitorate E Loro Associazioni study. J. Hypertens. 2018, 36, 1492–1498. [Google Scholar] [CrossRef]
  36. Facchini, F.; Chen, Y.D.; Hollenbeck, C.B.; Reaven, G.M. Relationship between resistance to insulin-mediated glucose uptake, urinary uric acid clearance, and plasma uric acid concentration. JAMA 1991, 266, 3008–3011. [Google Scholar] [CrossRef] [PubMed]
  37. Rabinowitz, J.D.; Enerback, S. Lactate: The ugly duckling of energy metabolism. Nat. Metab. 2020, 2, 566–571. [Google Scholar] [CrossRef] [PubMed]
  38. Dalbeth, N.; Gosling, A.L.; Gaffo, A.; Abhishek, A. Gout. Lancet 2021, 397, 1843–1855. [Google Scholar] [CrossRef]
  39. Masulli, M.; D’Elia, L.; Angeli, F.; Barbagallo, C.M.; Bilancio, G.; Bombelli, M.; Bruno, B.; Casiglia, E.; Cianci, R.; Cicero, A.F.G.; et al. Serum uric acid levels threshold for mortality in diabetic individuals: The URic acid Right for heArt Health (URRAH) project. Nutr. Metab. Cardiovasc. Dis. 2022, 32, 1245–1252. [Google Scholar] [CrossRef]
  40. Maloberti, A.; Mengozzi, A.; Russo, E.; Cicero, A.F.G.; Angeli, F.; Agabiti Rosei, E.; Barbagallo, C.M.; Bernardino, B.; Bombelli, M.; Cappelli, F.; et al. The Results of the URRAH (Uric Acid Right for Heart Health) Project: A Focus on Hyperuricemia in Relation to Cardiovascular and Kidney Disease and its Role in Metabolic Dysregulation. High Blood Press Cardiovasc. Prev. 2023, 30, 411–425. [Google Scholar] [CrossRef]
  41. Palatini, P.; Virdis, A.; Masi, S.; Mengozzi, A.; Casiglia, E.; Tikhonoff, V.; Cicero, A.F.G.; Ungar, A.; Parati, G.; Rivasi, G.; et al. Hyperuricemia increases the risk of cardiovascular mortality associated with very high HdL-cholesterol level. Nutr. Metab. Cardiovasc. Dis. 2023, 33, 323–330. [Google Scholar] [CrossRef] [PubMed]
  42. Cipolletta, E.; Tata, L.J.; Nakafero, G.; Avery, A.J.; Mamas, M.A.; Abhishek, A. Association between Gout Flare and Subsequent Cardiovascular Events among Patients with Gout. JAMA 2022, 328, 440–450. [Google Scholar] [CrossRef]
  43. Kumar, A.A.; Kelly, D.P.; Chirinos, J.A. Mitochondrial Dysfunction in Heart Failure with Preserved Ejection Fraction. Circulation 2019, 139, 1435–1450. [Google Scholar] [CrossRef] [PubMed]
  44. Ranjbarvaziri, S.; Kooiker, K.B.; Ellenberger, M.; Fajardo, G.; Zhao, M.; Vander Roest, A.S.; Woldeyes, R.A.; Koyano, T.T.; Fong, R.; Ma, N.; et al. Altered Cardiac Energetics and Mitochondrial Dysfunction in Hypertrophic Cardiomyopathy. Circulation 2021, 144, 1714–1731. [Google Scholar] [CrossRef]
  45. Gurung, P.; Lukens, J.R.; Kanneganti, T.D. Mitochondria: Diversity in the regulation of the NLRP3 inflammasome. Trends Mol. Med. 2015, 21, 193–201. [Google Scholar] [CrossRef]
  46. Misawa, T.; Takahama, M.; Kozaki, T.; Lee, H.; Zou, J.; Saitoh, T.; Akira, S. Microtubule-driven spatial arrangement of mitochondria promotes activation of the NLRP3 inflammasome. Nat. Immunol. 2013, 14, 454–460. [Google Scholar] [CrossRef]
  47. Perez-Ruiz, F.; Calabozo, M.; Erauskin, G.G.; Ruibal, A.; Herrero-Beites, A.M. Renal underexcretion of uric acid is present in patients with apparent high urinary uric acid output. Arthritis Rheum. 2002, 47, 610–613. [Google Scholar] [CrossRef] [PubMed]
  48. Mandal, A.K.; Mount, D.B. The molecular physiology of uric acid homeostasis. Annu. Rev. Physiol. 2015, 77, 323–345. [Google Scholar] [CrossRef]
  49. Enomoto, A.; Kimura, H.; Chairoungdua, A.; Shigeta, Y.; Jutabha, P.; Cha, S.H.; Hosoyamada, M.; Takeda, M.; Sekine, T.; Igarashi, T.; et al. Molecular identification of a renal urate anion exchanger that regulates blood urate levels. Nature 2002, 417, 447–452. [Google Scholar] [CrossRef]
  50. Komoda, F.; Sekine, T.; Inatomi, J.; Enomoto, A.; Endou, H.; Ota, T.; Matsuyama, T.; Ogata, T.; Ikeda, M.; Awazu, M.; et al. The W258X mutation in SLC22A12 is the predominant cause of Japanese renal hypouricemia. Pediatr. Nephrol. 2004, 19, 728–733. [Google Scholar] [CrossRef]
  51. Iwai, N.; Mino, Y.; Hosoyamada, M.; Tago, N.; Kokubo, Y.; Endou, H. A high prevalence of renal hypouricemia caused by inactive SLC22A12 in Japanese. Kidney Int. 2004, 66, 935–944. [Google Scholar] [CrossRef] [PubMed]
  52. Yoon, J.; Cachau, R.; David, V.A.; Thompson, M.; Jung, W.; Jee, S.H.; Daar, I.O.; Winkler, C.A.; Cho, S.K. Characterization of a Compound Heterozygous SLC2A9 Mutation That Causes Hypouricemia. Biomedicines 2021, 9, 1172. [Google Scholar] [CrossRef] [PubMed]
  53. Miyauchi, S.; Gopal, E.; Fei, Y.J.; Ganapathy, V. Functional identification of SLC5A8, a tumor suppressor down-regulated in colon cancer, as a Na+-coupled transporter for short-chain fatty acids. J. Biol. Chem. 2004, 279, 13293–13296. [Google Scholar] [CrossRef]
  54. Drabkin, M.; Yogev, Y.; Zeller, L.; Zarivach, R.; Zalk, R.; Halperin, D.; Wormser, O.; Gurevich, E.; Landau, D.; Kadir, R.; et al. Hyperuricemia and gout caused by missense mutation in d-lactate dehydrogenase. J. Clin. Investig. 2019, 129, 5163–5168. [Google Scholar] [CrossRef] [PubMed]
  55. White, W.B.; Saag, K.G.; Becker, M.A.; Borer, J.S.; Gorelick, P.B.; Whelton, A.; Hunt, B.; Castillo, M.; Gunawardhana, L.; Investigators, C. Cardiovascular Safety of Febuxostat or Allopurinol in Patients with Gout. N. Engl. J. Med. 2018, 378, 1200–1210. [Google Scholar] [CrossRef]
  56. Kojima, S.; Matsui, K.; Hiramitsu, S.; Hisatome, I.; Waki, M.; Uchiyama, K.; Yokota, N.; Tokutake, E.; Wakasa, Y.; Jinnouchi, H.; et al. Febuxostat for Cerebral and CaRdiorenovascular Events PrEvEntion StuDy. Eur. Heart J. 2019, 40, 1778–1786. [Google Scholar] [CrossRef]
  57. Cicero, A.F.G.; Fogacci, F.; Kuwabara, M.; Borghi, C. Therapeutic Strategies for the Treatment of Chronic Hyperuricemia: An Evidence-Based Update. Medicina 2021, 57, 58. [Google Scholar] [CrossRef]
Figure 1. (a) The PLS scatter plot differentiates participants with high-risk gout [serum urate levels (SUA) ≥ 9.0 mg/dL] from those with asymptomatic hyperuricemia. Component 1 can explain 77.9% of the variance (gout or asymptomatic hyperuricemia), and component 2 can explain 10.1% of the variance. (b) The volcano plot of plasma and urinary samples from participants with high-risk gout (SUA ≥ 9.0 mg/dL) and asymptomatic hyperuricemia. The vertical and horizontal axes present the variable importance for projection (VIP) and standardized loading value of the metabolites for component 1, respectively. The 30 metabolites with the highest VIP values are plotted in green. (c) The PLS scatter plot differentiates participants with low-risk gout (SUA < 9.0 mg/dL) from those with asymptomatic hyperuricemia. Component 1 can explain 66.4% of the variance, and component 2 can explain 20.0% of the variance. (d) The volcano plot of plasma and urinary samples from participants with low-risk gout (SUA < 9.0 mg/dL) and asymptomatic hyperuricemia. Vertical and horizontal axes denote the VIP and standardized loading value of the metabolites for component 1. The 30 metabolites with the highest VIP values are plotted in green.
Biomedicines 12 00300 g001
Figure 2. Summary of the effects of metabolic pathways using potential biomarkers distinguishing (a) overall gout and (b) gout with SUA ≥ 9.0 mg/dL from asymptomatic hyperuricemia. The x-axis displays the pathways, and the y-axis displays the −log of the adjusted p-value calculated by the hypergeometric test and adjusted by the Benjamini–Hochberg method to control the false discovery rate. Orange dots connected by a thin line represent the impact. Perturbed metabolism in (c) the intracellular TCA cycle and (d) the mechanism of uric acid excretion in the renal tubules. Red, orange, and blue box plots and bar plots denote high-risk gout (SUA ≥ 9.0 mg/dL), low-risk gout (SUA < 9.0 mg/dL), and asymptomatic hyperuricemia groups, respectively. Box plots show the lower and upper quartiles and the median, representing the maximum to minimum range (AU). Bar plots present the variant allele frequencies (%) of rs2231142, rs72552713, and rs3733591. Parts of the figure were drawn by using pictures from Servier Medical Art. Servier Medical Art by Servier is licensed under a Creative Commons Attribution 3.0 Unported License (https://creativecommons.org/licenses/by/3.0/ (accessed on 13 January 2023)). Abbreviation: SUA, serum urate levels.
Biomedicines 12 00300 g002
Table 1. Primary demographic characteristics of participants with gout and asymptomatic hyperuricemia.
Gout (n = 33)p
All (n = 42)AHU (n = 9)All GoutLow-Risk Gout (SUA < 9.0 mg/dL)High-Risk Gout (SUA ≥ 9.0 mg/dL)
n%n%n%n%n%
Demographic data
 Family history of gout 11331.0555.6824.2211.8637.50.056
 Uric acid-lowering treatment 2614.300618.2211.84250.232
 Urolithiasis 614.300618.2423.5212.50.339
 Hypertension 614.300618.2423.5212.50.339
 Hyperlipidemia 438111.139.1211.816.31
Abbreviations: AHU, asymptomatic hyperuricemia; SUA, serum urate levels. 1 Family history of gout is limited to the second degree of consanguinity. 2 Doses (xanthine oxidase inhibitors) taken within 2 weeks were counted. Fisher’s exact test was used to compare the AHU and gout groups.
Table 2. Clinical and biochemical characteristics of participants with gout and asymptomatic hyperuricemia.
GoutKruskal–Wallis
Median (IQR: Q1–Q3)AllAHUAll GoutLow-Risk Gout (SUA < 9.0 mg/dL)High-Risk Gout (SUA ≥ 9.0 mg/dL)p
Basic characteristics
 Age (years)45 (39–55)34 (28–44)50 (40–57)50 (43–58) a47 (39–57) a0.005
 Duration of hyperuricemia (years)7.0 (4.0–10.0)4.0 (3.5–9.0)8.0 (4.7–10.0)7.0 (5.0–10)9.0 (4.1–13.8)0.357
 Body mass index (kg/m2)25.6 (23.6–28.3)26.2 (23.6–29.6)25.6 (23.6–27.6)24.6 (23.2–26.1)26.9 (24.0–30.1)0.117
Clinical characteristics
 SBP (mmHg)124 (120–134)122 (119–134)124 (120–130)122 (120–129)127 (119–140)0.487
 DBP (mmHg)82 (76–87)78 (71–85)82 (77–88)82 (77–86)82 (77–94)0.697
 WBCs (103/μL)66 (57–79)61 (51–69)68 (57–81)63 (55–77)71 (58–88)0.229
 RBCs (10⁶/μL)483 (463–520)522 (517–533)477 (449–490)479 (454–496) a475 (444–523) a<0.001
 Hematocrit (%)45.2 (42.8–47.0)46.1 (45.7–48.4)45 (42.0–46.5)45.0 (42.6–46.7)43.1 (41.5–46.5) a0.034
 PLTs (103/μL)24.7 (22.5–29.8)23.7 (20.8–25.0)27.6 (23.2–31.1)23.8 (22.2–30.1)28.8 (23.3–32.7)0.107
 AST (IU/L)25 (20–32)30 (20–37)25 (20–32)27 (24–25)21 (19–28)0.115
 ALT (IU/L)29 (21–42)40 (21–68)28 (21–39)25 (22–38)29 (21–44)0.371
 γ-GTP (IU/L)53 (29–81)77 (35–186)49 (28–71)57 (27–68)45 (37–76)0.334
 LDL-C (mg/dL)130 (104–159)122 (95–190)130 (108–152)132 (106–145)128 (108–167)0.892
 HDL-C (mg/dL)53 (46–65)49 (42–55)53 (46–67)57 (46–72)53 (46–65)0.184
 TG (mg/dL)147 (88–201)178 (131–257)138 (84–183)102 (81–181)151 (122–200)0.149
 BUN (mg/dL)12.5 (10.1–14.9)13.1 (12.4–14.8)12.3 (9.8–15.1)12.1 (9.6–14.3)12.9 (11.3–15.8)0.271
 HbA1c5.4 (5.2–5.6)5.3 (4.9–5.6)5.4 (5.2–5.7)5.4 (5.2–5.6)5.5 (5.2–5.8)0.207
 Sodium (mEq/L)140 (138–141)140 (138–142)140 (138–141)139 (138–140)141 (138–142)0.239
 Potassium (mEq/L)4.2 (4.0–4.4)4.3 (4.1–4.4)4.2 (4.0–4.5)4.2 (4.0–4.4)4.4 (4.0–4.6)0.495
 Chloride (mEq/L)102 (101–104)101 (100–103)102 (102–105)102 (100–105)103 (102–104)0.144
 eGFR (mL/min/1.73 m2)76.5 (63.8–83.7)78.9 (70.8–97.3)72.8 (63.0–81.0)76.4 (64.7–84.1)71.6 (60.2–78.7)0.143
 SUA (mg/dL)8.8 (8.5–9.5)8.8 (8.6–9.4)8.8 (8.4–9.7)8.4 (8.2–8.6) a9.7 (9.4–10.5) a,b<0.001
 UUA (mg/dL)9 (7–13)9 (8–31)9 (7–13)8 (6–12)10 (8–14)0.367
 UUA/UCr ratio0.42 (0.33–0.50)0.46 (0.39–0.50)0.39 (0.31–0.50)0.41 (0.32–0.50)0.38 (0.31–0.50)0.51
 FEUA (%)4.1 (3.3–4.8)4.4 (3.9–4.8)4.0 (3.2–5.1)4.2 (3.3–5.4)3.6 (2.9–4.8)0.33
Abbreviations: AHU, asymptomatic hyperuricemia; BMI, body mass index; SBP, systolic blood pressure; DBP, diastolic blood pressure; WBCs, white blood cells; RBCs, red blood cells; PLTs, platelets; AST, aspartate aminotransferase; ALT, alanine aminotransferase; γ-GTP, γ-glutamyl transferase; TG, triglyceride (mg/dL to mmol/L, ×0.01129); HDL-C, high-density lipoprotein cholesterol (mg/dL to mmol/L, ×0.02586); LDL-C, low-density lipoprotein cholesterol (mg/dL to mmol/L, ×0.02586); BUN, blood urea nitrogen (mg/dL to mmol/L, ×0.357); SUA, serum urate levels (mg/dL to μmol/L, ×59.48); UUA, urinary urate (mg/dL to μmol/L, ×59.48); UCr, urinary creatinine (mg/dL to μmol/L, ×88.4); eGFR, estimated glomerular filtration (mL/min/1.73 m2; 194 × serum creatinine−1.094 × age−0.287 [× 0.739 if female]); FEUA, fractional excretion of uric acid (%; urate clearance/creatinine clearance). Differences between participants with AHU and participants with gout were compared using the Kruskal–Wallis test. Statistical significance was determined using the Steel test: a p < 0.05 versus the AHU group, b p < 0.05 versus the low-risk gout group.
Table 3. Genetic characteristics of participants with gout and asymptomatic hyperuricemia.
Gout
AHUOverall GoutLow-Risk Gout (SUA < 9.0 mg/dL)High-Risk Gout (SUA ≥ 9.0 mg/dL)
VariantrsIDVAFVAFVAFVAFRef. VAF
ABCG2 SNPs
 Non-synonymous variants
  p.Q126X, c.376C>Trs725527130.0560.01500.0310.009
  p.Q141K, c.421C>Ars22311420.5000.3940.3240.4690.291
SLC2A9 SNPs
 Non-synonymous variants
  p.A17T, c.49G>Ars68202300.2220.0910.1180.0630.074
  p.G25R, c.73G>Ars22769610.3330.4240.4120.4380.451
  p.R294H, c.881G>Ars37335910.6110.6820.7060.6560.686
  p.P350L, c.1049C>Trs22802050.1110.2880.1760.4060.286
 Synonymous variants
  p.L108L, c.322T>Crs1311391810.9700.94110.975
  p.T125T, c375G>Ars109396500.6110.5150.5590.4690.488
  p.I168I, c.504C>Trs37335890.3330.4700.4710.4690.401
  p.L189L, c.567T>Crs1312564611110.977
Abbreviations: SUA, serum urate levels (mg/dL to μmol/L, ×59.48); VAF, variant allele frequency; ABCG2, ATP-binding cassette subfamily G member 2; SLC2A9, solute carrier family 2 member 9. Ref. VAF refers to the East Asian VAF in Allele Frequency Aggregator (ver. 20201027095038).
Table 4. Potential biomarkers distinguishing asymptomatic hyperuricemia from overall gout.
Median (IQR: Q1–Q3)
Metabolites (Arbitrary Units)SampleAll (n = 42)AHU (n = 9)Gout (n = 33)TrendRaw pAdjusted p
Glucose metabolites
 GlucosePlasma7.02 (5.98–8.67)5.88 (4.93–6.75)7.43 (6.35–9.07)0.0060.074
 PyruvatePlasma0.67 (0.57–0.81)0.60 (0.54–0.67)0.70 (0.60–0.91)0.0480.124
 LactatePlasma7.42 (6.38–9.41)6.28 (5.63–7.71)7.86 (6.77–10.00)0.0180.080
 1,5-Anhydroglucitol (×10−2)Plasma0.63 (0–1.00)0.86 (0.67–1.48)0.54 (0–0.95)0.0370.121
 2-Phosphoglycerate (×10−3)Urinary0 (0–0)0 (0–6.60)0 (0–0)-0.1250.180
TCA cycle intermediates
 Aconitate (×10−3)Plasma0 (0–1.70)0 (0–0)0 (0–7.46)-0.0650.127
 Isocitrate (×10−2)Plasma2.18 (1.96–2.73)1.89 (1.62–2.13)2.34 (2.07–2.86)0.0150.092
 2-Ketoglutarate (×10−2)Plasma7.04 (5.53–8.62)5.18 (4.61–5.85)7.33 (6.45–9.01)<0.0010.039
 Malate (×10−3)Plasma5.02 (0–6.70)4.62 (0–5.33)5.51 (0–7.05)-0.3490.372
Lipid metabolites
 Arachidonate (×10−1)Plasma0.72 (0.52–0.86)0.85 (0.73–1.02)0.67 (0.43–0.83)0.0150.082
 Eicosapentaenoate (×10−2)Plasma7.33 (5.33–8.83)9.31 (7.38–9.53)7.18 (4.92–8.55)0.0130.091
 Docosahexaenoate (×10−2)Plasma1.20 (0–1.78)0.55 (0–1.45)1.25 (0.38–1.93)-0.1170.179
 Caproate (×10−1)Plasma1.18 (1.03–1.39)1.30 (1.07–1.41)1.17 (0.95–1.41)-0.3500.365
 Nonanoate (×10−2)Plasma3.63 (2.98–6.88)6.84 (6.27–7.29)3.31 (2.67–5.93)0.0040.065
Amino acid metabolites
 TryptophanPlasma1.22 (0.93–1.74)1.58 (1.19–2.20)1.11 (0.85–1.70)-0.0550.128
 5-OxoprolinePlasma7.17 (5.85–7.84)7.77 (6.71–8.75)6.86 (5.72–7.71)-0.0640.131
 SerinePlasma0.48 (0.19–1.02)0.98 (0.46–1.12)0.42 (0.18–0.87)-0.0830.151
 Cysteine (×10−2)Plasma3.12 (2.46–4.51)2.58 (1.62–3.01)3.22 (2.59–5.06)-0.0550.123
 LysinePlasma0.57 (0.36–0.86)0.59 (0.51–0.97)0.55 (0.35–0.81)-0.3190.364
 TyraminePlasma1.20 (0.71–1.67)1.27 (0.97–1.91)1.15 (0.68–1.63)-0.3660.374
 Aspartate (×10−2)Urinary4.35 (2.59–7.91)6.32 (4.82–9.39)3.85 (2.47–7.50)-0.1220.181
 Tyramine (×10−1)Urinary2.36 (1.69–3.80)3.74 (1.94–7.25)2.34 (1.63–3.61)-0.1450.197
 4-Aminobutyrate (×10−2)Urinary4.24 (0–7.43)7.35 (3.82–9.97)3.63 (0–6.28)-0.0510.125
 5-Aminolevulinate (×10−2)Urinary1.33 (0.87–1.82)1.72 (1.14–2.39)1.10 (0.42–1.62)-0.1060.173
 3-Aminoglutarate (×10−2)Urinary4.97 (3.03–8.78)7.64 (5.35–10.38)4.31 (2.84–8.18)-0.0950.161
 Hypotaurine (×10−2)Urinary0 (0–5.66)0 (0–0.68)1.94 (0–6.37)0.0430.132
Purine and pyrimidine metabolites
 Adenosine (×10−1)Urinary0.91 (0.67–1.51)1.31 (0.78–2.39)0.90 (0.61–1.28)-0.1080.171
 Guanine (×10−2)Urinary6.55 (3.14–9.89)7.87 (4.98–11.56)6.05 (2.38–7.93)-0.1290.181
 Uracil (×10−2)Urinary0.17 (0–0.85)0.59 (0–1.71)0 (0–0.78)-0.2320.291
Saccharides
 Mannose (×10−1)Plasma0.59 (0.32–0.89)0.43 (0.20–0.69)0.64 (0.34–0.91)-0.1730.229
 Psicose (×10−2)Plasma1.90 (1.27–4.20)3.16 (1.79–5.00)1.84 (0.93–3.37)-0.0780.147
 Sorbose (×10−2)Plasma1.14 (0–2.18)2.14 (0.61–4.31)0.98 (0–1.89)0.0430.124
 Sucrose (×10−2)Plasma0 (0–1.24)1.69 (0–6.92)0 (0–0.79)0.0290.109
 SucroseUrinary0.18 (0.10–0.38)1.08 (0.04–1.20)0.18 (0.11–0.33)-0.2500.306
 Tagatose (×10−1)Urinary0.38 (0.18–1.19)0.93 (0.10–1.37)0.36 (0.18–0.89)-0.3340.372
 Xylose (×10−1)Urinary1.17 (0.55–1.79)1.20 (0.36–1.65)1.16 (0.59–1.94)-0.5100.510
Sugar alcohols
 MannitolPlasma1.04 (0.87–1.26)0.94 (0.78–1.03)1.10 (0.91–1.35)0.0330.116
 Sorbitol (×10−1)Plasma1.31 (0.94–1.97)1.95 (0.81–2.40)1.26 (0.95–1.90)-0.3050.356
 Galactitol (×10−1)Urinary1.49 (0.79–2.44)1.64 (1.15–4.71)1.40 (0.78–2.37)-0.2140.276
Urinary monocarboxylates
 LactateUrinary0.86 (0.64–1.15)0.69 (0.55–0.91)0.97 (0.68–1.17)0.0450.123
 Nicotinate (×10−2)Urinary3.42 (1.20–7.61)0.99 (0.35–1.37)5.42 (1.97–8.78)0.0010.025
Others
 3-Hydroxypropionate (×10−2)Plasma7.08 (6.32–8.13)6.45 (5.63–8.04)7.38 (6.42–8.13)-0.3340.364
 PhosphoratePlasma20.8 (19.0–24.3)23.9 (20.6–27.6)20.2 (18.2–22.5)0.0240.098
 Pyrogallol (×10−3)Plasma0 (0–0)0 (0–5.30)0 (0–0)0.0060.059
 3-Methoxy-4-hydroxybenzoate (×10−2)Urinary1.06 (0–1.80)0.77 (0–1.08)1.29 (0–1.95)-0.0940.165
 CreatinineUrinary0.65 (0.41–1.03)1.02 (0.53–2.00)0.60 (0.40–0.91)-0.0550.117
 HydroxylamineUrinary0.84 (0.65–1.00)0.67 (0.50–0.79)0.90 (0.70–1.05)0.0070.057
 Malonate (×10−2)Urinary1.63 (1.04–2.29)1.27 (1.01–2.03)1.68 (1.12–2.67)-0.2630.314
 Paraxanthine (×10−2)Urinary3.78 (1.52–8.06)1.53 (0.33–3.38)4.67 (2.68–8.45)0.0160.078
Abbreviations: IQR, interquartile range; AHU, asymptomatic hyperuricemia. Raw p-values between the asymptomatic hyperuricemia and gout groups were calculated using the Mann–Whitney U test (without Benjamini–Hochberg adjustment). Adjusted p-values were calculated using the Benjamini–Hochberg method.
Table 5. Potential biomarkers distinguishing asymptomatic hyperuricemia from high-risk gout (SUA ≥ 9.0 mg/dL).
Overall GoutLow-Risk Gout
(SUA < 9.0 mg/dL)
High-Risk Gout
(SUA ≥ 9.0 mg/dL)
SampleFold DifferenceAdjusted pFold DifferenceAdjusted pFold DifferenceAdjusted p
Glucose metabolites
 GlucosePlasma1.2640.0741.3460.3871.1990.129
 PyruvatePlasma1.1670.1241.1130.5961.3270.116
 LactatePlasma1.2520.0801.2500.3891.2910.137
 1,5-AnhydroglucitolPlasma0.6280.1210.6980.4700.6160.170
 2-PhosphoglycerateUrinary0.1800.4450.526
TCA cycle intermediates
 AconitatePlasma0.1270.4970.128
 IsocitratePlasma1.2380.0921.1530.4771.3690.111
 2-KetoglutaratePlasma1.4150.0391.2770.3361.5660.016
 MalatePlasma1.1930.3721.1980.9101.3980.149
Lipid metabolites
 ArachidonatePlasma0.7880.0820.8970.4430.6560.065
 EicosapentaenoatePlasma0.7710.0910.8070.4280.6120.065
 DocosahexaenoatePlasma2.2730.1792.8180.4691.9270.552
 CaproatePlasma0.9000.3650.9850.9620.8380.164
 NonanoatePlasma0.4840.0650.6750.3940.4320.031
Amino acid metabolites
 TryptophanPlasma0.7030.1280.7970.4430.6960.185
 5-OxoprolinePlasma0.8830.1310.8830.4110.8830.230
 SerinePlasma0.4290.1510.4340.4080.4210.327
 CysteinePlasma1.2480.1230.2230.4500.2800.539
 LysinePlasma0.9320.3640.8980.4781.0850.975
 TyraminePlasma0.9060.3740.8660.5001.0160.983
 AspartateUrinary0.6090.1810.9450.8630.4830.129
 TyramineUrinary0.6260.1970.7910.7960.4950.180
 4-AminobutyrateUrinary0.4940.1250.5810.4850.2450.130
 5-AminolevulinateUrinary0.6400.1730.8040.7980.50.143
 3-AminoglutarateUrinary0.5640.1610.7070.8150.4360.135
 HypotaurineUrinary0.1320.4630.169
Purine and pyrimidine metabolites
 AdenosineUrinary0.6870.1710.7630.7150.5420.172
 GuanineUrinary0.7690.1810.8480.7890.5550.171
 UracilUrinary0.2910.9830.8910.243
Saccharides
 MannosePlasma1.4880.2291.4300.4791.2800.490
 PsicosePlasma0.5820.1470.6610.5260.5440.178
 SorbosePlasma0.4580.1240.6210.5280.2440.123
 SucrosePlasma-0.109-0.359-0.288
 SucroseUrinary0.1670.3060.9440.5831.0560.593
 TagatoseUrinary0.3870.3720.3980.8010.2900.534
 XyloseUrinary0.9670.5101.2080.4620.6670.988
Sugar alcohols
 MannitolPlasma1.1700.1161.2130.3531.0740.336
 SorbitolPlasma0.6460.3560.9130.9620.5790.281
 GalactitolUrinary0.8540.2760.8720.6860.6890.422
Urinary monocarboxylates
 LactateUrinary1.4060.1231.3330.4351.4490.173
 NicotinateUrinary5.4750.0253.6160.3806.5150.020
Others
 3-HydroxypropionatePlasma1.1440.3641.2200.4261.0510.999
 PhosphoratePlasma0.8450.0980.8510.4320.8310.146
 PyrogallolPlasma0.0590.4560.186
 3-Methoxy-4-hydroxybenzoateUrinary1.6750.1652.0390.3431.2210.741
 CreatinineUrinary0.5880.1170.6270.4290.5590.211
 HydroxylamineUrinary1.3430.0571.3220.4121.3710.067
 MalonateUrinary1.3230.3141.7240.3801.0240.984
 ParaxanthineUrinary3.0520.0783.0520.8822.9610.237
Abbreviations: SUA, serum urate levels. Fold differences were determined by comparing medians between the groups. p-values were calculated using Steel’s test with adjustment using the Benjamini–Hochberg method to control the false discovery rate. Fold differences with a median of 0 (below the detection limit by GC-MS/MS) in any of the groups are denoted by “–”.
Disclaimer/Publisher’s Note: The statements, opinions and data contained in all publications are solely those of the individual author(s) and contributor(s) and not of MDPI and/or the editor(s). MDPI and/or the editor(s) disclaim responsibility for any injury to people or property resulting from any ideas, methods, instructions or products referred to in the content.

