Article

Role of Calcium in an Experimental Breast Cancer Model Induced by Radiation and Estrogen

Instituto de Alta Investigación, Universidad de Tarapacá, Arica 1000000, Chile
*
Author to whom correspondence should be addressed.
Biomedicines 2024, 12(11), 2432; https://doi.org/10.3390/biomedicines12112432
Submission received: 27 September 2024 / Revised: 11 October 2024 / Accepted: 18 October 2024 / Published: 23 October 2024
(This article belongs to the Section Cancer Biology and Oncology)

Abstract

:
Background: Breast cancer, a global health challenge, significantly impacts women worldwide, causing morbidity, disability, and mortality. Objectives: To analyze the role of genes encoding S100 calcium-binding proteins and their relationship with radiation as possible markers in breast carcinogenesis. Methods: The normal MCF-10F cell line was used to study the role of ionizing radiation and estrogen to induce distinct stages of malignancy giving rise to an in vitro experimental breast cancer model. Results: Analysis of an Affymetrix system revealed that the gene expression levels of the S100 calcium-binding protein P (S100P), the S100 calcium-binding protein A14 (S100A14), and the S100 calcium-binding protein A2 (S100A2) were greater in the Tumor2 than the non-tumorigenic Alpha3 or the tumorigenic Alpha5 cell lines; however, the S100 calcium-binding protein A8 (S100A8) and the S100 calcium-binding protein A9 (S100A9) expression levels were higher in A5 than T2 and A3 cell lines. A significant positive association was found between the estrogen receptor alpha gene (ESR1) and S100A14 in Basal and Her2 patients. The association between ESR1 and S100A8 and S100A9 expression levels was positive in Basal patients but negative in Her2, Luminal A, and Luminal B. S100P and S100A14 expression levels were higher in tumor tissues than in normal ones. The estrogen receptor status was positive in patients with high levels of the S10014 gene, but negative in S100A2, S100A8, and S100A9 expression levels. Conclusion: Cell dependence needs to be considered while designing new breast cancer treatments since gene signatures might vary depending on the type of tumor.

1. Introduction

Breast cancer remains a significant global health challenge, exerting substantial morbidity, disability, and mortality among women worldwide [1]. The staggering statistics of approximately 2.3 million new cases and 685,000 deaths in 2020 underscore the urgency for comprehensive research into its molecular underpinnings [2,3]. At early stages, breast cancer or just spread to the axillary lymph nodes is still curable [4]. However, with advancements in endocrine therapy, treatment in the late stages when the cancer has spread to distant locations is still a challenge.
The S100 genes play an important role in tumorigenesis by regulating cell proliferation, invasion, metastasis, cell survival, or cell death; it includes at least 13 members located as a cluster on chromosome 1q21 [5]. The S100 family is a group of proteins widely studied due to its ability to modulate cellular processes in response to changes in calcium concentrations. Such interactions modulate calcium-binding protein expression and play a role in cancer among others [6]. Among them, the S100 calcium-binding proteins (S100) belong to a broad family of cytosolic proteins that bind to calcium and are associated with tumor progression and inflammation [7]. Calcium molecules are important ions that regulate multiple cellular functions from intracellular proliferation to muscle contraction. Calcium-binding proteins (CBPs) play a crucial role in mediating the effects of calcium, enabling its transport across cell membranes and decoding signals that are vital for cellular homeostasis. Within this group of proteins, the S100 family has been widely studied due to its ability to modulate cellular processes in response to changes in calcium concentrations. Several genes encode the S100 protein family, affecting crucial cellular processes and cancer progression, the S100 protein family plays an important role in carcinogenesis. The S100 proteins interact with multiple targets during several physiological activities, such as Ca2+ homeostasis, proliferation, differentiation, apoptosis, inflammation, and cell migration [8,9]; thus, almost all cellular functions rely on Ca2+, and high Ca2+ concentrations can cause cell death.
Authors [10] have outlined the connection between S100 genes and calcium relative to their diseases, hypothesizing that Ca2+ is important as it regulates various biological activities. Ca2+-binding sites regulate their function in a Ca2+-dependent manner, or specialized Ca2+ sensing proteins. Such proteins may regulate effector protein activity by Ca2+-dependent association or through post-translation modifications. Both modifications are displayed by enzymes that are regulated in a Ca2+-dependent manner either because they have a Ca2+-binding motif or are associated with Ca2+-binding proteins. Also, these authors found the relationship between the genes that encoded the S100 and calcium itself and their pathologies. The S100 proteins are localized in the cytoplasm and nucleus of a wide range of cells and regulate several cellular processes such as cell cycle progression and differentiation [11].
It has been reported that normal human breast epithelial cells have a limited ability to divide in culture conditions, and such cultured cells are considered mortal and undergo a progressive cessation of in vitro growth, becoming senescent, and then dying [12,13,14,15,16]. The spontaneously immortalized human breast epithelial cell line MCF-10F was isolated and characterized by ultrastructural and immunocytochemical analysis [13,17]. The mortal parental cells and the cultures of primary human breast epithelial cells expressed low levels of S100P, regardless of the calcium concentration in the medium. That is, the S100P gene has been reported to be overexpressed in immortal cells compared to mortal ones [18]. Then, the immortalization of S130 to MCF-10F cells was associated with the acquisition of independence from calcium concentration in the medium, the chromosomal translocation [13,17], mutation of p53 [19], and stabilization of telomere length [20], among others.
The EF-hand domains are the most prevalent Ca2+-binding motifs in proteins. This family of proteins performs several tasks, including signal transduction between compartments, nucleus-based gene expression, and cytoplasmic Ca2+ buffering. The Ca2+-binding motif, known as the EF-hand is composed of a Ca2+-coordinated loop surrounded by two nearly perpendicular α-helices [21]. Ca2+ binds to EF-hand domains with varying affinities, which explains several biological roles; these proteins perform in a wide range of [Ca2+] [22]. High affinity Ca2+-binding proteins function as Ca2+-buffer proteins, adjusting the duration and form of Ca2+ signals to support the preservation of Ca2+ homeostasis.
Multiple Ca2+-sensing elements decode the calcium signal, which is necessary for the selective control of particular targets. Specialized motifs on proteins with prior biochemical characterizations allow the detection of Ca2+. Human mutations and illnesses associated with several Ca2+-sensing proteins have been related to the Ca2+-sensing mechanisms, found inside and outside organelles [23]. The S100 proteins form a growing subfamily of proteins related by Ca2+-binding motifs to the EF-hand Ca2+-binding protein superfamily [24].
The S100A family members regulate multiple biological functions related to cancer progression and metastasis; however, the prognostic of such a family has not been systematically investigated in cancer [25]. Authors have found that the S100 gene family, which comprises over 20 members, including S100A1, S100A2, S100A8, and S100A9 encoded low molecular weight calcium-binding proteins with important physiological and pathological roles in keratinization [26]; however, there has also been evidence of a correlation between breast cancer and S100A2, S100A4, S100A6, S100A7, S100A8, S100A9, and S100A11 [27].
One of the members of the S100 family of proteins, containing 2 EF-hand calcium-binding motifs [28], is the S100 calcium-binding protein P gene (S100P). On the other hand, the S100 calcium-binding protein A14 gene (S100A14), which encodes a member of the S100 protein family, contains an EF-hand motif that binds calcium and is in a cluster of the S100 genes on chromosome 1. The S100A14 has been shown to regulate cell cycle progression, cell proliferation, migration, and invasion, playing an important role in metastasis in cervical cancer [29].
Another member of the S100 family of proteins containing 2 EF-hand calcium-binding motifs is the S100 calcium-binging protein A2 gene (S100A2) [30], which seems to have a tumor suppressor function, and its chromosomal rearrangements and altered expression are implicated in breast cancer [30]. Other members of the S100 family of proteins containing 2 EF-hand calcium-binding motifs [7] are the S100 calcium-binding proteins A8 and A9 genes (S100A8 and S100A9, respectively) which function as inhibitors of casein kinase [7,31].
The genes S100P, S100A14, S100A2, S100A8, and S100A9 were analyzed in the MCF-10F (Ct), estrogen (E), Alpha3 (A3), Alpha5 (A5), and Tumor2 (T2) cell lines. Such cell lines come from an ionizing radiation and estrogen experimental breast cancer model established in 2000 by Calaf and Hei [32]. The model was used to determine whether radiation in the presence of estrogen induced neoplastic transformation by using a normal immortalized human breast cell line as the MCF-10F. Such a cell line was exposed to low doses of high LET alpha particles (150 keV/micron) since radiation, as an environmental carcinogen, has been considered a major etiological factor [33]. Thus, this study aimed to examine the genes mentioned above, which encode the S100 calcium-binding proteins, and their relationship with radiation to determine their potential relevance as markers in breast cancer progression.

2. Materials and Methods

2.1. Cell Lines

The immortalized human breast epithelial cell line MCF-10F (ATCC) was developed by Calaf and Hei in 2000 [32]. Such a cell line was exposed to low levels of high-linear-energy-transfer (LET) α particle radiation (150 keV/m and then, it was kept in culture for up to 10 months, in the presence of 17β-estradiol. After exposure, the MCF-10F cell line underwent several transformation stages, resulting in the various cell lines used in this study. These include (i) the MCF-10F (Control); (ii) the estrogen (E), MCF-10F consistently exposed to 10−8 mol/L 17β-estradiol; (iii) the non-tumorigenic but transformed Alpha3 (A3), MCF-10F subjected to two 60/60 cGy doses; (iv) the malignant and tumorigenic Alpha5 (A5), MCF-10F treated with two 60/60 cGy α particles in the presence of 17β-estradiol; and (v) the Tumor2 (T2) cell lines, a tumorigenic cell line derived from an A5 xenograft injected into nude mice [32]. A summary of these cell lines is provided in Figure 1. The cell lines were cultured with DMEM/F-12 (1:1) media that was enriched with the following antibiotics: 2.5 g/mL amphotericin B, 100 g/mL streptomycin, and 100 U/mL penicillin (all sourced from Life Technologies, Grand Island, NY, USA). Additionally, 0.02 g/mL of epidermal growth factor (from Collaborative Research, Bedford, MA, USA), 0.5 g/mL of hydrocortisone (from Sigma, St. Louis, MO, USA), and 10 g/mL and 5% horse serum (from Biofluids, Rockville, MD, USA) were used [13,32,34,35,36].

2.2. Irradiation

MCF-10F cells, which were undergoing rapid expansion, were plated in stainless steel rings of 60 mm diameter, each having a mylar bottom of 6 µm at the Radiological Research Facilities of Columbia University (also known as the Nevis Center). This was done three days before radiation and at a rate of 3 × 10⁵ cells per ring. The cells were subjected to gradient doses of 4He ions, with an energy of 150 KeV/µm, these ions were sped up to 4 MeV using the van de Graaff accelerator. Calaf and Hei carried out this procedure in 2000 [37]. Then the MCF-10F cells were exposed to one or two doses of 4He ions, each dose being 30, 60, or 100 cGy, and there was a gap of 12- to 14 weeks between the treatments. The irradiated cultures were promptly subcultured to assess the growth kinetics and to continue observing them for any changes in phenotype. Samples were frozen in anticipation of future use. The surviving cells were then passaged for more radiation therapy and samples were taken to look for various phenotypes that had changed. Cells were then cultured with or without estrogen after that.

2.3. Preparation of Fluorescence-Labeled Probes for the Analysis of Cell Lines

The Poly(A) mRNA was extracted from normal, radiation-exposed, and estrogen-exposed breast cell lines using the QIA-Direct-mRNA Isolation kit from Qiagen, based in Valencia, CA, USA. A fluorescently-tagged cDNA was synthesized from one microgram of these poly(A)mRNAs using oligo dT-initiated polymerization and the Superscript II reverse transcriptase kit from Life Technologies, located in Grand Island, NY, USA. This process was carried out in the presence of either Cy3- or Cy5-tagged dCTP, following the standard protocol as described earlier [38]. The Cy3 and Cy5-tagged probes were then combined, attached to the microarray on glass coverslips, and incubated for 16 h at a temperature of 65 °C. They were then rinsed and readied for scrutiny.

2.4. Examining Microarray Gene Expression with the Affymetrix HG-U133A Plus 2.0 GeneChip

The cell lines from this experimental model were developed by Calaf and Hei in 2000 [32]. Then in 2013, such cell lines, including the MCF-10F, the Estrogen, the Alpha3, the Alpha5, and the Tumor2 were subjected to a gene expression analysis using the Affymetrix U133A oligonucleotide microarray (Affymetrix, Santa Clara, CA, USA), which boasts a remarkable 14,500 genes. The arrays for gene expression were analyzed [38] with the Affymetrix GeneChip Operating Software (GCOS) v1.0 ST, the Genes@Work software (v 1.0) interface, and the SPLASH (structural pattern localization analysis by sequential histograms) discovery algorithm, all while maintaining a false discovery rate of 0.05 [39].

2.5. Bioinformatic and Statistical Analysis

A web-based program called Tumor Immune Estimation Resource v2.0 (TIMER2.0) (http://timer.cistrome.org/), accessed on 6 July 2024, reference number [40], was used to systematically examine immune infiltrates across different forms of cancer. Its three main components are the Immune Association, Cancer Exploration, and Immune Estimation. The Gene_Corr, Gen_DE, and Gene_Outcome modules are included in the Cancer Exploration section. A list of genes associated with various subtypes of breast cancer and a target gene were correlated, according to the Gene_Cor module. The statistical analysis of such correlations was carried out using Spearman’s test. This module created a heatmap chart that showed the links between the target gene and the group of genes being examined, and extensive information about any connection in the chart can be easily visualized by selecting the relevant entry. When the ‘purity adjusted’ option is chosen, selecting the figures in the chart will produce two scatter diagrams indicating (i) the correlation of the specified gene expression with tumor purity (the proportion of cancer cells in a sample) and (ii) the correlation of the gene expression with the other selected genes.
The Gene_DE module exhibited the variances in gene expression between healthy tissue and cancerous growths. This module utilized box plots to demonstrate the spread of gene expression levels, with the Wilcoxon test being used to determine the statistical significance. The results were denoted with a series of stars (* p < 0.05, ** p < 0.01, *** p < 0.001). The Gene_Outcome module evaluated the outcome pertinence of gene expression that was altered by the stage clinical factor, leveraging the Cox proportional hazard model. The ER status of the genes that were part of this study was provided by the University of California, Santa Cruz through the UCSC Xena Functional Genomics Explorer (http://xena.ucsc.edu/), reference number [41]. The one-way ANOVA test was used to calculate the statistical significance. p < 0.05 was considered statistically significant.

3. Results

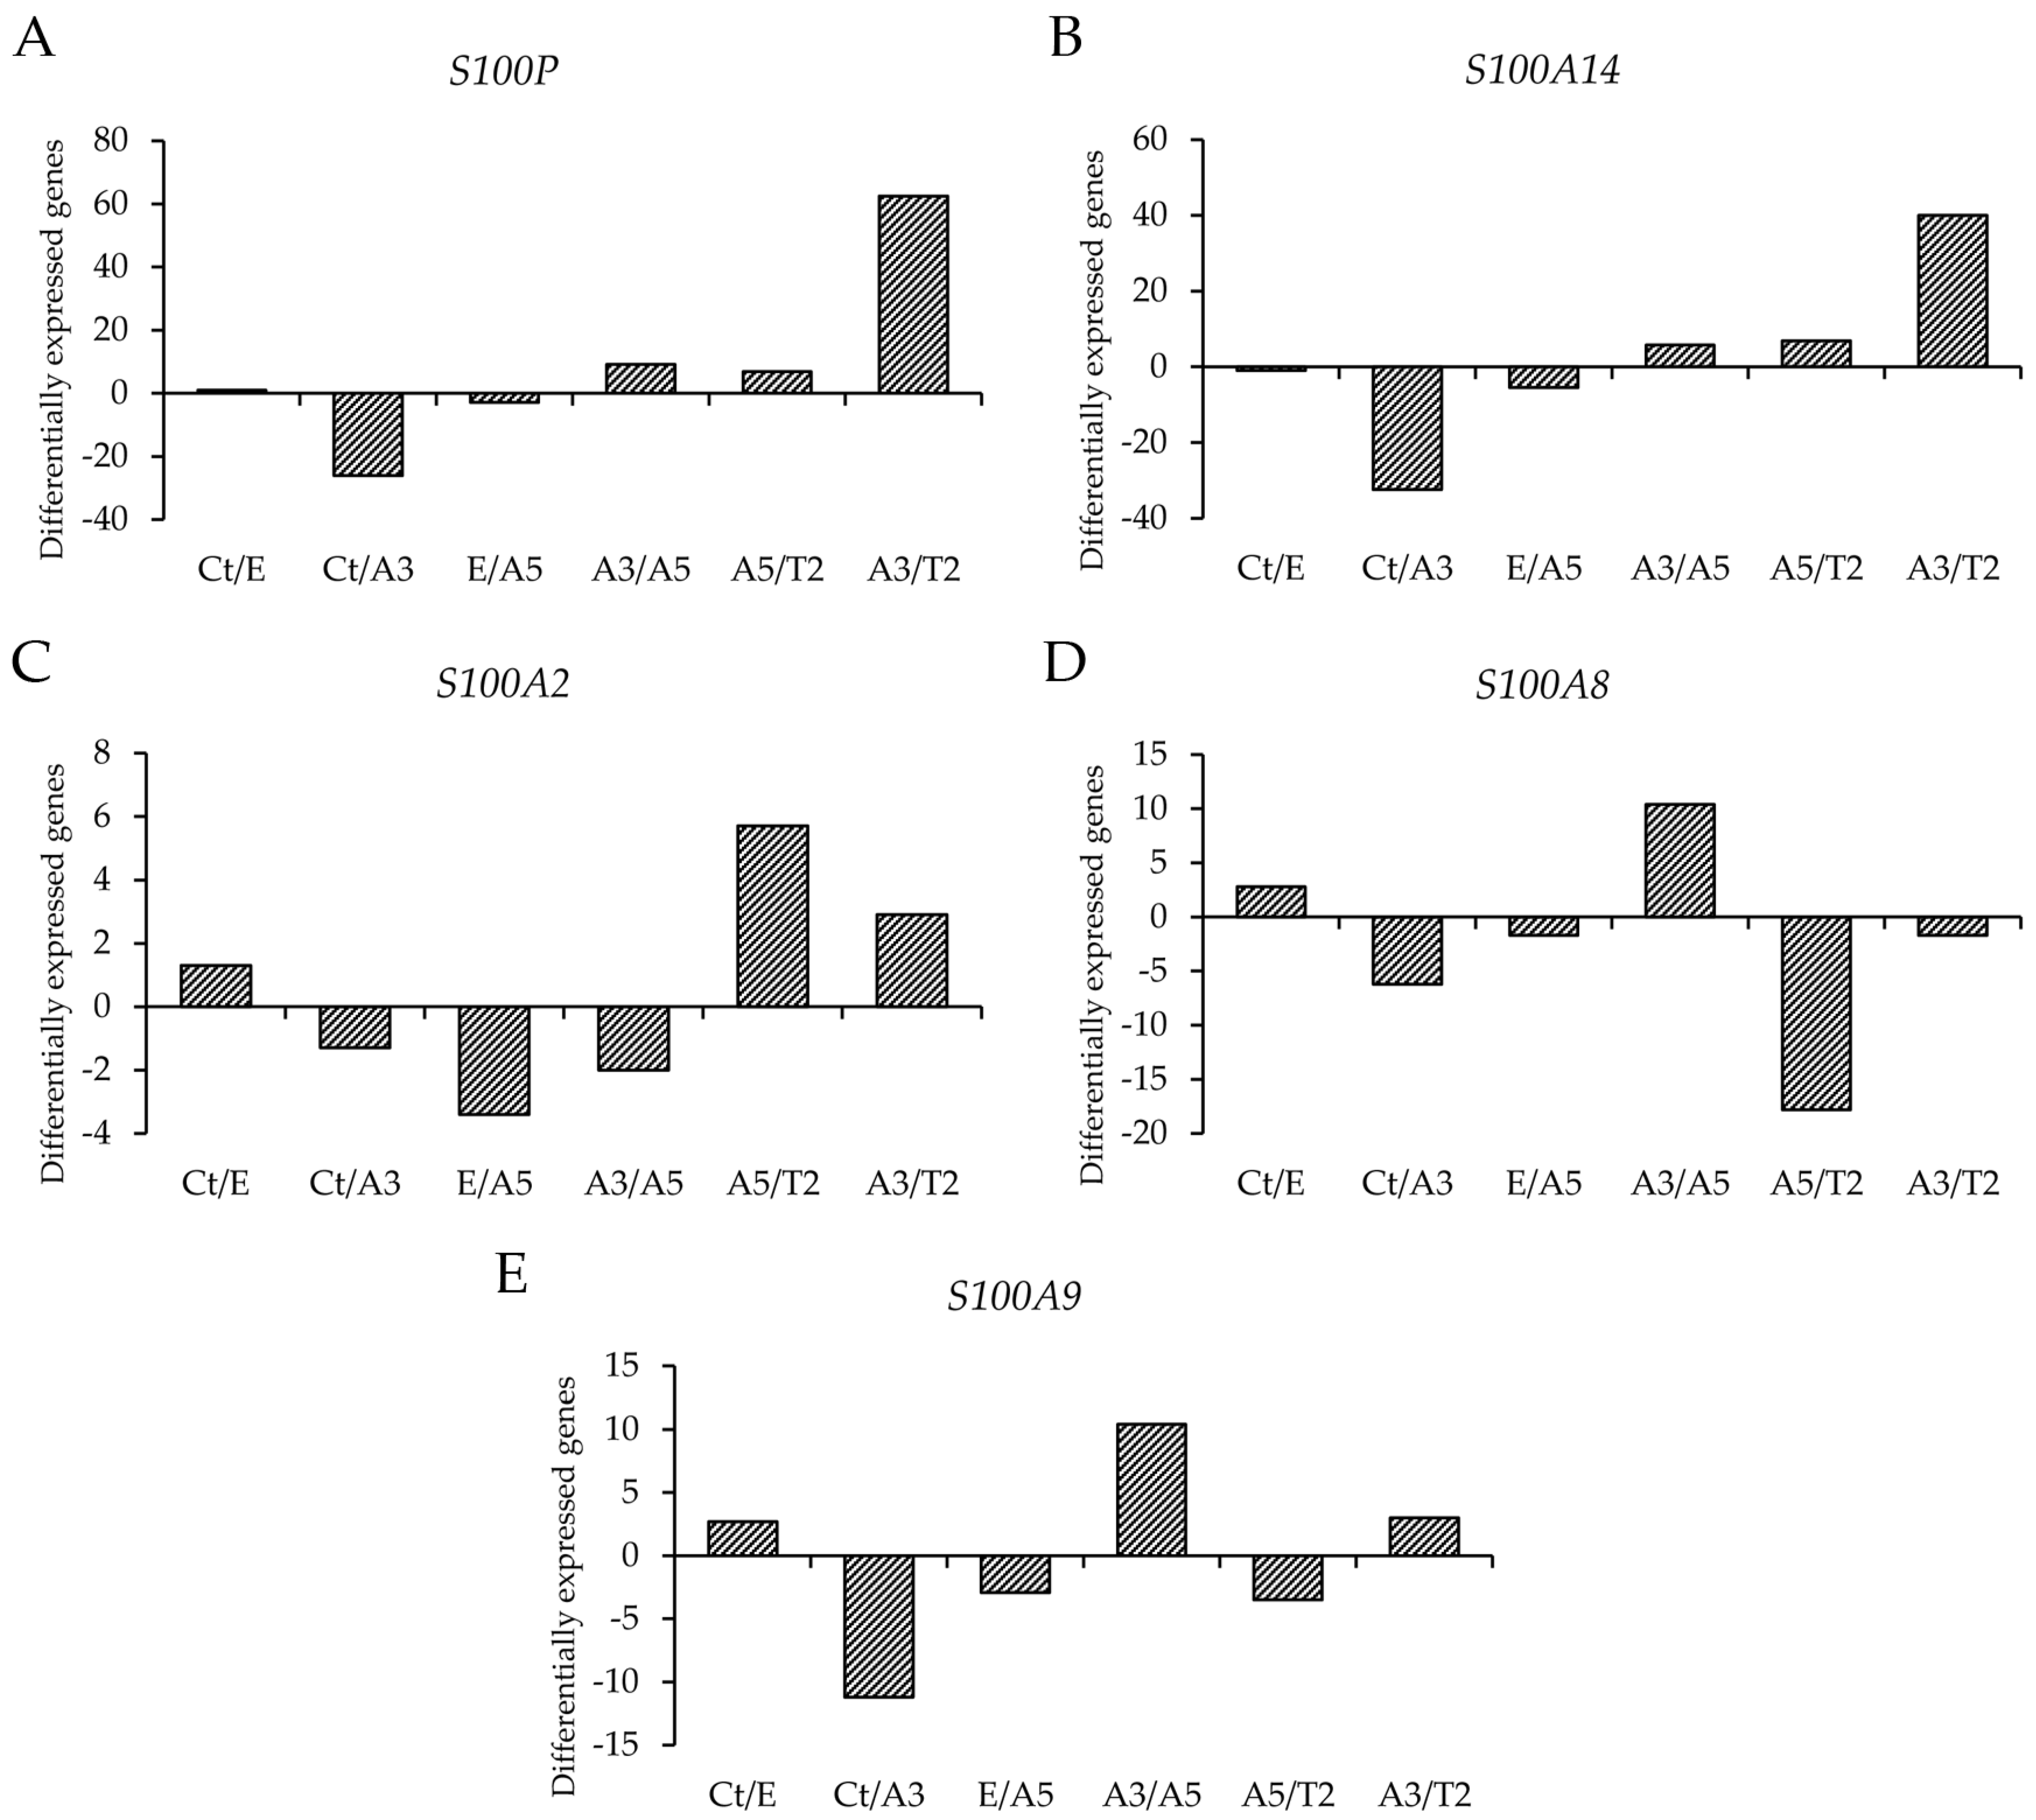
3.1. Differential Gene Expression of Genes That Code for the S100 Calcium-Binding Proteins

In this study, the cell lines utilized were derived from the experimental model induced by radiation and estrogen, a model established by Calaf and Hei in 2000 [32]. In the year 2013, a pairwise comparative study of various cell lines [38] was conducted using the Affymetrix HG U-133A oligonucleotide microarray. The cell line pairs under study were MCF-10F/estrogen (Ct/E); MCF-10F/Alpha3 (Ct/A3); estrogen/Alpha5 (E/A5); Alpha3/Alpha5 (A3/A5); Alpha5/Tumor2 (A5/T2), and Alpha3/Tumor2 (A3/T2) as seen in Figure 2. These pairs were chosen based on the following criteria: (i) The pair MCF-10F/E was used to analyze the estrogen effect; (ii) MCF-10F/Alpha3, to analyze radiation alone; (iii) E/Alpha5, to assess the radiation effect when combined with estrogen; (iv) Alpha3/Alpha5, to analyze radiation plus estrogen combined versus radiation alone; (v) Alpha 3/Tumor2, to evaluate the impact of radiation alone and the microenvironment; and (vi) to assess the relationship between estrogen and ionizing-radiation combined and the environment in the athymic animal, Alpha5/Tumor2.
The analysis of Figure 2 shows the differential expression of the genes under investigation, which revealed that the T2 cell line expressed higher expression of the S100P gene than the A3 cell line. The T2 and Ct had higher S100A14 expression than the A3. The S100A2 expression was also higher in the T2 cell line in comparison with A3 and A5. On the other hand, the A5 cell line showed high levels of S100A8 expression compared to T2 and A3; and A5 and Ct showed higher levels of S100A9 expression levels than the A3 cell line.

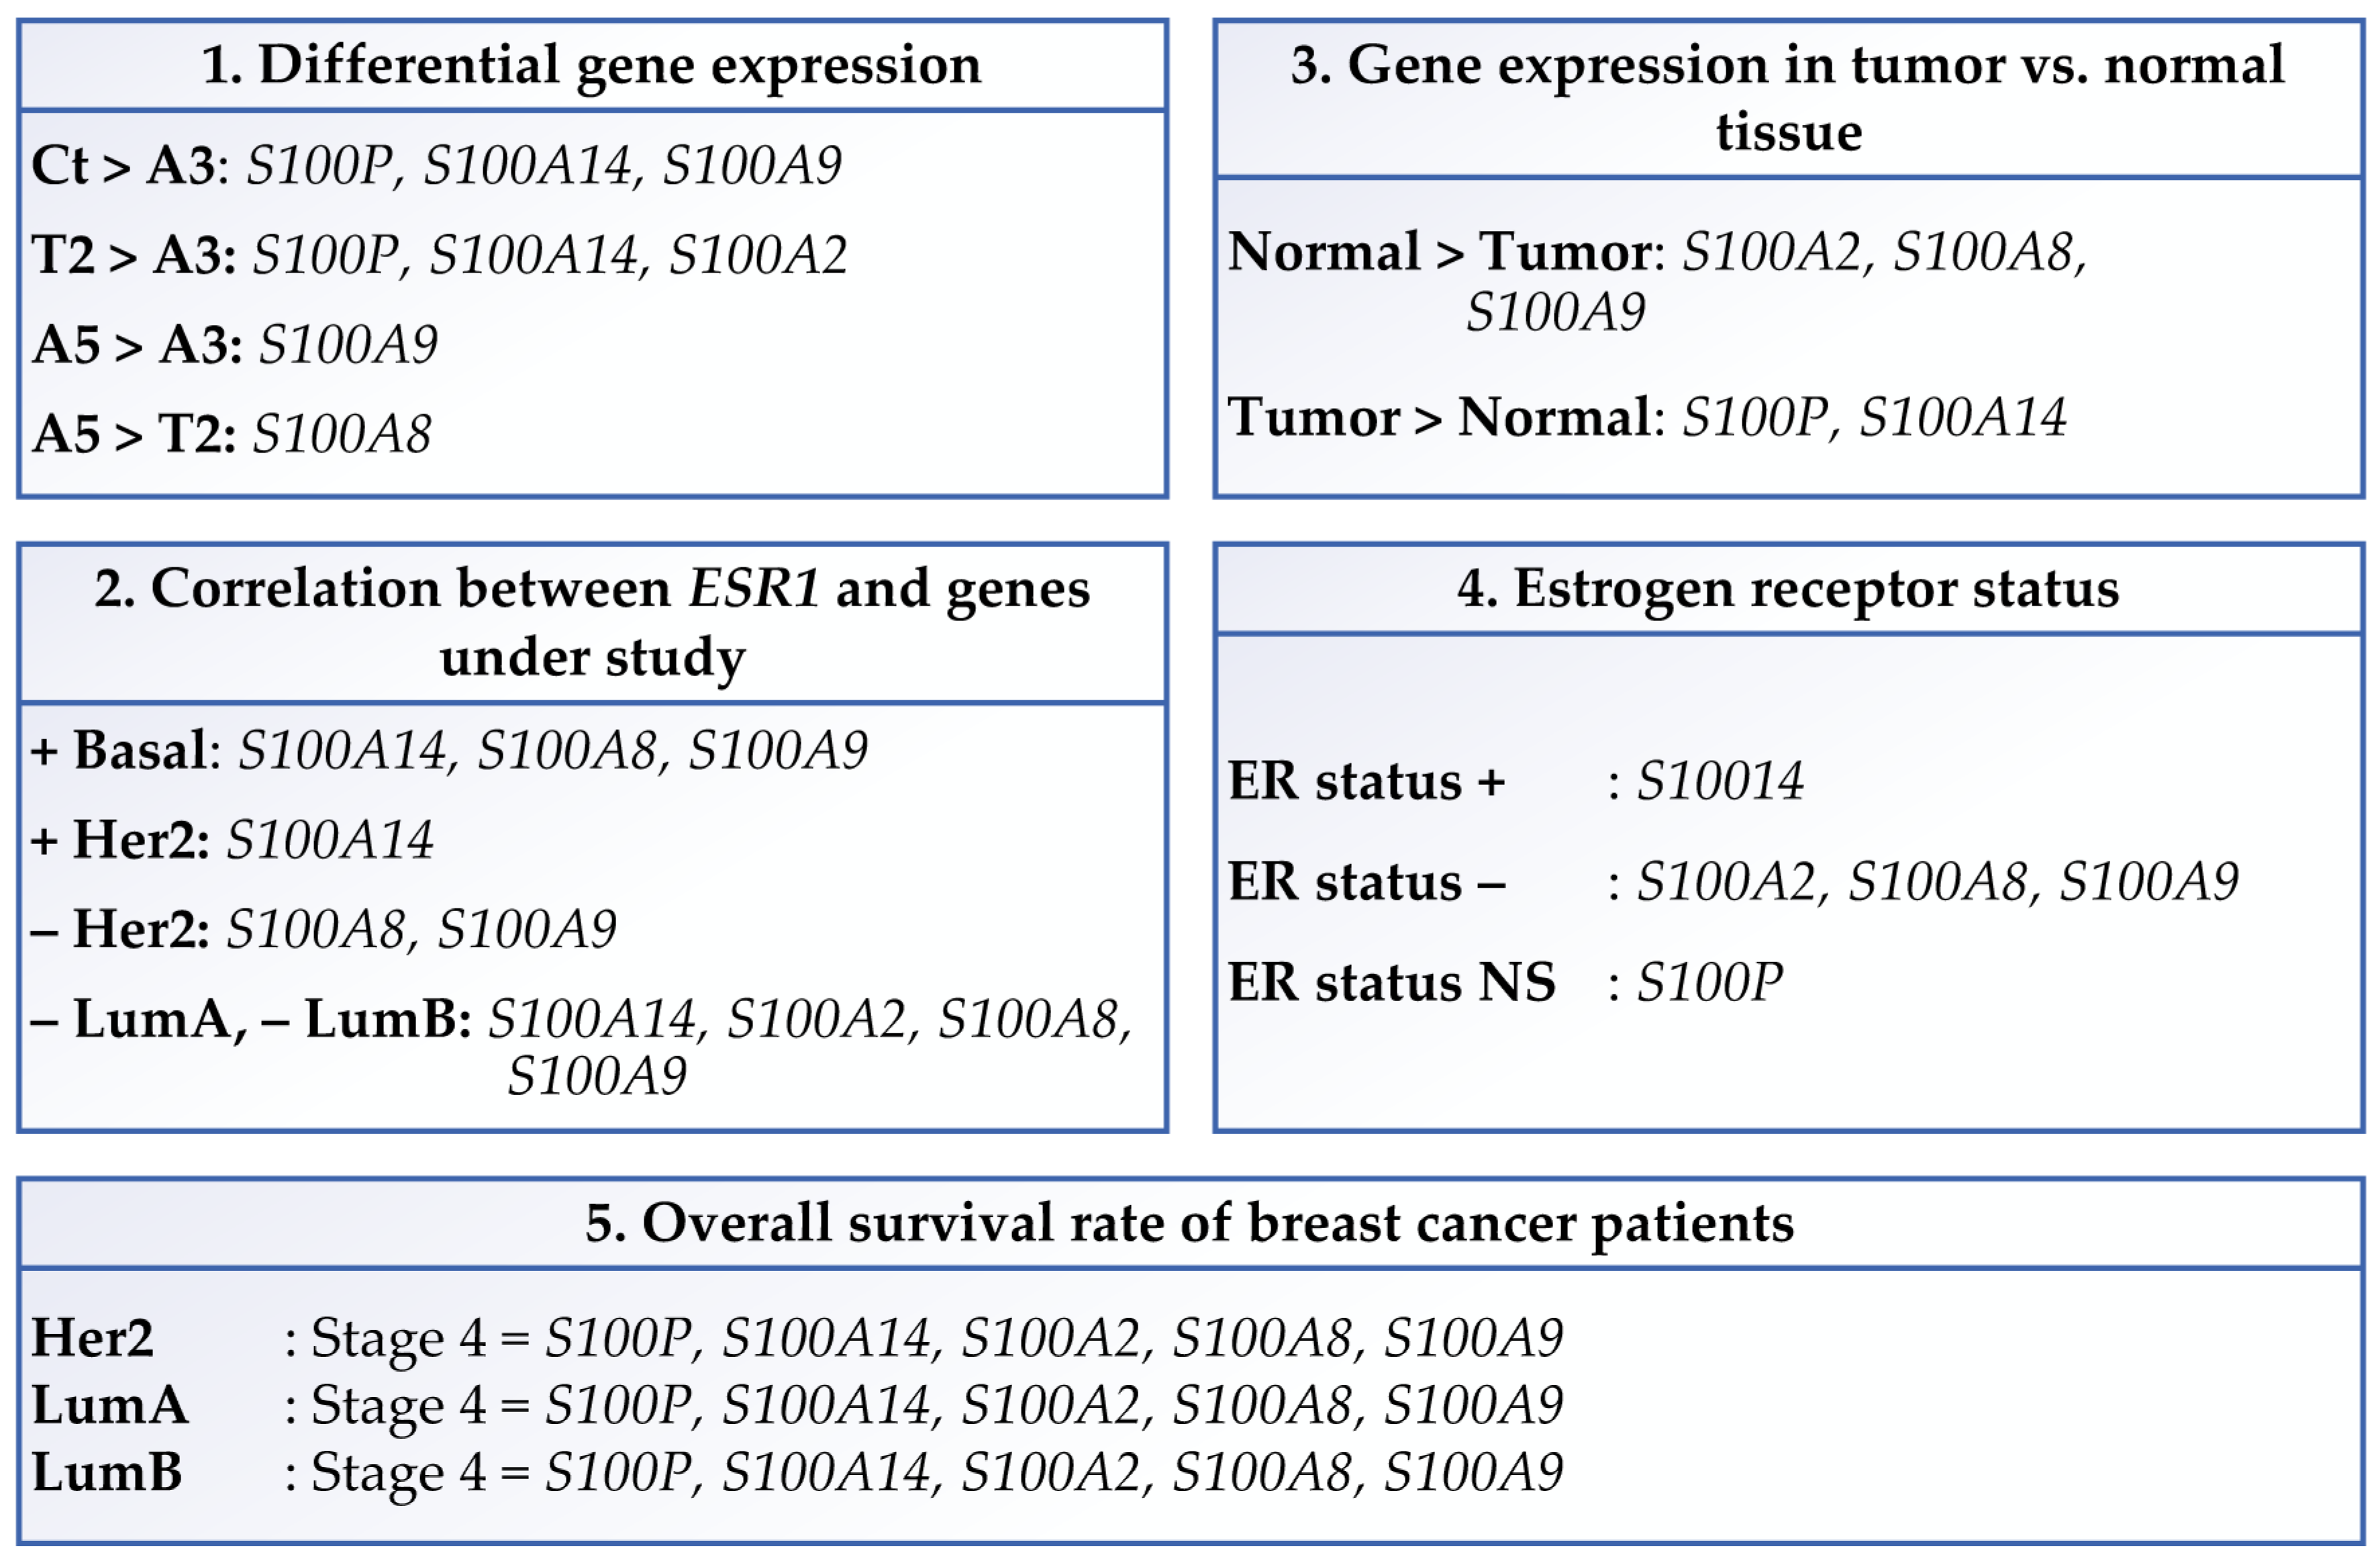
3.2. Clinical Significance and Gene Expression in Different Breast Cancer Subtypes

3.2.1. Comparison of the Genes in This Study with the Estrogen Receptor Alpha Gene

The Gen Corr module of TIMER2.0 was used to identify the association between the estrogen receptor alpha gene (ESR1) and S100P, S100A14, S100A2, S100A8, and S100A9 gene expression levels (Figure 3).
Scatter plot graphs show the association between the ESR1 gene expression and the genes under study as seen in Figure 3. There was no significant association between ESR1 and S100P expression. However, a significant (p < 0.05) positive correlation between ESR1 and S100A14 gene expression was found in Basal and Her2 cancer patients, but such a correlation was significantly (p < 0.05) negative in Luminal A and Luminal B patients. A significant (p < 0.05) negative association between ESR1 and S100A2 gene expression was found in Luminal A and Luminal B patients. Furthermore, a significant (p < 0.05) positive correlation between ESR1 and S100A8 and S100A9 gene expression levels was observed in basal breast cancer patients; whereas such a correlation was significantly (p < 0.05) negative in the Her2, Luminal A, and Luminal B types of breast cancer patients.

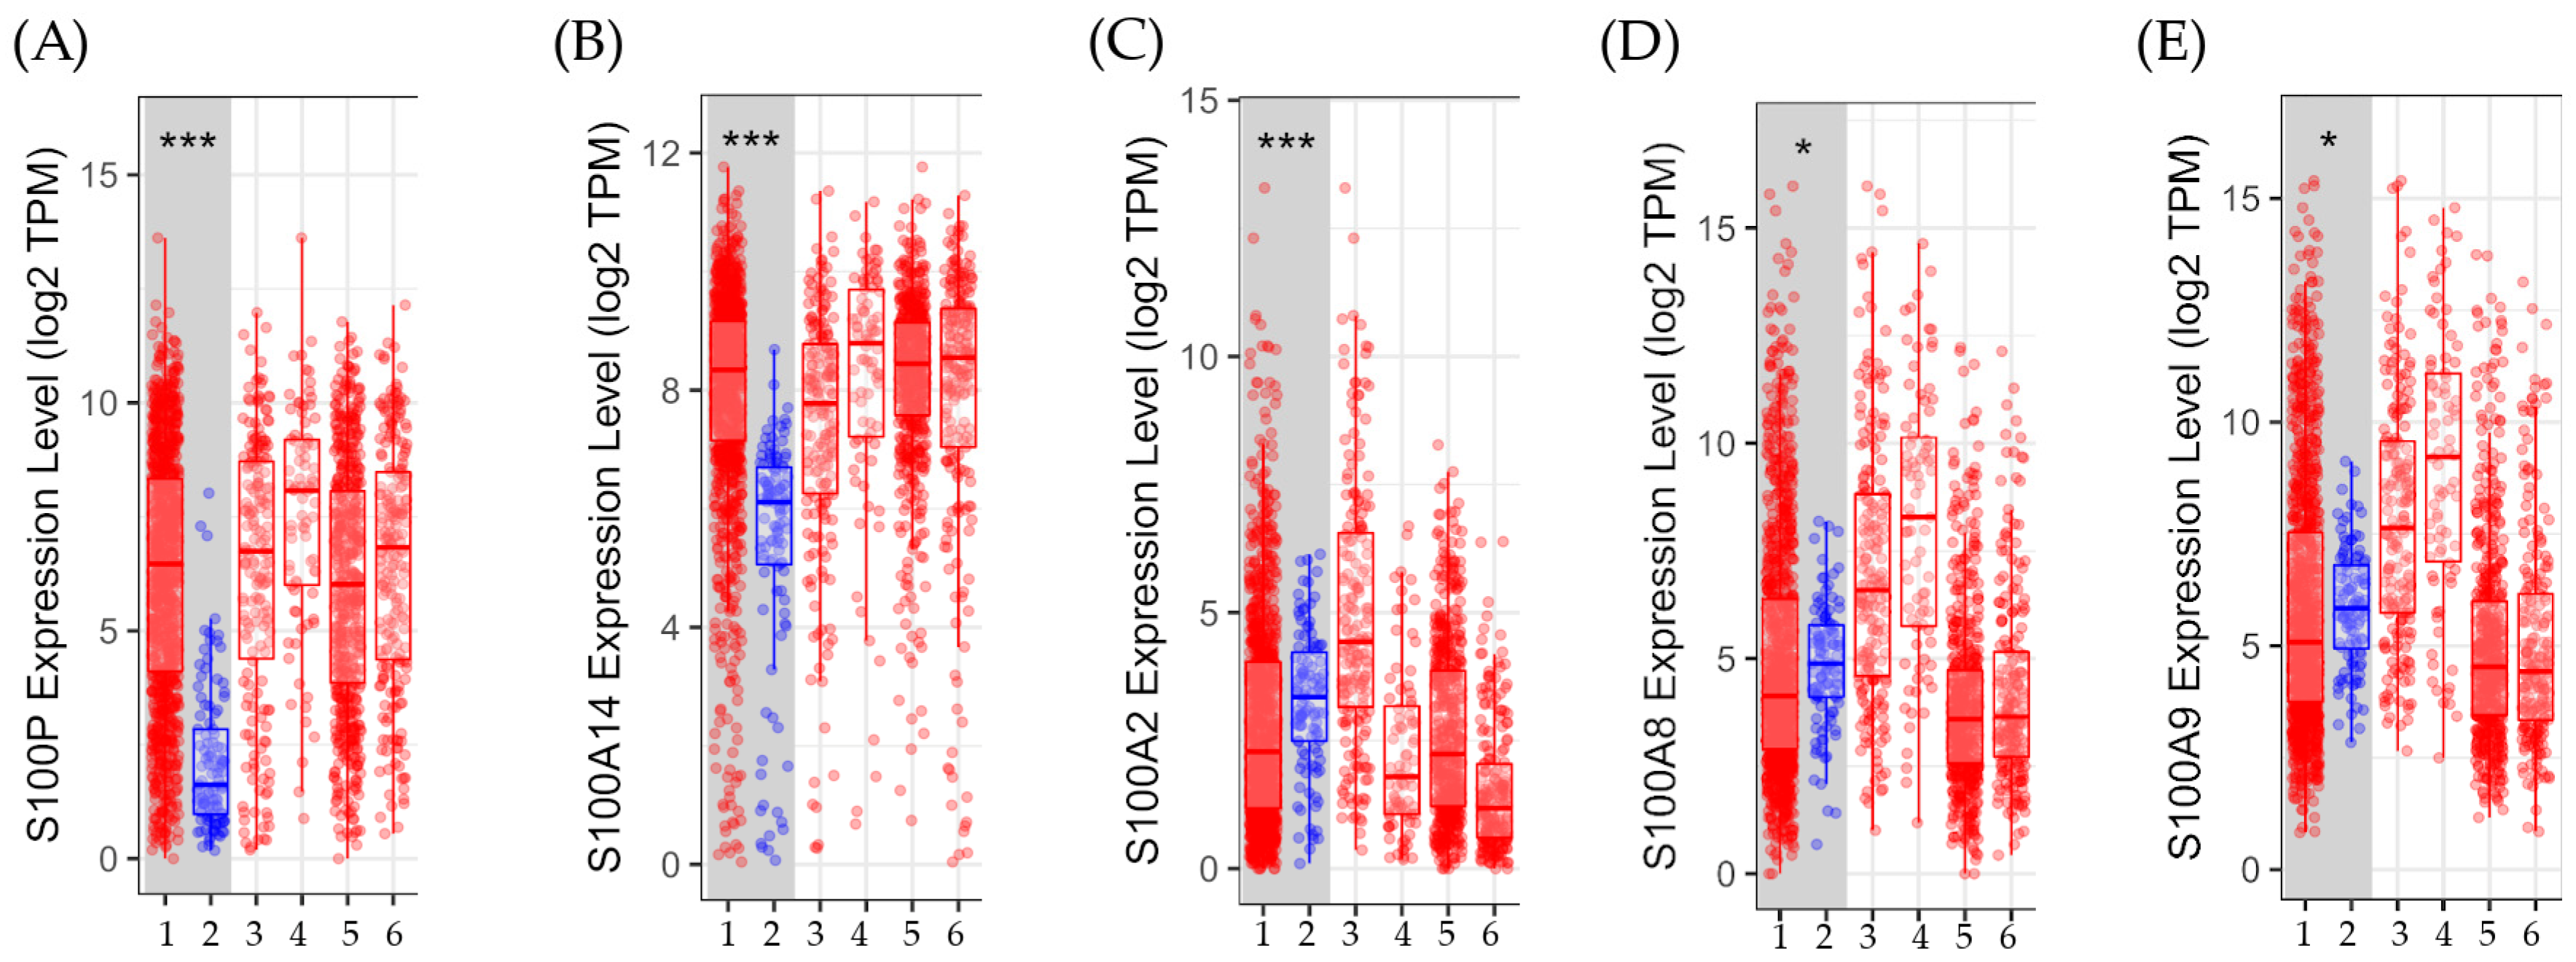
3.2.2. Gene Expression in Tumor Versus Normal Tissues

The Gen_DE module of TIMER2.0 was used to quantify the differential gene expression between normal and tumor tissues in breast cancer, as shown in Figure 4.
Gene expression comparisons between normal and tumor tissues across different subtypes are displayed in Figure 4. Results show that the expression levels of S100P and S100A14 were significantly (p < 0.001) higher in the tumor tissue compared to the normal tissues. On the other hand, the levels of gene expression for S100A2, S100A8, and S100A9 were significantly (either p < 0.001 or p < 0.05) greater in normal tissues than in malignancies.

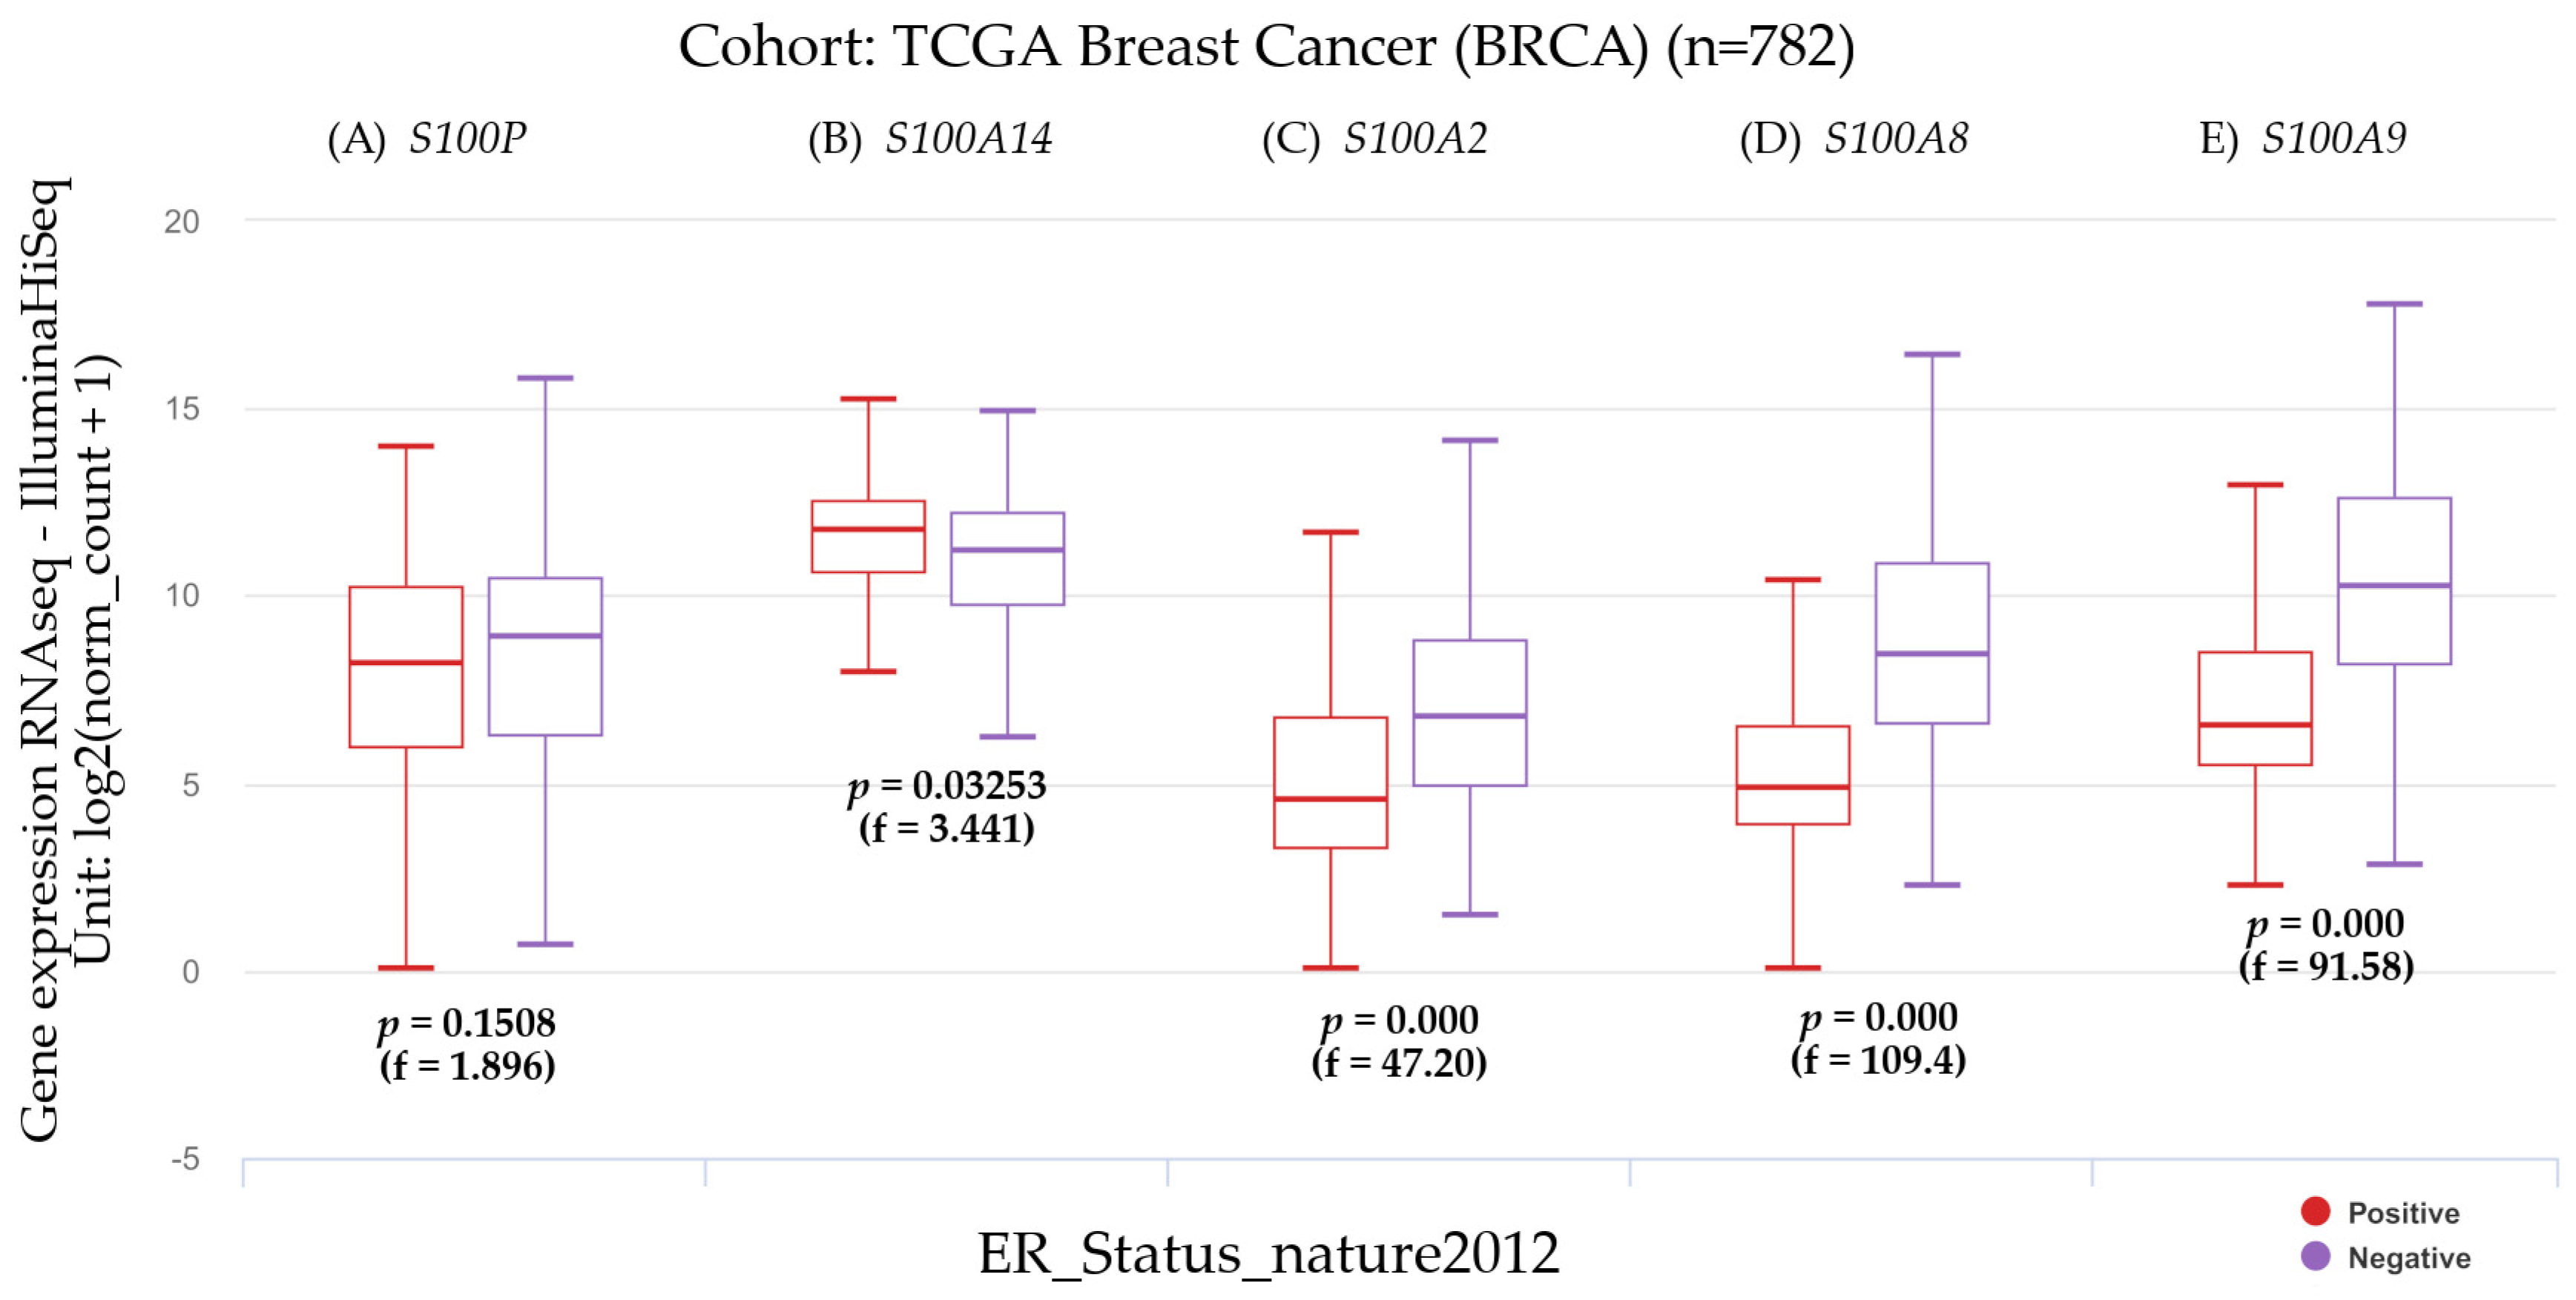
3.2.3. The Estrogen Receptor Status and Gene Expression

Estrogen receptor status and the genes that encode for the S100 calcium-binding proteins are shown in Figure 5. Results were estimated by UCSC Xena tools.
Patients showing high S100P expression levels had no significant differences concerning the ER status as shown in Figure 5. However, patients with high S100A14 gene expression showed a significant (p < 0.05) positive ER status. In contrast, the ER status in those patients having high S100A2, S100A8, and S100A9 gene expression levels was significantly (p < 0.001) negative.

3.2.4. Gene Expression and the Disease Stage Factor

The Cox proportional hazard model and TIMER2.0 were used to assess the survival difference of gene expression in breast cancer patients (n = 1100) adjusted by clinical stage factor (Table 1).
The clinical stages of patients with breast invasive cancer were taken into consideration when analyzing the gene expressions. The results showed that in Basal patients, the expression levels of S100P, S100A14, S100A2, S100A8, and S100A9 were non-significant, but at stage 4, these expressions were significantly higher in Her2, Luminal A, and Luminal B patients (* p < 0.05, ** p < 0.01, or *** p < 0.001).

4. Discussion

The present study analyzed differential gene expression in the cell lines derived from an experimental breast cancer model, previously established, as well as the clinical parameters related to such genes in breast cancer patients. These studies are important since the evaluation and understanding of the roles of different genes can be useful as biomarkers in cancer development. This experimental breast cancer model originated in the year 2000 by using the MCF-10F cell line that was exposed to low doses of high LET α particle radiation in the presence of 17β-estradiol. After being exposed to either one or two doses of 60 cGy alpha particles, the MCF-10F cell line in the presence of estrogens underwent some stages of transformation before turning tumorigenic in nude mice [32].
The S100 proteins are also associated with inflammation and tumor progression, including breast cancer [7]. They also have a significant role in developing tumors, as demonstrated in vivo rat experiments [42]. Authors [28] have described that S100P encodes a calcium-binding protein expressed in different tumor tissues and functionally involved in the malignant phenomenon, which corroborates the present results.
The differential expression of genes revealed that the T2 cell line expressed higher expression of the S100P gene than the A3 cell line. The T2 cell line, which originated in the immunologically depressed mice, had higher S100P gene expression than the non-tumorigenic A3 cell line; such results corroborated the fact that the S100P gene expression was present in patients with metastasis making the probability of survival considerably lower in patients with invasive breast carcinoma as suggested by another study [43]. Furthermore, the correlation between gene expression and the disease stage of invasive carcinoma in different types of breast cancer indicated that the S100P gene expression showed no significance in Basal breast cancer patients but such expression was higher in Her2, Luminal A, and Luminal B subtypes at stage 4. There was no significance in the correlation between ESR1 and S100P gene expression in any cancer patient subtypes, indicating no relationship with ERα, corroborated by the no significant difference between patients with high S100P gene expression levels and ER status.
However, S100P gene expression was higher in tumor tissue than in the normal one, which is important in order to consider this gene an important biomarker for breast cancer.
Interestingly, these results are also supported by Peng et al. [44] where S100P was reported as a novel prognostic marker of metastatic breast cancer since it was found in high levels in the plasma of patients. Furthermore, Yang et al. [45] found an association between breast cancer and S100P methylation in peripheral blood by multicenter case-control studies. Thus, S100P can be considered an excellent marker for breast cancer at the level of biopsy, blood, and/or plasma.
A study [12] reported that S100P over-expression was an early event in the immortalization process of human mammary epithelial cells in vitro when comparing the immortal cell line MCF-10F to its mortal counterpart S130 or other primary cultures of human breast epithelial cells, where the clone was overexpressed. Furthermore, S100P was highly expressed above those found in the mortal S130 cells in all the immortal, chemically transformed breast epithelial cell lines [34], which included MCF-10F, BP1-E, and D3-1 and in three invasive ductal carcinomas and additional cell lines like T47D in comparison to the normal surrounding tissue. Then, such a study concluded that these immortalized and malignant cells had higher S100P levels than primary cultures of human breast epithelial cells. The S100P protein was thought to be one molecule implicated in particular cell cycle regulation pathways whose imbalance would allow cells to escape senesce and achieve an immortal cell state [46,47].
According to authors [42], overexpression of the S100P protein has been linked to both the in vitro immortalization of human breast epithelial cells and the in vivo early phases of breast cancer development. Using a monoclonal antibody against the same amino acid sequence of the cloned gene, the S100P protein was then localized by immunohistochemistry in ductal hyperplasia, in situ, and invasive ductal carcinoma, but not in the normal tissues. These studies led to the conclusion that S100P overexpression was a precursor that could be crucial for the in vivo growth of tumors and the in vitro immortalization of human breast epithelial cells [42]. Through bioinformatic analysis, it was observed that the S100P expression was increased in invasive ductal carcinomas when compared with the adjacent normal tissues [48,49].
Findings showed that the T2 cell line exhibited higher S100A14 gene expression than the A3 cell line. Additionally, clinical data revealed a positive association between ESR1 and S100A14 gene expression in patients with Basal and Her2 breast cancer, but a negative correlation in patients with Luminal A and Luminal B breast cancer. Authors found that the S100A14 protein played a role in cell invasion by influencing the expression and functionality of matrix metalloproteinase (MMP)-2 [50]; as well as enhancing the motility of breast cancer cells by increasing the S100A14 gene level [51]; furthermore, it enhanced the invasive activity of breast cancer cells through its interaction with cytoskeletal dynamics, suggesting its potential as a prognostic biomarker and a possible target for therapeutic interventions [52]. Others reported that the S100A14 signaling promoted the metastasis of breast cancer [53] when serum levels were higher in patients with advanced breast cancer in comparison to those with localized one [54]; then, high levels of S100A14 expression were linked to lower survival rates in breast cancer patients [55]. Authors identified the S100A14 as an independent predictor of triple-negative breast cancer prognosis, a subgroup that generally has unfavorable outcomes and does not respond to targeted therapy, becoming a potential new treatment target for this cancer [56].
S100A2 expression was higher in the T2 cell line compared to A3 and A5. Interestingly, S100A2 expression was more commonly observed in breast cancer tissues compared to normal tissues, suggesting that this expression might serve as a cancer indicator in patients who demonstrated a substantial negative correlation between ESR1 and S100A2 expression in Luminal A and Luminal B breast cancer patients. Authors have demonstrated that S100A2 is one of several proteins that play a causal role in metastasis since they are characteristic of highly metastatic tumors [57]. However, in our bioinformatics analysis, normal tissues had higher levels of S100A2 gene expression when compared to tumors, and other authors [58] confirmed S100A2 protein expression in normal human breast epithelium, but not in breast carcinoma cell lines. Others showed that the S100A2 was expressed in normal breast tissue but it was down-regulated during breast cancer progression [59]. The analysis also indicated that S100A2 gene expression did not have significance in Basal breast cancer patients. However, it was higher in Her2, Luminal A, and Luminal B patients in stage 4 than in other clinical stages.
The current study showed that S100A8 expression was greater in the A5 cell line compared to the A3 and T2 and correlated in certain aspects with clinical subtypes in breast cancer patients [31]. However, clinical stages of patients with breast invasive carcinoma indicated gene expression was higher in Her2, Luminal A, and Luminal B patients in stage 4 but no significance at any stage in Basal breast cancer patients.
Other authors found increased S100A8 gene and protein expression in breast cancer cells and the stroma of breast tumors [60]. The expression of the S100A8 protein was linked with a notably poorer prognosis in cancerous cells. The amplification of S100A8 did not seem connected with the expression of the S100A8 protein in breast cancer [61]. However, a tissue microarray analysis of human breast cancer showed a connection between the expression of the S100A8 gene and unfavorable outcomes [62].
Results showed that S100A9, a major regulator of inflammation, had higher gene expression in the A5 than in the A3 cell line, indicating the role of estrogen in these processes since the difference between these two cell lines in the estrogen treatment along the process. The S100A9 also plays a role in cancer progression and metastasis since it has been demonstrated to be expressed in the lungs [63]. Authors [64] reported S100A9 in tumor-negative breast cancer that was highly lethal due to its aggressive clinical phenotype and the lack of validated therapeutic targets. According to the results, patients with stage 4 Her2, Luminal A, and Luminal B had greater levels of S100A9 gene expression. Nonetheless, in patients with basal breast cancer, there was no significance.
Normal tissues had higher levels of S100A8 and S100A9 gene expression than malignancies did. It has also been shown that S100A8/A9, S100A9, and S100A8 have the potential to be tumor diagnostic or prognostic biomarkers [65]. The heterodimer of the calcium-binding proteins S100A8 and S100A9, known as S100A8/A9, was first identified by the authors as an immunogenic protein that neutrophils produced and secreted [66]. In patients with basal carcinoma, the current study demonstrated a positive link between ESR1 and the expression of the S100A8 and S100A9 genes, but a negative correlation with Her2, Luminal A, and Luminal B patients. Furthermore, S100A8 and S100A9 gene expression showed an ER-negative status in breast cancer patients. Studies have demonstrated increased S100A8 and S100A9 levels seen in patients with ER-negative breast cancer [31,67]. It was proposed that S100A8 and S100A9 expression represented a potential mechanism of the infiltrating myeloid cells having a clinical relevance, especially in tumor-negative breast cancer of basal-like subtypes [67,68].
The S100A8 and S100A9 members are among the S100 inflammatory proteins shown to modulate several breast cancer processes as progression and malignancy [69]. Both are among the most induced immune mediators involved in tumor stroma. Breast tumors with ESR1 mutations displayed increased basal cytokeratins and immunological activation [70]. Cormier et al. [71] associated S100A8 and S100A9 members with breast cancer in a genome-wide transcriptome study and showed that both members could signal and regulate cancer cell behavior through the extracellular and intracellular-initiated cascades. Such authors elucidated the roles of intracellularly produced S100A8 and S100A9 on critical signaling pathways and biological mechanisms responsible for the malignancy of breast cancer. They found that adding S100A8 and S100A9 proteins to the MCF7 breast cancer cell line extracellularly promoted cell growth [71]. Growth inhibition resulted from the intracellular recombinant expression of S100A8 and S100A9. Additionally, they demonstrated that S100A8 and S100A9 expressed intracellularly induced the expression of important markers including Zona occludens-1 (ZO-1) and Integrin alpha-5, which in turn encouraged an epithelial-like phenotype [71].
Furthermore, S100A8 and S100A9 altered the characteristics of cell adhesion and invasion by negatively regulating the pre-malignant Focal Adhesion Kinase-1 (FAK) signaling cascade activity. Significant variations were discovered between the effects of extracellular vs. intracellular initiated S100A8 and S100A9 signaling cascades on the development of mammary epithelial cells. Since the S100 protein has been linked to breast cancer invasiveness and metastasis, the S100A8 and S100A9 appeared to reduce breast cancer malignancy by increasing mesenchymal to epithelial transitioning [71].
Finally, Figure 6 presents a summary of the main findings of this study that shows the differential gene expression of S100P, S100A14, S100A2, S100A8, and S100A9, their correlation with ESR1 gene expression, their expression in tumor versus normal tissues, the ER status, and the overall survival of patients.

5. Conclusions

Studies conducted in the last few years have demonstrated the critical role of the S100 proteins in a wide range of cellular functions and pathophysiological mechanisms. Results showed that ionizing radiation and estrogen affected the expression of those genes that encoded the S100 calcium-binding proteins such as S100P, S100A14, S100A2, S100A8, and S100A9 in the immortalized breast cancer cell line MCF-10F. The clinical analysis indicated that among them, the S100A14 gene could serve as an effective marker for cancer development at early stages for Lumina A patients and later stages for Her2 breast cancer patients. Several strategies have been developed to take advantage of the current understanding of the S100 proteins as useful partners in the context of cancer therapy. However, much more investigation is required to uncover and further optimize safe and effective S100 therapies as well as to universally establish S100 proteins as biomarkers.

Author Contributions

Conceptualization, G.M.C.; Writing—original draft, G.M.C.; Writing—review and editing, G.M.C., L.N.A. and L.A.C.; Funding acquisition, G.M.C. All authors have read and agreed to the published version of the manuscript.

Funding

This research was funded by grants from the Fondo Nacional de Desarrollo Científico y Tecnológico (FONDECYT/ANID), FONDECYT 1231537 (G.M.C.) and FONDECYT 1200656 (G.M.C.).

Institutional Review Board Statement

Not applicable.

Informed Consent Statement

Not applicable.

Data Availability Statement

Data concerning the clinical relevance presented in this study are openly available in TIMER2.0 (http://timer.cistrome.org), reference number [40] (accessed on 6 July 2024); UCSC Xena online exploration tools are freely available at http://xena.ucsc.edu/, reference number [41] (accessed on 20 June 2024). The data generated in the present study may be requested from the corresponding author.

Acknowledgments

The authors want to thank Guiliana Rojas for her technical support (Instituto de Alta Investigación, Universidad de Tarapacá).

Conflicts of Interest

The authors declare no conflicts of interest. The funders had no role in the design of the study; in the collection, analyses, or interpretation of data; in the writing of the manuscript; or in the decision to publish the results.

References

  1. Sung, H.; Ferlay, J.; Siegel, R.L.; Laversanne, M.; Soerjomataram, I.; Jemal, A.; Bray, F. Global Cancer Statistics 2020: GLOBOCAN Estimates of Incidence and Mortality Worldwide for 36 Cancers in 185 Countries. CA Cancer J. Clin. 2021, 71, 209–249. [Google Scholar] [CrossRef] [PubMed]
  2. Trapani, D.; Ginsburg, O.; Fadelu, T.; Lin, N.U.; Hassett, M.; Ilbawi, A.M.; Anderson, B.O.; Curigliano, G. Global challenges and policy solutions in breast cancer control. Cancer Treat. Rev. 2022, 104, 102339. [Google Scholar] [CrossRef] [PubMed]
  3. Lei, S.; Zheng, R.; Zhang, S.; Wang, S.; Chen, R.; Sun, K.; Zeng, H.; Zhou, J.; Wei, W. Global patterns of breast cancer incidence and mortality: A population-based cancer registry data analysis from 2000 to 2020. Cancer Commun. 2021, 41, 1183–1194. [Google Scholar] [CrossRef] [PubMed]
  4. Harbeck, N.; Penault-Llorca, F.; Cortes, J.; Gnant, M.; Houssami, N.; Poortmans, P.; Ruddy, K.; Tsang, J.; Cardoso, F. Breast cancer. Nat. Rev. Dis. Primers 2019, 5, 66. [Google Scholar] [CrossRef] [PubMed]
  5. Jiang, H.; Hu, H.; Tong, X.; Jiang, Q.; Zhu, H.; Zhang, S. Calcium-binding protein S100P and cancer: Mechanisms and clinical relevance. J. Cancer Res. Clin. Oncol. 2012, 138, 1–9. [Google Scholar] [CrossRef] [PubMed]
  6. Ghafouri-Fard, S.; Majidpoor, J.; Shoorei, H.; Hussen, B.M.; Hadayat Jamal, H.; Baniahmad, A.; Taheri, M.; Mokhtari, M. The Interaction Between Non-Coding RNAs and Calcium Binding Proteins. Front. Oncol. 2022, 12, 848376. [Google Scholar] [CrossRef]
  7. Rigiracciolo, D.C.; Nohata, N.; Lappano, R.; Cirillo, F.; Talia, M.; Adame-Garcia, S.R.; Arang, N.; Lubrano, S.; De Francesco, E.M.; Belfiore, A.; et al. Focal Adhesion Kinase (FAK)-Hippo/YAP transduction signaling mediates the stimulatory effects exerted by S100A8/A9-RAGE system in triple-negative breast cancer (TNBC). J. Exp. Clin. Cancer Res. 2022, 41, 193. [Google Scholar] [CrossRef]
  8. Donato, R.; Cannon, B.R.; Sorci, G.; Riuzzi, F.; Hsu, K.; Weber, D.J.; Geczy, C.L. Functions of S100 proteins. Curr. Mol. Med. 2013, 13, 24–57. [Google Scholar] [CrossRef]
  9. Allgower, C.; Kretz, A.L.; von Karstedt, S.; Wittau, M.; Henne-Bruns, D.; Lemke, J. Friend or Foe: S100 Proteins in Cancer. Cancers 2020, 12, 2037. [Google Scholar] [CrossRef]
  10. Schafer, B.W.; Heizmann, C.W. The S100 family of EF-hand calcium-binding proteins: Functions and pathology. Trends Biochem. Sci. 1996, 21, 134–140. [Google Scholar] [CrossRef]
  11. Hu, Y.; Han, Y.; He, M.; Zhang, Y.; Zou, X. S100 proteins in head and neck squamous cell carcinoma (Review). Oncol. Lett. 2023, 26, 362. [Google Scholar] [CrossRef] [PubMed]
  12. Russo, J.; Hu, Y.F.; Silva, I.D.; Russo, I.H. Cancer risk related to mammary gland structure and development. Microsc. Res. Tech. 2001, 52, 204–223. [Google Scholar] [CrossRef]
  13. Soule, H.D.; Maloney, T.M.; Wolman, S.R.; Peterson, W.D., Jr.; Brenz, R.; McGrath, C.M.; Russo, J.; Pauley, R.J.; Jones, R.F.; Brooks, S.C. Isolation and characterization of a spontaneously immortalized human breast epithelial cell line, MCF-10. Cancer Res. 1990, 50, 6075–6086. [Google Scholar] [PubMed]
  14. Russo, J.; Calaf, G.; Russo, I.H. A critical approach to the malignant transformation of human breast epithelial cells with chemical carcinogens. Crit. Rev. Oncog. 1993, 4, 403–417. [Google Scholar]
  15. Bond, J.A.; Wyllie, F.S.; Wynford-Thomas, D. Escape from senescence in human diploid fibroblasts induced directly by mutant p53. Oncogene 1994, 9, 1885–1889. [Google Scholar]
  16. Briand, P.; Petersen, O.W.; Van Deurs, B. A new diploid nontumorigenic human breast epithelial cell line isolated and propagated in chemically defined medium. In Vitro Cell Dev. Biol. 1987, 23, 181–188. [Google Scholar] [CrossRef] [PubMed]
  17. Tait, L.; Soule, H.D.; Russo, J. Ultrastructural and immunocytochemical characterization of an immortalized human breast epithelial cell line, MCF-10. Cancer Res. 1990, 50, 6087–6094. [Google Scholar] [PubMed]
  18. Ochieng, J.; Tahin, Q.S.; Booth, C.C.; Russo, J. Buffering of intracellular calcium in response to increased extracellular levels in mortal, immortal, and transformed human breast epithelial cells. J. Cell Biochem. 1991, 46, 250–254. [Google Scholar] [CrossRef]
  19. Barnabas, N.; Moraes, R.; Calaf, G.; Estrada, S.; Russo, J. Role of p53 in mcf-10f cell immortalization and chemically-induced neoplastic transformation. Int. J. Oncol. 1995, 7, 1289–1296. [Google Scholar] [CrossRef]
  20. Higgy, N.A.; Salicioni, A.M.; Russo, I.H.; Zhang, P.L.; Russo, J. Differential expression of human ferritin H chain gene in immortal human breast epithelial MCF-10F cells. Mol. Carcinog. 1997, 20, 332–339. [Google Scholar] [CrossRef]
  21. Strynadka, N.C.; James, M.N. Crystal structures of the helix-loop-helix calcium-binding proteins. Annu. Rev. Biochem. 1989, 58, 951–998. [Google Scholar] [CrossRef] [PubMed]
  22. Gifford, J.L.; Walsh, M.P.; Vogel, H.J. Structures and metal-ion-binding properties of the Ca2+-binding helix-loop-helix EF-hand motifs. Biochem. J. 2007, 405, 199–221. [Google Scholar] [CrossRef] [PubMed]
  23. Bagur, R.; Hajnoczky, G. Intracellular Ca(2+) Sensing: Its Role in Calcium Homeostasis and Signaling. Mol. Cell 2017, 66, 780–788. [Google Scholar] [CrossRef] [PubMed]
  24. Ogoma, Y.; Kobayashi, H.; Fujii, T.; Kondo, Y.; Hachimori, A.; Shimizu, T.; Hatano, M. Binding study of metal ions to S100 protein: 43Ca, 25Mg, 67Zn and 39K n.m.r. Int. J. Biol. Macromol. 1992, 14, 279–286. [Google Scholar] [CrossRef]
  25. Zhuang, H.; Chen, X.; Dong, F.; Zhang, Z.; Zhou, Z.; Ma, Z.; Huang, S.; Chen, B.; Zhang, C.; Hou, B. Prognostic values and immune suppression of the S100A family in pancreatic cancer. J. Cell Mol. Med. 2021, 25, 3006–3018. [Google Scholar] [CrossRef]
  26. Choi, J.; Kim, D.I.; Kim, J.; Kim, B.H.; Kim, A. Hornerin Is Involved in Breast Cancer Progression. J. Breast Cancer 2016, 19, 142–147. [Google Scholar] [CrossRef]
  27. Maderka, M.; Pilka, R.; Neubert, D.; Hambalek, J. New serum tumor markers S100, TFF3 and AIF-1 and their possible use in oncogynecology. Ceska Gynekol. 2019, 84, 303–308. [Google Scholar]
  28. Gibadulinova, A.; Tothova, V.; Pastorek, J.; Pastorekova, S. Transcriptional regulation and functional implication of S100P in cancer. Amino Acids 2011, 41, 885–892. [Google Scholar] [CrossRef]
  29. Wang, X.; Yang, J.; Qian, J.; Liu, Z.; Chen, H.; Cui, Z. S100A14, a mediator of epithelial-mesenchymal transition, regulates proliferation, migration and invasion of human cervical cancer cells. Am. J. Cancer Res. 2015, 5, 1484–1495. [Google Scholar]
  30. Wolf, S.; Haase-Kohn, C.; Pietzsch, J. S100A2 in cancerogenesis: A friend or a foe? Amino Acids 2011, 41, 849–861. [Google Scholar] [CrossRef]
  31. Wang, D.; Liu, G.; Wu, B.; Chen, L.; Zeng, L.; Pan, Y. Clinical Significance of Elevated S100A8 Expression in Breast Cancer Patients. Front. Oncol. 2018, 8, 496. [Google Scholar] [CrossRef] [PubMed]
  32. Calaf, G.M.; Hei, T.K. Establishment of a radiation- and estrogen-induced breast cancer model. Carcinogenesis 2000, 21, 769–776. [Google Scholar] [CrossRef]
  33. IARC. Ionizing radiation, Part I, X- and gamma (y)-radiation, and neutrons. In IARC Working Group on the Evaluation of Carcinogenic Risks to Humans; International Agency for Research on Cancer: Lyon, France, 2000; pp. 1–448. [Google Scholar]
  34. Calaf, G.; Russo, J. Transformation of human breast epithelial cells by chemical carcinogens. Carcinogenesis 1993, 14, 483–492. [Google Scholar] [CrossRef] [PubMed]
  35. Calaf, G.M.; Roy, D. Gene and protein expressions induced by 17beta-estradiol and parathion in cultured breast epithelial cells. Mol. Med. 2007, 13, 255–265. [Google Scholar] [CrossRef] [PubMed]
  36. Calaf, G.M.; Roy, D. Cell adhesion proteins altered by 17beta estradiol and parathion in breast epithelial cells. Oncol. Rep. 2008, 19, 165–169. [Google Scholar]
  37. Hei, T.K.; Piao, C.Q.; Willey, J.C.; Thomas, S.; Hall, E.J. Malignant transformation of human bronchial epithelial cells by radon-simulated alpha-particles. Carcinogenesis 1994, 15, 431–437. [Google Scholar] [CrossRef]
  38. Calaf, G.M.; Roy, D.; Narayan, G.; Balajee, A.S. Differential expression of cell adhesion molecules in an ionizing radiation-induced breast cancer model system. Oncol. Rep. 2013, 30, 285–291. [Google Scholar] [CrossRef]
  39. Calaf, G.M.; Crispin, L.A.; Munoz, J.P.; Aguayo, F.; Roy, D.; Narayan, G. Ionizing Radiation and Estrogen Affecting Growth Factor Genes in an Experimental Breast Cancer Model. Int. J. Mol. Sci. 2022, 23, 14284. [Google Scholar] [CrossRef]
  40. Li, T.; Fu, J.; Zeng, Z.; Cohen, D.; Li, J.; Chen, Q.; Li, B.; Liu, X.S. TIMER2.0 for analysis of tumor-infiltrating immune cells. Nucleic Acids Res. 2020, 48, W509–W514. [Google Scholar] [CrossRef]
  41. Goldman, M.; Craft, B.; Hastie, M.; Repecka, K.; McDade, F.; Kamath, A.; Banerjee, A.; Luo, Y.; Rogers, D.; Brooks, A.N.; et al. The UCSC Xena platform for public and private cancer genomics data visualization and interpretation. bioRxiv 2019, 1–16. [Google Scholar] [CrossRef]
  42. Guerreiro Da Silva, I.D.; Hu, Y.F.; Russo, I.H.; Ao, X.; Salicioni, A.M.; Yang, X.; Russo, J. S100P calcium-binding protein overexpression is associated with immortalization of human breast epithelial cells in vitro and early stages of breast cancer development in vivo. Int. J. Oncol. 2000, 16, 231–240. [Google Scholar] [CrossRef] [PubMed]
  43. Maciejczyk, A.; Lacko, A.; Ekiert, M.; Jagoda, E.; Wysocka, T.; Matkowski, R.; Halon, A.; Gyorffy, B.; Lage, H.; Surowiak, P. Elevated nuclear S100P expression is associated with poor survival in early breast cancer patients. Histol. Histopathol. 2013, 28, 513–524. [Google Scholar] [CrossRef]
  44. Peng, C.; Chen, H.; Wallwiener, M.; Modugno, C.; Cuk, K.; Madhavan, D.; Trumpp, A.; Heil, J.; Marme, F.; Nees, J.; et al. Plasma S100P level as a novel prognostic marker of metastatic breast cancer. Breast Cancer Res. Treat. 2016, 157, 329–338. [Google Scholar] [CrossRef]
  45. Yang, R.; Stocker, S.; Schott, S.; Heil, J.; Marme, F.; Cuk, K.; Chen, B.; Golatta, M.; Zhou, Y.; Sutter, C.; et al. The association between breast cancer and S100P methylation in peripheral blood by multicenter case-control studies. Carcinogenesis 2017, 38, 312–320. [Google Scholar] [CrossRef]
  46. Derventzi, A.; Rattan, S.I.; Gonos, E.S. Molecular links between cellular mortality and immortality (review). Anticancer. Res. 1996, 16, 2901–2910. [Google Scholar]
  47. Sato, N.; Hitomi, J. S100P expression in human esophageal epithelial cells: Human esophageal epithelial cells sequentially produce different S100 proteins in the process of differentiation. Anat. Rec. 2002, 267, 60–69. [Google Scholar] [CrossRef]
  48. Becker, T.; Gerke, V.; Kube, E.; Weber, K. S100P, a novel Ca(2+)-binding protein from human placenta. cDNA cloning, recombinant protein expression and Ca2+ binding properties. Eur. J. Biochem. 1992, 207, 541–547. [Google Scholar] [CrossRef]
  49. Emoto, Y.; Kobayashi, R.; Akatsuka, H.; Hidaka, H. Purification and characterization of a new member of the S-100 protein family from human placenta. Biochem. Biophys. Res. Commun. 1992, 182, 1246–1253. [Google Scholar] [CrossRef]
  50. Chen, H.; Yuan, Y.; Zhang, C.; Luo, A.; Ding, F.; Ma, J.; Yang, S.; Tian, Y.; Tong, T.; Zhan, Q.; et al. Involvement of S100A14 protein in cell invasion by affecting expression and function of matrix metalloproteinase (MMP)-2 via p53-dependent transcriptional regulation. J. Biol. Chem. 2012, 287, 17109–17119. [Google Scholar] [CrossRef]
  51. He, H.; Li, S.; Chen, H.; Li, L.; Xu, C.; Ding, F.; Zhan, Y.; Ma, J.; Zhang, S.; Shi, Y.; et al. 12-O-tetradecanoylphorbol-13-acetate promotes breast cancer cell motility by increasing S100A14 level in a Kruppel-like transcription factor 4 (KLF4)-dependent manner. J. Biol. Chem. 2014, 289, 9089–9099. [Google Scholar] [CrossRef]
  52. Tanaka, M.; Ichikawa-Tomikawa, N.; Shishito, N.; Nishiura, K.; Miura, T.; Hozumi, A.; Chiba, H.; Yoshida, S.; Ohtake, T.; Sugino, T. Co-expression of S100A14 and S100A16 correlates with a poor prognosis in human breast cancer and promotes cancer cell invasion. BMC Cancer 2015, 15, 53. [Google Scholar] [CrossRef] [PubMed]
  53. Li, X.; Wang, M.; Gong, T.; Lei, X.; Hu, T.; Tian, M.; Ding, F.; Ma, F.; Chen, H.; Liu, Z. A S100A14-CCL2/CXCL5 signaling axis drives breast cancer metastasis. Theranostics 2020, 10, 5687–5703. [Google Scholar] [CrossRef] [PubMed]
  54. Al-Ashkar, N.; Zetoune, A.B. S100A14 serum level and its correlation with prognostic factors in breast cancer. J. Egypt. Natl. Cancer Inst. 2020, 32, 37. [Google Scholar] [CrossRef] [PubMed]
  55. Hu, L.; Kong, F.; Pan, Y. Prognostic and clinicopathological significance of S100A14 expression in cancer patients: A meta-analysis. Medicine 2019, 98, e16356. [Google Scholar] [CrossRef]
  56. Ehmsen, S.; Hansen, L.T.; Bak, M.; Brasch-Andersen, C.; Ditzel, H.J.; Leth-Larsen, R. S100A14 is a novel independent prognostic biomarker in the triple-negative breast cancer subtype. Int. J. Cancer 2015, 137, 2093–2103. [Google Scholar] [CrossRef]
  57. Naba, A.; Clauser, K.R.; Lamar, J.M.; Carr, S.A.; Hynes, R.O. Extracellular matrix signatures of human mammary carcinoma identify novel metastasis promoters. eLife 2014, 3, e01308. [Google Scholar] [CrossRef]
  58. Liu, D.; Rudland, P.S.; Sibson, D.R.; Platt-Higgins, A.; Barraclough, R. Expression of calcium-binding protein S100A2 in breast lesions. Br. J. Cancer 2000, 83, 1473–1479. [Google Scholar] [CrossRef]
  59. Wicki, R.; Franz, C.; Scholl, F.A.; Heizmann, C.W.; Schafer, B.W. Repression of the candidate tumor suppressor gene S100A2 in breast cancer is mediated by site-specific hypermethylation. Cell Calcium 1997, 22, 243–254. [Google Scholar] [CrossRef]
  60. Miller, P.; Kidwell, K.M.; Thomas, D.; Sabel, M.; Rae, J.M.; Hayes, D.F.; Hudson, B.I.; El-Ashry, D.; Lippman, M.E. Elevated S100A8 protein expression in breast cancer cells and breast tumor stroma is prognostic of poor disease outcome. Breast Cancer Res. Treat. 2017, 166, 85–94. [Google Scholar] [CrossRef]
  61. Borkja, M.L.B.; Giambelluca, M.S.; Ytterhus, B.; Prestvik, W.S.; Bjorkoy, G.; Bofin, A.M. S100A8 gene copy number and protein expression in breast cancer: Associations with proliferation, histopathological grade and molecular subtypes. Breast Cancer Res. Treat. 2023, 201, 339–350. [Google Scholar] [CrossRef]
  62. Lim, H.; Koh, M.; Jin, H.; Bae, M.; Lee, S.Y.; Kim, K.M.; Jung, J.; Kim, H.J.; Park, S.Y.; Kim, H.S.; et al. Cancer-associated fibroblasts induce an aggressive phenotypic shift in non-malignant breast epithelial cells via interleukin-8 and S100A8. J. Cell Physiol. 2021, 236, 7014–7032. [Google Scholar] [CrossRef] [PubMed]
  63. Chung, Y.H.; Ortega-Rivera, O.A.; Volckaert, B.A.; Jung, E.; Zhao, Z.; Steinmetz, N.F. Viral nanoparticle vaccines against S100A9 reduce lung tumor seeding and metastasis. Proc. Natl. Acad. Sci. USA 2023, 120, e2221859120. [Google Scholar] [CrossRef] [PubMed]
  64. Gunaldi, M.; Okuturlar, Y.; Gedikbasi, A.; Akarsu, C.; Karabulut, M.; Kural, A. Diagnostic importance of S100A9 and S100A12 in breast cancer. Biomed. Pharmacother. 2015, 76, 52–56. [Google Scholar] [CrossRef]
  65. Chen, Y.; Ouyang, Y.; Li, Z.; Wang, X.; Ma, J. S100A8 and S100A9 in Cancer. Biochim. Biophys. Acta Rev. Cancer 2023, 1878, 188891. [Google Scholar] [CrossRef] [PubMed]
  66. Gebhardt, C.; Nemeth, J.; Angel, P.; Hess, J. S100A8 and S100A9 in inflammation and cancer. Biochem. Pharmacol. 2006, 72, 1622–1631. [Google Scholar] [CrossRef] [PubMed]
  67. Goncalves, A.; Charafe-Jauffret, E.; Bertucci, F.; Audebert, S.; Toiron, Y.; Esterni, B.; Monville, F.; Tarpin, C.; Jacquemier, J.; Houvenaeghel, G.; et al. Protein profiling of human breast tumor cells identifies novel biomarkers associated with molecular subtypes. Mol. Cell Proteomics 2008, 7, 1420–1433. [Google Scholar] [CrossRef]
  68. Siegel, R.L.; Miller, K.D.; Fuchs, H.E.; Jemal, A. Cancer statistics, 2022. CA Cancer J. Clin. 2022, 72, 7–33. [Google Scholar] [CrossRef]
  69. Wang, S.; Song, R.; Wang, Z.; Jing, Z.; Wang, S.; Ma, J. S100A8/A9 in Inflammation. Front. Immunol. 2018, 9, 1298. [Google Scholar] [CrossRef]
  70. Li, Z.; McGinn, O.; Wu, Y.; Bahreini, A.; Priedigkeit, N.M.; Ding, K.; Onkar, S.; Lampenfeld, C.; Sartorius, C.A.; Miller, L.; et al. ESR1 mutant breast cancers show elevated basal cytokeratins and immune activation. Nat. Commun. 2022, 13, 2011. [Google Scholar] [CrossRef]
  71. Cormier, K.; Harquail, J.; Ouellette, R.J.; Tessier, P.A.; Guerrette, R.; Robichaud, G.A. Intracellular expression of inflammatory proteins S100A8 and S100A9 leads to epithelial-mesenchymal transition and attenuated aggressivity of breast cancer cells. Anticancer. Agents Med. Chem. 2014, 14, 35–45. [Google Scholar] [CrossRef]
Figure 1. An experimental breast cancer model, a laboratory-based model induced by estrogen and radiation, yielded various experimental cell lines. These include (A) a non-cancerous cell line like the MCF-10F (Ct), that was not exposed to radiation; the estrogen (E) cell line, consistently treated with 17β-estradiol at a concentration of 10−8 mol/L; and the malignant cell line known as Alpha3 (A3), produced by irradiating MCF-10F cells with two 60/60 cGy α particle doses. (B) The cancerous cell lines such as Alpha5 (A5), which are MCF-10F cells that were exposed to two 60/60 cGy α particle doses in conjunction with estrogen, and the Tumor2 (T2) cell line, originated from mammary tumors appearing in nude mice after being injected with the A5 cell line. This image was created with Biorender (https://www.biorender.com/), accessed on 19 June 2024. Ct: control.
Biomedicines 12 02432 g001
Figure 2. Affymetrix array (U133A) was used to profile genes that were differentially expressed such as (A) the S100 calcium-binding protein P (S100P), (B) the S100 calcium-binding protein A14 (S100A14), (C) the S100 calcium-binding protein A2 (S100A2), (D) the S100 calcium-binding protein A8 (S100A8), and (E) the S100 calcium-binding protein A9 (S100A9) in the cell lines as follow: Control/Estrogen (Ct/E), Control/Alpha3 (Ct/A3), Estrogen/Alpha5 (E/A5), Alpha3/Alpha5 (A3/A5), Alpha5/Tumor2 (A5/T2), and Alpha3/Tumor2 (A3/T2). The graphs include data taken from a cluster dendrogram collection of gene expression in our laboratory for this article.
Biomedicines 12 02432 g002
Figure 3. The scatter plots show the correlation values, with linear regression lines, of ESR1 and the expression levels of the S100 calcium-binding protein A14 gene (S100A14), S100 calcium-binding protein A2 gene (S100A2), S100 calcium-binding protein A8 gene (S100A8), and S100 calcium-binding protein A9 gene (S100A9) in invasive breast carcinoma and the purity adjustment (Purity column). The blue lines in each plot indicate the linear regression fit, which depicts the pattern or relationship between the expression level of ESR1 and the related gene. The gray-shaded area around each blue regression line represents the confidence range. The correlation analysis for each box is shown in red in the upper right corner. The statistical significance was determined using TIMER2.0. (Spearman, p < 0.05), reference number [40], accessed 14 March 2024.
Biomedicines 12 02432 g003
Figure 4. Determination of gene expression between tumor and normal tissues in different subtypes of breast cancer. The box plots show the distribution of gene expression levels of (A) the S100 calcium-binding protein P gene (S100P), (B) the calcium-binding protein A14 (S100A14), (C) the S100 calcium-binding protein A2 (S100A2), (D) the calcium-binding protein A8 (S100A8), and (E) the calcium-binding protein A9 (S100A9) in breast invasive carcinoma. TIMER2.0, reference number [40], accessed on 14 March 2024, established such levels using the Wilcoxon rank-sum test (*: p < 0.05, ***: p < 0.001). 1: Tumor: n = 1093, 2: Normal: n = 112, 3: Basal. Tumor: n = 190, 4: Her2. Tumor n = 82, 5: Luminal A. Tumor: n = 564, 6: Luminal B. Tumor: n = 217.
Biomedicines 12 02432 g004
Figure 5. The state of the estrogen receptor and gene expression of (A) S100 calcium-binding protein P (S100P), (B) S100 calcium-binding protein A14 (S100A14), (C) S100 calcium-binding protein A2 (S100A2), (D) S100 calcium-binding protein A8 (S100A8), and (E) S100 calcium-binding protein A9 (S100A9) in breast invasive carcinoma stratified by Nature2012. Extracted from Xena functional genomics explorer (https://xena.ucsc.edu/), reference number [41], accessed on 14 March 2024.
Biomedicines 12 02432 g005
Figure 6. An overview of the key conclusions drawn from the Affymetrix array and their practical significance. (1) Differential gene expression was found in the control (Ct), estrogen (E), Alpha3 (A3), Alpha5 (A5), and tumor2 (T2) cell lines. (2) Association between S100P, S100A14, S100A2, S100A8, and S100A9 expression levels and the expression of the ESR1 gene in breast cancer subtypes. (3) Gene expression in tumor versus normal tissues. (4) Status of estrogen receptors. (5) Patients and breast cancer survival. Abbreviations, +: positive, : negative, NS: non-significant, LumA: Luminal A, LumB: Luminal B.
Biomedicines 12 02432 g006
Table 1. Expression of genes and disease stage in different subtypes of breast cancer.
CancerS100PS100A14S100A2S100A8S100A9
All breast subtypes (n = 1100)3, 4 ***3, 4 ***3, 4 ***3, 4 ***3, 4 ***
Basal (n = 191)N.S.N.S.N.S.N.S.N.S.
Her2 (n = 82)4 **4 *4 **4 *4 *
Luminal A (n = 568)4 ***4***4 **4 ***4 ***
Luminal B (n = 219)4 **4 **4 **4 **4 **
3, 4: breast cancer stages, N.S.: non-significant, *: p < 0.05, **: p < 0.01, ***: p < 0.001.
Disclaimer/Publisher’s Note: The statements, opinions and data contained in all publications are solely those of the individual author(s) and contributor(s) and not of MDPI and/or the editor(s). MDPI and/or the editor(s) disclaim responsibility for any injury to people or property resulting from any ideas, methods, instructions or products referred to in the content.

