

Retinal Functional Impairment in Diabetic Retinopathy
 ,
, 
Abstract
:1. Introduction
2. Materials and Methods
2.1. Subjects
2.2. ERG Measurements
- Ophthalmological investigation: visual acuity, refraction, anterior segment examination by biomicroscopy, intraocular pressure, fundus examination, and color vision in order to diagnose the stage of diabetic retinopathy and to exclude other ophthalmological diseases.
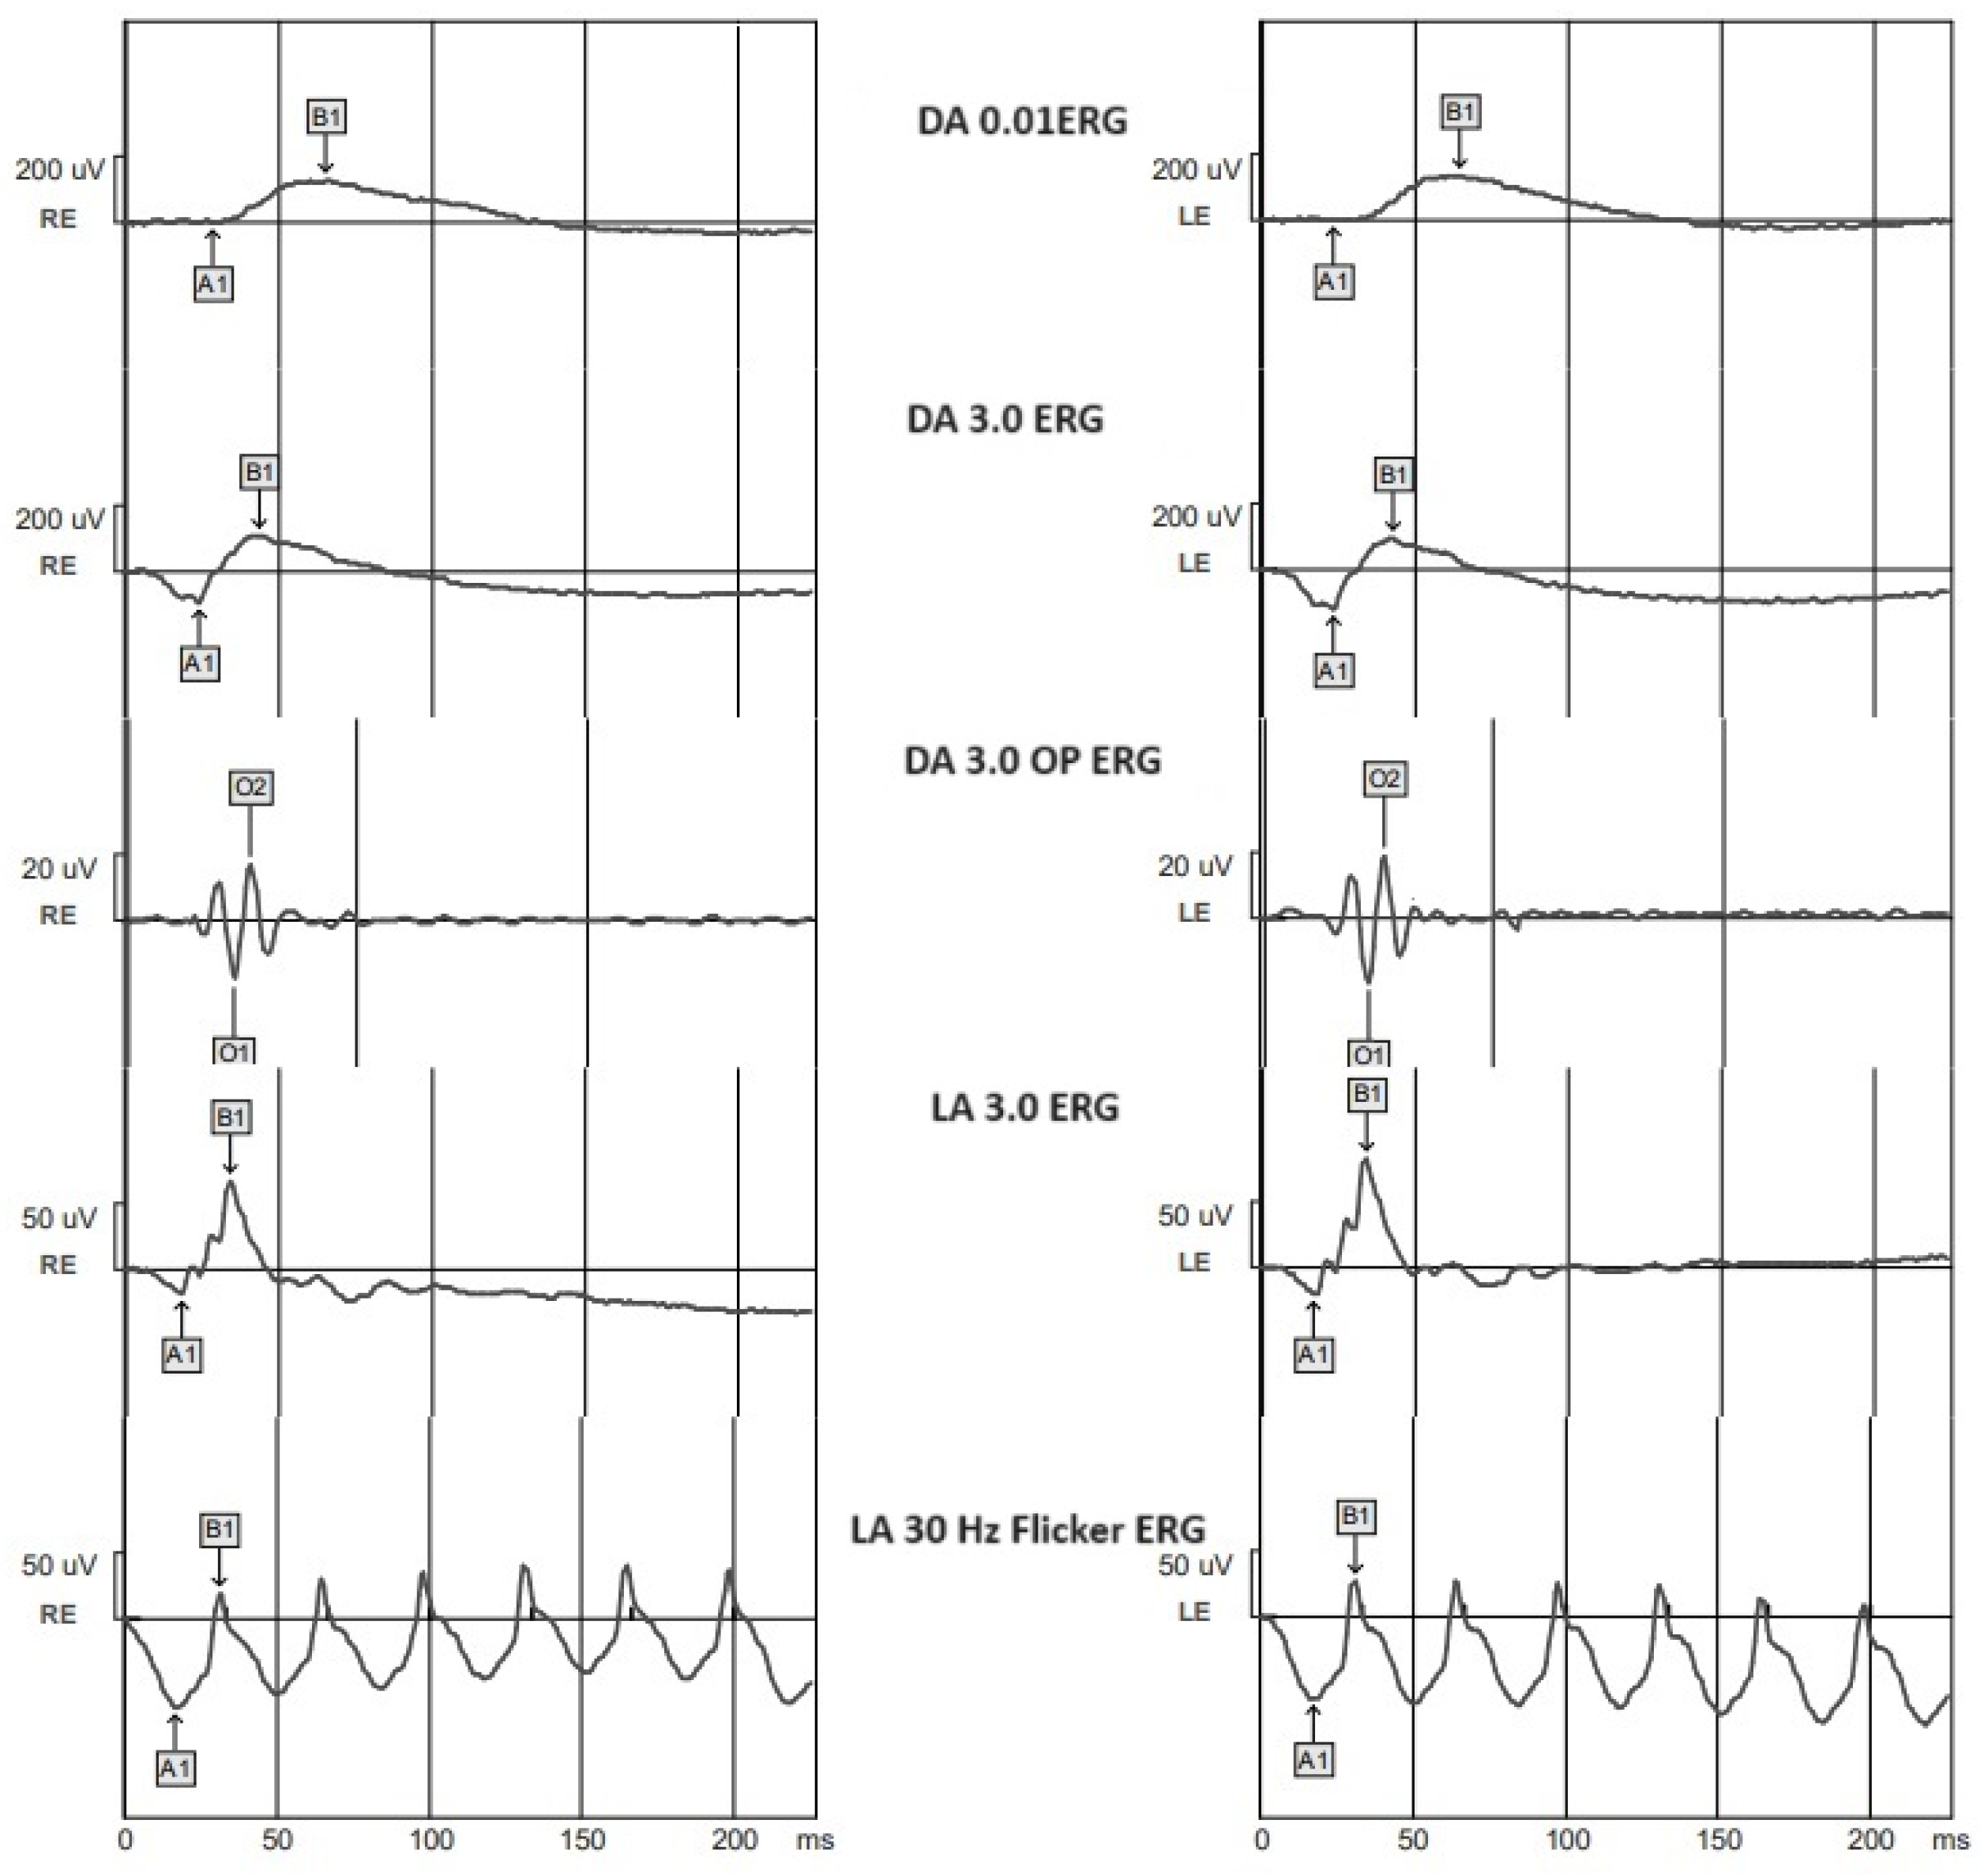
- ERG recording according to the ISCEV protocol:
- Mydriasis using 2.5% phenylephrine eye drops and 1% tropicamide;
- Skin preparation for the placement of the electrodes;
- Oxybuprocaine chlorhydrate in the lower conjunctival bag;
- Electrode settlement: we placed the active electrodes on the lower eyelid bilaterally, the reference electrodes on each orbital rim, and the ground electrode on the vertex;
- Twenty minutes of scotopic adaptation;
- Scotopic ERG recording: rod response: we used a dim blue flash of 0.01 cd.s.m−2, with a 2 s interval between flashes; combined rod–cone response: we used a white flash of 3.0 cd.s.m−2, with a 10 s interval between flashes; oscillatory potentials: we used a white flash of 2.0 cd.s.m−2, with a 165 s interval between flashes;
- Ten minutes of photopic adaptation;
- Light-adapted ERG recording: single-flash cone response: we used a 3.0 cd.s.m−2 stimulus, with a background luminance of 30 cd.s.m−2 and a 0.5 s interval between flashes; 30 Hz flicker: 30 stimuli of 3.0 cd.s.m−2 per second.
2.3. Data Analysis
3. Results
4. Discussion
5. Conclusions
Author Contributions
Funding
Institutional Review Board Statement
Informed Consent Statement
Data Availability Statement
Conflicts of Interest
References
- Flaxman, S.R.; Bourne, R.R.A.; Resnikoff, S.; Ackland, P.; Braithwaite, T.; Cicinelli, M.V.; Das, A.; Jonas, J.B.; Keeffe, J.; Kempen, J.H.; et al. Global causes of blindness and distance vision impairment 1990–2020: A systematic review and meta-analysis. Lancet Glob. Health 2017, 5, 1221–1234. [Google Scholar] [CrossRef] [PubMed]
- Engelgau, M.M.; Geiss, L.S.; Saaddine, J.B.; Boyle, J.P.; Benjamin, S.M.; Gregg, E.W.; Tierney, E.F.; Rios-Burrows, N.; Mokdad, A.H.; Ford, E.S.; et al. The Evolving diabetes burden in the United States. Ann. Intern. Med. 2004, 140, 945–950. [Google Scholar] [CrossRef] [PubMed]
- Tyrberg, M.; Lindblad, U.; Melander, A.; Lövestam-Adrian, M.; Ponjavic, V.; Andréasson, S. Electrophysiological studies in newly onset type 2 diabetes without visible vascular retinopathy. Doc. Ophthalmol. 2011, 123, 193–198. [Google Scholar] [CrossRef] [PubMed]
- Tonadea, D.; Kern, T.S. Photoreceptor cells and RPE contribute to the development of diabetic retinopathy. Prog. Retin. Eye Res. 2021, 83, 1009–1019. [Google Scholar] [CrossRef] [PubMed]
- Barber, A.J.; Antonetti, D.A.; Kern, T.S.; Reiter, C.E.N.; Soans, R.S.; Krady, J.K.; Levison, S.W.; Gardner, T.W.; Bronson, S.K. The Ins2Akita mouse as a model of early retinal com-plications in diabetes. Investig. Ophthalmol. Vis. Sci. 2005, 46, 2210–2218. [Google Scholar] [CrossRef] [PubMed]
- Barber, A.J.; Gardner, T.W.; Abcouwer, S.F. The significance of vascular and neural apoptosis to the pathology of diabetic retinopathy. Investig. Ophthalmol. Vis. Sci. 2011, 52, 1156–1163. [Google Scholar] [CrossRef] [PubMed]
- Villarroel, M.; Ciudin, A.; Hernández, C.; Simó, R. Neurodegeneration: An early event of diabetic retinopathy. World J. Diabetes 2010, 15, 257–264. [Google Scholar] [CrossRef]
- McAnany, J.J.; Persidina, O.S.; Park, J.C. Clinical electroretinography in diabetic retinopathy: A review. Surv. Ophthalmol. 2021, 67, 712–722. [Google Scholar] [CrossRef]
- Ştefănescu-Dima, A.; Corîci, C.A.; Mănescu, M.R.; Sas, T.N.; Iancău, M.; Mocanu, C.L. Posterior vitreous detachment and macular anatomical changes—A tomographic-electroretinographic study. Rom. J. Morphol. Embryol. 2016, 57 (Suppl. 2), 751–758. [Google Scholar]
- Wilkinson, C.P.; Ferris FL 3rd Klein, R.E.; Lee, P.P.; Agardh, C.D.; Davis, M.; Dills, D.; Kampik, A.; Pararajasegaram, R.; Verdaguer, J.T. Proposed international clinical diabetic retinopathy and diabetic macular edema disease severity scales. Ophthalmology 2003, 110, 1677–1682. [Google Scholar] [CrossRef]
- McCulloch, D.L.; Marmor, M.F.; Brigell, M.G.; Hamilton, R.; Holder, G.E.; Tzekov, R.; Bach, M. ISCEV Standard for full-field clinical electroretinography (2015 update). Doc. Ophthalmol. 2014, 130, 1–12. [Google Scholar] [CrossRef]
- Bresnick, G.H.; Palta, M. Predicting progression to severe proliferative diabetic retinopathy. Arch. Ophthalmol. 1987, 105, 810–814. [Google Scholar] [CrossRef] [PubMed]
- Juen, S.; Kieselbach, G.F. Electrophysiological changes in juvenile diabetics without retinopathy. Arch. Ophthalmol. 1990, 108, 372–375. [Google Scholar] [CrossRef] [PubMed]
- Yoshida, A.; Kojima, M.; Ogasawara, H.; Ishiko, S. Oscillatory potentials and permeability of the blood-retinal barrier in noninsulin-dependent diabetic patients without retinopathy. Ophthalmology 1991, 98, 1266–1271. [Google Scholar] [CrossRef] [PubMed]
- Vadala, M.; Anastasi, M.; Lodato, G.; Cillino, S. Electroretinographic oscillatory potentials in insulin-dependent diabetes pa-tients: A long-term follow-up. Acta Ophthalmol. Scand. 2002, 80, 305–309. [Google Scholar] [CrossRef] [PubMed]
- Bresnick, G.H.; Palta, M. Oscillatory Potential Amplitudes. Arch. Ophthalmol. 1987, 105, 929–933. [Google Scholar] [CrossRef] [PubMed]
- Yonemura, D.; Aoki, T.; Tsuzuki, K. Electroretinogram in Diabetic Retinopathy. Arch. Ophthalmol. 1962, 68, 19–24. [Google Scholar] [CrossRef] [PubMed]
- Holopigian, K.; Seiple, W.; Lorenzo, M.; Carr, R. A comparison of photopic and scotopic electroretinographic changes in early diabetic retinopathy. Investig. Ophthalmol. Vis. Sci. 1992, 33, 2773–2780. [Google Scholar]
- Hancock, H.A.; Kraft, T.W. Oscillatory potential analysis and ergs of normal and diabetic rats. Investig. Ophthalmol. Vis. Sci. 2004, 45, 1002–1008. [Google Scholar] [CrossRef]
- Gualtieri, M.; Feitosa-Santana, C.; Lago, M.; Nishi, M.; Ventura, D.F. Early visual changes in diabetic patients with no retinopathy measured by color discrimination and electroretinography. Psychol. Neurosci. 2013, 6, 227–234. [Google Scholar] [CrossRef]
- Jamison, J.; Bush, R.; Lei, B.; Sieving, P. Characterization of the rod photoresponse isolated from the dark-adapted primate ERG. Vis. Neurosci. 2001, 18, 445–455. [Google Scholar] [CrossRef] [PubMed]
- Kim, M.; Kim, R.; Park, W.; Kim, I.; Park, Y. Electroretinography and retinal microvascular changes in type 2 diabetes. Acta Ophthalmol. 2020, 98, E807–E813. [Google Scholar] [CrossRef] [PubMed]
- Luu, C.D.; Szental, J.A.; Lee, S.-Y.; Lavanya, R.; Wong, T.Y. Correlation between retinal oscillatory potentials and retinal vascular caliber in type 2 diabetes. Investig. Ophthalmol. Vis. Sci. 2010, 51, 482–486. [Google Scholar] [CrossRef] [PubMed]
- Arden, G.B.; Sidman, R.L.; Arap, W.; Schlingemann, R.O. Spare the rod and spoil the eye. Br. J. Ophthalmol. 2005, 89, 764–769. [Google Scholar] [CrossRef] [PubMed]
- Arden, G.B.; Sivaprasad, S. Hypoxia and oxidative stress in the causation of diabetic retinopathy. Curr. Diabetes Rev. 2011, 7, 291–304. [Google Scholar] [CrossRef] [PubMed]
- Chen, H.; Zhang, M.; Huang, S.; Wu, D. The photopic negative response of flash ERG in nonproliferative diabetic retinopathy. Doc. Ophthalmol. 2008, 117, 129–135. [Google Scholar] [CrossRef] [PubMed]
- Jansson, R.W.; Raeder, M.B.; Krohn, J. Photopic full-field electroretinography and optical coherence tomography in type 1 diabetic retinopathy. Graefes Arch. Clin. Exp. Ophthalmol. 2015, 253, 989–997. [Google Scholar] [CrossRef] [PubMed]
- Dan, A.O.; Ștefănescu-Dima, A.; Bălășoiu, A.T.; Puiu, I.; Mocanu, C.L.; Ionescu, M.; Tănasie, A.C.; Târtea, A.E.; Sfredel, V. Early Retinal Microvascular Alterations in Young Type 1 Diabetic Patients without Clinical Retinopathy. Diagnostics 2023, 13, 1648. [Google Scholar] [CrossRef]
- Mandecka, A.; Dawczynski Blum, J.M. Influence of flickering light on the retinal vessels in diabetic patients. Diabetes Care 2007, 30, 3048–3052. [Google Scholar] [CrossRef]
- Lecleire-Collet, A.; Audo, I.; Aout, M.; Girmens, J.-F.; Sofroni, R.; Erginay, A.; Le Gargasson, J.-F.; Mohand-Saïd, S.; Meas, T.; Guillausseau, P.-J.; et al. Evaluation of retinal function and flicker light-induced retinal vascular response in normotensive patients with diabetes without retinopathy. Investig. Ophthalmol. Vis. Sci. 2011, 52, 2861–2867. [Google Scholar] [CrossRef]
- Fukuo, M.; Kondo, M.; Hirose, A.; Fukushima, H.; Ikesugi, K.; Sugimoto, M.; Kato, K.; Uchigata, Y.; Kitano, S. Screening for diabetic retinopathy using new mydriasis-free, full-field flicker ERG recording device. Sci. Rep. 2016, 6, 36591. [Google Scholar] [CrossRef] [PubMed]
- Garhofer, G.; Zawinka, C.; Resch, H.; Kothy, P.; Schmetterer, L.; Dorner, G.T. Reduced response of retinal vessel diameters to flicker stimulation in patients with diabetes. Br. J. Ophthalmol. 2004, 88, 887–891. [Google Scholar] [CrossRef] [PubMed]
- Scimone, C.; Bramanti, P.; Ruggeri, A.; Donato, L.; Alafaci, C.; Crisafulli, C.; Mucciardi, M.; Rinaldi, C.; Sidoti, A.D.; Angelo, R. CCM3/SERPINI1 bidirectional promoter variants in patients with cerebral cavernous malformations: A molecular and func-tional study. BMC Med. Genet. 2016, 17, 74. [Google Scholar] [CrossRef] [PubMed]
- Maa, A.Y.; Feuer, W.J.; Davis, C.Q.; Pillow, E.K.; Brown, T.D.; Caywood, R.M.; Chasan, J.E.; Fransen, S.R. A novel device for accurate and efficient testing for vision-threatening diabetic retinopathy. J. Diabetes Its Complicat. 2015, 30, 524–532. [Google Scholar] [CrossRef] [PubMed]
- Zeng, Y.; Cao, D.; Yang, D.; Zhuang, X.; Hu, Y.; He, M.; Yu, H.; Wang, J.; Yang, C.; Zhang, L. Retinal vasculature–function correlation in non-proliferative diabetic retinopathy. Doc. Ophthalmol. 2019, 140, 129–138. [Google Scholar] [CrossRef] [PubMed]
- Danielescu, C.; Moraru, A.D.; Anton, N.; Bilha, M.I.; Donica, V.C.; Darabus, D.M.; Munteanu, M.; Stefanescu-Dima, A.S. The Learning Curve of Surgery of Diabetic Tractional Retinal Detachment-A Retrospective, Comparative Study. Medicina 2022, 59, 73. [Google Scholar] [CrossRef] [PubMed]
- Zeng, Y.; Cao, D.; Yang, D.; Zhuang, X.; Yu, H.; Hu, Y.; Zhang, Y.; Yang, C.; He, M.; Zhang, L. Screening for diabetic retinopathy in diabetic patients with a mydriasis-free, full-field flicker electroretinogram recording device. Doc. Ophthalmol. 2019, 140, 211–220. [Google Scholar] [CrossRef]
- Scimone, C.; Bramanti, P.; Ruggeri, A.; Katsarou, Z.; Donato, L.; Sidoti, A.; D’angelo, R. Detection of Novel Mutation in Ccm3 Causes Familial Cerebral Cavernous Malformations. J. Mol. Neurosci. 2015, 57, 400–403. [Google Scholar] [CrossRef]
- McAnany, J.J.; Park, J.C.; Chau, F.Y.; Leiderman, Y.I.; Lim, J.I.; Blair, N.P. Amplitude loss of the high-frequency flicker electroretinogram in early diabetic retinopathy. Retina 2019, 39, 2032–2039. [Google Scholar] [CrossRef]
- McAnany, J.J.; Chen, Y.F.; Liu, K.; Park, J.C. Nonlinearities in the flicker electroretinogram: A tool for studying retinal dys-function applied to early-stage diabetic retinopathy. Vision. Res. 2019, 161, 1–11. [Google Scholar] [CrossRef]
- McAnany, J.J.; Park, J.C. Temporal Frequency Abnormalities in Early-Stage Diabetic Retinopathy Assessed by Electroretino-graphy. Investig. Ophthalmol. Vis. Sci. 2018, 59, 4871–4879. [Google Scholar] [CrossRef]
- McAnany, J.J.; Park, J.C. Cone photoreceptor dysfunction in early-stage diabetic retinopathy: Association between the acti-vation phase of cone phototransduction and the flicker electroretinogram. Investig. Ophthalmol. Vis. Sci. 2019, 60, 64–72. [Google Scholar] [CrossRef]
- Scimone, C.; Donato, L.; Alafaci, C.; Granata, F.; Rinaldi, C.; Longo, M.; D’angelo, R.; Sidoti, A. High-Throughput Sequencing to Detect Novel Likely Gene-Disrupting Variants in Pathogenesis of Sporadic Brain Arteriovenous Malformations. Front. Genet. 2020, 11, 146. [Google Scholar] [CrossRef]
- Arden, G.B.; Sivaprasad, S. The pathogenesis of early retinal changes of diabetic retinopathy. Doc. Ophthalmol. 2012, 124, 15–26. [Google Scholar] [CrossRef]
- Indrayan, A.; Mishra, A. The importance of small samples in medical research. J. Postgrad. Med. 2021, 67, 219–223. [Google Scholar] [CrossRef]


| Parameter | CONTROL | DR- | NDR | PPDR | PDR |
|---|---|---|---|---|---|
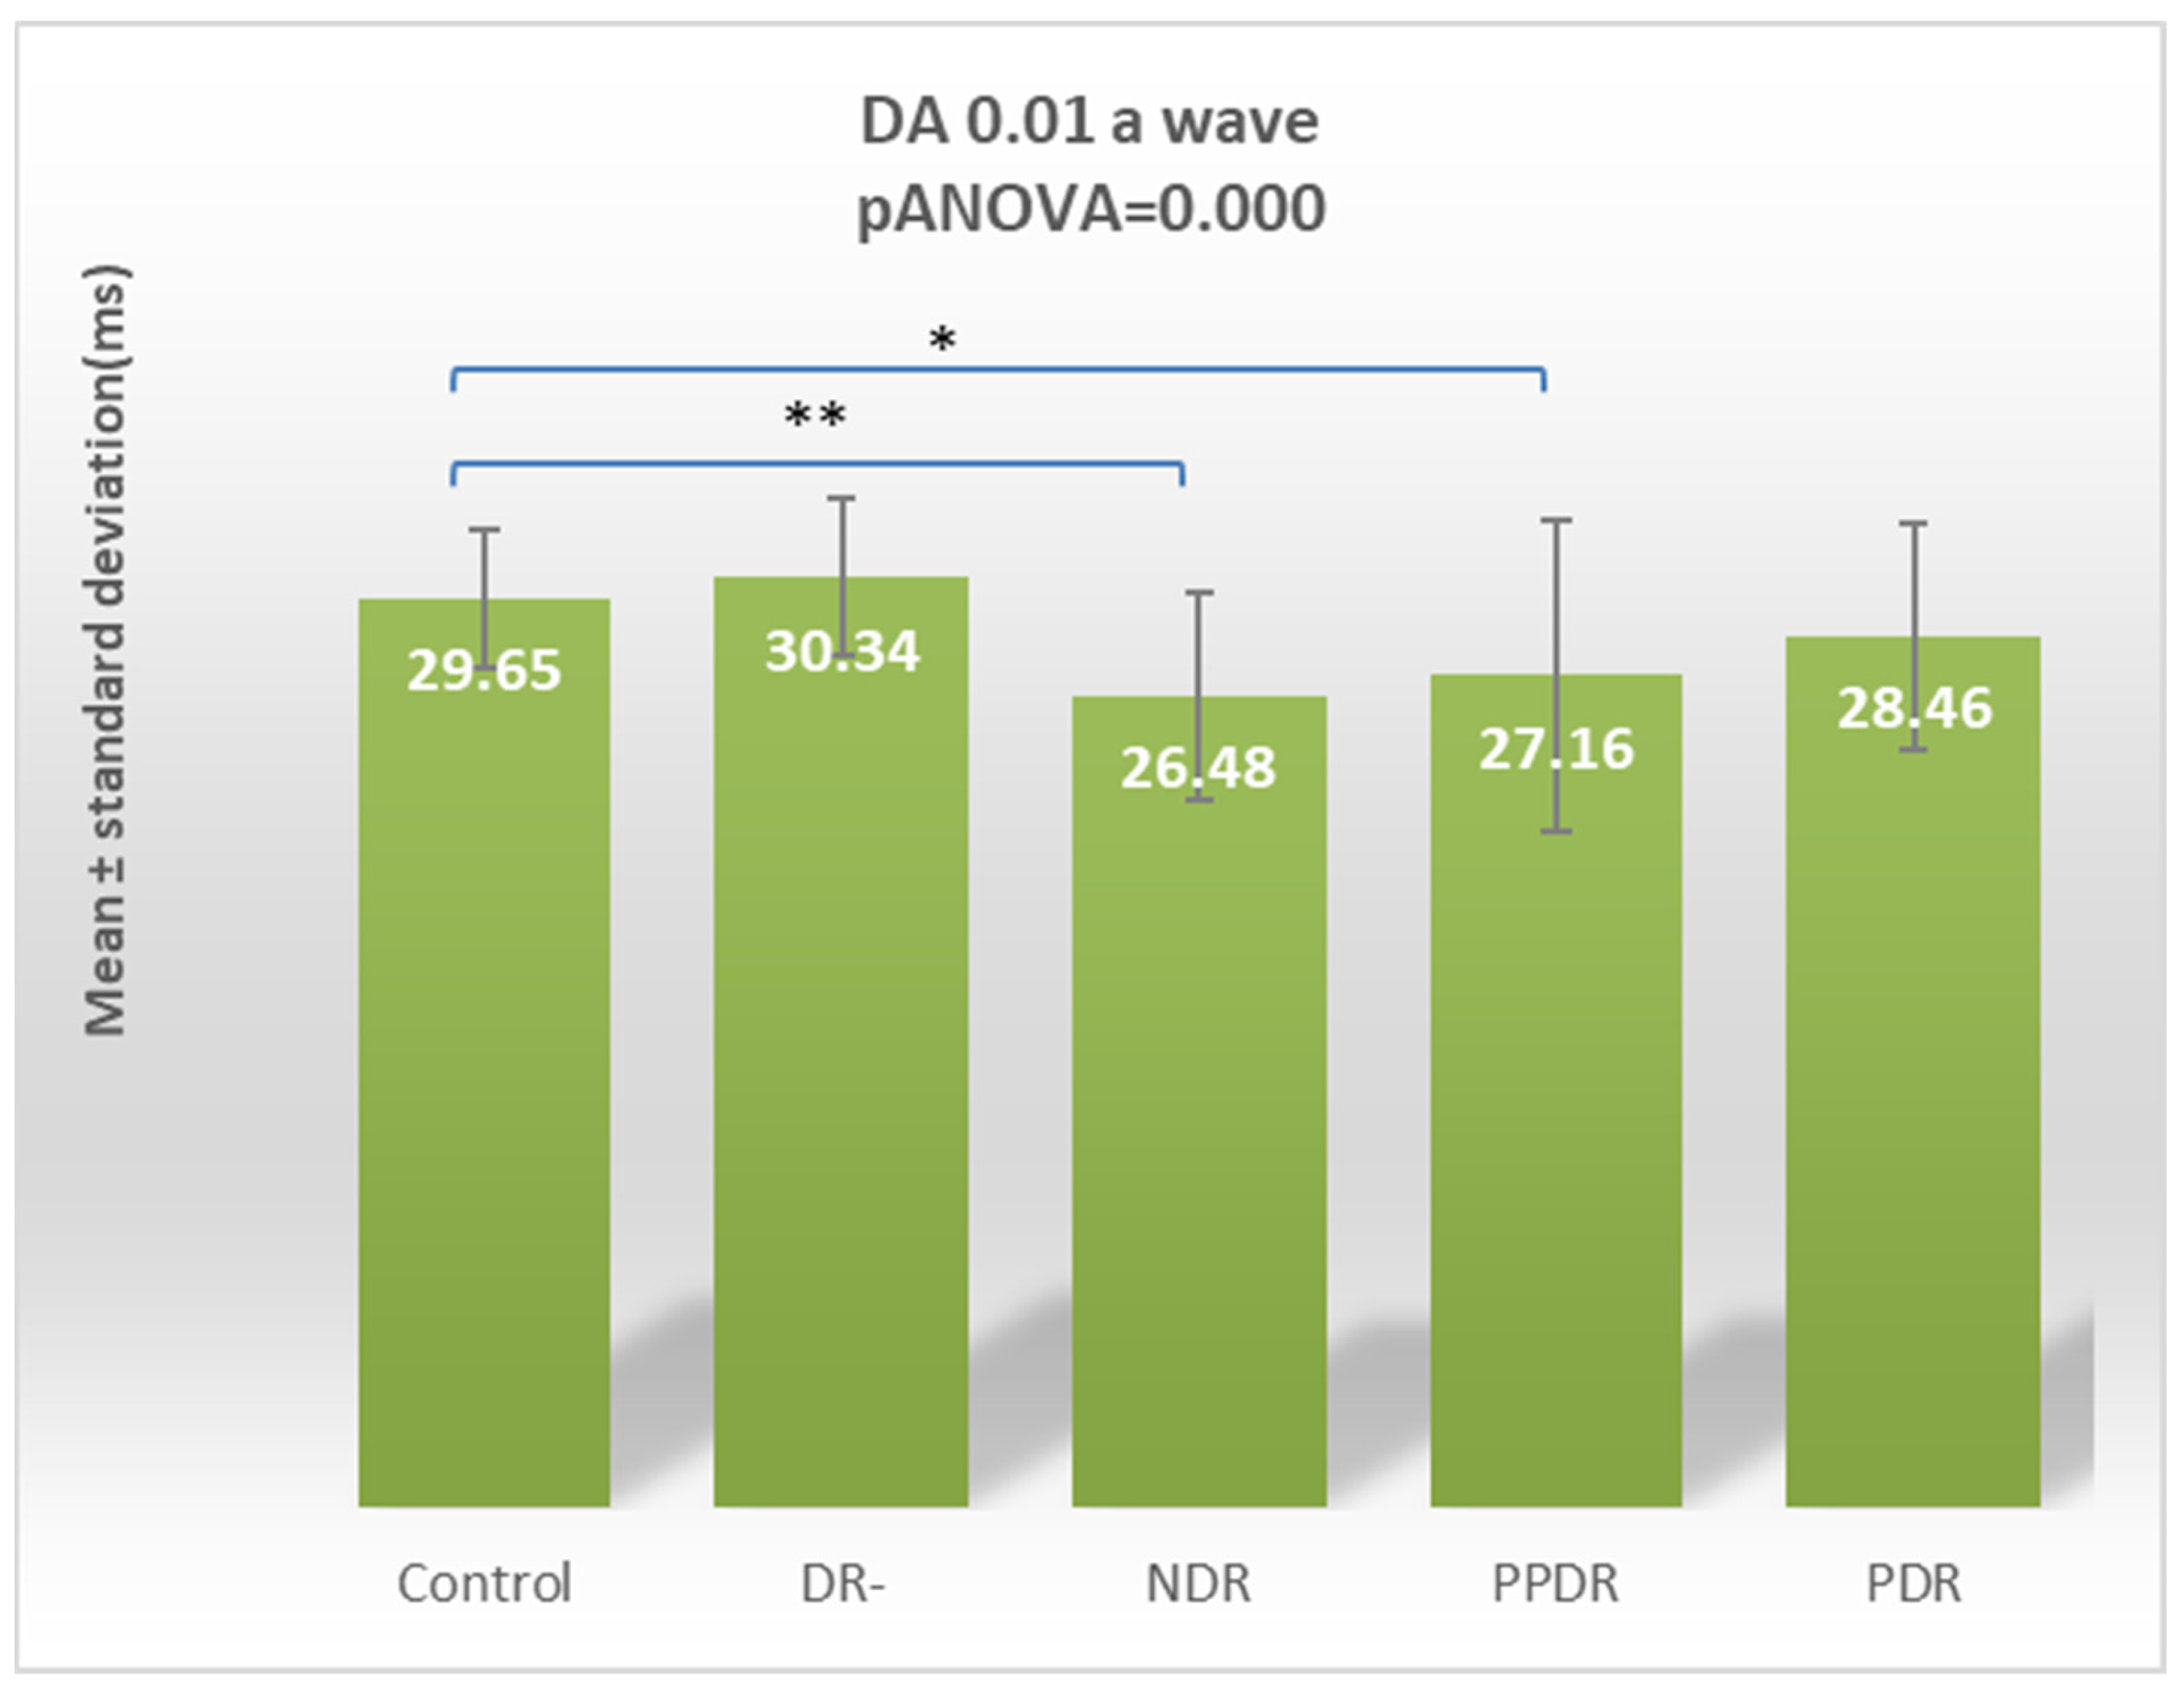
| DA 0.01 ERG a | 29.65 ± 2.29 | 30.34 ± 2.57 | 26.48 ± 3.36 | 27.16 ± 5.06 | 28.46 ± 3.70 |
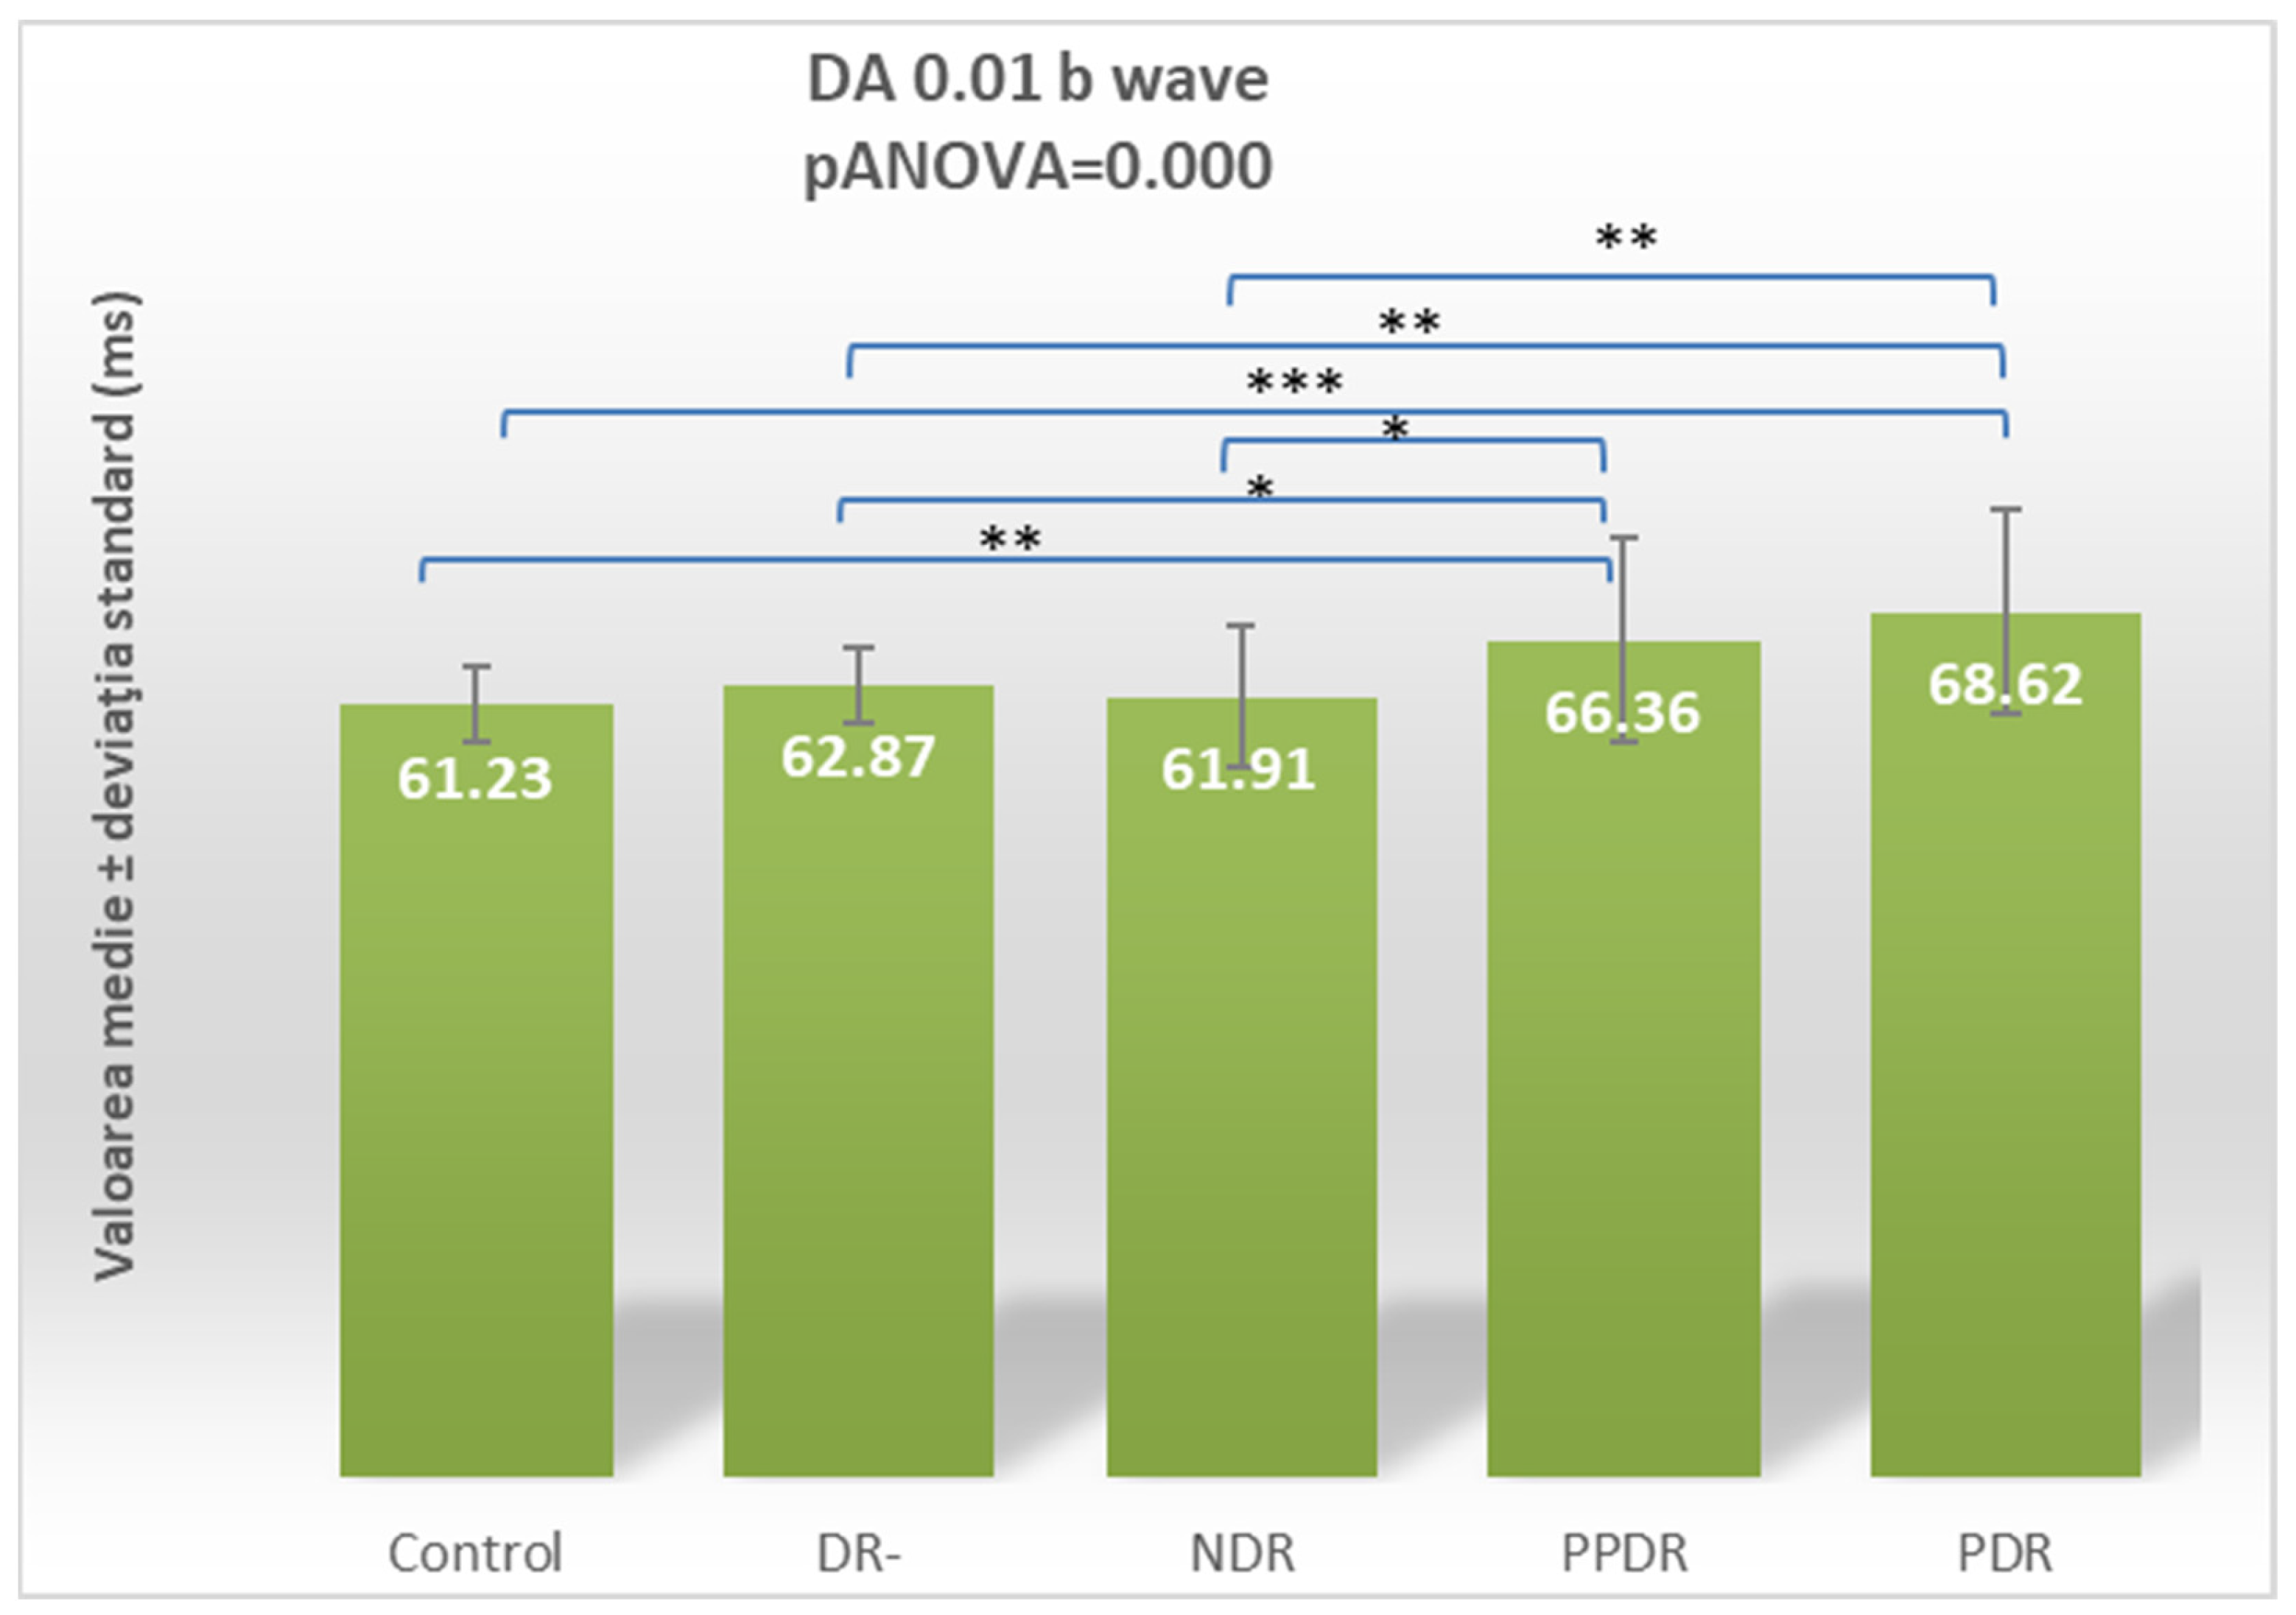
| DA 0.01 ERG b | 61.23 ± 2.99 | 62.87 ± 2.99 | 61.91 ± 5.52 | 66.36 ± 8.12 | 68.62 ± 8.01 |
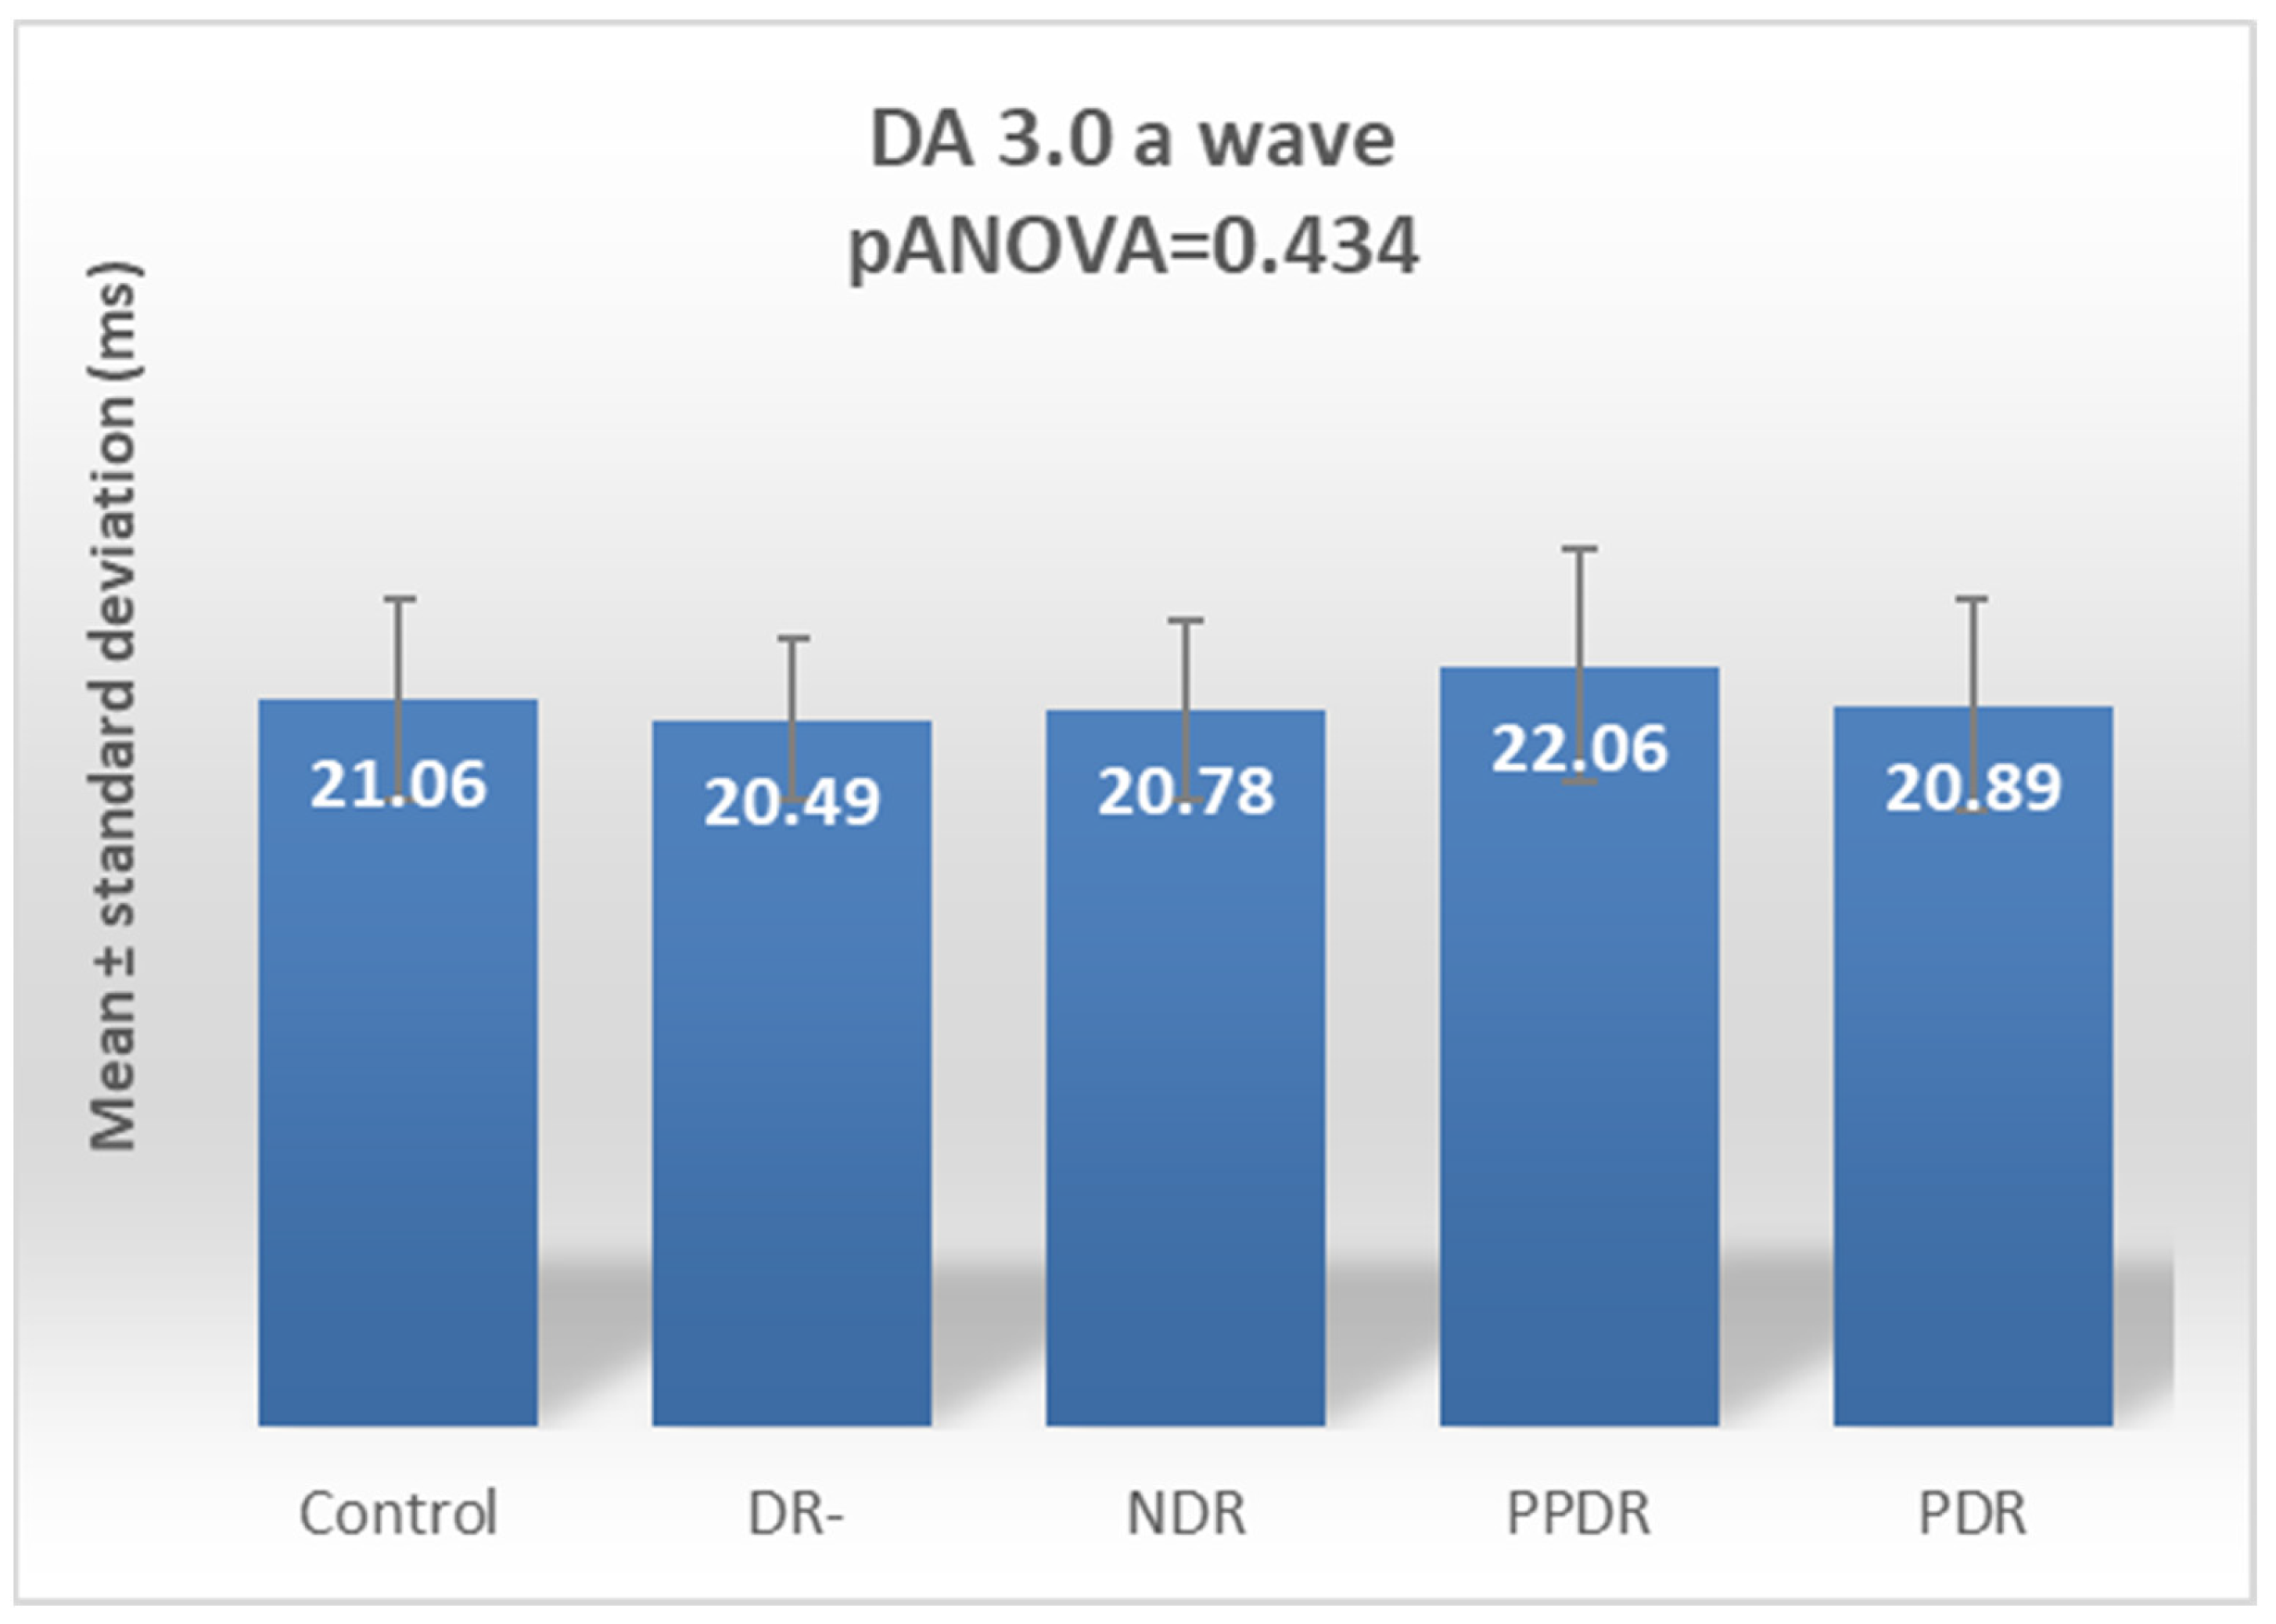
| DA 3.0 ERG a | 21.06 ± 2.92 | 20.49 ± 2.30 | 20.78 ± 2.60 | 22.06 ± 3.35 | 20.89 ± 3.04 |
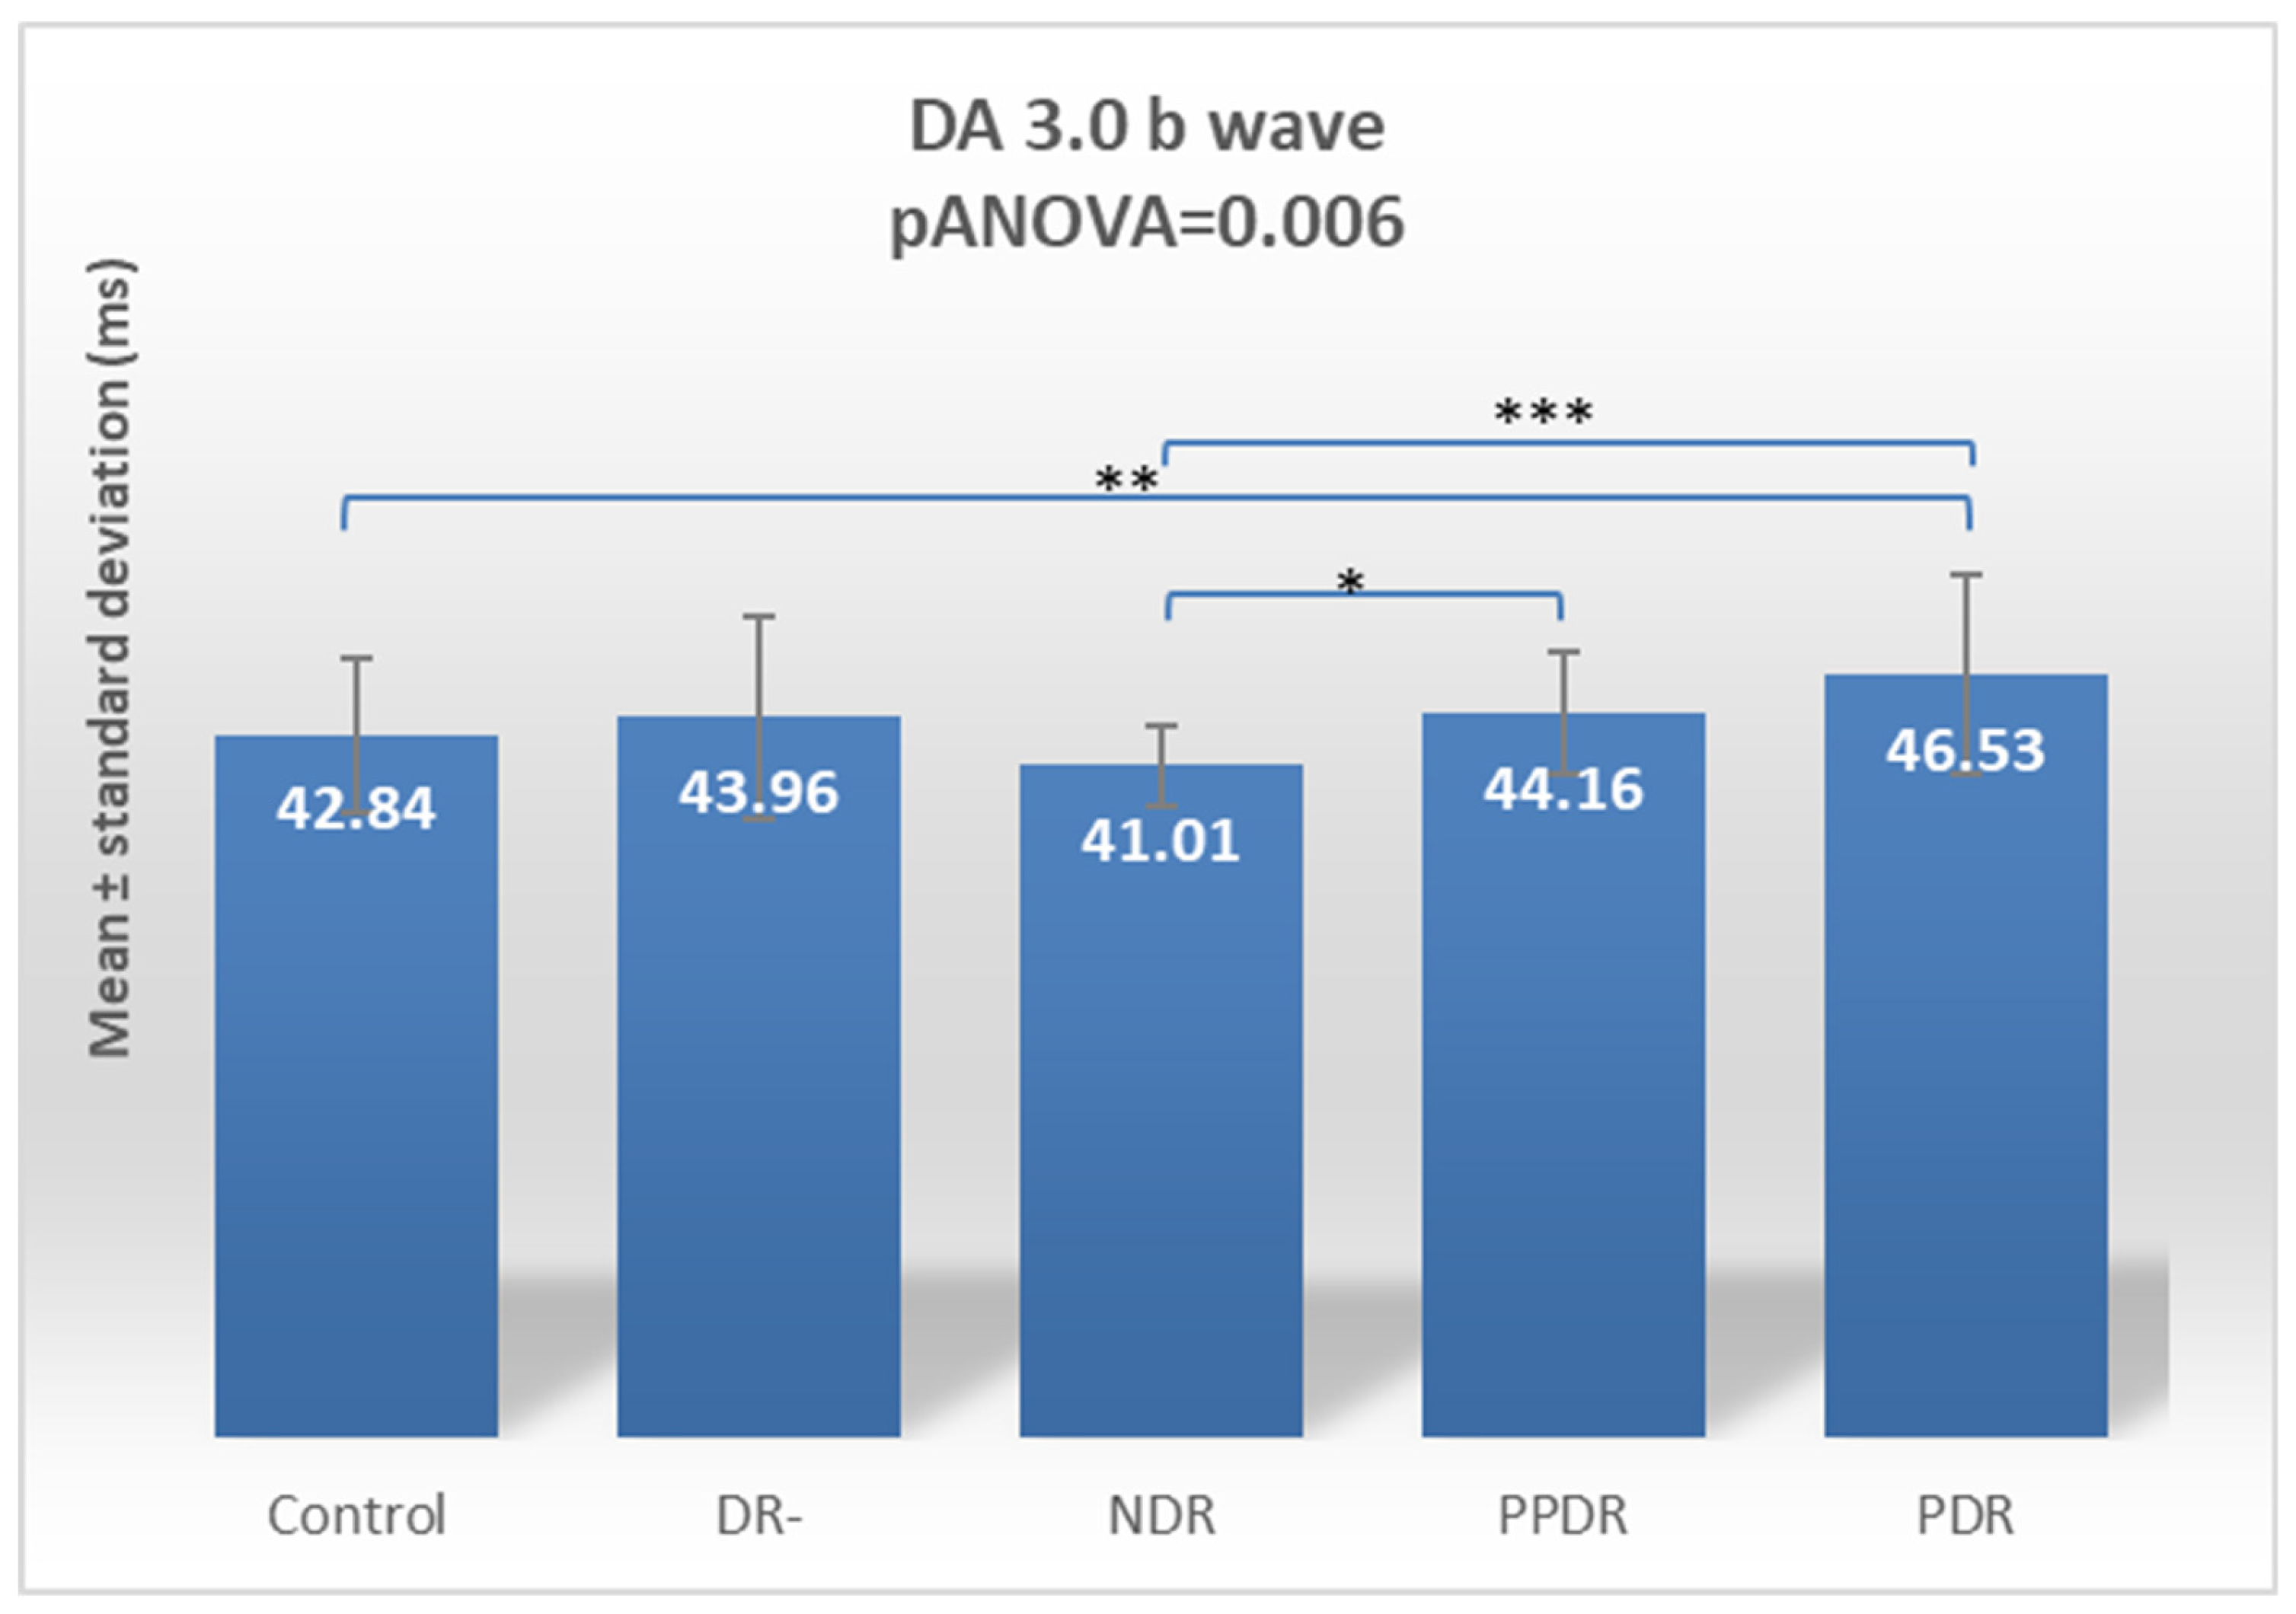
| DA 3.0 ERG b | 42.84 ± 4.80 | 43.96 ± 6.19 | 41.01 ± 2.50 | 44.16 ± 3.78 | 46.53 ± 6.11 |
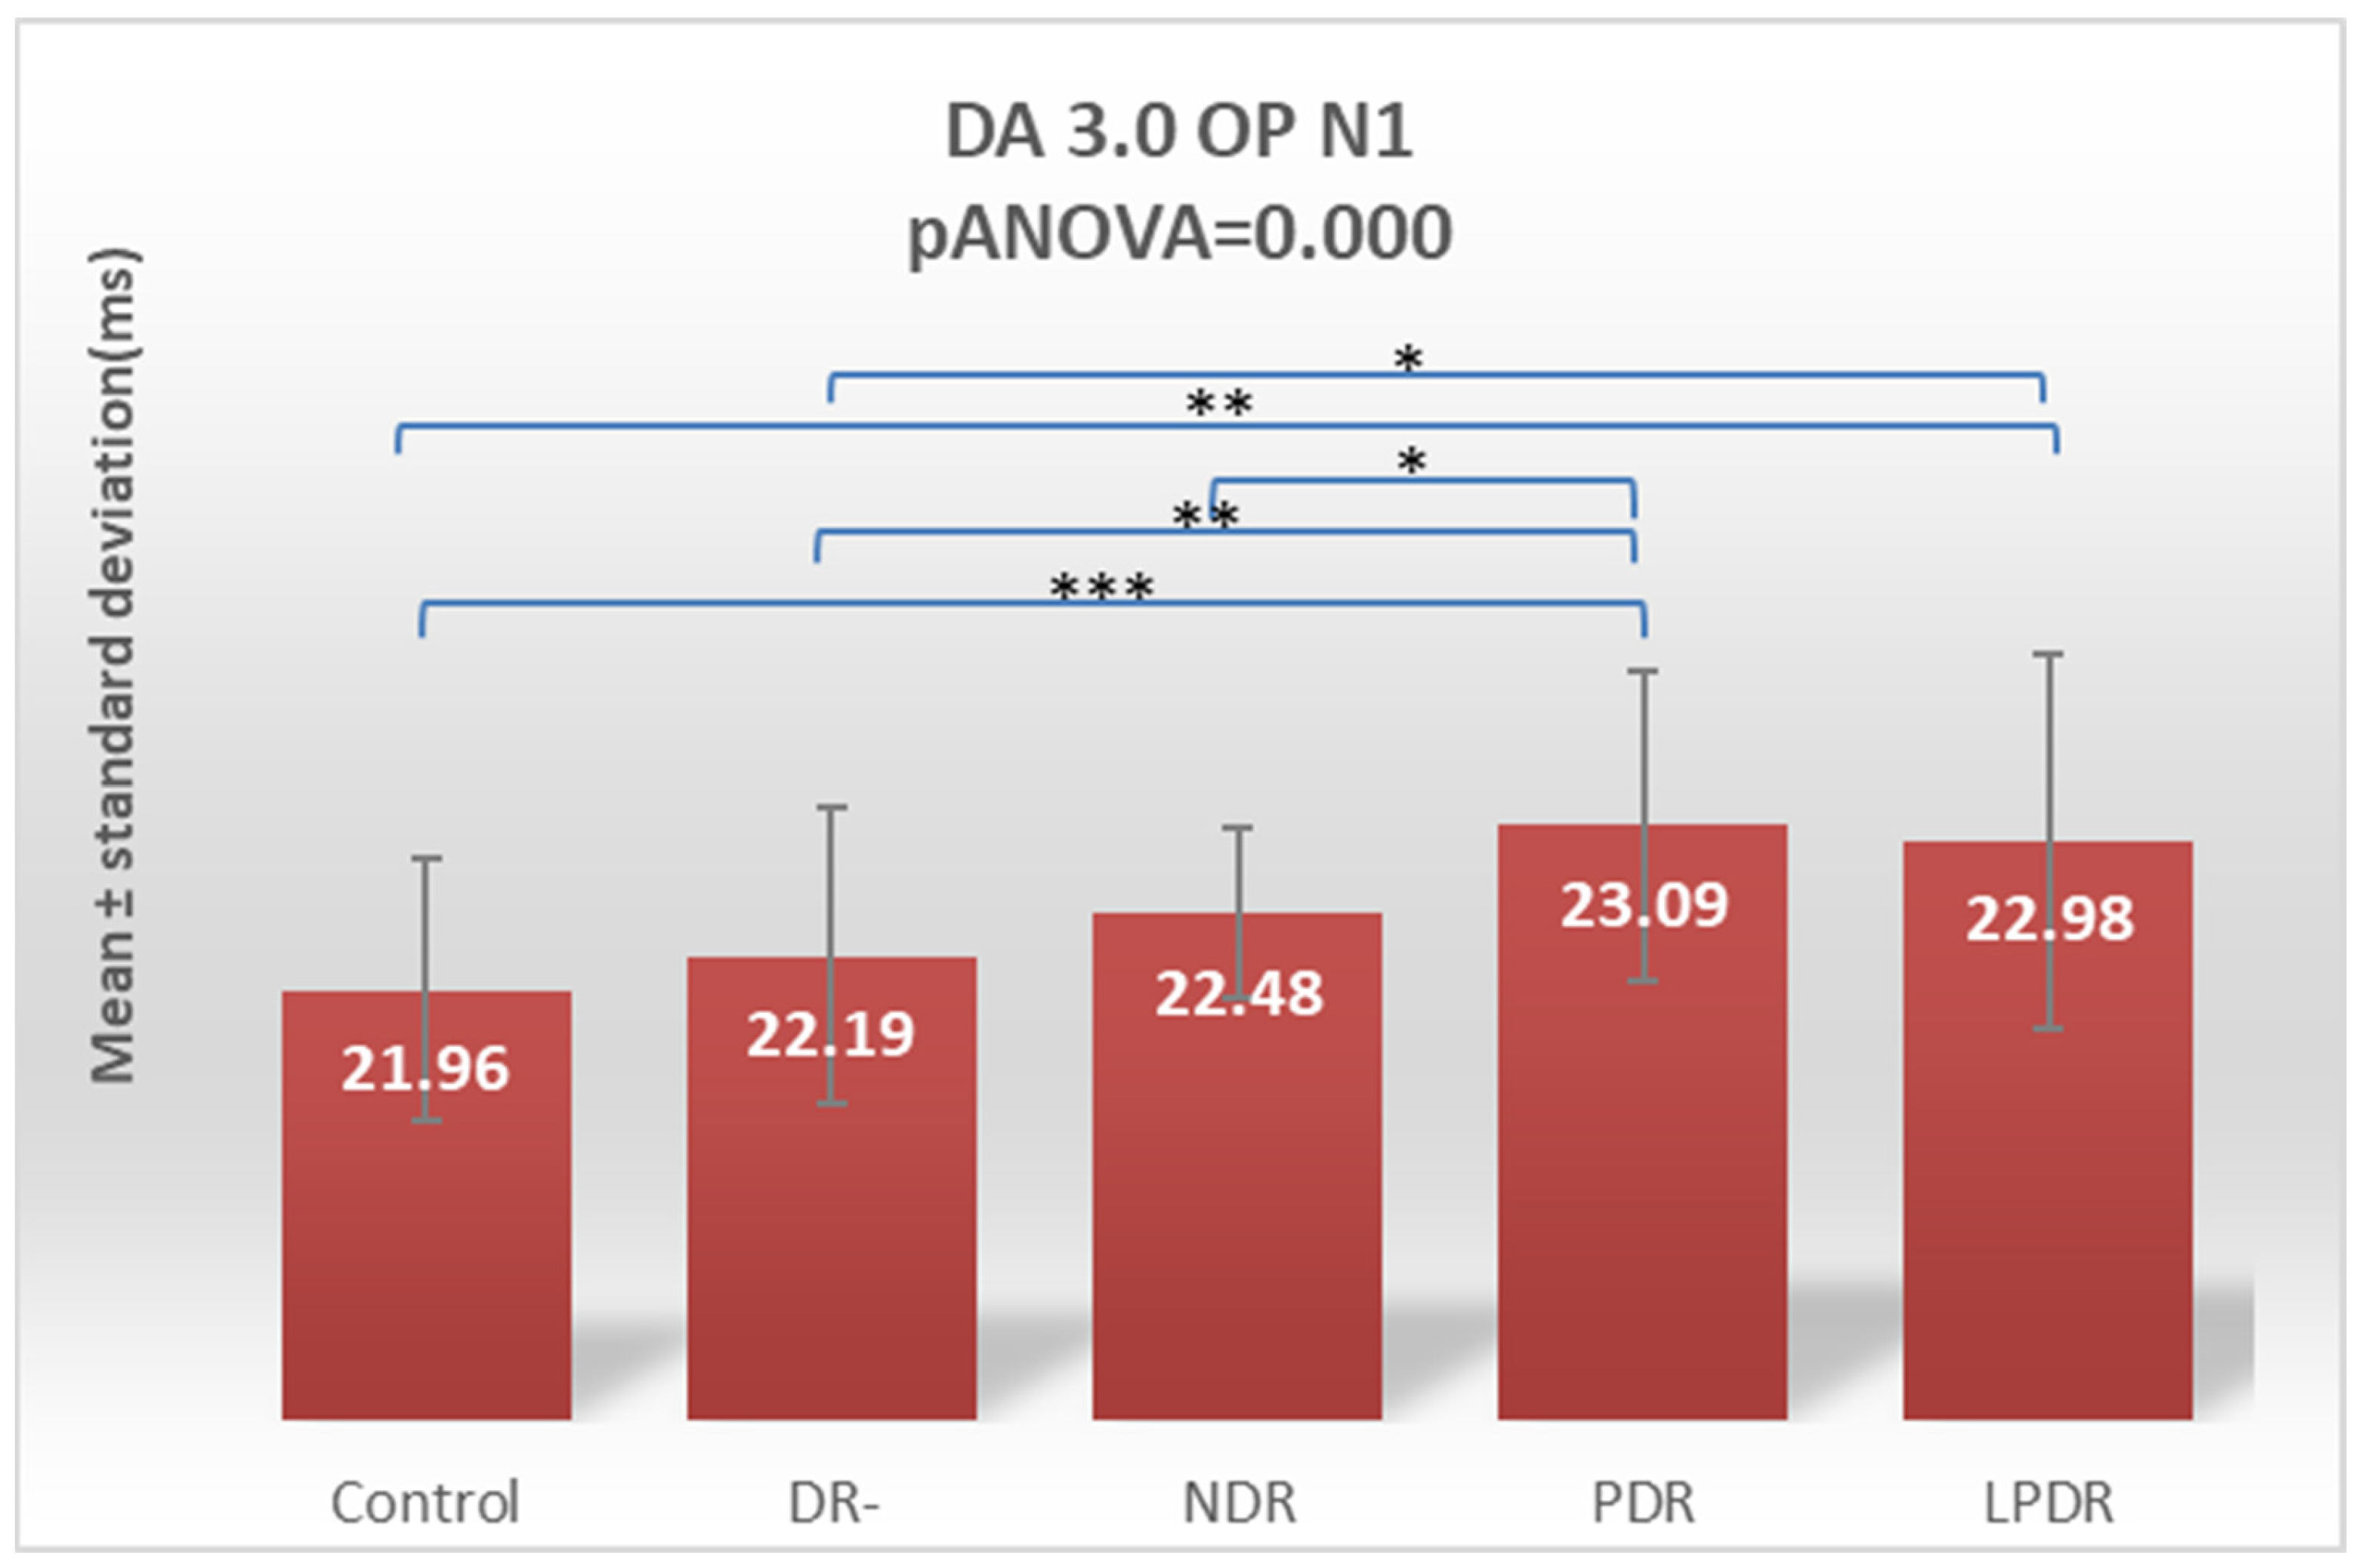
| OP N1 | 21.96 ± 0.89 | 22.19 ± 1.02 | 22.48 ± 0.58 | 23.09 ± 1.06 | 22.98 ± 1.28 |
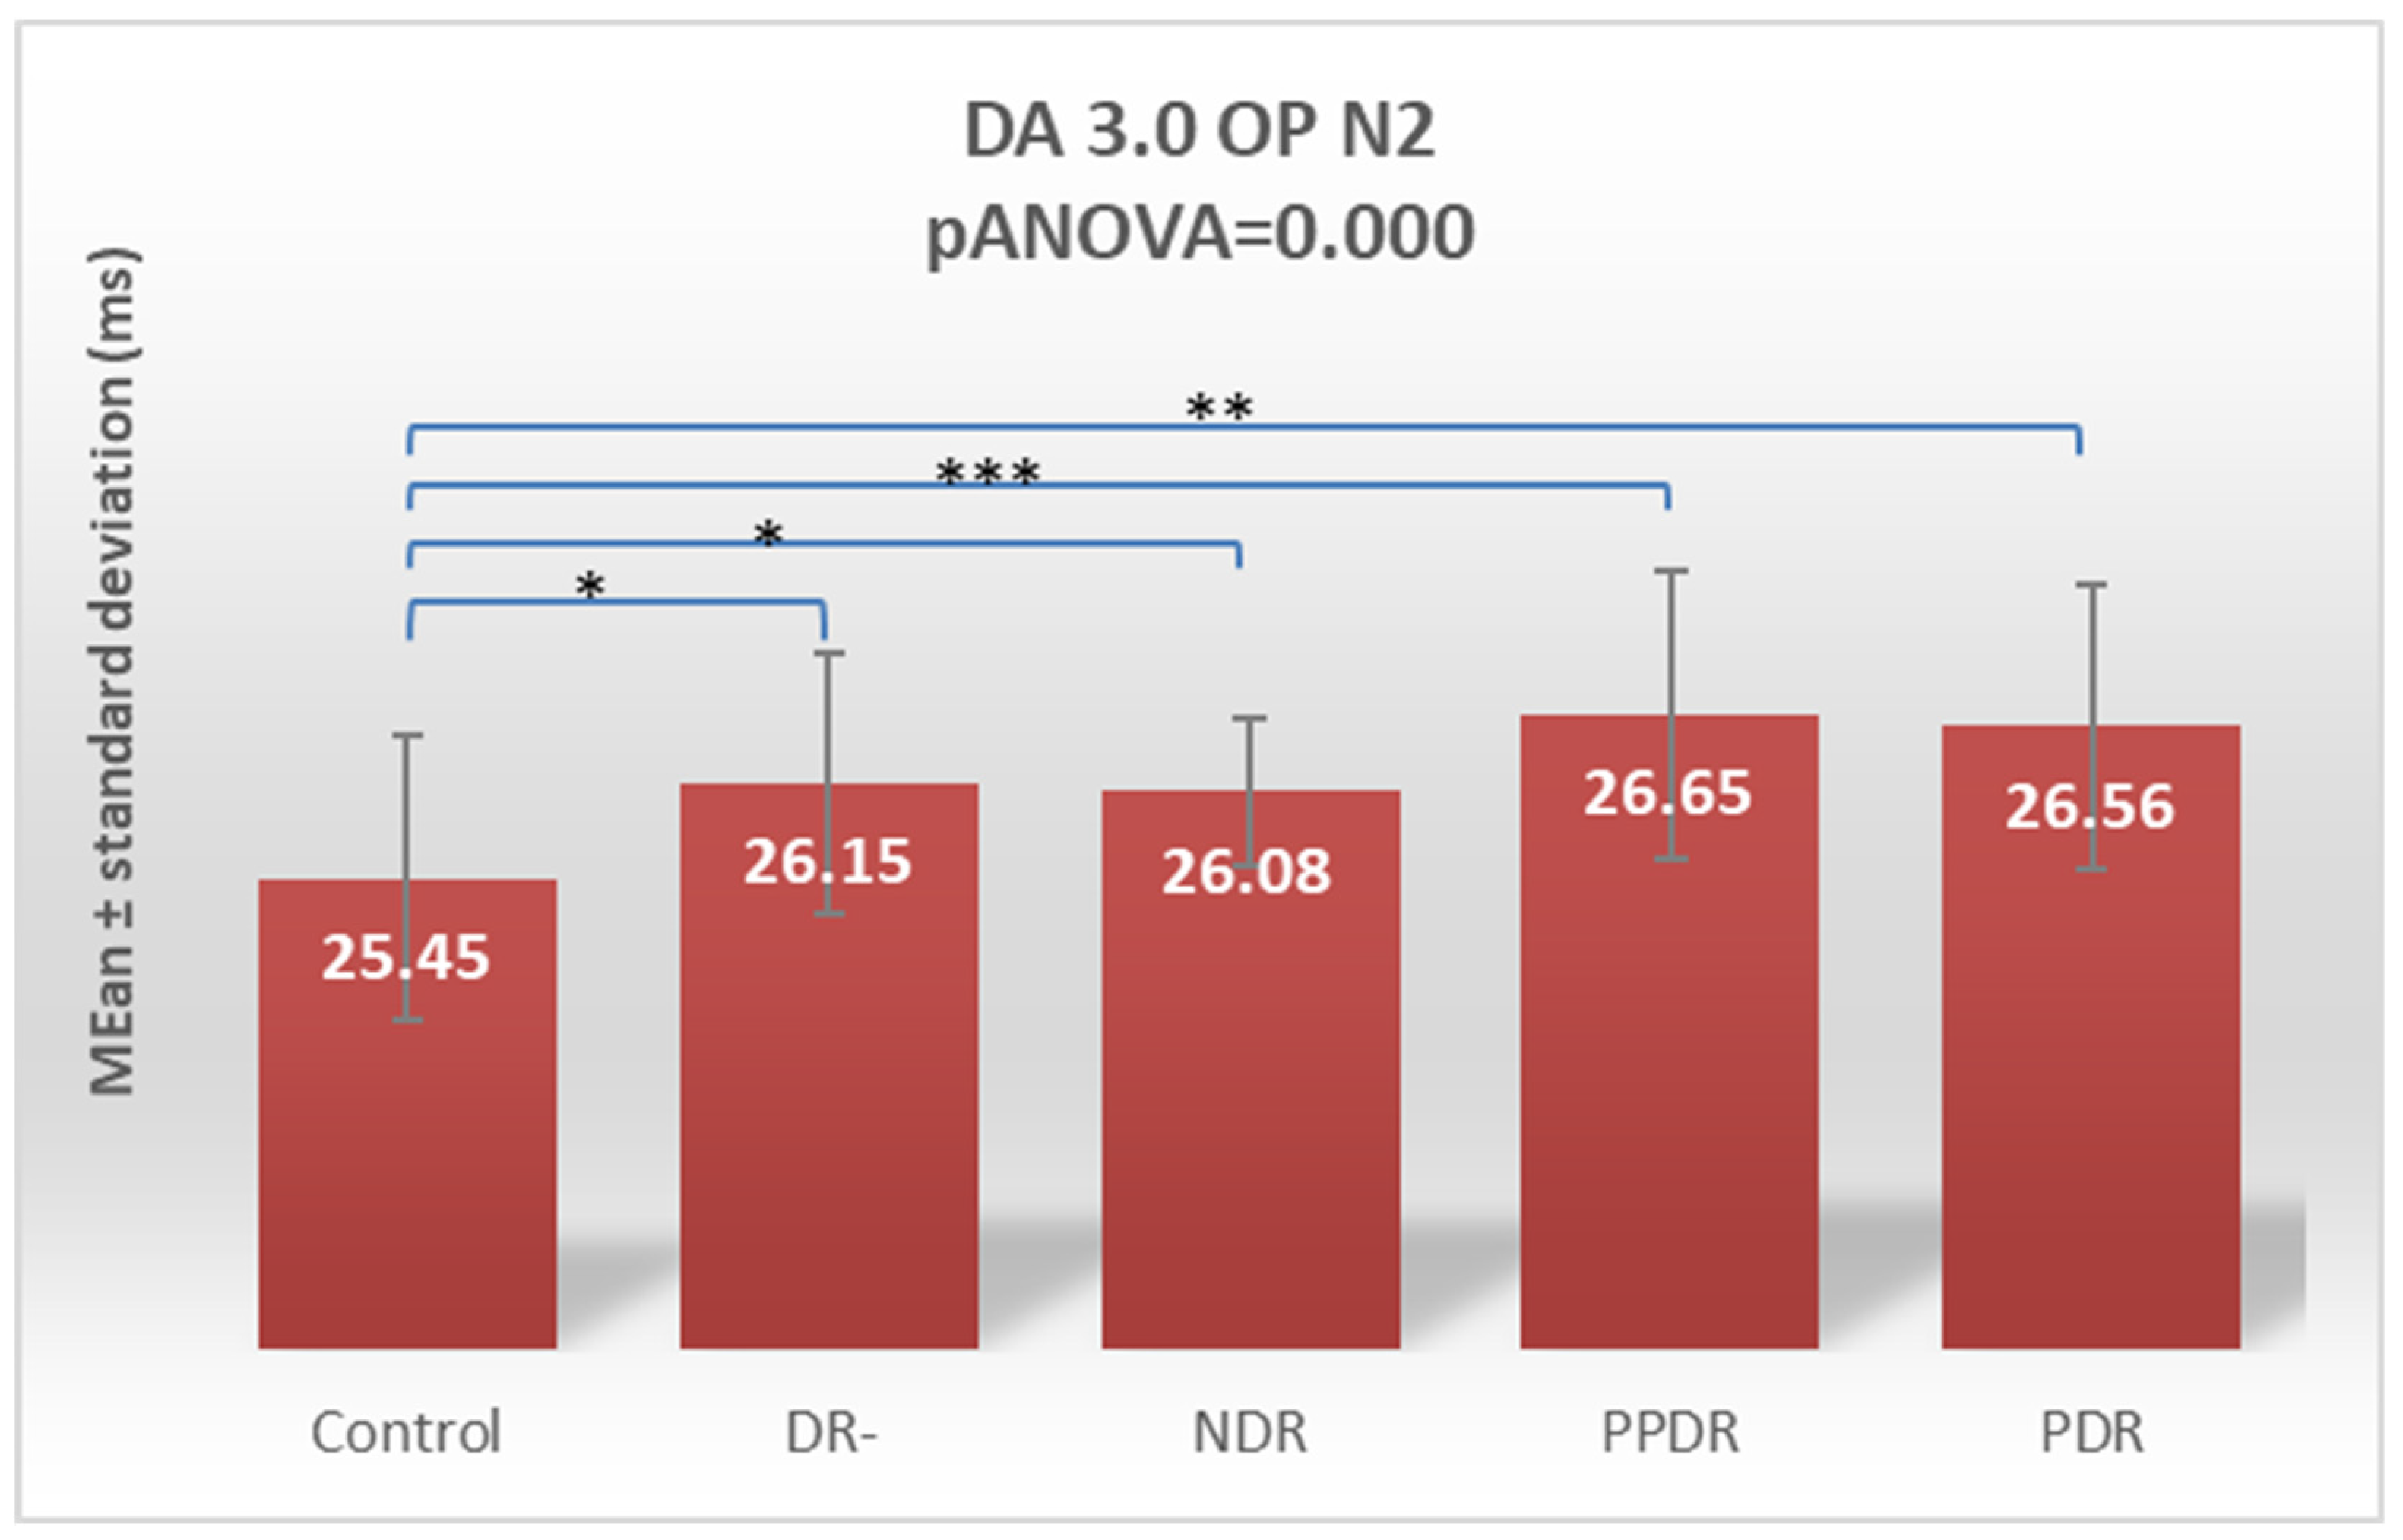
| OP N2 | 25.45 ± 1.04 | 26.15 ± 0.96 | 26.08 ± 0.54 | 26.65 ± 1.05 | 26.56 ± 1.04 |
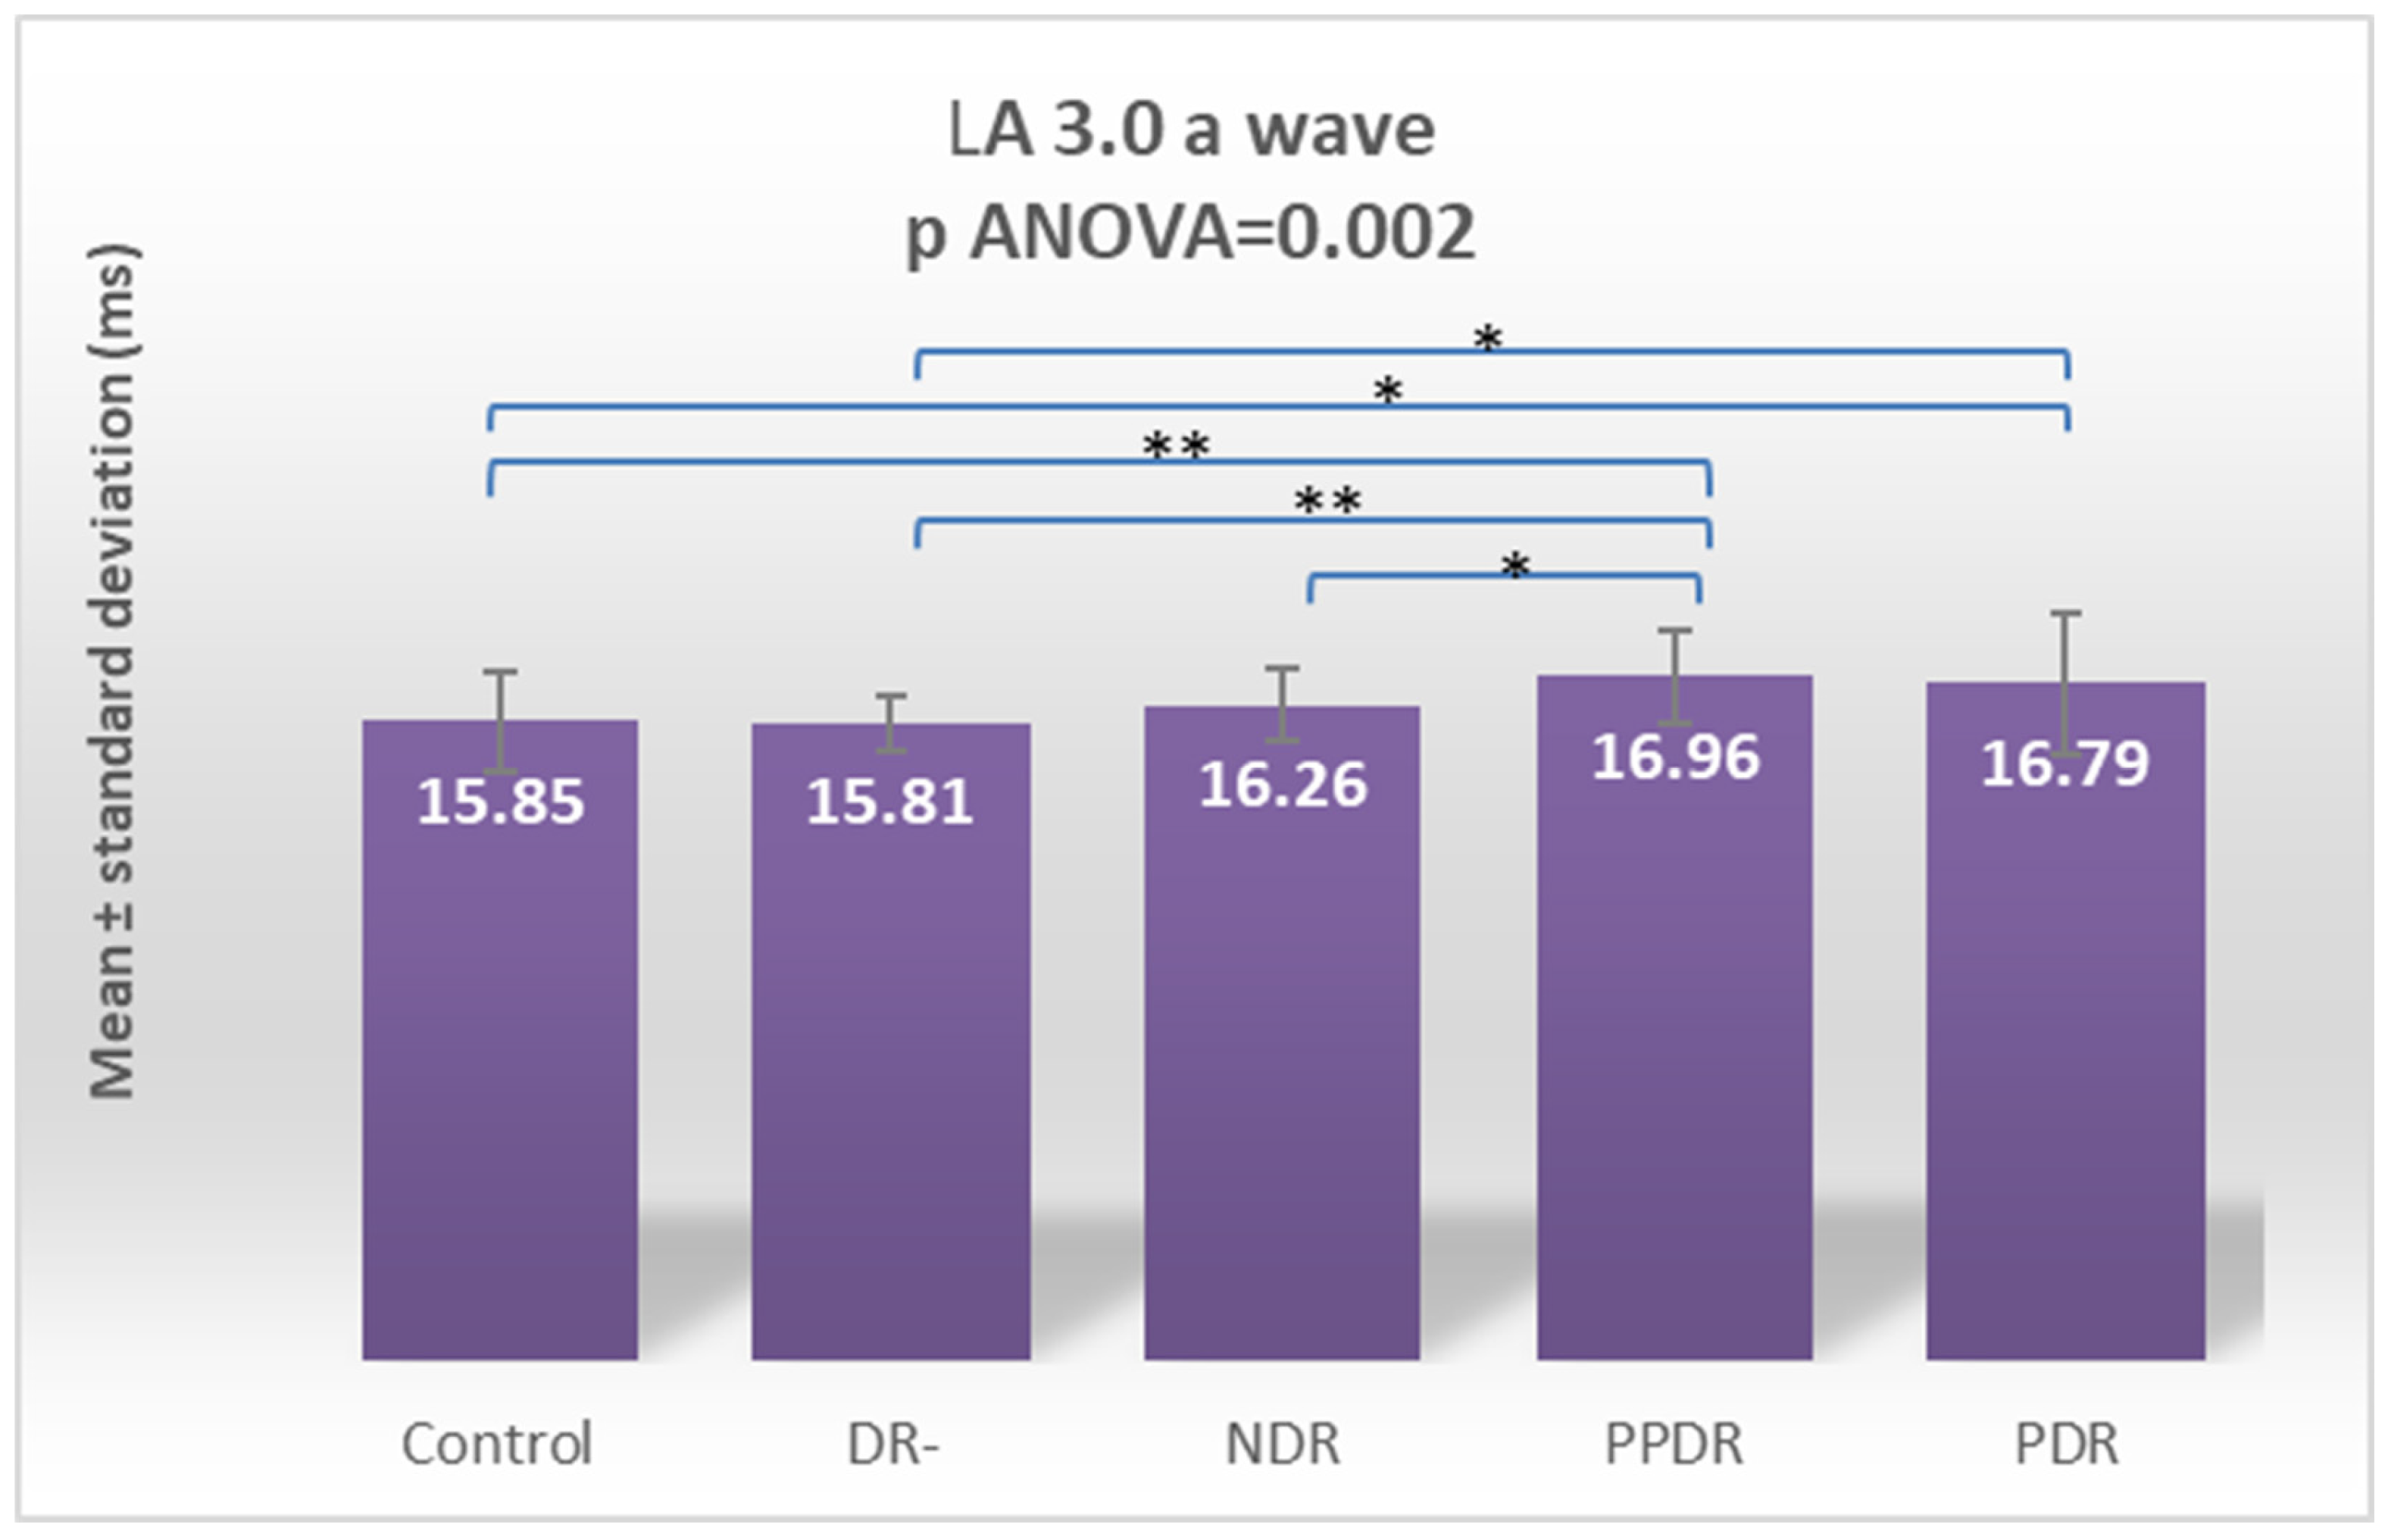
| LA 3.0 ERG a | 15.85 ± 1.26 | 15.81 ± 0.69 | 16.21 ± 0.91 | 16.99 ± 1.16 | 16.79 ±1.73 |
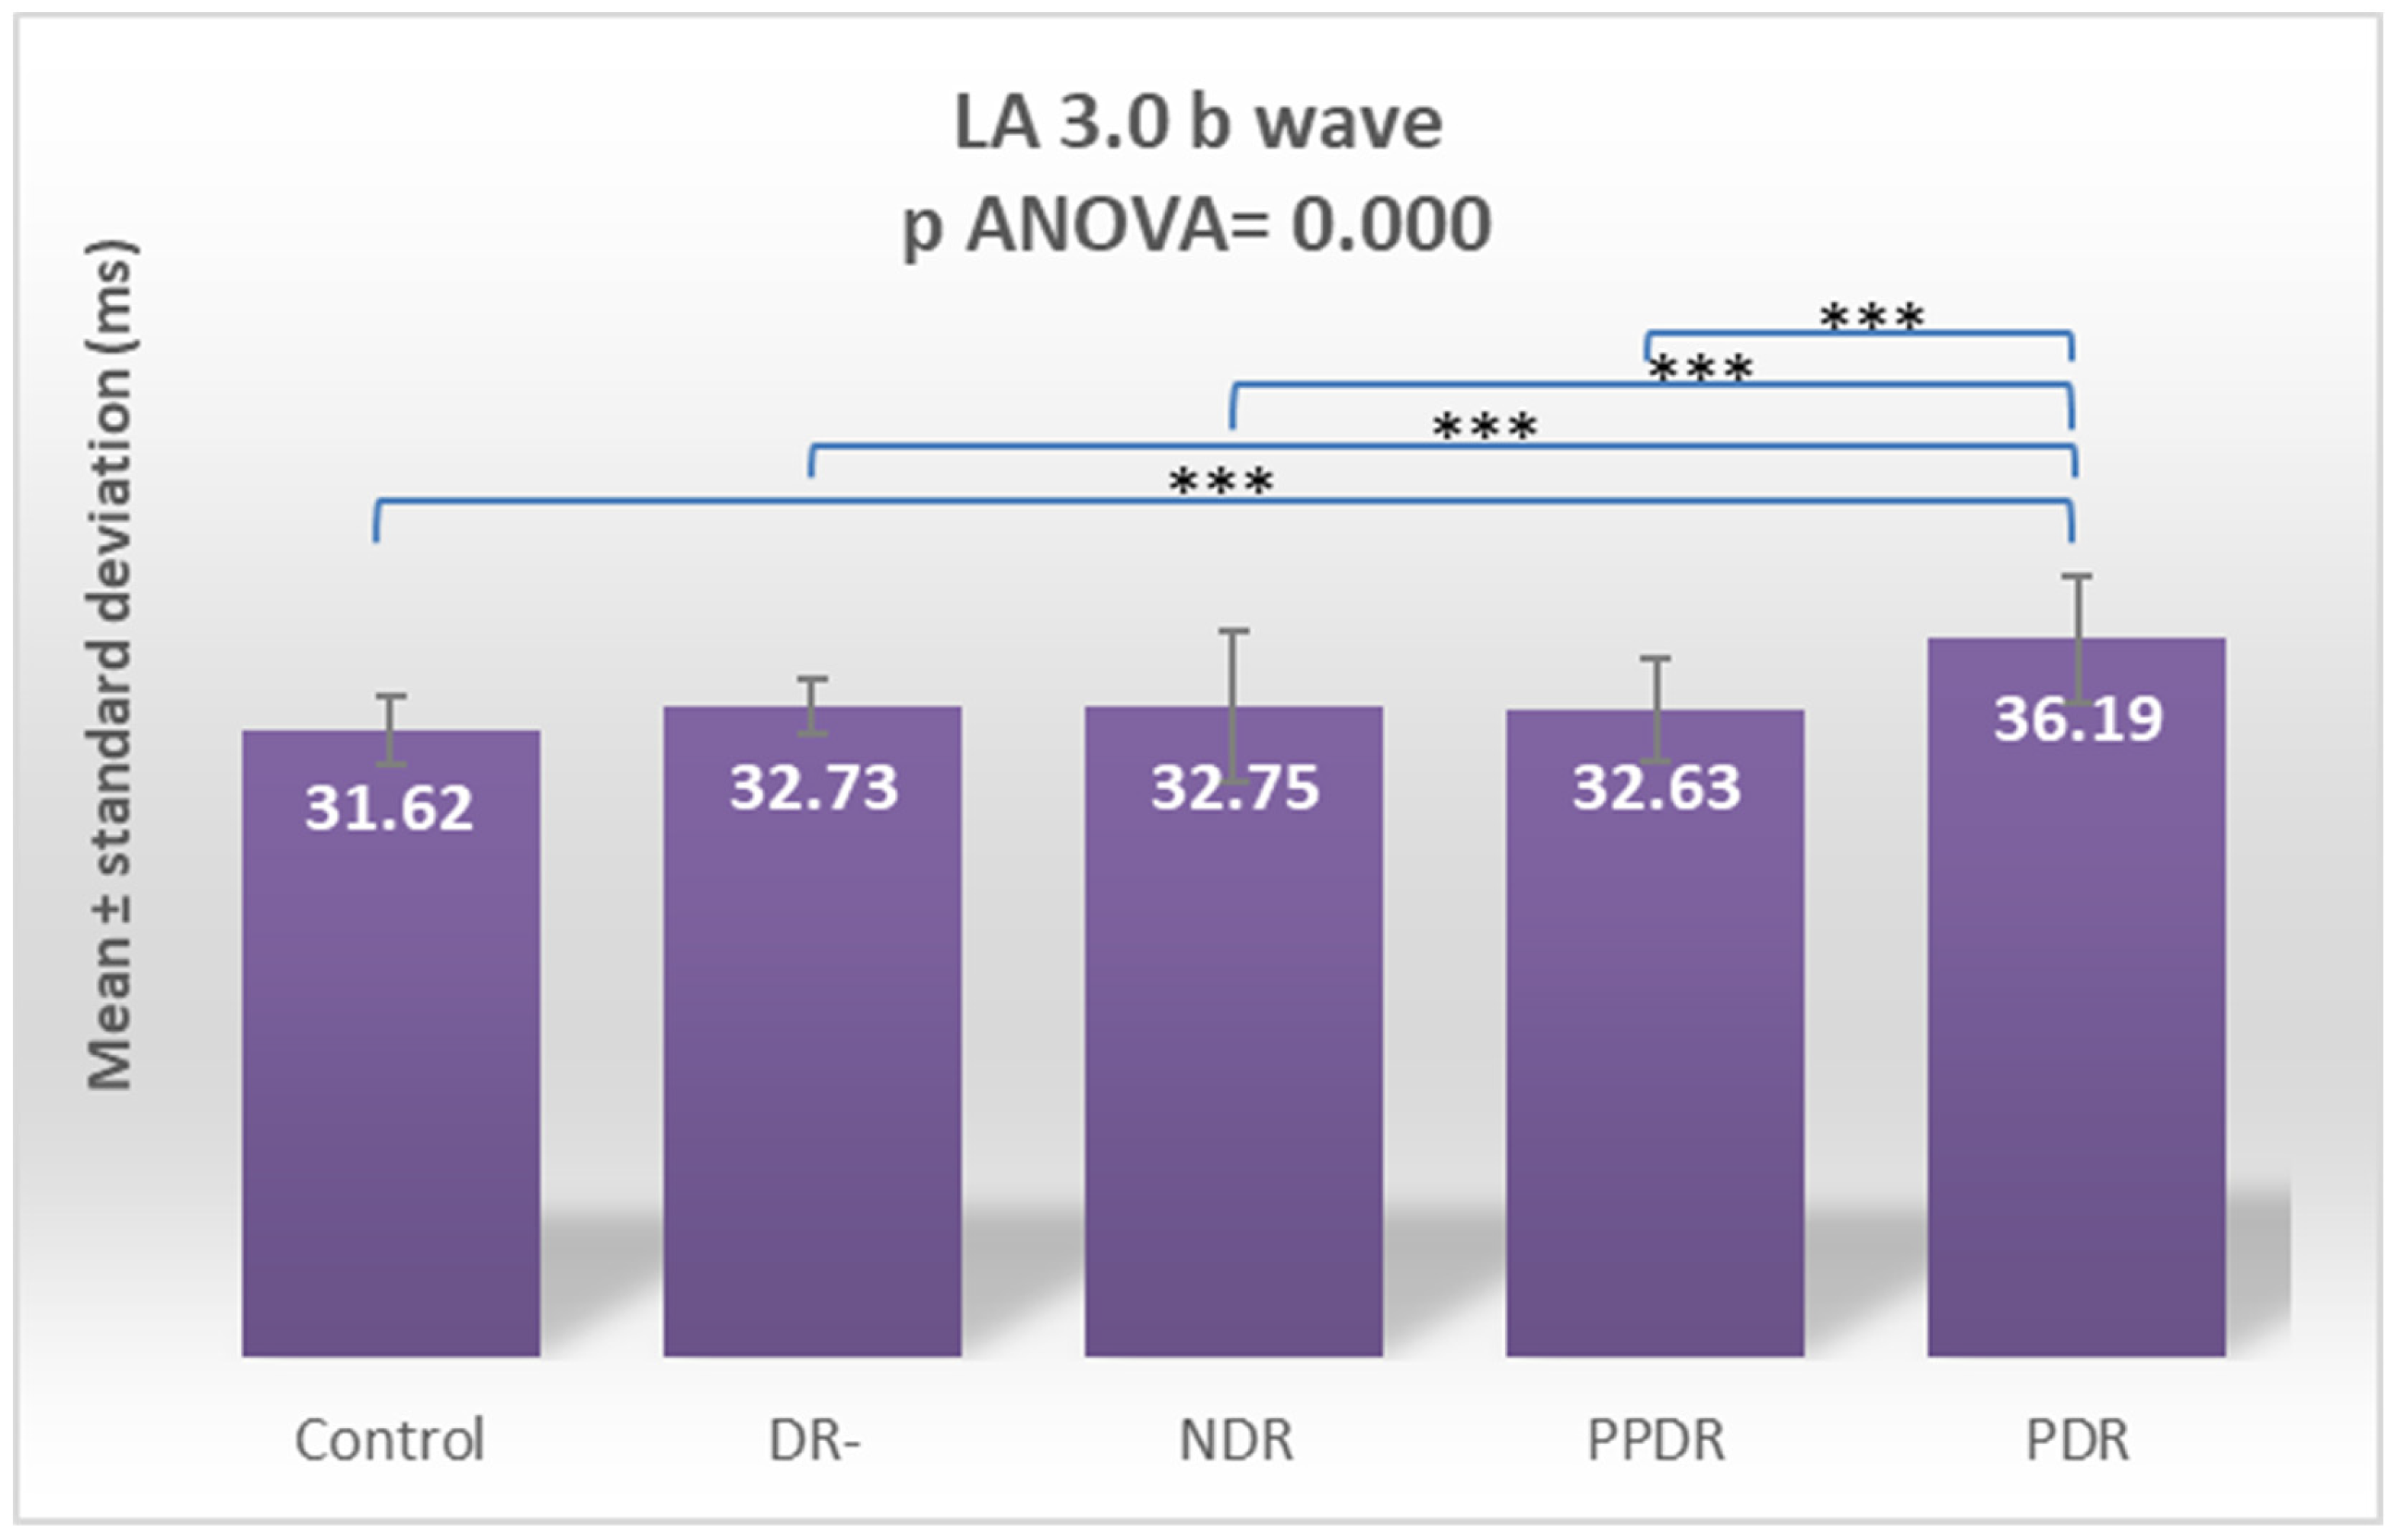
| LA 3.0 ERG b | 31.62 ± 1.75 | 32.73 ± 1.40 | 32.75 ± 3.76 | 32.63 ±2.53 | 36.19 ± 3.21 |
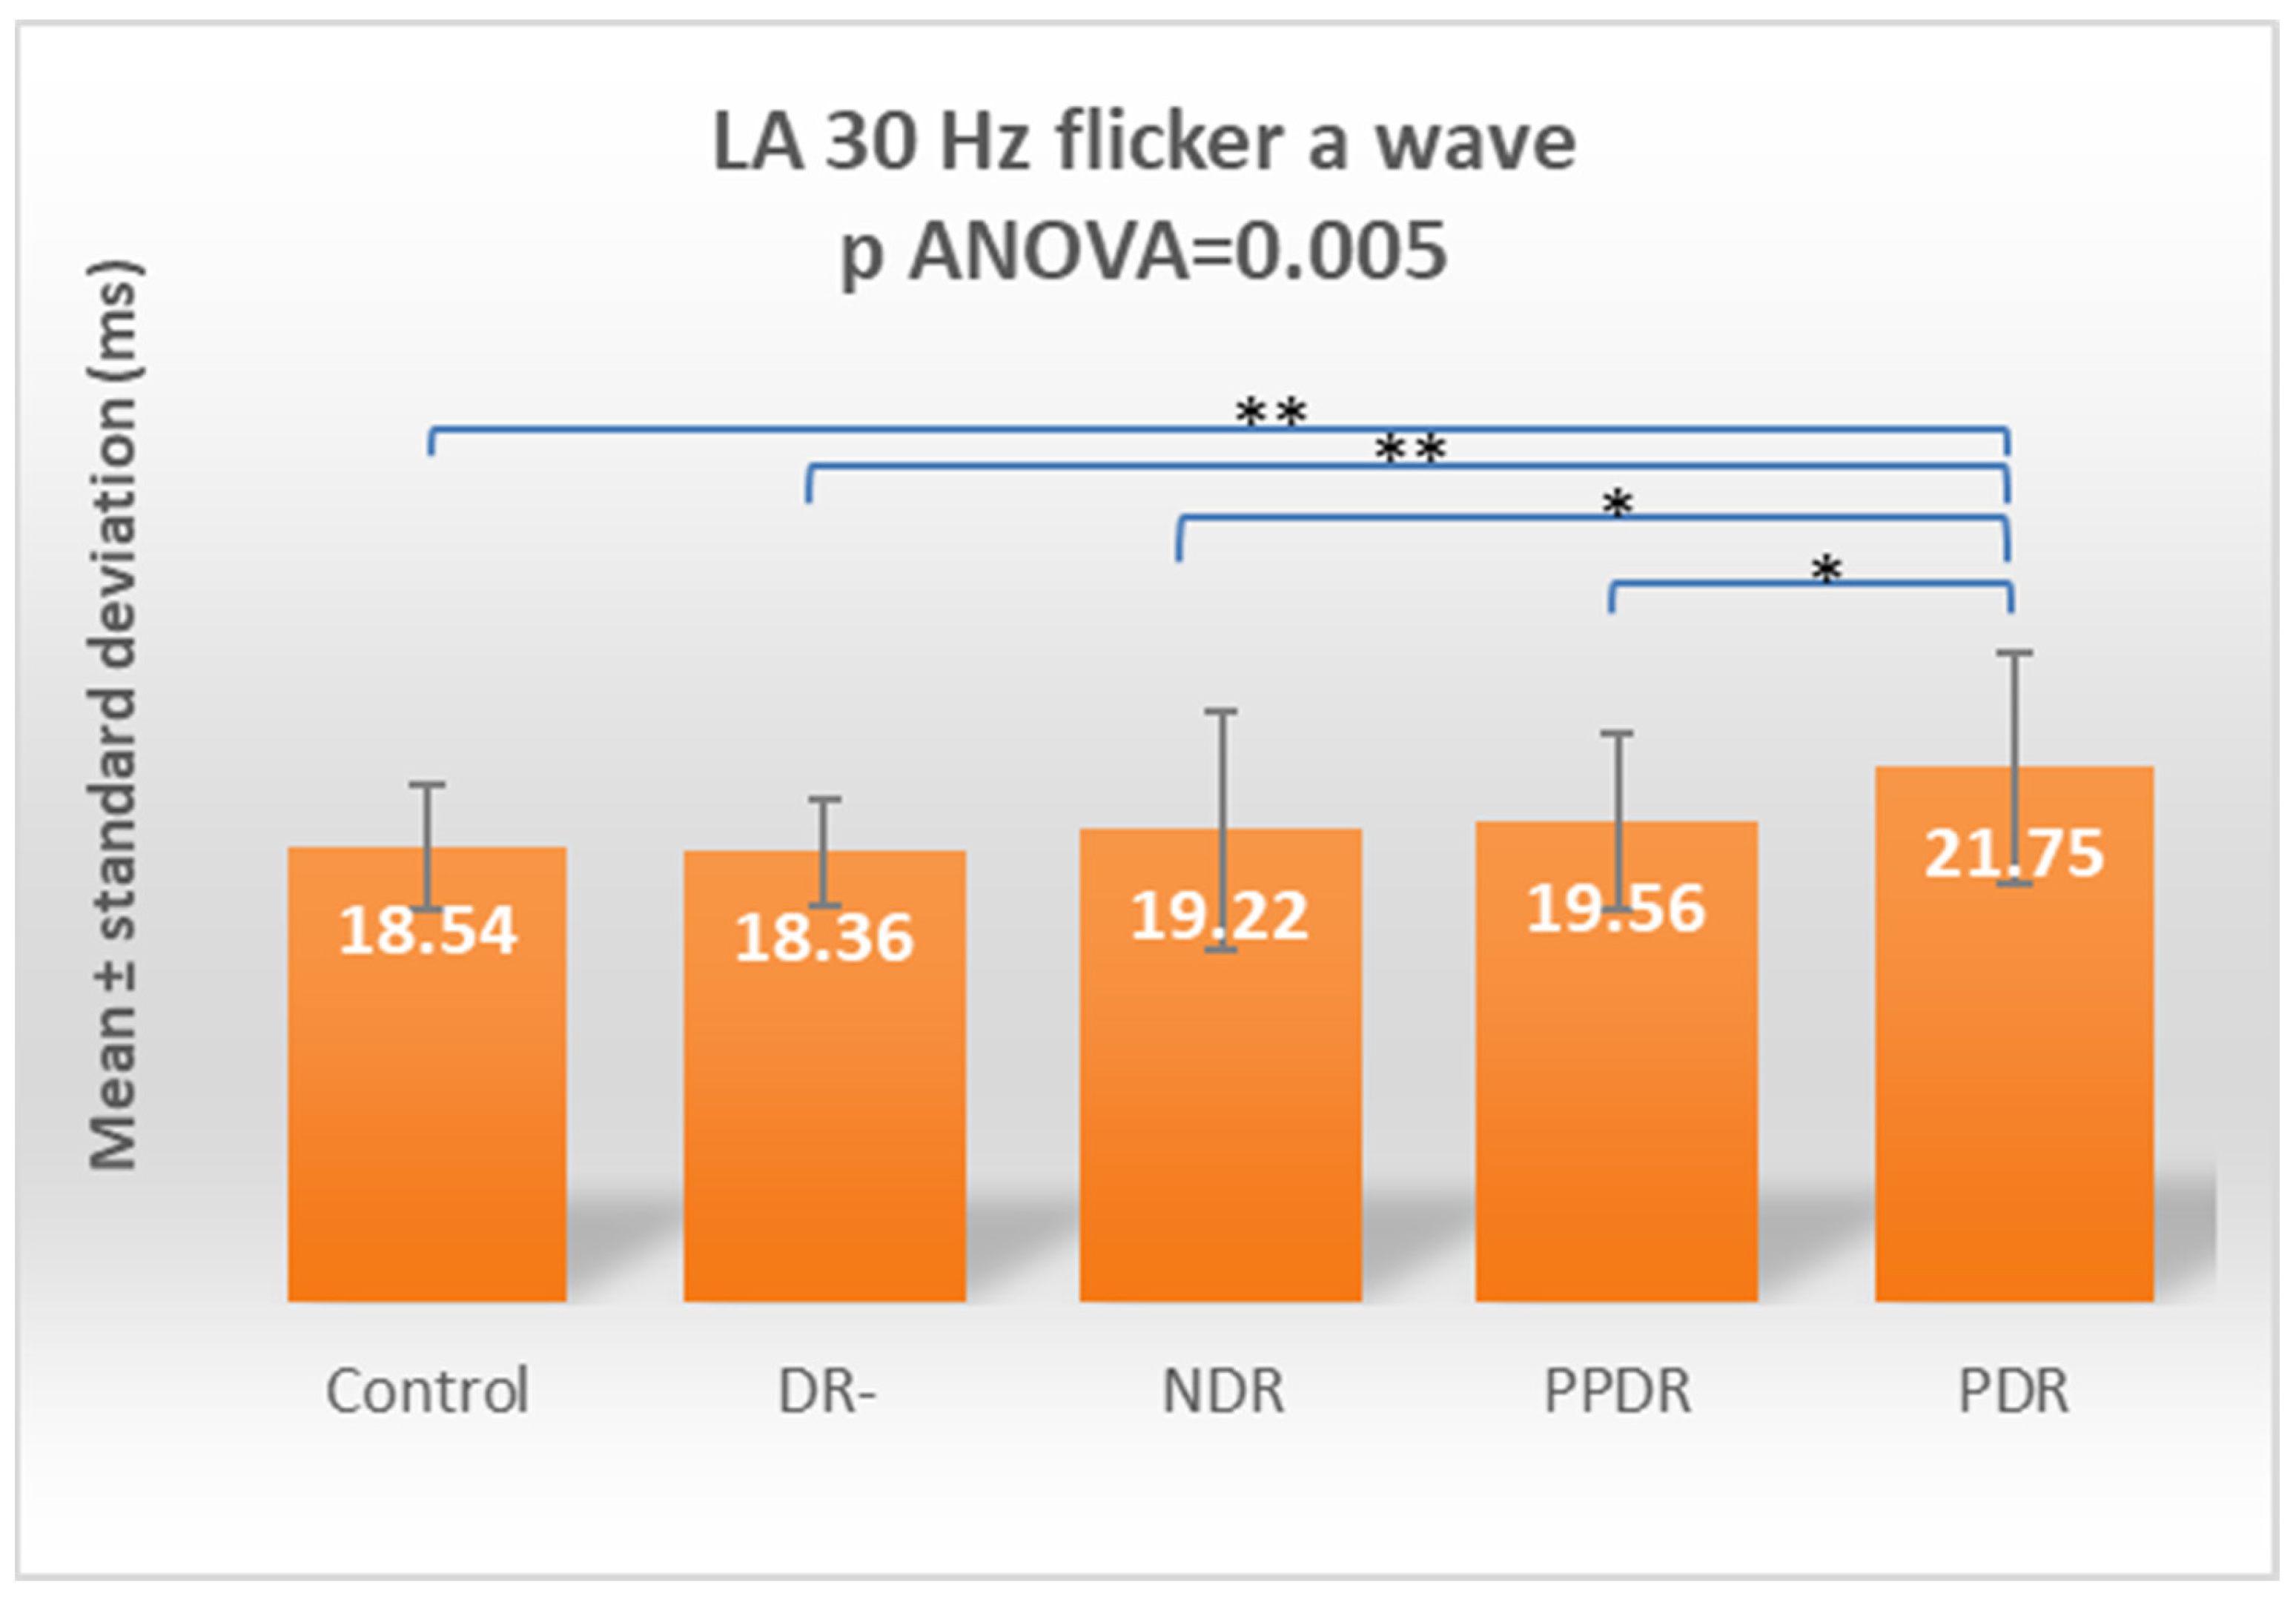
| LA 30 Hz Flicker a | 18.54 ± 2.50 | 18.36 ± 2.16 | 19.22 ± 4.85 | 19.56 ± 3.59 | 21.75 ± 4.74 |
| LA 30 HZ Flicker b | 30.99 ± 2.87 | 31.97 ± 2.28 | 33.63 ± 10.37 | 32.23 ± 4.02 | 36.68 ± 3.48 |
| Contrast | DA 0.01 a | DA 0.01 b | DA 3.0 a | DA 3.0 b | DA 3.0 OP N1 | DA 3.0 OP N2 | LA 3.0 a | LA 3.0 b | LA 30 a | LA 30 b |
|---|---|---|---|---|---|---|---|---|---|---|
| Control vs. NDR | 0.005 | 0.663 | 0.746 | 0.183 | 0.064 | 0.045 | 0.272 | 0.126 | 0.756 | 0.076 |
| Control vs. PPDR | 0.022 | 0.006 | 0.231 | 0.357 | 0.0001 | 0.0001 | 0.002 | 0.163 | 0.557 | 0.269 |
| Control vs. DR- | 0.214 | 0.592 | 0.442 | 0.431 | 0.400 | 0.027 | 0.877 | 0.146 | 0.542 | 0.681 |
| Control vs. PDR | 0.255 | <0.0001 | 0.831 | 0.009 | 0.002 | 0.001 | 0.009 | <0.0001 | 0.004 | 0.0005 |
| PDR vs. NDR | 0.094 | 0.001 | 0.916 | 0.0003 | 0.143 | 0.152 | 0.142 | <0.0001 | 0.013 | 0.074 |
| PDR vs. PPDR | 0.241 | 0.334 | 0.183 | 0.114 | 0.674 | 0.770 | 0.582 | <0.0001 | 0.025 | 0.017 |
| PDR vs. DR- | 0.922 | 0.001 | 0.599 | 0.083 | 0.016 | 0.160 | 0.009 | <0.0001 | 0.002 | 0.005 |
| DR- vs. NDR | 0.114 | 0.935 | 0.674 | 0.046 | 0.312 | 0.753 | 0.237 | 0.941 | 0.392 | 0.226 |
| DR- vs. PPDR | 0.279 | 0.0032 | 0.066 | 0.891 | 0.002 | 0.065 | 0.002 | 0.954 | 0.270 | 0.547 |
| PPDR vs. NDR | 0.629 | 0.029 | 0.152 | 0.035 | 0.043 | 0.053 | 0.045 | 0.895 | 0.793 | 0.519 |
| Contrast | DA 0.01 a | DA 0.01 b | DA 3.0 a | DA 3.0 b | DA 3.0 OP N1 | DA 3.0 OP N2 | LA 3.0 a | LA 3.0 b | LA 30 a | LA 30 b |
|---|---|---|---|---|---|---|---|---|---|---|
| Control vs. DR- | 0.7223 | 0.9832 | 0.9386 | 0.9329 | 0.9151 | 0.9127 | 0.9999 | 0.1017 | 0.9728 | 0.9938 |
| Control vs. NDR | 0.0405 | 0.9923 | 0.9976 | 0.6663 | 0.3338 | 0.2596 | 0.8042 | 0.0858 | 0.9979 | 0.3778 |
| Control vs. PPDR | 0.1463 | 0.0477 | 0.7491 | 0.8868 | 0.0009 | 0.0008 | 0.0130 | 0.1155 | 0.9762 | 0.7986 |
| Control vs. PDR | 0.7820 | 0.0009 | 0.9995 | 0.0700 | 0.0145 | 0.0096 | 0.0654 | <0.0001 | 0.0347 | 0.0041 |
| DR- vs. NDR | 0.5034 | >0.9999 | 0.9933 | 0.2663 | 0.8468 | 0.7777 | 0.7573 | >0.9999 | 0.9099 | 0.7380 |
| DR- vs. PPDR | 0.8128 | 0.1977 | 0.3459 | >0.9999 | 0.0195 | 0.0179 | 0.0143 | >0.9999 | 0.7999 | 0.9738 |
| DR- vs. PDR | >0.9999 | 0.0108 | 0.9845 | 0.4089 | 0.1322 | 0.0956 | 0.0655 | 0.0012 | 0.0155 | 0.0371 |
| NDR vs. PPDR | 0.9886 | 0.1864 | 0.6018 | 0.2161 | 0.2475 | 0.2963 | 0.2592 | >0.9999 | 0.9989 | 0.9663 |
| NDR vs. PDR | 0.4451 | 0.0108 | >0.9999 | 0.0025 | 0.6388 | 0.6147 | 0.5790 | 0.0015 | 0.1029 | 0.3832 |
| PPDR vs. PDR | 0.7625 | 0.8677 | 0.6680 | 0.5061 | 0.9812 | 0.9952 | 0.9816 | 0.0010 | 0.1778 | 0.1185 |
Disclaimer/Publisher’s Note: The statements, opinions and data contained in all publications are solely those of the individual author(s) and contributor(s) and not of MDPI and/or the editor(s). MDPI and/or the editor(s) disclaim responsibility for any injury to people or property resulting from any ideas, methods, instructions or products referred to in the content. |
© 2023 by the authors. Licensee MDPI, Basel, Switzerland. This article is an open access article distributed under the terms and conditions of the Creative Commons Attribution (CC BY) license (https://creativecommons.org/licenses/by/4.0/).
Share and Cite
Tănasie, C.A.; Dan, A.O.; Ică, O.M.; Mercuț, M.F.; Mitroi, G.; Taisescu, C.-I.; Sfredel, V.; Corbeanu, R.I.; Mocanu, C.L.; Danielescu, C. Retinal Functional Impairment in Diabetic Retinopathy. Biomedicines 2024, 12, 44. https://doi.org/10.3390/biomedicines12010044
Tănasie CA, Dan AO, Ică OM, Mercuț MF, Mitroi G, Taisescu C-I, Sfredel V, Corbeanu RI, Mocanu CL, Danielescu C. Retinal Functional Impairment in Diabetic Retinopathy. Biomedicines. 2024; 12(1):44. https://doi.org/10.3390/biomedicines12010044
Chicago/Turabian StyleTănasie, Cornelia Andreea, Alexandra Oltea Dan, Oana Maria Ică, Maria Filoftea Mercuț, George Mitroi, Citto-Iulian Taisescu, Veronica Sfredel, Ramona Ingrid Corbeanu, Carmen Luminița Mocanu, and Ciprian Danielescu. 2024. "Retinal Functional Impairment in Diabetic Retinopathy" Biomedicines 12, no. 1: 44. https://doi.org/10.3390/biomedicines12010044
APA StyleTănasie, C. A., Dan, A. O., Ică, O. M., Mercuț, M. F., Mitroi, G., Taisescu, C.-I., Sfredel, V., Corbeanu, R. I., Mocanu, C. L., & Danielescu, C. (2024). Retinal Functional Impairment in Diabetic Retinopathy. Biomedicines, 12(1), 44. https://doi.org/10.3390/biomedicines12010044