

Quantitative Computed Tomography Lung COVID Scores with Laboratory Markers: Utilization to Predict Rapid Progression and Monitor Longitudinal Changes in Patients with Coronavirus 2019 (COVID-19) Pneumonia

 , , ,
, , ,
Abstract
1. Introduction
2. Materials and Methods
2.1. Patients
2.2. Clinical Data Collection
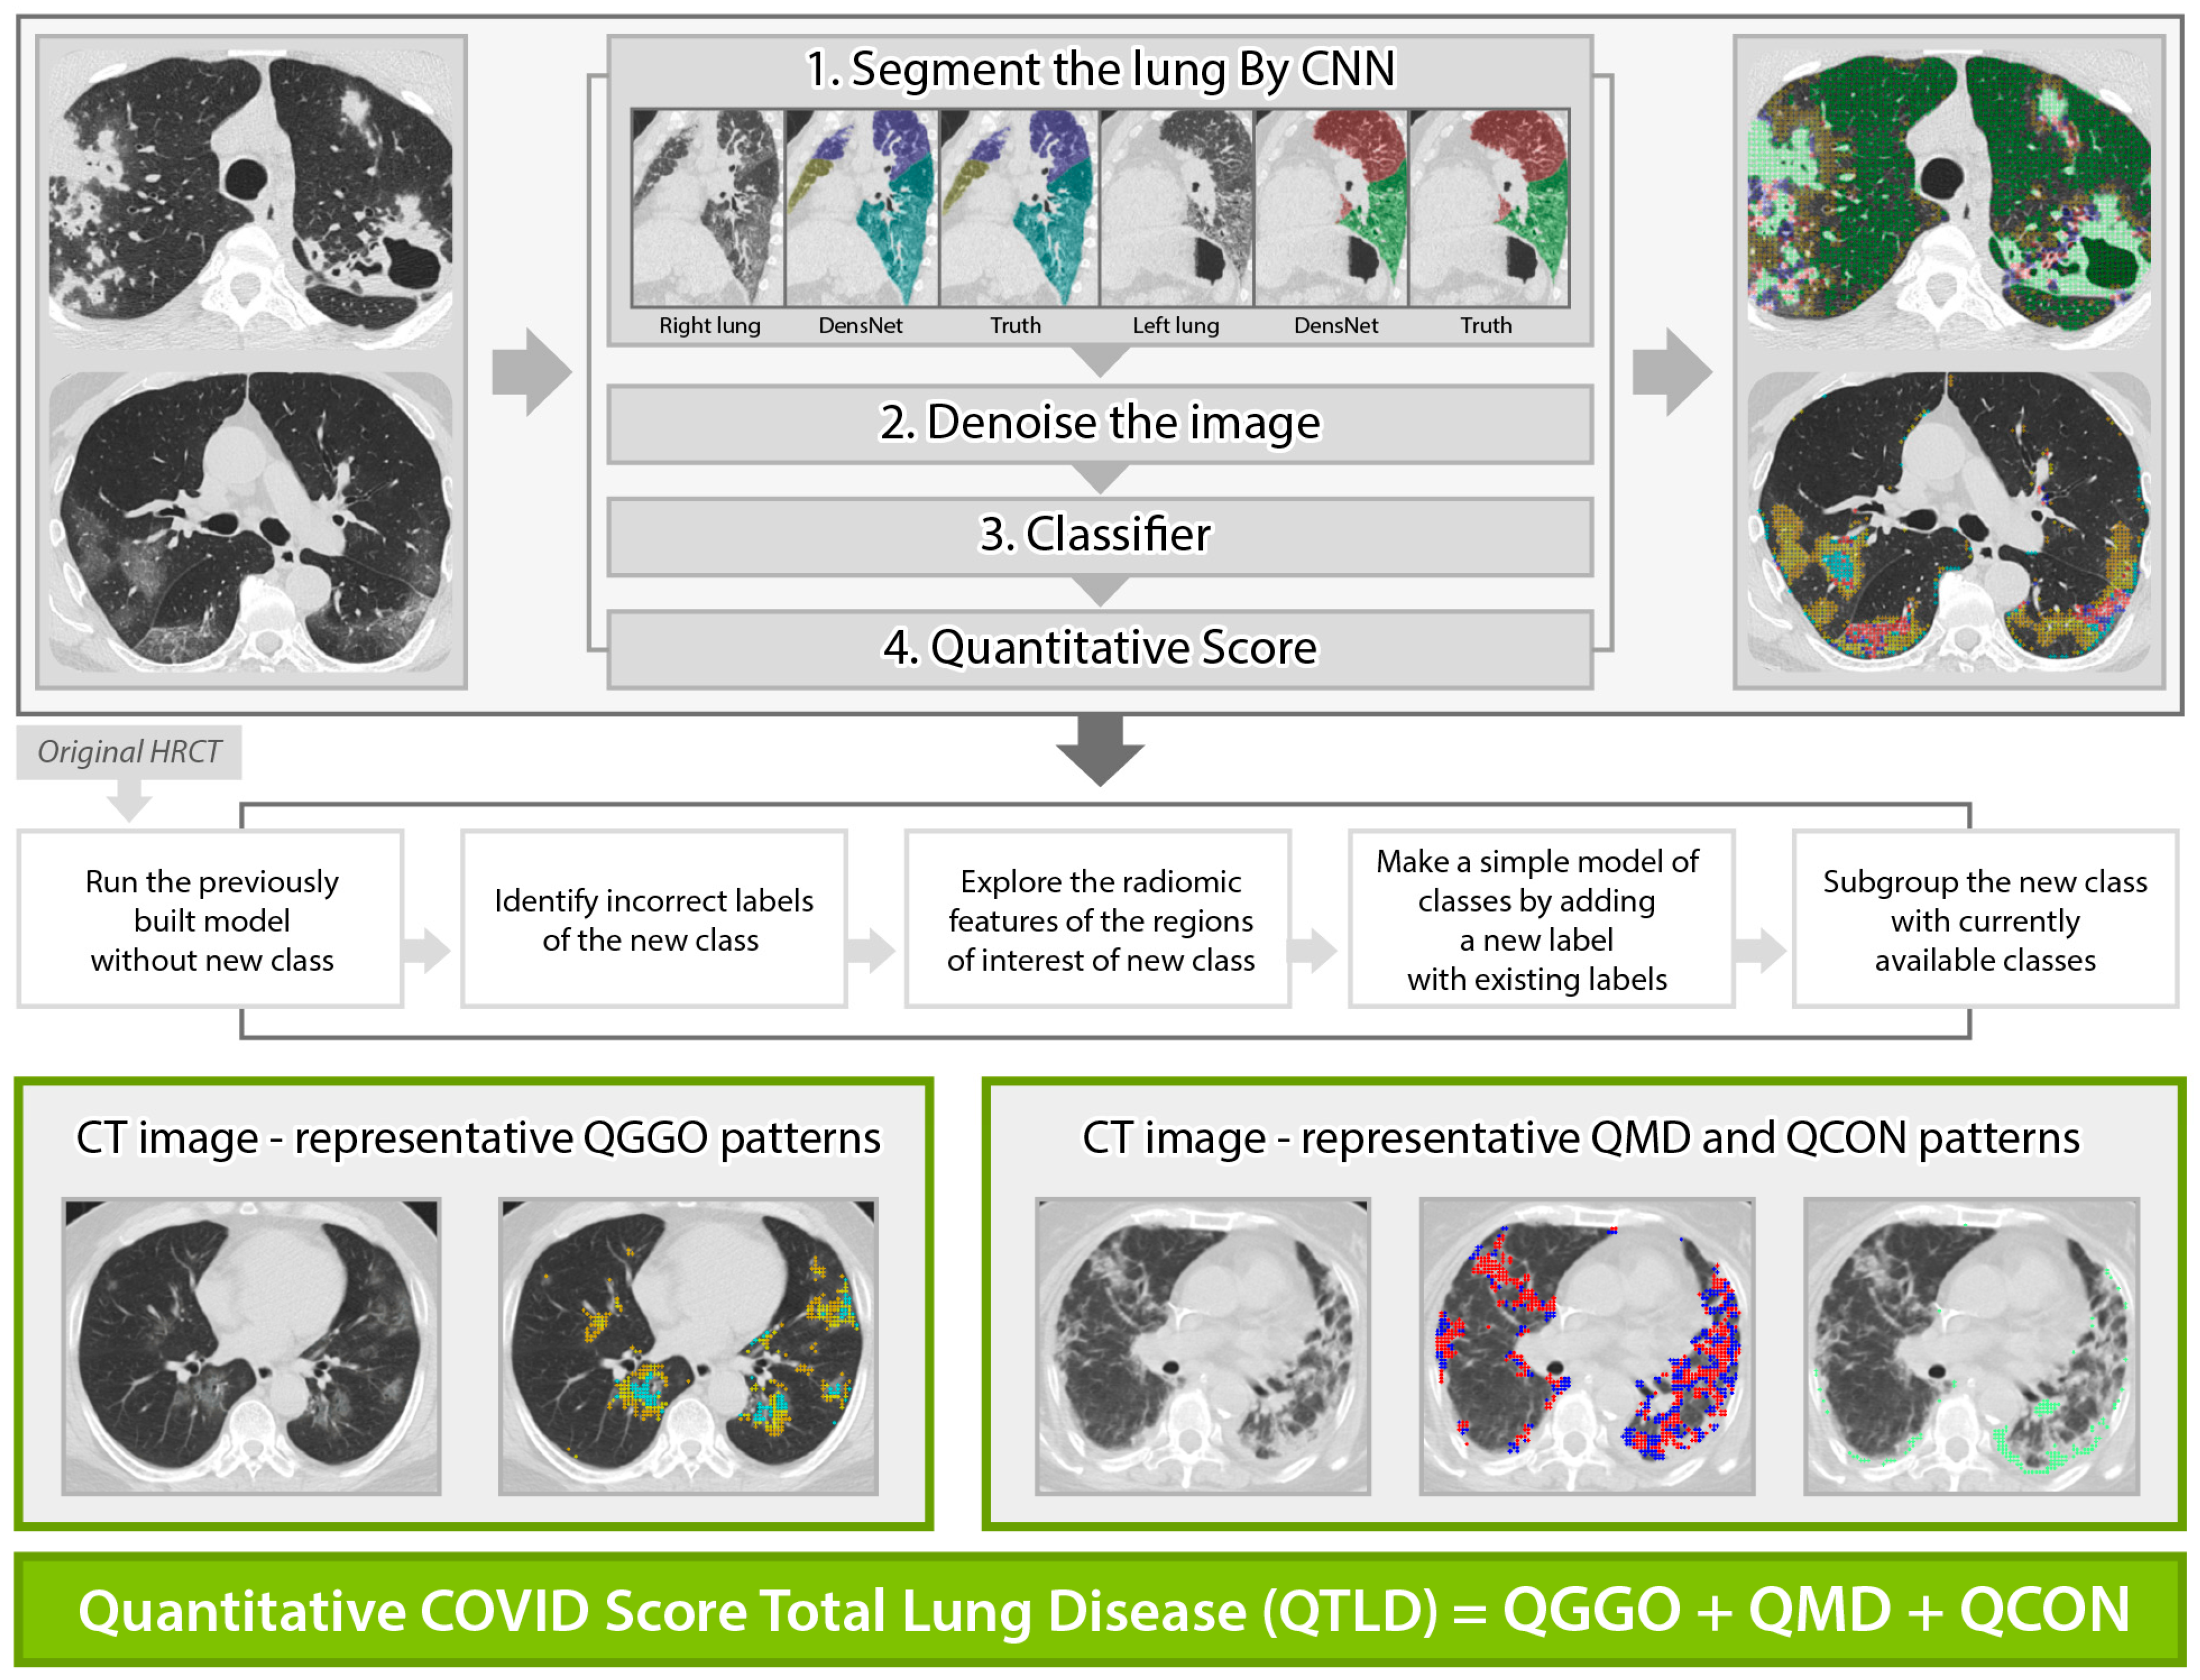
2.3. Quantitative High-Resolution Computed Tomography Imaging Analyses
2.4. Statistical Analysis
3. Results
3.1. Patient Characteristics
3.2. Rapid Progression Patients
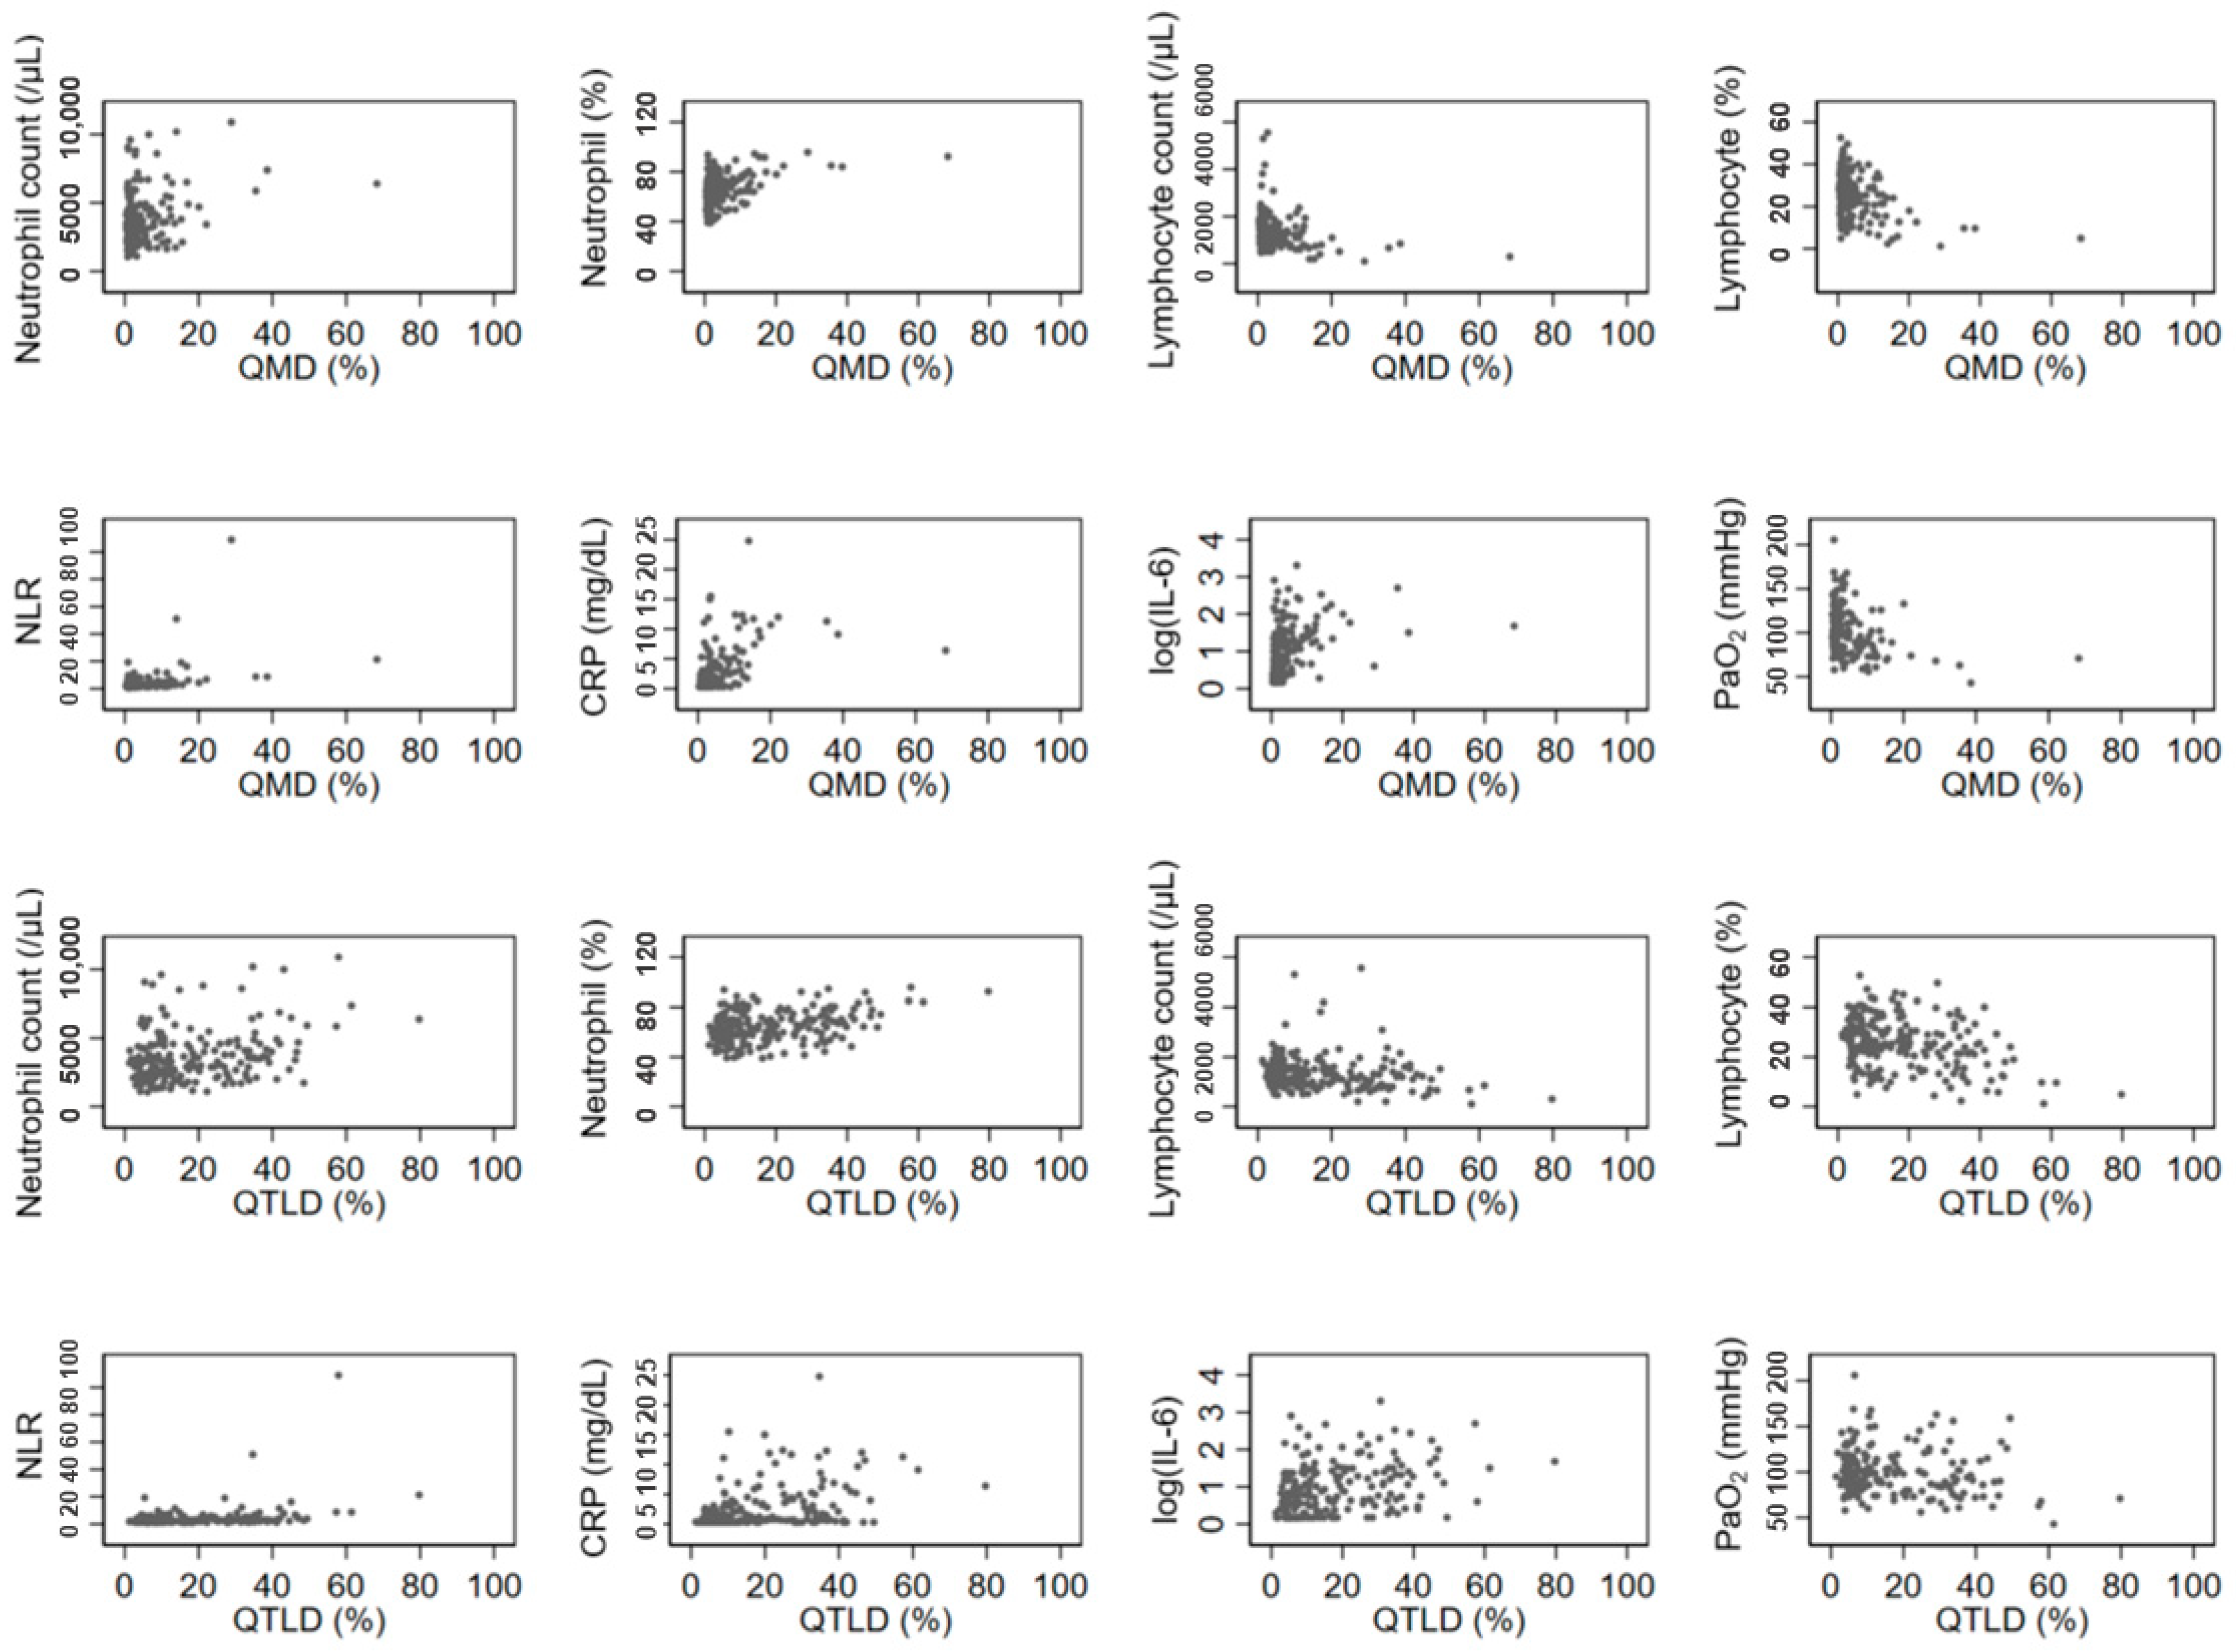
3.3. Association between Quantitative CT Lung COVID Score and Laboratory Findings
3.4. Prediction of Rapid Progression
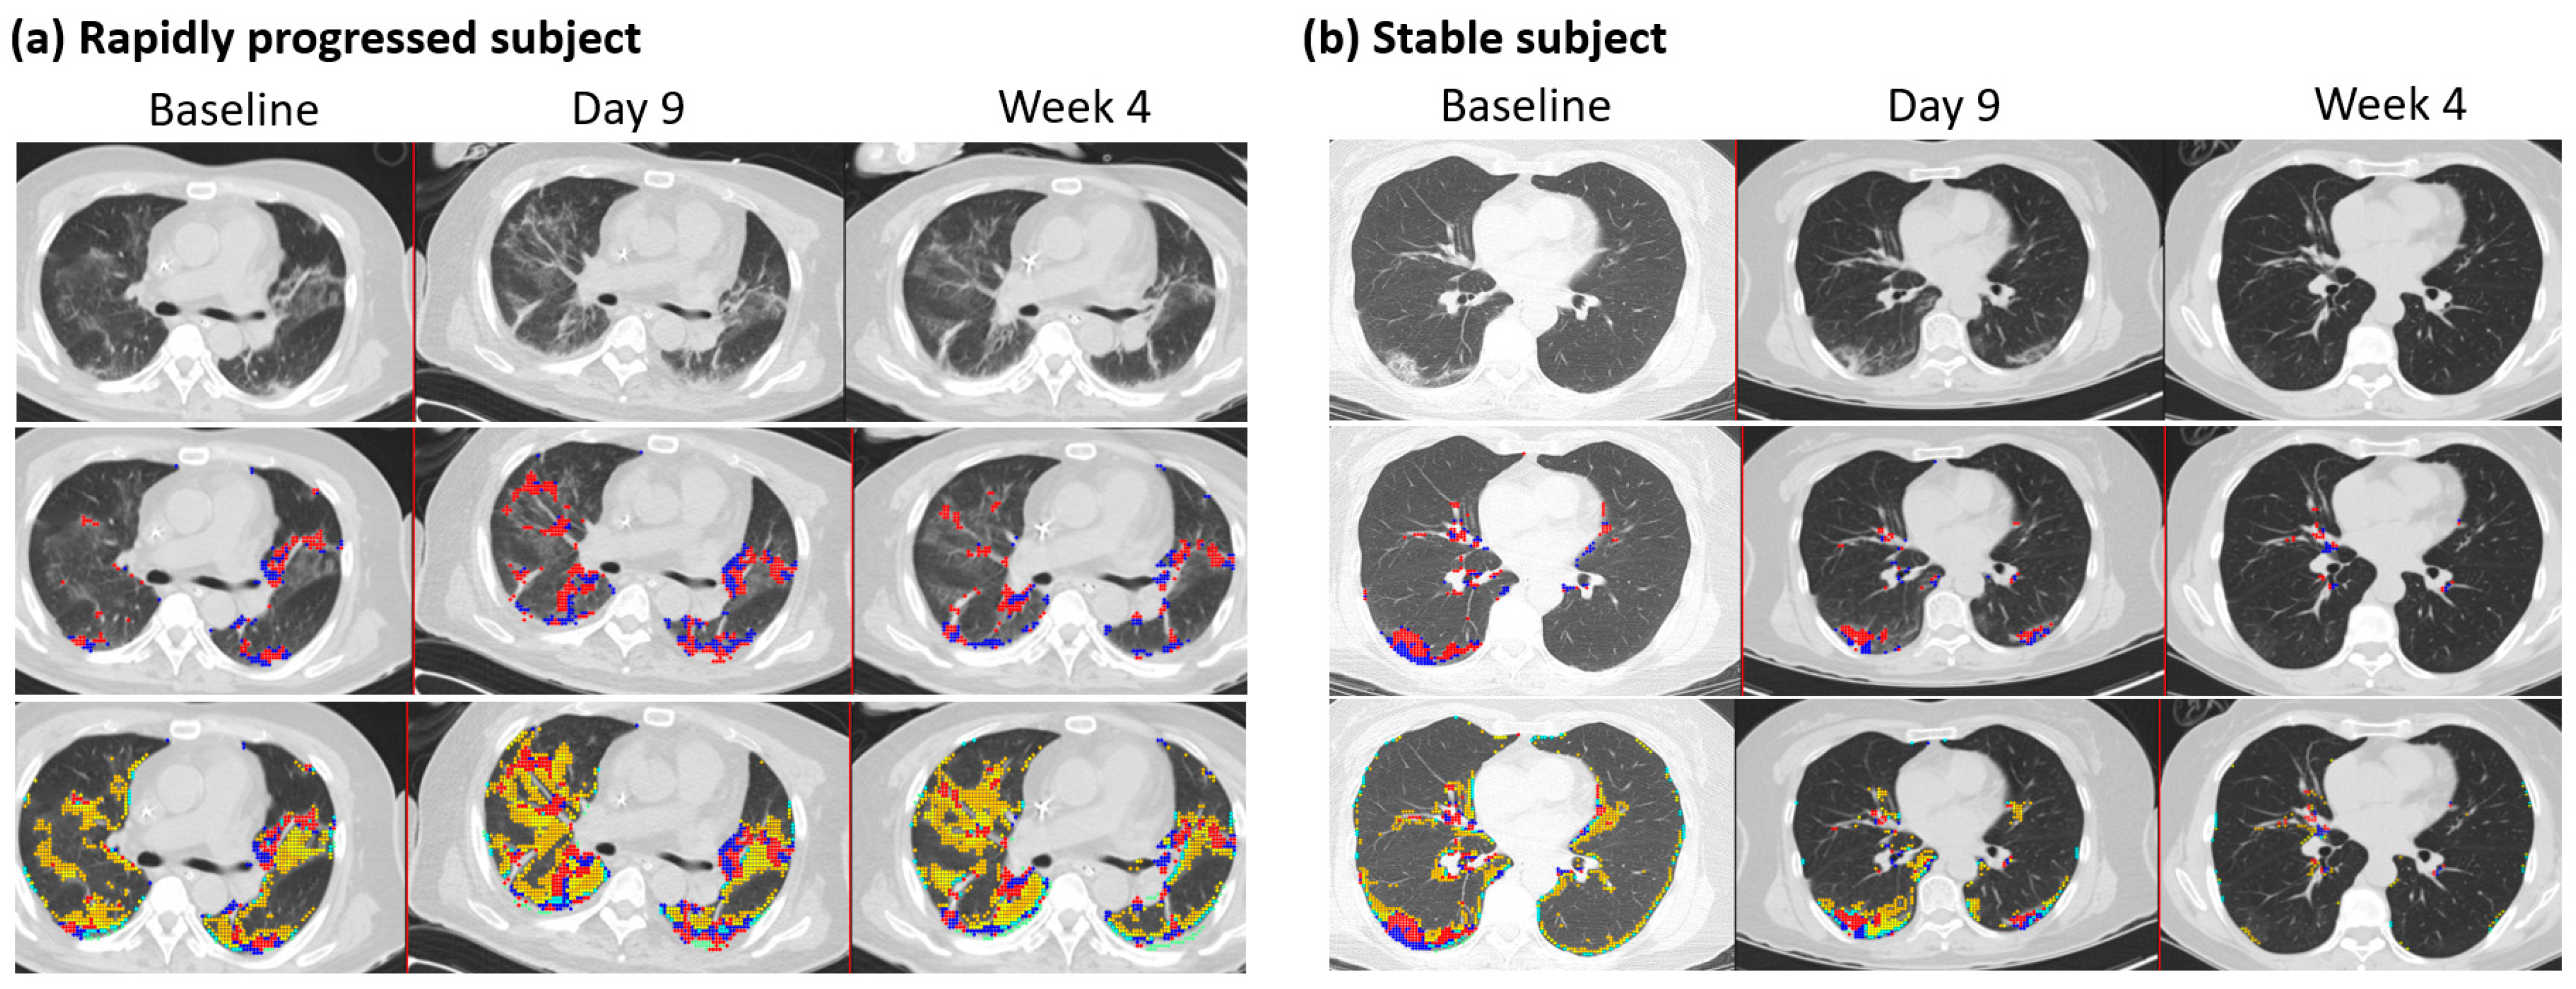
3.5. Follow-Up Imaging
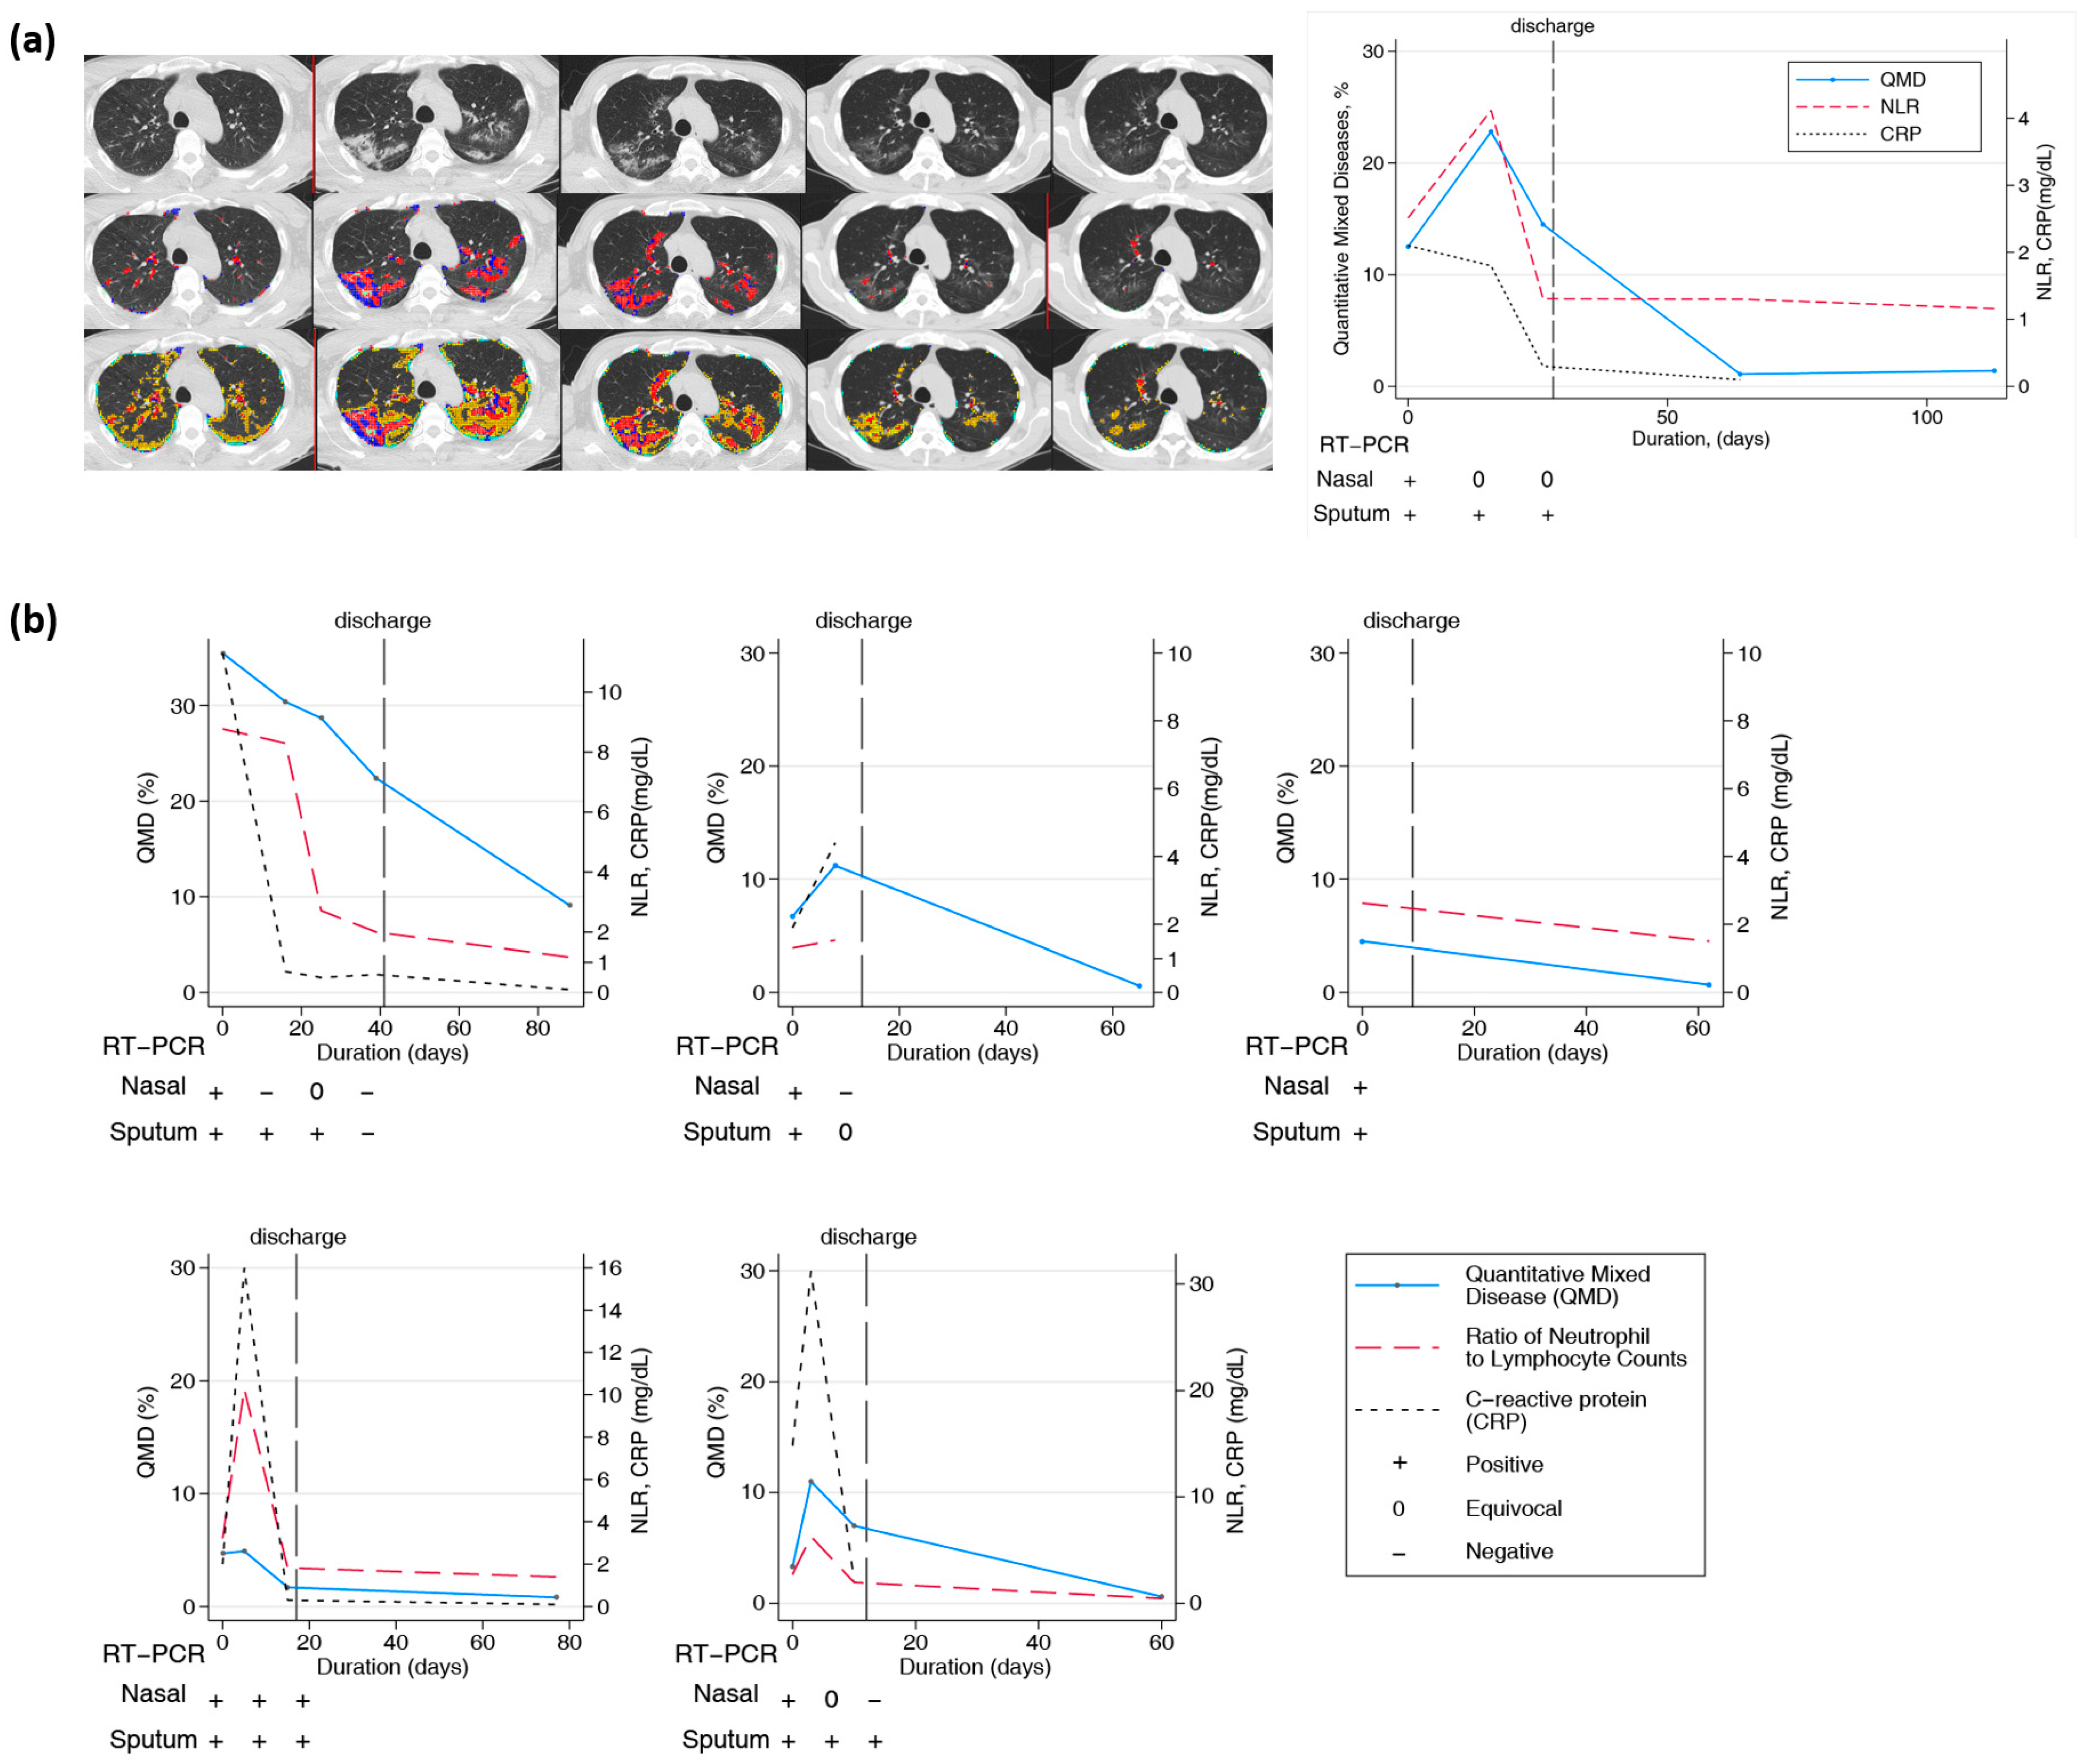
3.6. Longitudinal Changes in Chest CT over Two Months or Longer
4. Discussion
5. Conclusions
Supplementary Materials
Author Contributions
Funding
Institutional Review Board Statement
Informed Consent Statement
Data Availability Statement
Conflicts of Interest
References
- Ciotti, M.; Ciccozzi, M.; Terrinoni, A.; Jiang, W.-C.; Wang, C.-B.; Bernardini, S. The COVID-19 pandemic. Crit. Rev. Clin. Lab. Sci. 2020, 57, 365–388. [Google Scholar] [CrossRef] [PubMed]
- Huang, C.; Wang, Y.; Li, X.; Ren, L.; Zhao, J.; Hu, Y.; Zhang, L.; Fan, G.; Xu, J.; Gu, X. Clinical features of patients infected with 2019 novel coronavirus in Wuhan, China. Lancet 2020, 395, 497–506. [Google Scholar] [CrossRef]
- Wu, Z.; McGoogan, J.M. Characteristics of and important lessons from the coronavirus disease 2019 (COVID-19) outbreak in China: Summary of a report of 72 314 cases from the Chinese Center for Disease Control and Prevention. JAMA 2020, 323, 1239–1242. [Google Scholar] [CrossRef]
- Yang, Y.; Lu, Q.-B.; Liu, M.-J.; Wang, Y.-X.; Zhang, A.-R.; Jalali, N.; Dean, N.E.; Longini, I.; Halloran, M.E.; Xu, B. Epidemiological and clinical features of the 2019 novel coronavirus outbreak in China. medRxiv 2020. [Google Scholar] [CrossRef]
- Wang, D.; Hu, B.; Hu, C.; Zhu, F.; Liu, X.; Zhang, J.; Wang, B.; Xiang, H.; Cheng, Z.; Xiong, Y. Clinical characteristics of 138 hospitalized patients with 2019 novel coronavirus–infected pneumonia in Wuhan, China. JAMA 2020, 323, 1061–1069. [Google Scholar] [CrossRef]
- Feng, Z.; Yu, Q.; Yao, S.; Luo, L.; Zhou, W.; Mao, X.; Li, J.; Duan, J.; Yan, Z.; Yang, M. Early prediction of disease progression in COVID-19 pneumonia patients with chest CT and clinical characteristics. Nat. Commun. 2020, 11, 4968. [Google Scholar] [CrossRef]
- Siddiqi, H.K.; Mehra, M.R. COVID-19 illness in native and immunosuppressed states: A clinical–therapeutic staging proposal. J. Heart Lung Transplant. 2020, 39, 405–407. [Google Scholar] [CrossRef]
- Gallo Marin, B.; Aghagoli, G.; Lavine, K.; Yang, L.; Siff, E.J.; Chiang, S.S.; Salazar-Mather, T.P.; Dumenco, L.; Savaria, M.C.; Aung, S.N. Predictors of COVID-19 severity: A literature review. Rev. Med. Virol. 2021, 31, 1–10. [Google Scholar] [CrossRef]
- Parimoo, A.; Biswas, A.; Baitha, U.; Gupta, G.; Pandey, S.; Ranjan, P.; Gupta, V.; Roy, D.B.; Prakash, B.; Wig, N. Dynamics of inflammatory markers in predicting mortality in COVID-19. Cureus 2021, 13, e19080. [Google Scholar] [CrossRef]
- Statsenko, Y.; Al Zahmi, F.; Habuza, T.; Neidl-Van Gorkom, K.; Zaki, N. Prediction of COVID-19 severity using laboratory findings on admission: Informative values, thresholds, ML model performance. BMJ Open 2021, 11, e044500. [Google Scholar] [CrossRef]
- Giamarellos-Bourboulis, E.J.; Poulakou, G.; de Nooijer, A.; Milionis, H.; Metallidis, S.; Ploumidis, M.; Grigoropoulou, P.; Rapti, A.; Segala, F.V.; Balis, E. Development and validation of SCOPE score: A clinical score to predict COVID-19 pneumonia progression to severe respiratory failure. Cell Rep. Med. 2022, 3, 100560. [Google Scholar] [CrossRef]
- Sarraf, S.; Singapurwala, M.; Jain, H.; Singh, R.; Julka, A. Role of Inflammatory Markers in Predicting Severity in COVID-19 Patients at Tertiary Care Hospital, Ujjain (MP). J. Pulmonol. Respir. Res. 2023, 7, 4–9. [Google Scholar]
- Cau, R.; Falaschi, Z.; Paschè, A.; Danna, P.; Arioli, R.; Arru, C.D.; Zagaria, D.; Tricca, S.; Suri, J.S.; Kalra, M.K. CT findings of COVID-19 pneumonia in ICU-patients. J. Public Health Res. 2021, 10, 2270. [Google Scholar] [CrossRef]
- Sanli, D.E.T.; Yildirim, D.; Sanli, A.N.; Erozan, N.; Husmen, G.; Altundag, A.; Tuzuner, F.; Dikensoy, O.; Kirisoglu, C.E. Predictive value of CT imaging findings in COVID-19 pneumonia at the time of first-screen regarding the need for hospitalization or intensive care unit. Diagn. Interv. Radiol. 2021, 27, 599. [Google Scholar] [CrossRef]
- Liang, B.; Xie, L.; Yang, F.; Makamure, J.; Zhang, L.; Pang, R.; Du, P.; Fan, W.; Zheng, C. CT changes of severe coronavirus disease 2019 based on prognosis. Sci. Rep. 2020, 10, 21849. [Google Scholar] [CrossRef]
- Erturk, S.M.; Durak, G.; Ayyildiz, H.; Comert, R.G.; Medetalibeyoglu, A.; Senkal, N.; Uysal, E.; Tunaci, A. COVID-19: Correlation of early chest computed tomography findings with the course of disease. J. Comput. Assist. Tomogr. 2020, 44, 633–639. [Google Scholar] [CrossRef]
- Baratella, E.; Bussani, R.; Zanconati, F.; Marrocchio, C.; Fabiola, G.; Braga, L.; Maiocchi, S.; Berlot, G.; Volpe, M.C.; Moro, E. Radiological–pathological signatures of patients with COVID-19-related pneumomediastinum: Is there a role for the Sonic hedgehog and Wnt5a pathways? ERJ Open Res. 2021, 7, 00346-2021. [Google Scholar] [CrossRef]
- Vetrugno, L.; Castaldo, N.; Fantin, A.; Deana, C.; Cortegiani, A.; Longhini, F.; Forfori, F.; Cammarota, G.; Grieco, D.L.; Isola, M. Ventilatory associated barotrauma in COVID-19 patients: A multicenter observational case control study (COVI-MIX-study). Pulmonology 2023, 29, 457–468. [Google Scholar] [CrossRef]
- Wen, H.; Huapaya, J.A.; Kanth, S.M.; Sun, J.; Matthew, B.P.; Lee, S.C.; Do, M.; Chen, M.Y.; Malayeri, A.A.; Suffredini, A.F. Quantitative CT metrics associated with variability in the diffusion capacity of the lung of post-COVID-19 patients with minimal residual lung lesions. J. Imaging 2023, 9, 150. [Google Scholar] [CrossRef]
- Ambrosino, P.; Lanzillo, A.; Maniscalco, M. COVID-19 and Post-Acute COVID-19 Syndrome: From Pathophysiology to Novel Translational Applications. Biomedicines 2021, 10, 47. [Google Scholar] [CrossRef]
- Baysal, B.; Dogan, M.B.; Gulbay, M.; Sorkun, M.; Koksal, M.; Bastug, A.; Kazancıoglu, S.; Ozbay, B.O.; Icten, S.; Arslan, F. Predictive performance of CT for adverse outcomes among COVID-19 suspected patients: A two-center retrospective study. Bosn. J. Basic Med. Sci. 2021, 21, 739. [Google Scholar] [CrossRef]
- Ruch, Y.; Kaeuffer, C.; Ohana, M.; Labani, A.; Fabacher, T.; Bilbault, P.; Kepka, S.; Solis, M.; Greigert, V.; Lefebvre, N. CT lung lesions as predictors of early death or ICU admission in COVID-19 patients. Clin. Microbiol. Infect. 2020, 26, 1417.e5–1417.e8. [Google Scholar] [CrossRef]
- Laino, M.E.; Ammirabile, A.; Lofino, L.; Lundon, D.J.; Chiti, A.; Francone, M.; Savevski, V. Prognostic findings for ICU admission in patients with COVID-19 pneumonia: Baseline and follow-up chest CT and the added value of artificial intelligence. Emerg. Radiol. 2022, 29, 243–262. [Google Scholar] [CrossRef]
- Han, X.; Chen, L.; Fan, Y.; Alwalid, O.; Jia, X.; Zheng, Y.; Liu, J.; Li, Y.; Cao, Y.; Gu, J. Longitudinal Assessment of Chest CT Findings and Pulmonary Function after COVID-19 Infection. Radiology 2023, 307, e222888. [Google Scholar] [CrossRef]
- Huang, L.; Han, R.; Ai, T.; Yu, P.; Kang, H.; Tao, Q.; Xia, L. Serial quantitative chest CT assessment of COVID-19: A deep learning approach. Radiol. Cardiothorac. Imaging 2020, 2, e200075. [Google Scholar] [CrossRef]
- Yang, S.; Park, J.; Ahn, S.; Kim, S.; Kim, S.; Park, S. Two-year report of COVID-19 outbreak from January 20, 2020 to January 19, 2022 in the Republic of Korea. Public Health Wkly. Rep. 2022, 15, 414–426. [Google Scholar]
- Kim, H.; Tashkin, D.; Clements, P.; Li, G.; Brown, M.; Elashoff, R.; Gjertson, D.; Abtin, F.; Lynch, D.; Strollo, D. A computer-aided diagnosis system for quantitative scoring of extent of lung fibrosis in scleroderma patients. Clin. Exp. Rheumatol. 2010, 28, S26. [Google Scholar]
- Kim, H.J.; Brown, M.S.; Chong, D.; Gjertson, D.W.; Lu, P.; Kim, H.J.; Coy, H.; Goldin, J.G. Comparison of the quantitative CT imaging biomarkers of idiopathic pulmonary fibrosis at baseline and early change with an interval of 7 months. Acad. Radiol. 2015, 22, 70–80. [Google Scholar] [CrossRef]
- Allwood, B.W.; Maasdorp, E.; Kim, G.J.; Cooper, C.B.; Goldin, J.; van Zyl-Smit, R.N.; Bateman, E.D.; Dawson, R. Transition from restrictive to obstructive lung function impairment during treatment and follow-up of active tuberculosis. Int. J. Chronic Obstr. Pulm. Dis. 2020, 15, 1039. [Google Scholar] [CrossRef]
- Dolinay, T.; Jun, D.; Maller, A.; Chung, A.; Grimes, B.; Hsu, L.; Nelson, D.; Villagas, B.; Kim, G.H.J.; Goldin, J. Quantitative image analysis in COVID-19 acute respiratory distress syndrome: A cohort observational study. F1000Research 2021, 10, 1266. [Google Scholar] [CrossRef]
- Wang, X.; Teng, P.; Lo, P.; Banola, A.; Kim, G.; Abtin, F.; Goldin, J.; Brown, M. High throughput lung and lobar segmentation by 2D and 3D CNN on chest CT with diffuse lung disease. In Image Analysis for Moving Organ, Breast, and Thoracic Images; Springer: Cham, Switzerland, 2018; pp. 202–214. [Google Scholar]
- Kim, H.J.; Li, G.; Gjertson, D.; Elashoff, R.; Shah, S.K.; Ochs, R.; Vasunilashorn, F.; Abtin, F.; Brown, M.S.; Goldin, J.G. Classification of parenchymal abnormality in scleroderma lung using a novel approach to denoise images collected via a multicenter study. Acad. Radiol. 2008, 15, 1004–1016. [Google Scholar] [CrossRef]
- Parekh, M.; Donuru, A.; Balasubramanya, R.; Kapur, S. Review of the chest CT differential diagnosis of ground-glass opacities in the COVID era. Radiology 2020, 297, E289–E302. [Google Scholar] [CrossRef]
- Chong, D.Y.; Kim, H.J.; Lo, P.; Young, S.; McNitt-Gray, M.F.; Abtin, F.; Goldin, J.G.; Brown, M.S. Robustness-driven feature selection in classification of fibrotic interstitial lung disease patterns in computed tomography using 3D texture features. IEEE Trans. Med. Imaging 2015, 35, 144–157. [Google Scholar] [CrossRef]
- Leap, J.; Villgran, V.; Cheema, T. COVID-19: Epidemiology, pathophysiology, transmission, symptoms. Crit. Care Nurs. Q. 2020, 43, 338–342. [Google Scholar] [CrossRef]
- Marquez, C.; Kerkhoff, A.D.; Schrom, J.; Rojas, S.; Black, D.; Mitchell, A.; Wang, C.-Y.; Pilarowski, G.; Ribeiro, S.; Jones, D. COVID-19 Symptoms and Duration of Rapid Antigen Test Positivity at a Community Testing and Surveillance Site During Pre-Delta, Delta, and Omicron BA. 1 Periods. JAMA Netw. Open 2022, 5, e2235844. [Google Scholar] [CrossRef]
- Goh, K.J.; Choong, M.C.; Cheong, E.H.; Kalimuddin, S.; Wen, S.D.; Phua, G.C.; Chan, K.S.; Mohideen, S.H. Rapid progression to acute respiratory distress syndrome: Review of current understanding of critical illness from coronavirus disease 2019 (COVID-19) infection. Ann. Acad. Med. 2020, 49, 108–118. [Google Scholar] [CrossRef]
- Sun, Q.; Qiu, H.; Huang, M.; Yang, Y. Lower mortality of COVID-19 by early recognition and intervention: Experience from Jiangsu Province. Ann. Intensive Care 2020, 10, 33. [Google Scholar] [CrossRef]
- Liu, J.; Yu, H.; Zhang, S. The indispensable role of chest CT in the detection of coronavirus disease 2019 (COVID-19). Eur. J. Nucl. Med. Mol. Imaging 2020, 47, 1638–1639. [Google Scholar] [CrossRef]
- Kardos, A.S.; Simon, J.; Nardocci, C.; Szabó, I.V.; Nagy, N.; Abdelrahman, R.H.; Zsarnóczay, E.; Fejér, B.; Futácsi, B.; Müller, V. The diagnostic performance of deep-learning-based CT severity score to identify COVID-19 pneumonia. Br. J. Radiol. 2022, 95, 20210759. [Google Scholar] [CrossRef]
- Sun, D.; Li, X.; Guo, D.; Wu, L.; Chen, T.; Fang, Z.; Chen, L.; Zeng, W.; Yang, R. CT quantitative analysis and its relationship with clinical features for assessing the severity of patients with COVID-19. Korean J. Radiol. 2020, 21, 859. [Google Scholar] [CrossRef]
- Chamberlin, J.H.; Aquino, G.; Schoepf, U.J.; Nance, S.; Godoy, F.; Carson, L.; Giovagnoli, V.M.; Gill, C.E.; McGill, L.J.; O’Doherty, J. An interpretable chest CT deep learning algorithm for quantification of COVID-19 lung disease and prediction of inpatient morbidity and mortality. Acad. Radiol. 2022, 29, 1178–1188. [Google Scholar] [CrossRef]
- Kang, D.H.; Kim, G.H.; Park, S.B.; Lee, S.I.; Koh, J.S.; Brown, M.S.; Abtin, F.; McNitt-Gray, M.F.; Lee, J.S.; Goldin, J.G. Quantitative CT lung COVID scores: Prediction of rapid progression and monitoring longitudinal changes in COVID-19 pneumonia patients. Res. Sq. 2022. [Google Scholar] [CrossRef]

| Variables | Total (n = 218) | Non-Rapid Progressors (n = 197) | Rapidly Progressive (n = 21) | p-Value |
|---|---|---|---|---|
| Demographics, Mean (SD); median (IQR) | ||||
| Age | 53.33 (16.94) 57 (20) | 52.16 (16.92) 55 (20) | 64.29 (12.97) 64 (14) | 0.0012 + |
| BMI (kg/m2) a | 24.26 (3.80) 24.03 (4.18) | 24.18 (3.82) 23.9 (4.05) | 24.96 (3.56) 25.05 (4.76) | 0.2143 + |
| Demographics, n (%) | ||||
| Male | 106 (48.62) | 96 (48.73) | 10 (47.62) | 0.923 * |
| Comorbidity, n (%) | ||||
| Hypertension | 55 (25.23) | 48 (24.27) | 7 (33.33) | 0.428 * |
| Diabetes Mellitus | 40 (18.25) | 34 (17.26) | 6 (28.57) | 0.234 * |
| Dyslipidemia | 17 (7.80) | 17 (8.63) | 0 (0.00) | 0.383 * |
| Bronchial asthma | 3 (1.38) | 3 (1.52) | 0 (0.00) | >0.999 * |
| Cancer | 11 (5.05) | 9 (4.57) | 2 (9.52) | 0.287 * |
| Cardiovascular disease | 4 (1.83) | 4 (2.03) | 0 (0.00) | >0.999 * |
| Cerebrovascular disease | 3 (1.38) | 2 (1.02) | 1 (4.76) | 0.263 * |
| Chronic liver disease | 2 (0.92) | 2 (1.02) | 0 (0.00) | >0.999 * |
| Chronic kidney disease | 2 (0.92) | 1 (0.51) | 1 (4.76) | 0.184 * |
| Rheumatologic disease | 3 (1.38) | 2 (1.02) | 1 (4.76) | 0.263 * |
| Neurologic disorder | 6 (2.75) | 5 (2.54) | 1 (4.76) | 0.459 * |
| Clinical Outcome, n (%) | ||||
| O2 demand | 34 (15.60) | 13 (6.67) | 21 (100) | <0.001 * |
| Mechanical ventilation | 21 (9.63) | 0 (0) | 21 (100) | <0.001 * |
| ECMO usage | 5 (2.29) | 0 (0) | 5 (23.81) | <0.001 * |
| Death | 4 (1.83) | 0 (0) | 4 (19.05) | <0.001 * |
| Clinical Outcome, Mean (SD); median (IQR) | ||||
| Duration of stay b (days) | 14.68 (10.92) 12 (11) | 13.21 (8.61) 12 (9) | 29.83 (18.70) 27.5 (24) | 0.0001 ++ |
| WBC (/µL) | 5420 (2124) 4960 (2380) | 5302 (2057) 4900 (2250) | 6534 (2454) 6560 (4500) | 0.0151 ++ |
| PLT (/µL) | 201,779 (61,794) 190,500 (95,000) | 204,700 (60,780) 193,000 (82,000) | 174,430 (66,010) 182,000 (95,000) | 0.0517 ++ |
| Neutrophil (/µL) | 3606 (1840) 3270 (2160) | 3445.63 (1686.04) 3200 (1900) | 5106.67(2502.19) 4600 (3200) | 0.0015 ++ |
| Neutrophil, % | 64.43 (12.06) 64.4 (16.4) | 63.21 (11.45) 62.8 (15) | 75.94 (11.74) 73.8 (16.3) | <0.0001 ++ |
| Lymphocyte (/µL) | 1312.94 (692.4) 1200 (660) | 1354.16 (695.5) 1290 (650) | 926.19 (537.1) 850 (510) | 0.0019 ++ |
| Lymphocyte, % | 25.60 (10.10) 25.35 (13.7) | 26.58 (9.71) 25.8 (12.2) | 16.40 (9.13) 18.0 (11.8) | <0.0001 ++ |
| Ratio of Neutrophil to Lymphocyte count | 4.08 (8.38) 2.56 (2.16) | 3.12 (2.56) 2.41 (1.55) | 13.11 (24.57) 3.97 (5.55) | <0.0001 ++ |
| CRP (mg/dL) c | 2.33 (3.48) 0.7 (2.50) | 1.77 (2.60) 0.7 (1.80) | 7.88 (5.67) 7.0 (7.75) | <0.0001 ++ |
| PCT (ng/mL) | 0.07 (0.14) 0.05 (0.00) | 0.06 (0.11) 0.05 (0.00) | 0.17 (0.28) 0.05 (0.04) | <0.0001 ++ |
| IL-6 (pg/mL) d | 42.13 (163.55) 5.80 (20.5) | 37.61 (165.43) 5.45 (17.4) | 93.75 (133.79) 43.8 (65.2) | <0.0001 ++ |
| Radiological Outcome, Mean (SD); median (IQR) | ||||
| QGGO CAD, % | 12.62 (9.43) 9.3 (14.1) | 12.19 (9.34) 9.0 (12.7) | 16.67 (9.51) 17.3 (15.6) | 0.0321 ++ |
| QMD CAD, % | 4.30 (6.93) 1.8 (3.7) | 3.05 (3.20) 1.6 (2.6) | 16.00 (16.16) 12.2 (15.4) | <0.0001 ++ |
| QCON CAD, % | 0.40 (1.58) 0.10 (0.20) | 0.19 (0.34) 0.10 (0.20) | 2.33 (4.65) 0.40 (2.9) | 0.0002 ++ |
| QTLD CAD, % | 17.31 (14.05) 12.05 (20.9) | 15.43 (11.70) 10.7 (16.1) | 35.00 (20.87) 35.7 (21.8) | 0.0001 ++ |
| QGGO, % | QMD, % | QCON, % | QTLD, % | QMD/QTLD, % | |
|---|---|---|---|---|---|
| Rho (r) | |||||
| (p-Value) | |||||
| WBC | 0.1553 * | 0.1357 * | 0.1366 * | 0.1857 * | 0.0082 |
| (0.0218) | (0.0453) | (0.0439) | (0.0060) | (0.90) | |
| PLT | −0.0292 | −0.1718 * | −0.0570 | −0.0721 | −0.2208 * |
| (0.67) | (0.0110) | (0.4025) | (0.2892) | (0.0010) | |
| Neutrophil Count | 0.1990 * | 0.2385 * | 0.2531 * | 0.2533 * | 0.0950 |
| (0.0043) | (0.0004) | (0.0002) | (0.0002) | (0.16) | |
| Neutrophil % | 0.1926 * | 0.3651 * | 0.3728 * | 0.2898 * | 0.3070 * |
| (0.0043) | (<0.0001) | (<0.0001) | (0.0001) | (<0.0001) | |
| Lymphocyte Count | −0.1063 | −0.2950 * | −0.2326 * | −0.1889 * | −0.3210 * |
| (0.12) | (<0.0001) | (0.0005) | (0.0051) | (<0.0001) | |
| Lymphocyte % | −0.1844 * | −0.3428 * | −0.3209 * | −0.2729 * | −0.2931 * |
| (0.0063) | (<0.0001) | (<0.0001) | (<0.0001) | (<0.0001) | |
| NLR | 0.1924 * | 0.3545 * | 0.3405 * | 0.2835 * | 0.2965 * |
| (0.0044) | (<0.0001) | (<0.0001) | (<0.0001) | (<0.0001) | |
| CRP a | 0.3270 * | 0.5669 * | 0.3327 * | 0.4298 * | 0.4741 * |
| (<0.0001) | (<0.0001) | (<0.0001) | (<0.0001) | (<0.0001) | |
| PCT b | 0.1757 * | 0.2587 | 0.2090 * | 0.2185 * | 0.1768 * |
| (0.0102) | (0.2697) | (0.0022) | (0.0013) | (0.0097) | |
| IL6 c | 0.2560 * | 0.4908 * | 0.2605 * | 0.3389 * | 0.4594 * |
| (0.0002) | (<0.0001) | (0.0001) | (<0.0001) | (<0.0001) | |
| PaO2 d | −0.0801 | −0.2547 * | −0.0896 | −0.1751 * | −0.3006 * |
| (0.2438) | (0.0005) | (0.23) | (0.0184) | (<0.0001) | |
| Quantitative COVID Score | Odds Ratio (SD) | 95% CI Odds Ratio | p-Value | AUC | 95% CI AUC |
|---|---|---|---|---|---|
| QGGO, % | 1.05 (0.023) | [1.00, 1.09] | 0.043 | 0.642 | [0.513, 0.771] |
| QMD, % | 1.30 (0.068) | [1.18, 1.44] | <0.001 | 0.813 | [0.679, 0.947] |
| QCON, % | 3.71 (1.30) | [1.87, 7.38] | <0.001 | 0.735 | [0.590, 0.881] |
| QTLD, % | 1.09 (0.19) | [1.05, 1.13] | <0.001 | 0.768 | [0.625, 0.910] |
| Univariate-Analysis | Multivariate-Analysis | |||||||||
|---|---|---|---|---|---|---|---|---|---|---|
| OR (SE) | p-Value | 95% CI of OR | AUC [95% CI] | OR (SE) | OR (SE) | OR (SE) | OR (SE) | OR (SE) | OR (SE) | |
| Age | 1.05 (0.02) | 0.002 | [1.02, 1.09] | 0.716 [0.608, 0.824] | 1.05 (0.02) ** | 1.04 (0.02) + | ||||
| BMI | 1.05 (0.06) | 0.38 | [0.93, 1.18] | 0.585 [0.447, 0.722] | ||||||
| Male | 0.96 (0.44) | 0.92 | [0.39, 2.35] | 0.506 [0.389, 0.625] | ||||||
| QMD | 1.30 (0.07) | <0.001 | [1.18, 1.44] | 0.813 [0.679, 0.947] | ||||||
| QMD ≥ 10% | 28.31 (15.4) | <0.001 | [9.72, 82.3] | 0.800 [0.696, 0.905] | 15.72 (9.60) ** | 13.24 (7.50) ** | 10.21 (6.50) ** | 15.94 (9.85) ** | 10.80 (7.02) ** | |
| IL-6 | 1.00 (0.0009) | 0.238 | [0.992, 1.002] | 0.830 [0.746, 0.915] | ||||||
| IL-6 >7 pg/mL | 10.24 (7.85) | 0.002 | [2.28, 46.0] | 0.730 [0.644, 0.816] | 4.70 (3.86) * | 9.19 (10.35) * | 6.57 (7.75) + | 3.36 (2.84) + | 4.55 (5.48) + | |
| CRP | 1.40 (0.088) | <0.001 | [1.24, 1.58] | 0.855 [0.746, 0.964] | ||||||
| CRP ≥ 1 mg/dL | 14.96 (11.37) | <0.001 | [3.37, 66.3] | 0.762 [0.687, 0.848] | 6.09 (4.98) ** | 4.16 (3.49) ** | 2.09 (1.93) + | 2.00 (1.85) + | ||
| AUC [95% CI] | 0.864 [0.775, 0.953] | 0.856 [0.763, 0.949] | 0.802 [0.718, 0.886] | 0.868 [0.770, 0.966] | 0.886 [0.795, 0.974] | 0.882 [0.786, 0.979] | ||||
| Changes in Different QMD Scores, n = 82, R2 = 0.66 | ||||
| Coefficient | SE | p-Value | [95% CI] | |
| PCR Septum positive result | 1.437 | 1.430 | 0.318 | [−1.412, 4.286] |
| Duration | 0.144 | 0.129 | 0.266 | [−0.112, 0.400] |
| QMD at baseline | −0.841 | 0.084 | <0.001 | [−1.009, −0.673] |
| Age | 0.126 | 0.050 | 0.013 | [0.027, 0.224] |
| Rapid Progressors | 4.913 | 2.045 | 0.019 | [0.838, 8.988] |
| CRP | 0.403 | 0.131 | 0.003 | [0.142, 0.664] |
| Constant | −4.803 | 3.245 | 0.143 | [−11.268, 1.662] |
| Changes in Different QMD within Ten Days, n = 60, R2 = 0.44 | ||||
| Coefficient | SE | p-Value | [95% CI] | |
| PCR Septum positive result | −0.178 | 1.761 | 0.920 | [−3.710, 3.354] |
| Duration | 0.022 | 0.468 | 0.963 | [−0.917, 0.960] |
| QMD at baseline | −0.688 | 0.204 | 0.001 | [−1.097, −0.279] |
| Age | 0.133 | 0.061 | 0.034 | [0.011, 0.256] |
| Rapid Progressors | 4.598 | 2.492 | 0.071 | [−0.401, 9.597] |
| CRP | 0.390 | 0.164 | 0.021 | [0.062, 0.718] |
| Constant | −3.576 | 5.429 | 0.513 | [−14.466, 7.313] |
Disclaimer/Publisher’s Note: The statements, opinions and data contained in all publications are solely those of the individual author(s) and contributor(s) and not of MDPI and/or the editor(s). MDPI and/or the editor(s) disclaim responsibility for any injury to people or property resulting from any ideas, methods, instructions or products referred to in the content. |
© 2024 by the authors. Licensee MDPI, Basel, Switzerland. This article is an open access article distributed under the terms and conditions of the Creative Commons Attribution (CC BY) license (https://creativecommons.org/licenses/by/4.0/).
Share and Cite
Kang, D.H.; Kim, G.H.J.; Park, S.-B.; Lee, S.-I.; Koh, J.S.; Brown, M.S.; Abtin, F.; McNitt-Gray, M.F.; Goldin, J.G.; Lee, J.S. Quantitative Computed Tomography Lung COVID Scores with Laboratory Markers: Utilization to Predict Rapid Progression and Monitor Longitudinal Changes in Patients with Coronavirus 2019 (COVID-19) Pneumonia. Biomedicines 2024, 12, 120. https://doi.org/10.3390/biomedicines12010120
Kang DH, Kim GHJ, Park S-B, Lee S-I, Koh JS, Brown MS, Abtin F, McNitt-Gray MF, Goldin JG, Lee JS. Quantitative Computed Tomography Lung COVID Scores with Laboratory Markers: Utilization to Predict Rapid Progression and Monitor Longitudinal Changes in Patients with Coronavirus 2019 (COVID-19) Pneumonia. Biomedicines. 2024; 12(1):120. https://doi.org/10.3390/biomedicines12010120
Chicago/Turabian StyleKang, Da Hyun, Grace Hyun J. Kim, Sa-Beom Park, Song-I Lee, Jeong Suk Koh, Matthew S. Brown, Fereidoun Abtin, Michael F. McNitt-Gray, Jonathan G. Goldin, and Jeong Seok Lee. 2024. "Quantitative Computed Tomography Lung COVID Scores with Laboratory Markers: Utilization to Predict Rapid Progression and Monitor Longitudinal Changes in Patients with Coronavirus 2019 (COVID-19) Pneumonia" Biomedicines 12, no. 1: 120. https://doi.org/10.3390/biomedicines12010120
APA StyleKang, D. H., Kim, G. H. J., Park, S.-B., Lee, S.-I., Koh, J. S., Brown, M. S., Abtin, F., McNitt-Gray, M. F., Goldin, J. G., & Lee, J. S. (2024). Quantitative Computed Tomography Lung COVID Scores with Laboratory Markers: Utilization to Predict Rapid Progression and Monitor Longitudinal Changes in Patients with Coronavirus 2019 (COVID-19) Pneumonia. Biomedicines, 12(1), 120. https://doi.org/10.3390/biomedicines12010120