
The Effect of Local Anesthetics on Neutrophils in the Context of Different Isolation Techniques

Abstract
1. Introduction
1.1. Polymorphonuclear Neutrophils: Immune Mechanisms in Disease
1.2. Local Anesthetics: Their Usage and Influence on the Immune System
1.3. Study Hypothesis: Impact of LA on PMNs
2. Materials and Methods
2.1. Experimental Design and Observed Parameters
2.2. Blood Sampling
2.3. Collection of Autologous Serum and Isolation of PMNs
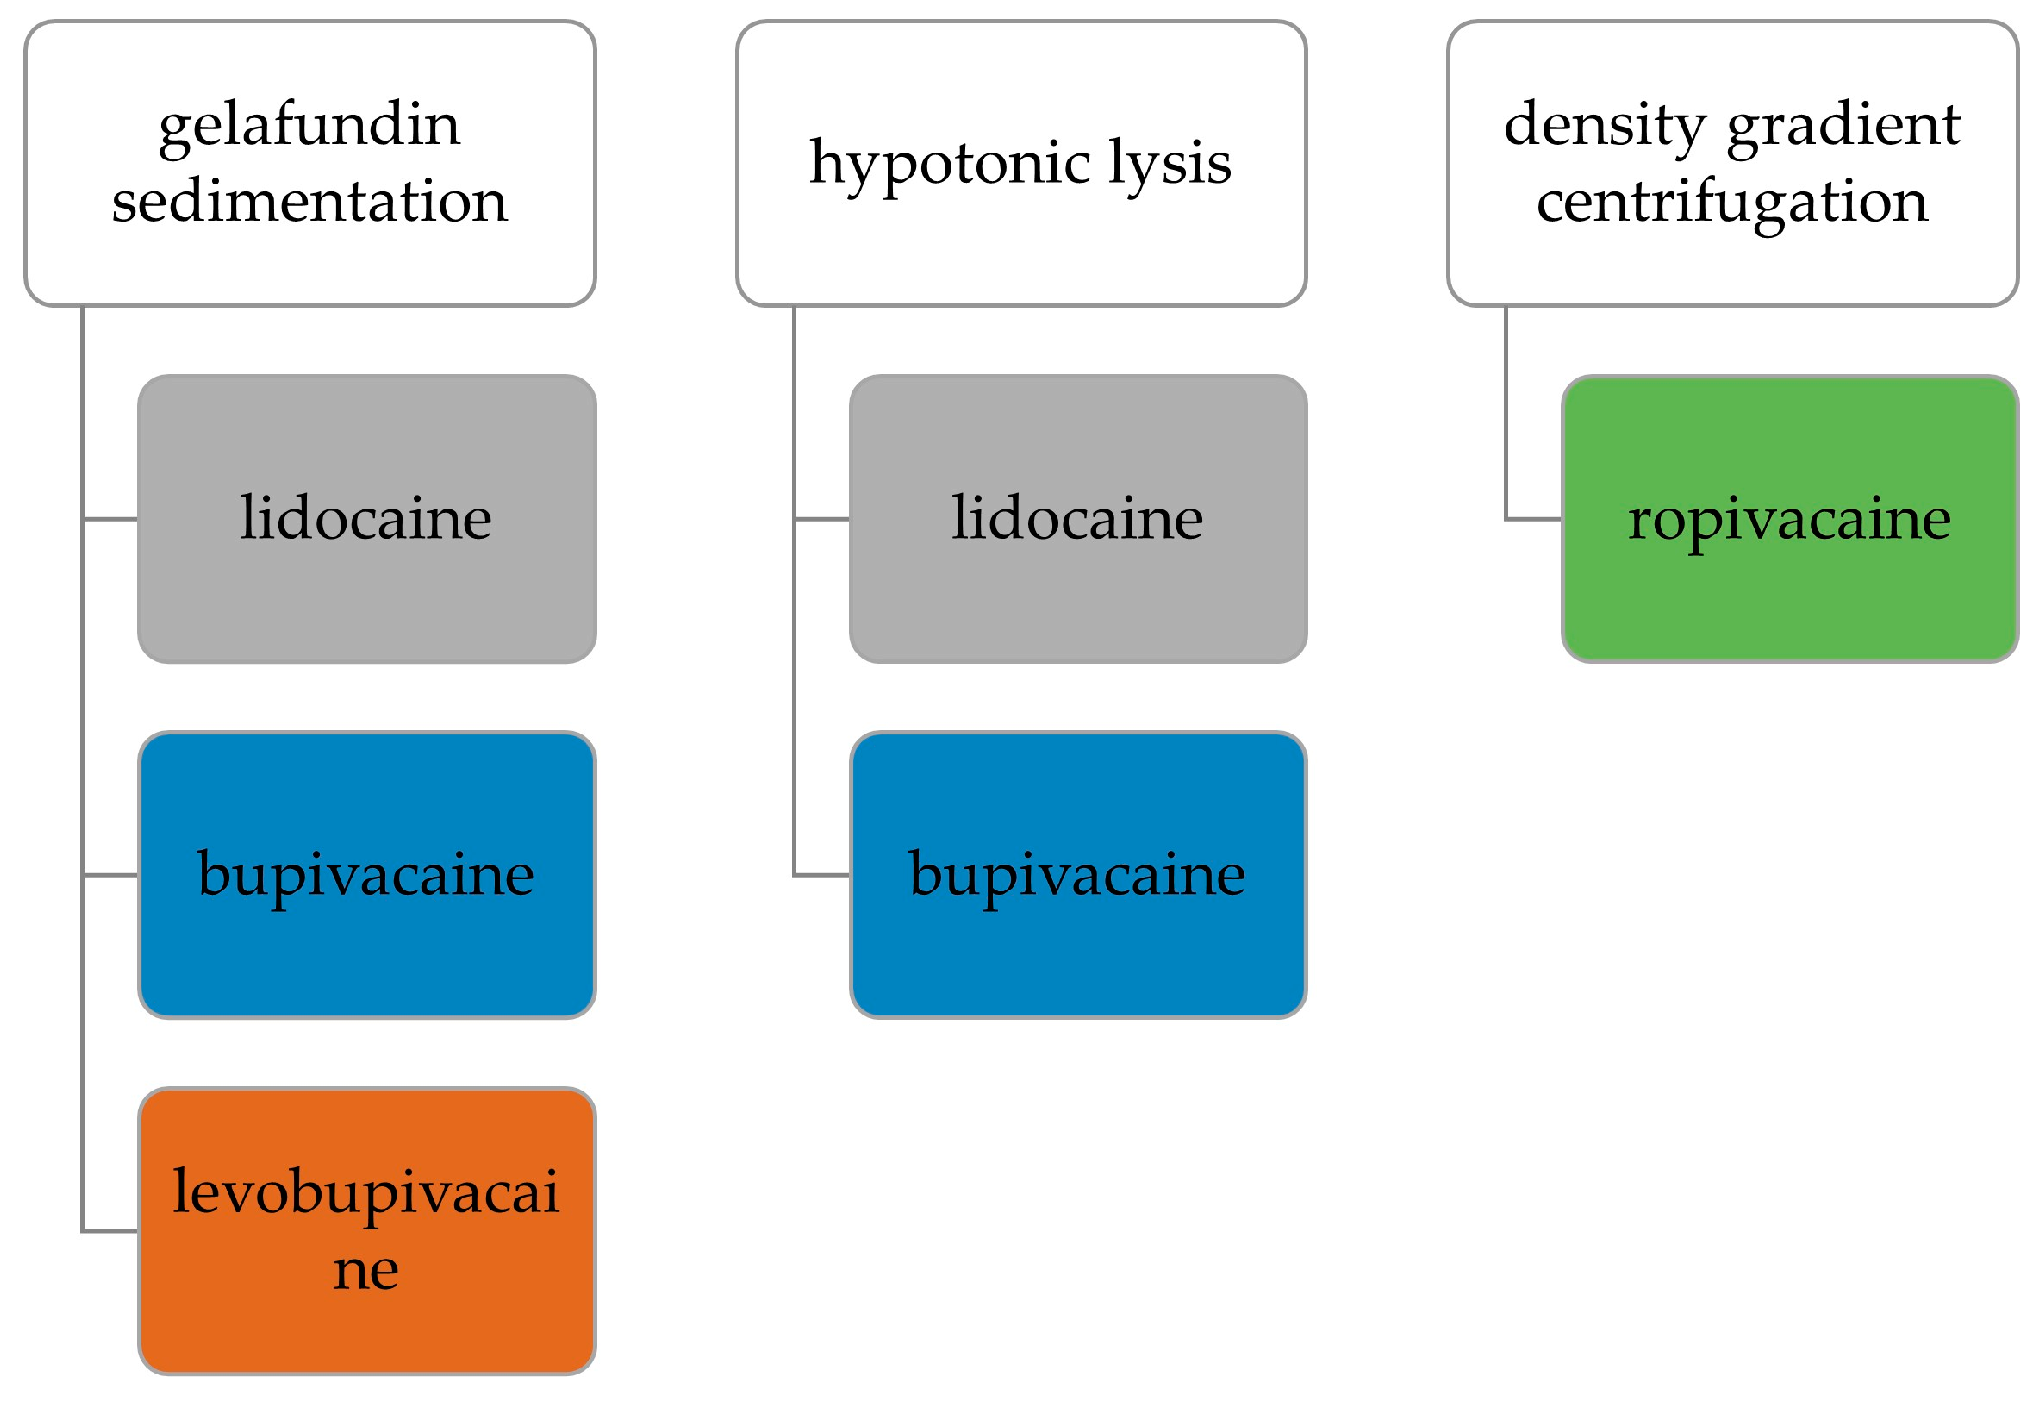
2.3.1. Gelafundin Sedimentation
2.3.2. Hypotonic Lysis
2.3.3. Density Gradient Centrifugation
2.4. Local Anesthetics and Fluorescence Staining
2.5. Live Cell Imaging
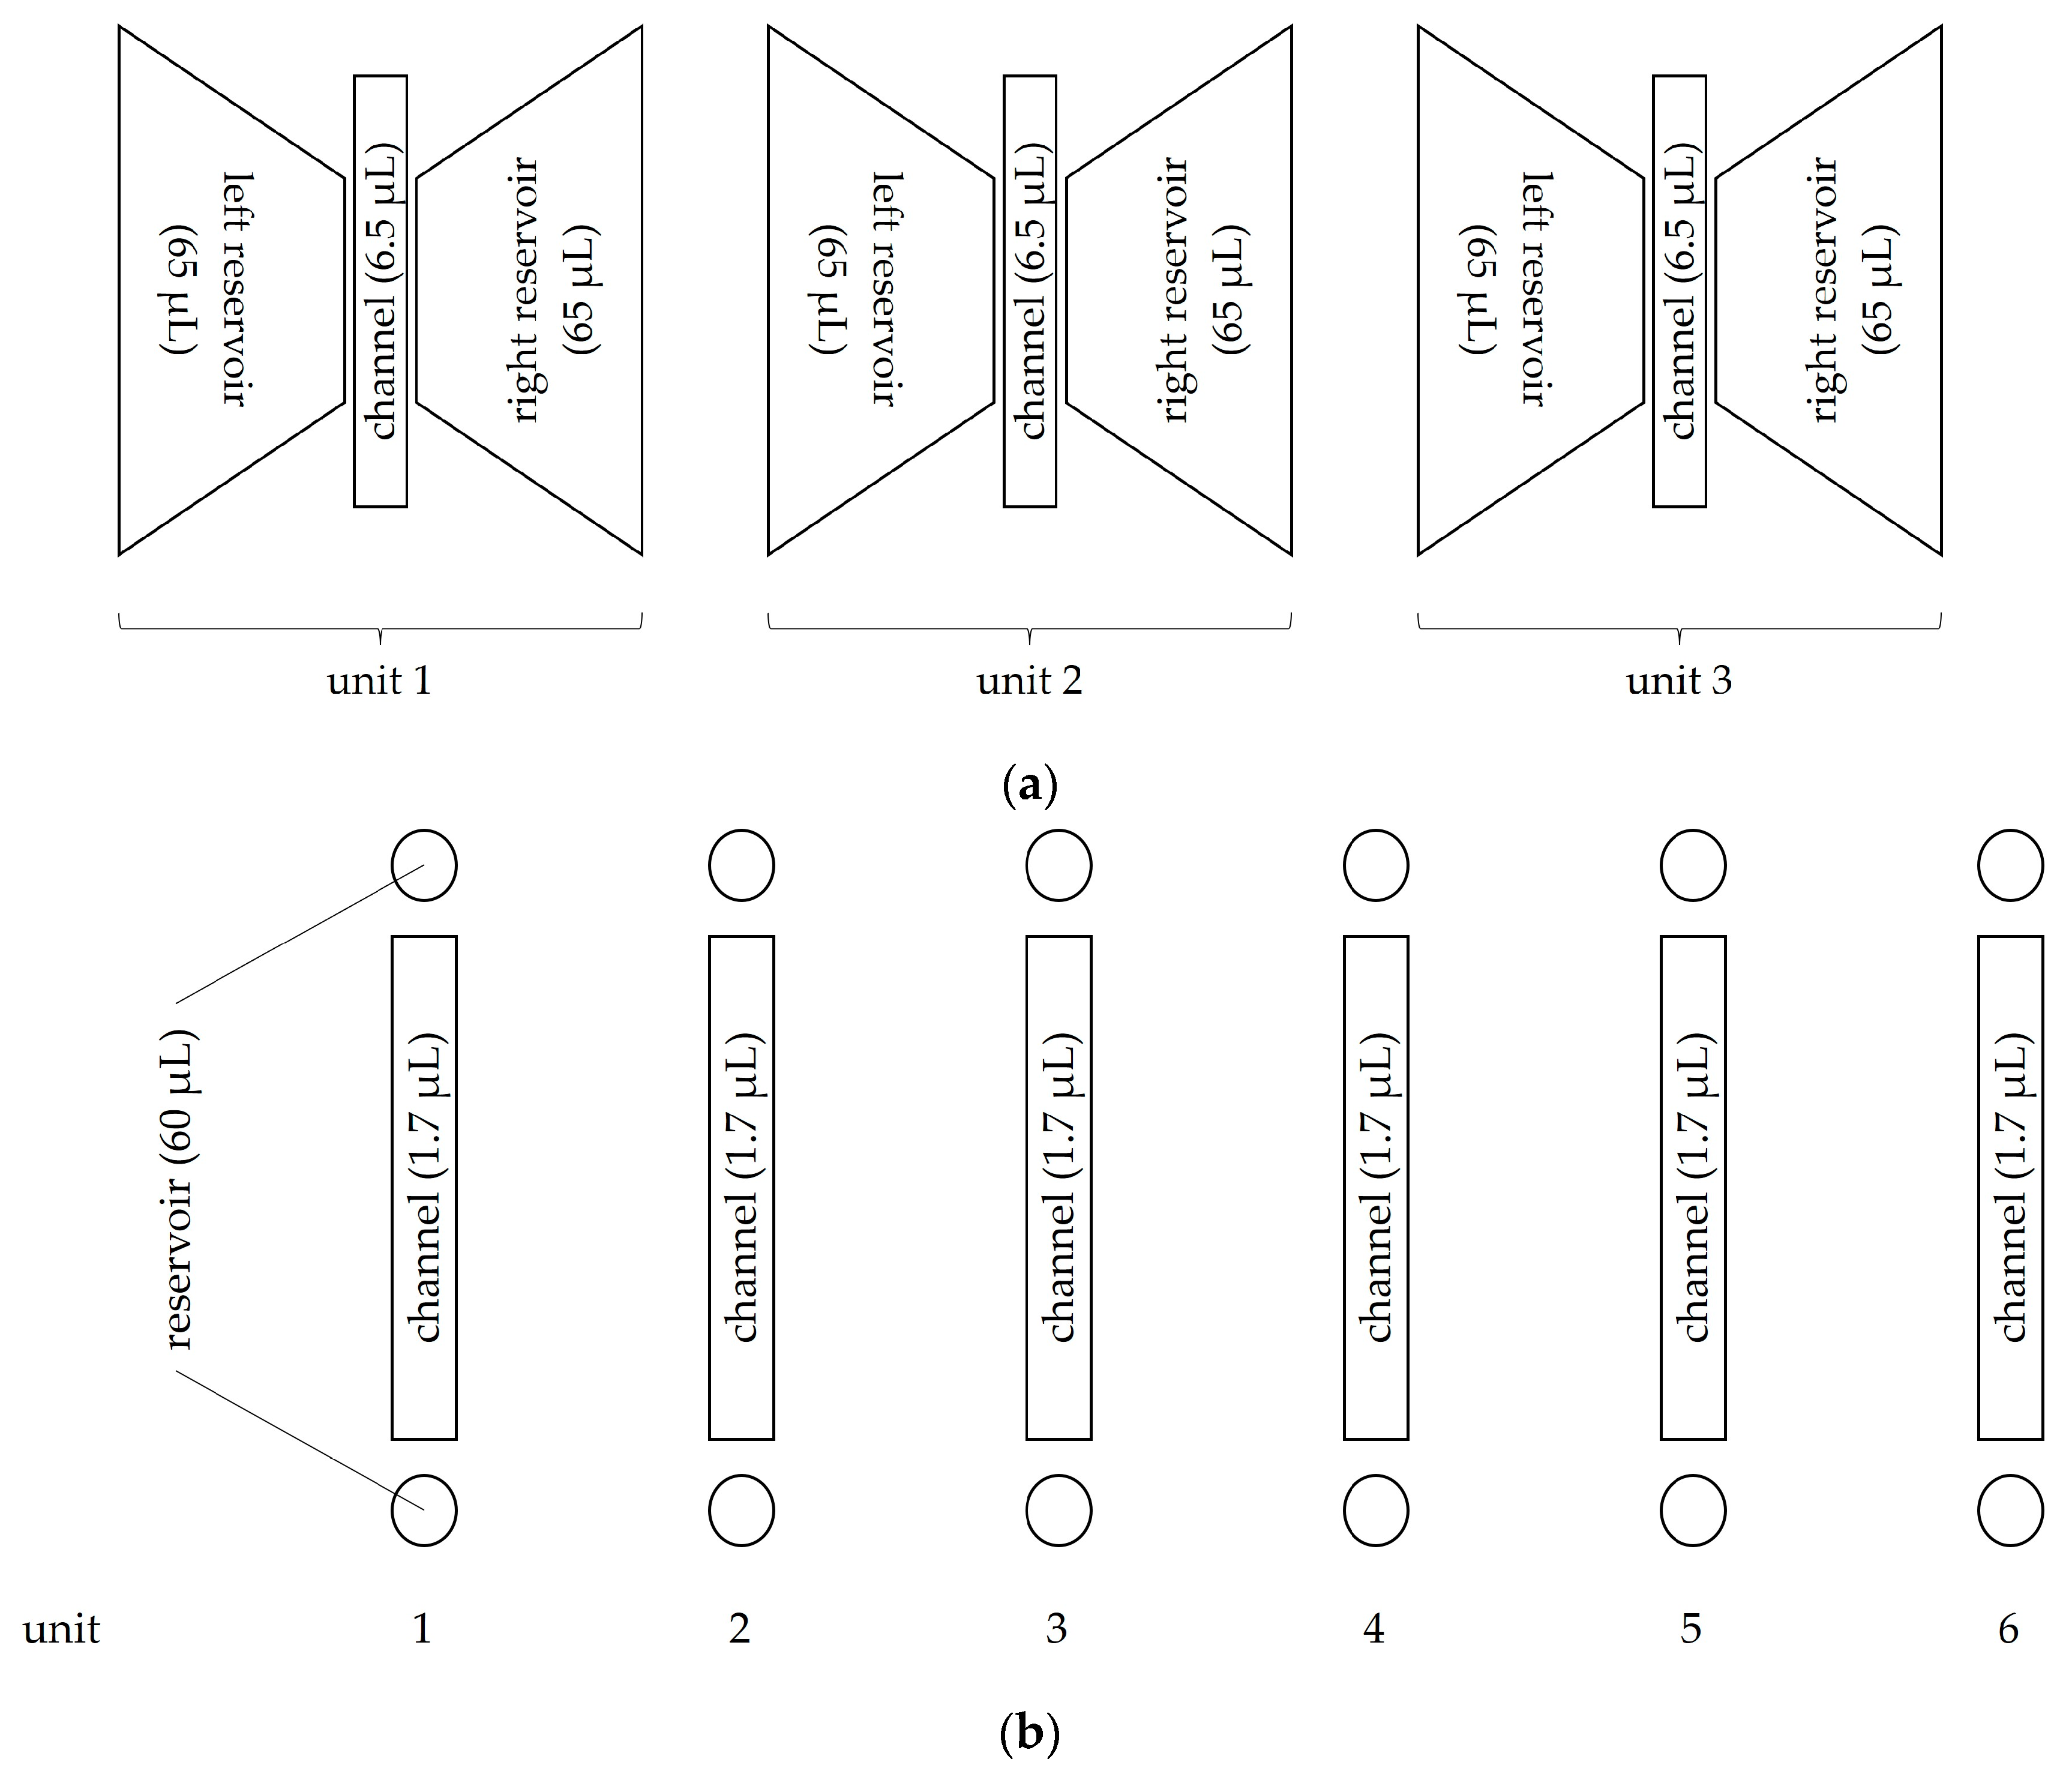
2.5.1. Migration Assay after Gelafundin Sedimentation
2.5.2. NETosis and ROS Assay after Gelafundin Sedimentation
2.5.3. Migration and NETosis Assay after Hypotonic Lysis and Density Gradient Centrifugation
2.5.4. Microscopy Setting
2.6. Flow Cytometry
2.7. Evaluation and Statistical Analysis
3. Results
3.1. Antigen Expression—Flow Cytometry
3.2. Viability and ROS Production—Flow Cytometry
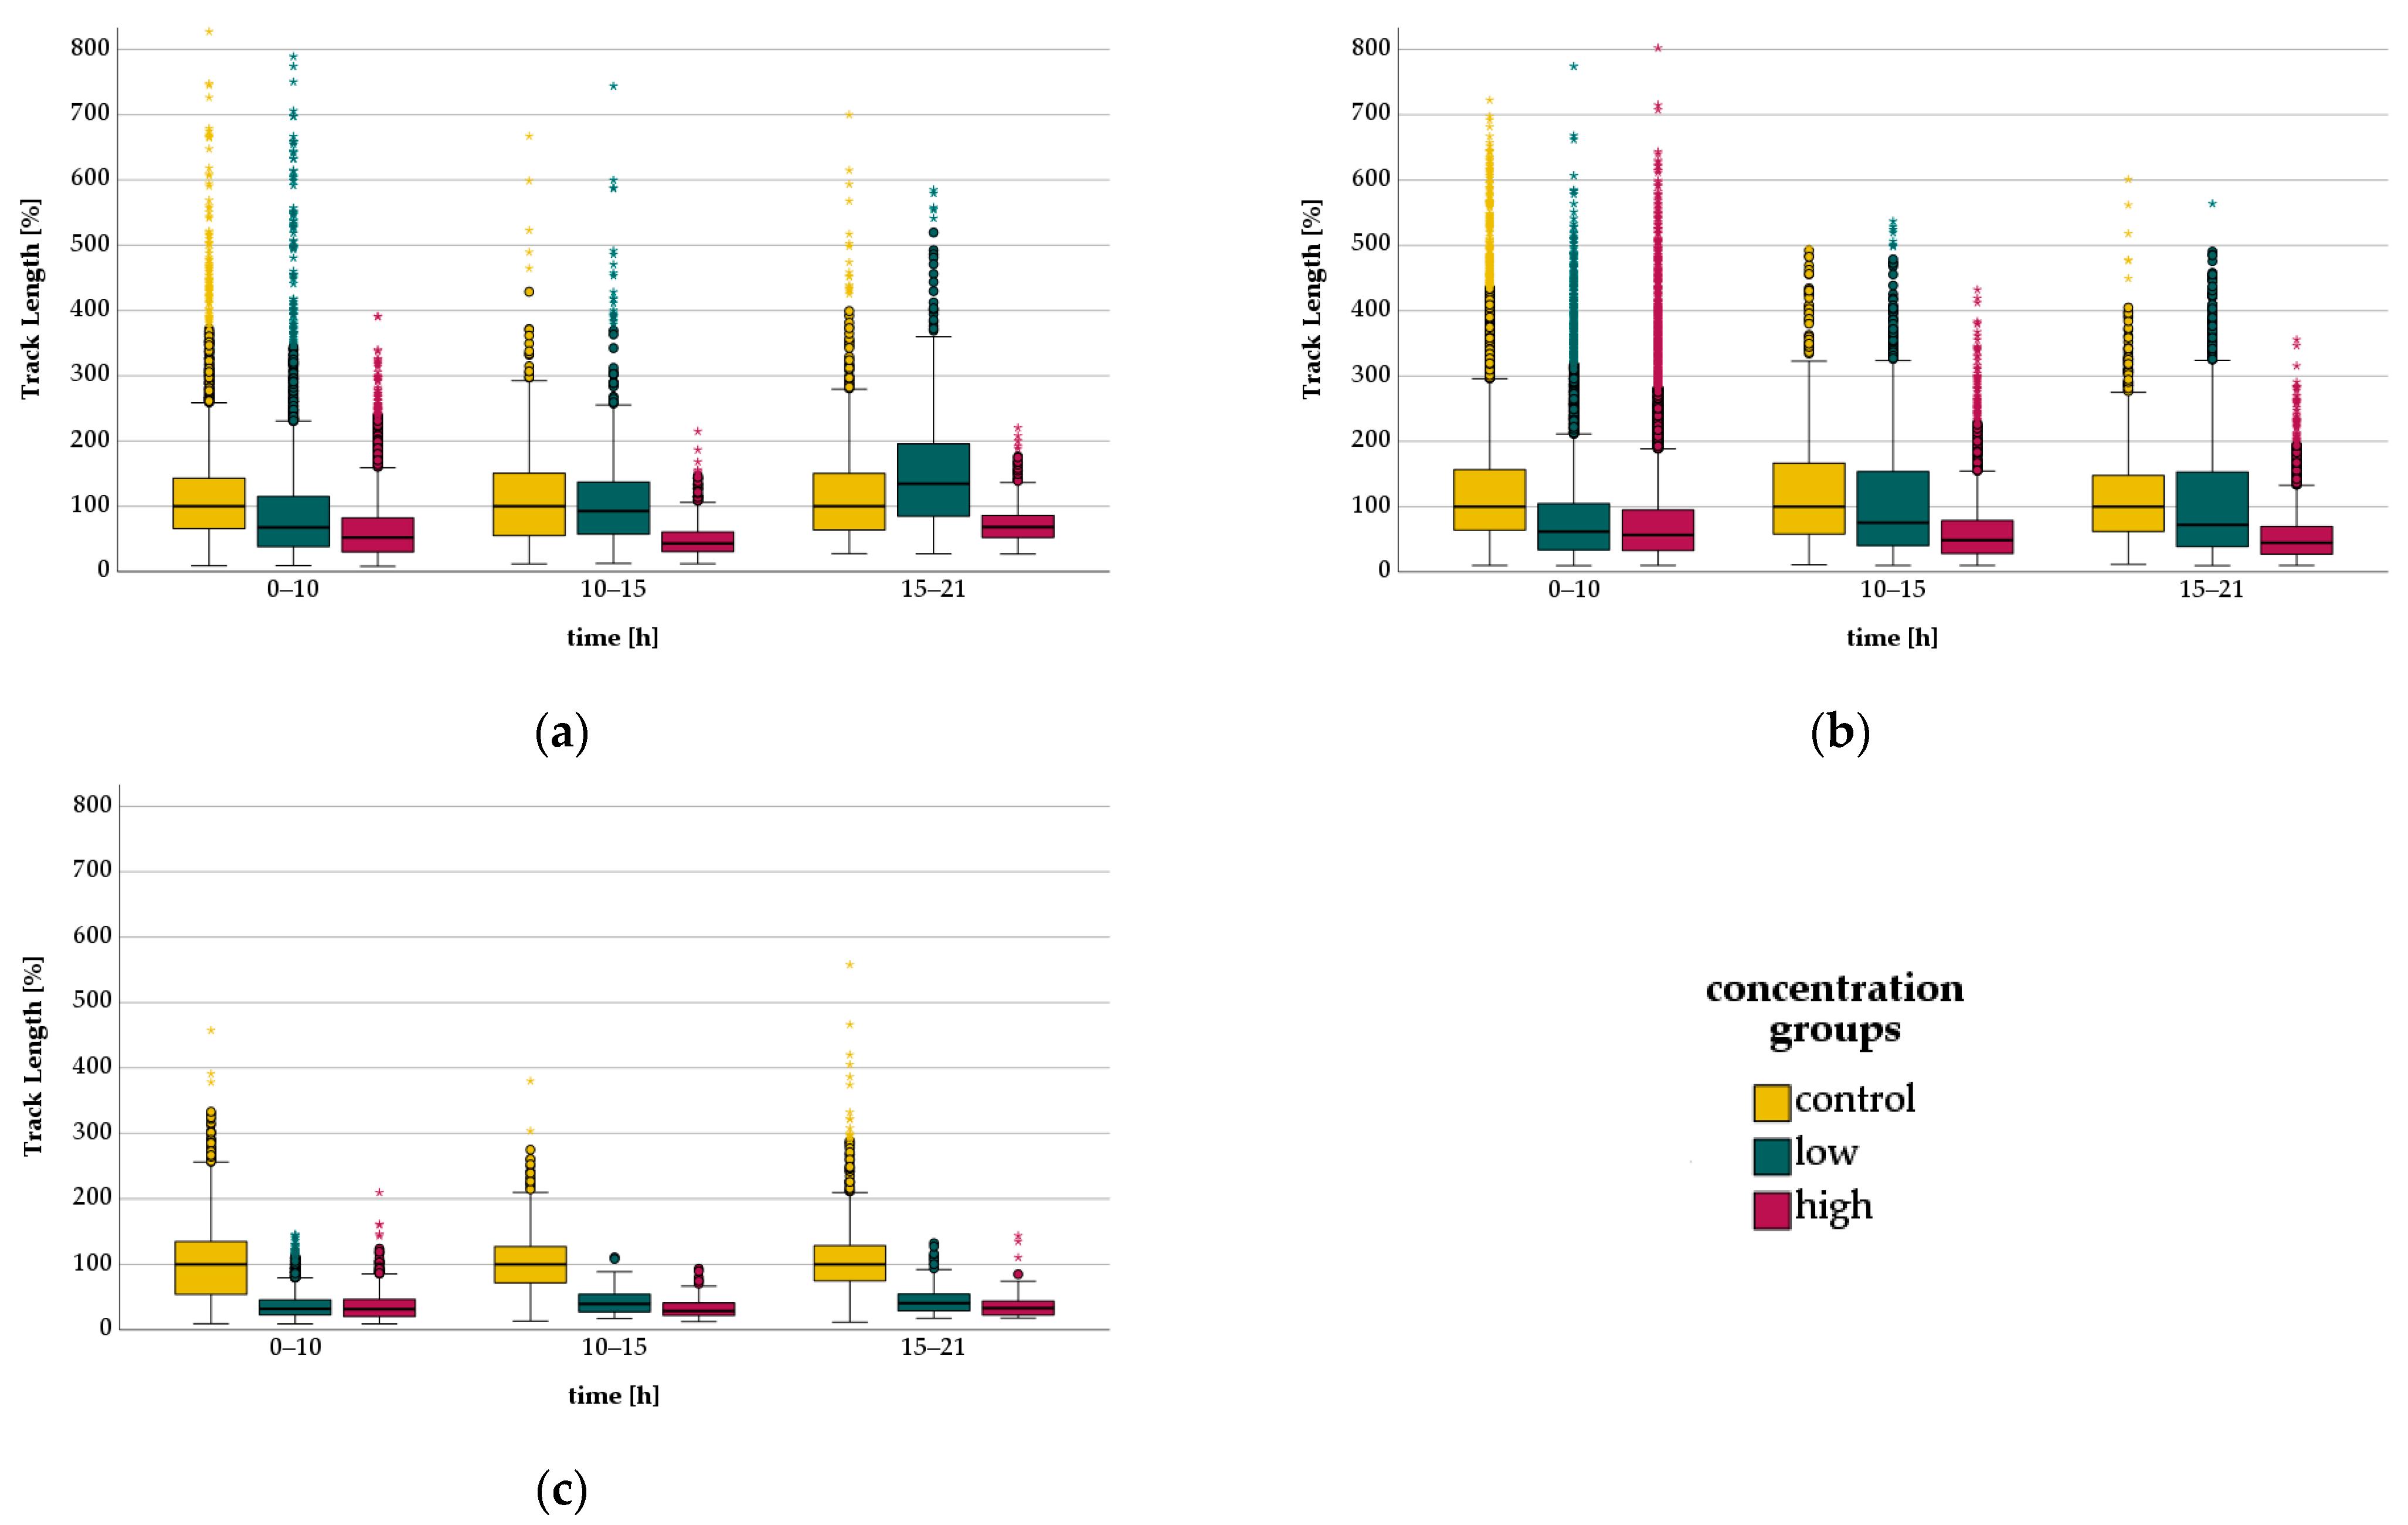
3.3. Migration—Live Cell Imaging
3.3.1. Bupivacaine - Migration
3.3.2. Levobupivacaine-Migration
3.3.3. Lidocaine-Migration
3.4. NETosis—Live Cell Imaging
3.4.1. Bupivacaine-NETosis
3.4.2. Levobupivacaine-NETosis
3.4.3. Lidocaine-NETosis
3.5. Migration and NETosis with Autologous Serum and FCS after Gelafundin Isolation—Live Cell Imaging
3.6. Comparison of Isolation Methods—Live Cell Imaging
3.6.1. Migration
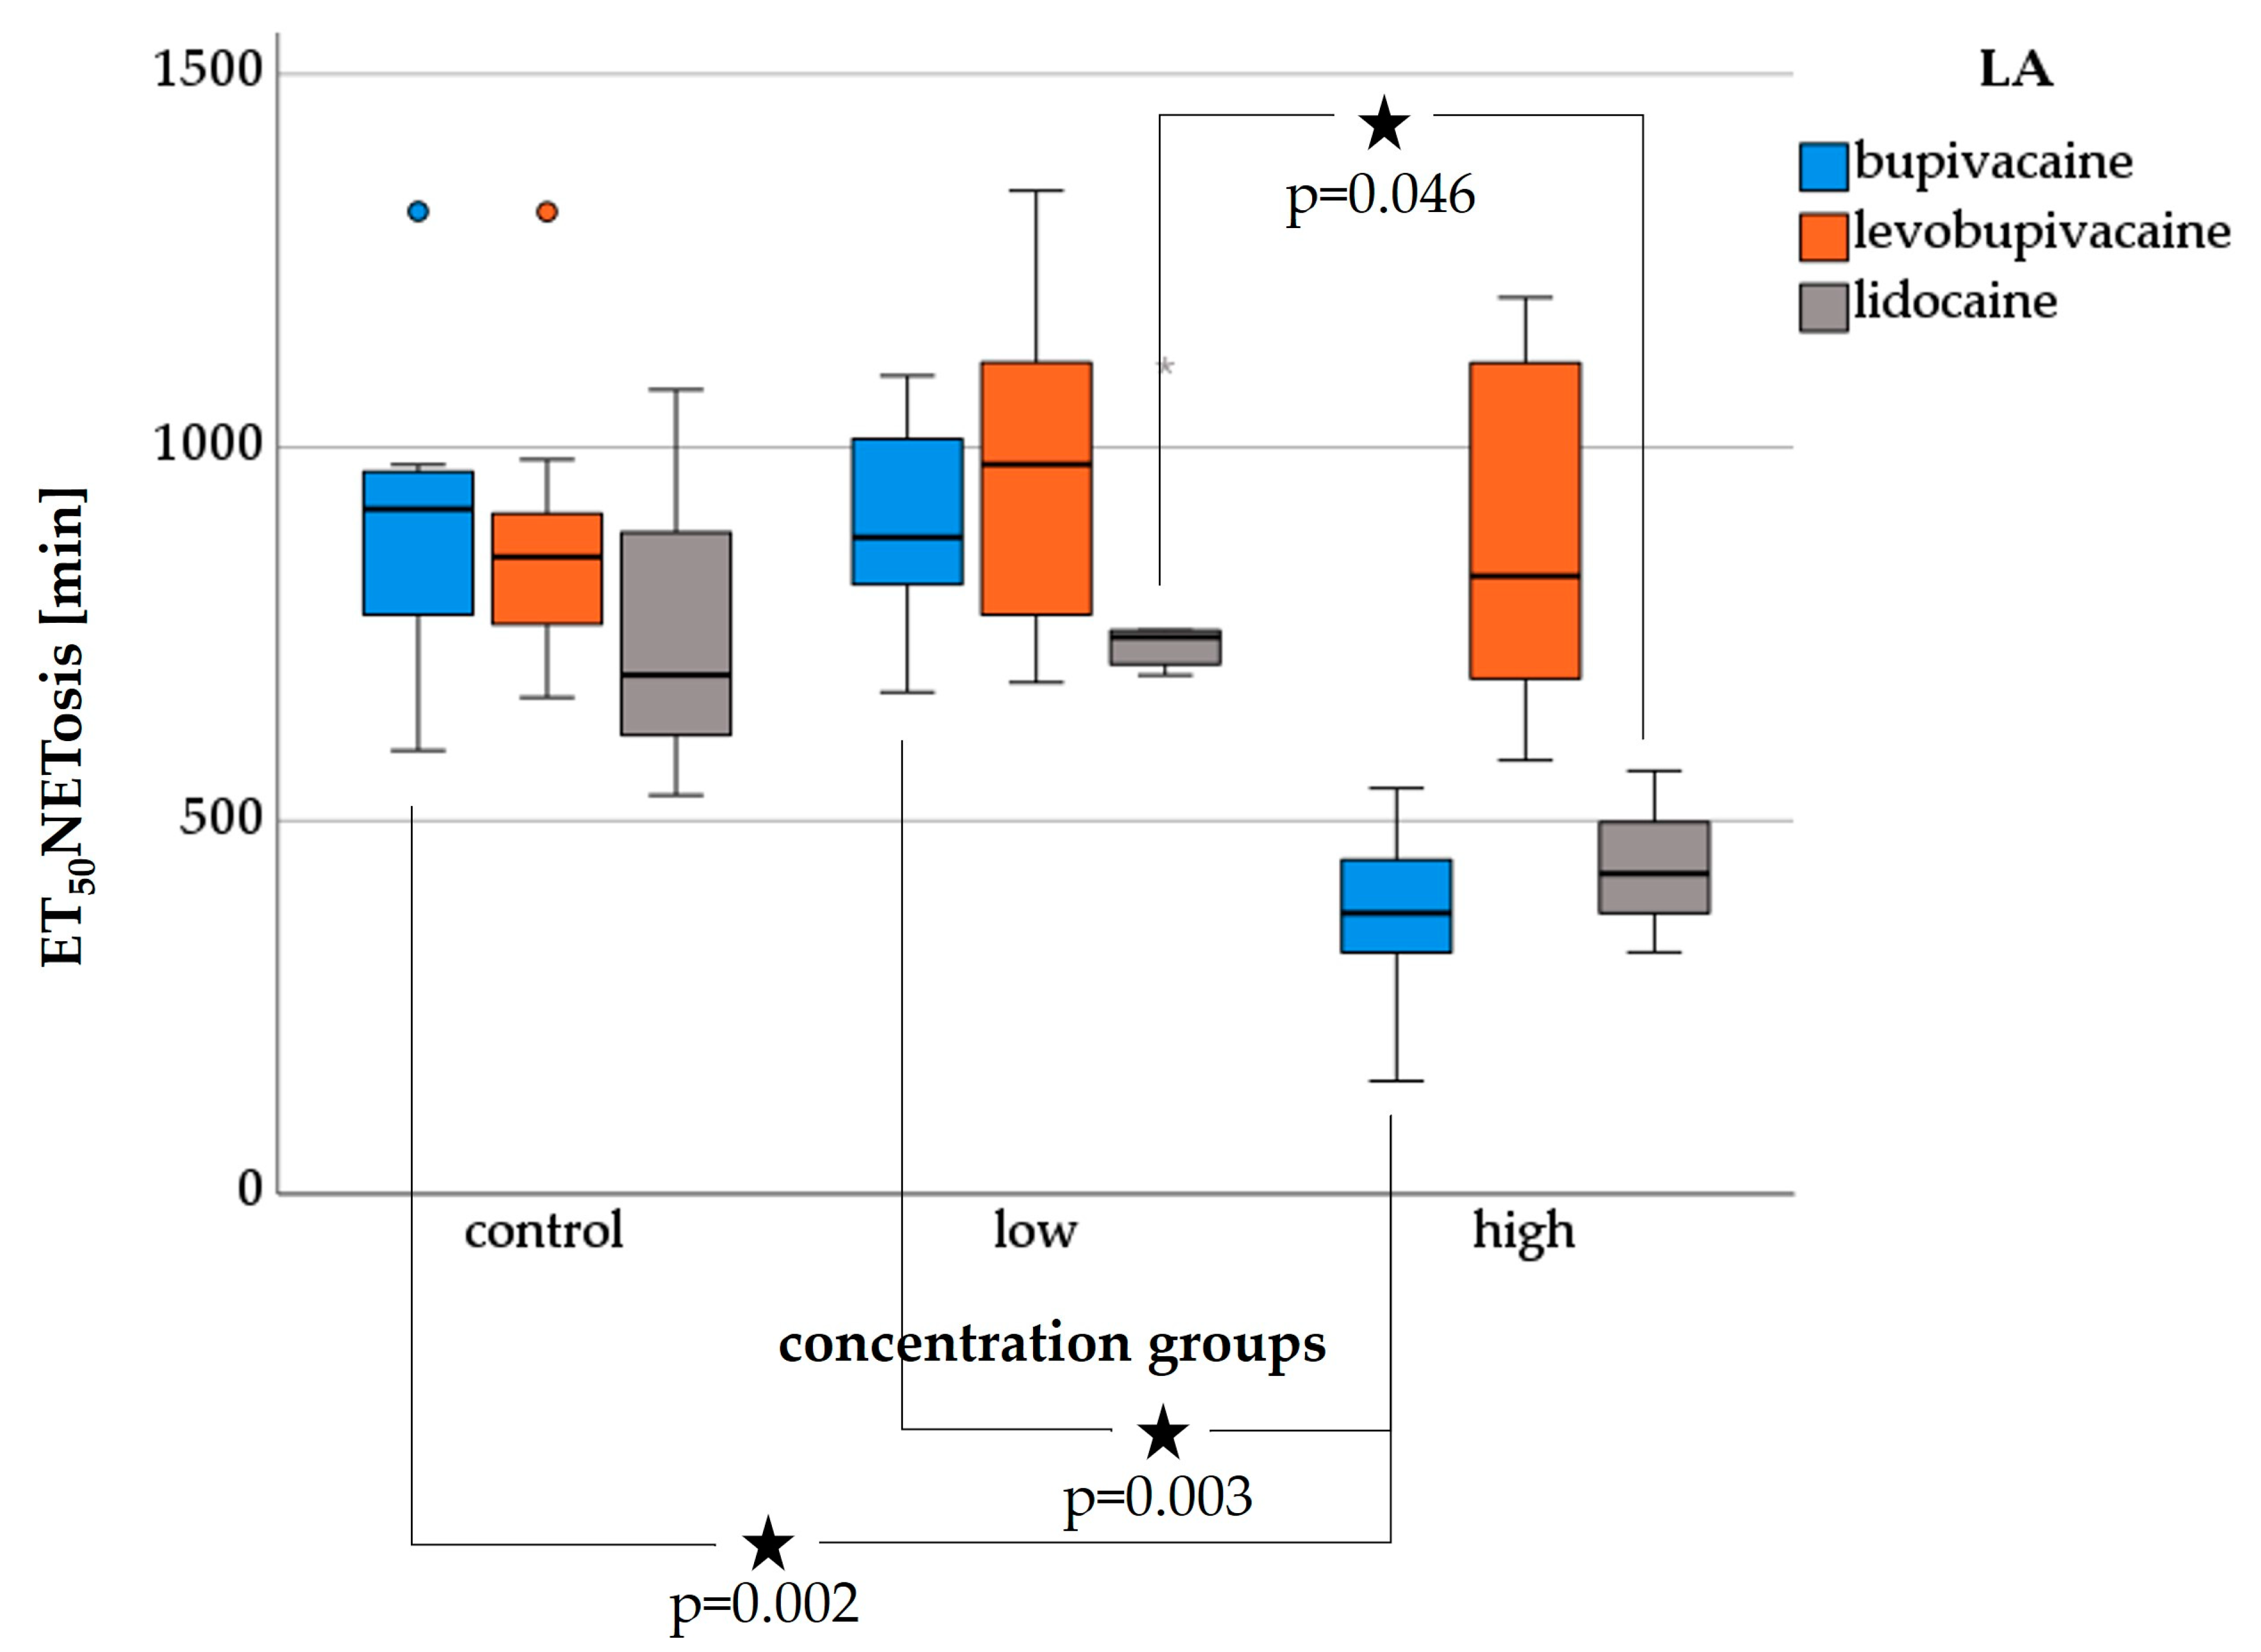
3.6.2. ET50NETosis
3.6.3. EC50NETosis
4. Discussion
5. Conclusions
Author Contributions
Funding
Institutional Review Board Statement
Informed Consent Statement
Data Availability Statement
Acknowledgments
Conflicts of Interest
Appendix A

| Assay | Left/Upper Reservoir | Channel | Right/Lower Reservoir |
|---|---|---|---|
| Migration assay after gelafundin sedimentation | fMLP with LA in RPMI and autologous serum | Medium (17%) * | Cells in autologous serum |
| Collagen (50%) | |||
| RPMI (33%) | |||
| NETosis and ROS assay after gelafundin sedimentation | Medium (13%) * Collagen (50%) Cells (13%) LA (25%) | Medium (13%) * Collagen (50%) Cells (13%) LA (25%) | Medium (13%) * Collagen (50%) Cells (13%) LA (25%) |
| Migration and NETosis assay after hypotonic lysis and density gradient centrifugation | fMLP with LA in RPMI and FCS | Medium (17%) * | LA in RPMI and FCS |
| Collagen (50%) | |||
| Cells (33%) |
References
- Mayadas, T.N.; Cullere, X.; Lowell, C.A. The multifaceted functions of neutrophils. Annu. Rev. Pathol. 2014, 9, 181–218. [Google Scholar] [CrossRef] [PubMed]
- Vorobjeva, N.V.; Chernyak, B.V. NETosis: Molecular Mechanisms, Role in Physiology and Pathology. Biochemistry 2020, 85, 1178–1190. [Google Scholar] [CrossRef] [PubMed]
- Borregaard, N. Neutrophils, from marrow to microbes. Immunity 2010, 33, 657–670. [Google Scholar] [CrossRef]
- Borregaard, N.; Kjeldsen, L.; Lollike, K.; Sengeløv, H. Granules and secretory vesicles of the human neutrophil. Clin. Exp. Immunol. 1995, 101 (Suppl. S1), 6–9. [Google Scholar] [CrossRef] [PubMed]
- Fuchs, T.A.; Abed, U.; Goosmann, C.; Hurwitz, R.; Schulze, I.; Wahn, V.; Weinrauch, Y.; Brinkmann, V.; Zychlinsky, A. Novel cell death program leads to neutrophil extracellular traps. J. Cell Biol. 2007, 176, 231–241. [Google Scholar] [CrossRef]
- Brinkmann, V.; Reichard, U.; Goosmann, C.; Fauler, B.; Uhlemann, Y.; Weiss, D.S.; Weinrauch, Y.; Zychlinsky, A. Neutrophil extracellular traps kill bacteria. Science 2004, 303, 1532–1535. [Google Scholar] [CrossRef]
- Zuo, Y.; Yalavarthi, S.; Shi, H.; Gockman, K.; Zuo, M.; Madison, J.A.; Blair, C.; Weber, A.; Barnes, B.J.; Egeblad, M.; et al. Neutrophil extracellular traps in COVID-19. JCI Insight 2020, 5, e138999. [Google Scholar] [CrossRef]
- Ronchetti, L.; Terrenato, I.; Ferretti, M.; Corrado, G.; Goeman, F.; Donzelli, S.; Mandoj, C.; Merola, R.; Zampa, A.; Carosi, M.; et al. Circulating cell free DNA and citrullinated histone H3 as useful biomarkers of NETosis in endometrial cancer. J. Exp. Clin. Cancer Res. CR 2022, 41, 151. [Google Scholar] [CrossRef]
- Telerman, A.; Granot, G.; Leibovitch, C.; Yarchovsky-Dolberg, O.; Shacham-Abulafia, A.; Partouche, S.; Yeshurun, M.; Ellis, M.H.; Raanani, P.; Wolach, O. Neutrophil Extracellular Traps Are Increased in Chronic Myeloid Leukemia and Are Differentially Affected by Tyrosine Kinase Inhibitors. Cancers 2021, 14, 119. [Google Scholar] [CrossRef]
- Stehr, A.M.; Wang, G.; Demmler, R.; Stemmler, M.P.; Krug, J.; Tripal, P.; Schmid, B.; Geppert, C.I.; Hartmann, A.; Muñoz, L.E.; et al. Neutrophil extracellular traps drive epithelial-mesenchymal transition of human colon cancer. J. Pathol. 2022, 256, 455–467. [Google Scholar] [CrossRef]
- Li, Y.; Yang, Y.; Gan, T.; Zhou, J.; Hu, F.; Hao, N.; Yuan, B.; Chen, Y.; Zhang, M. Extracellular RNAs from lung cancer cells activate epithelial cells and induce neutrophil extracellular traps. Int. J. Oncol. 2019, 55, 69–80. [Google Scholar] [CrossRef]
- Kaltenmeier, C.T.; Yazdani, H.; van der Windt, D.; Molinari, M.; Geller, D.; Tsung, A.; Tohme, S. Neutrophil extracellular traps as a novel biomarker to predict recurrence-free and overall survival in patients with primary hepatic malignancies. HPB Off. J. Int. Hepato Pancreato Biliary Assoc. 2021, 23, 309–320. [Google Scholar] [CrossRef]
- Lee, W.; Ko, S.Y.; Mohamed, M.S.; Kenny, H.A.; Lengyel, E.; Naora, H. Neutrophils facilitate ovarian cancer premetastatic niche formation in the omentum. J. Exp. Med. 2019, 216, 176–194. [Google Scholar] [CrossRef] [PubMed]
- Yang, L.; Liu, Q.; Zhang, X.; Liu, X.; Zhou, B.; Chen, J.; Huang, D.; Li, J.; Li, H.; Chen, F.; et al. DNA of neutrophil extracellular traps promotes cancer metastasis via CCDC25. Nature 2020, 583, 133–138. [Google Scholar] [CrossRef] [PubMed]
- Kwak, S.-B.; Kim, S.J.; Kim, J.; Kang, Y.-L.; Ko, C.W.; Kim, I.; Park, J.-W. Tumor regionalization after surgery: Roles of the tumor microenvironment and neutrophil extracellular traps. Exp. Mol. Med. 2022, 54, 720–729. [Google Scholar] [CrossRef] [PubMed]
- Paunel-Görgülü, A.; Wacker, M.; El Aita, M.; Hassan, S.; Schlachtenberger, G.; Deppe, A.; Choi, Y.-H.; Kuhn, E.; Mehler, T.O.; Wahlers, T. cfDNA correlates with endothelial damage after cardiac surgery with prolonged cardiopulmonary bypass and amplifies NETosis in an intracellular TLR9-independent manner. Sci. Rep. 2017, 7, 17421. [Google Scholar] [CrossRef] [PubMed]
- Becker, D.E.; Reed, K.L. Local anesthetics: Review of pharmacological considerations. Anesth. Prog. 2012, 59, 90–101, quiz 102–103. [Google Scholar] [CrossRef] [PubMed]
- Katzung, B.G.; Vanderah, T.W. Basic et Clinical Pharmacology, 15th ed.; McGraw-Hill: New York, NY, USA, 2021; ISBN 9781260452310. [Google Scholar]
- Blumenthal, S.; Borgeat, A.; Pasch, T.; Reyes, L.; Booy, C.; Lambert, M.; Schimmer, R.C.; Beck-Schimmer, B. Ropivacaine decreases inflammation in experimental endotoxin-induced lung injury. Anesthesiology 2006, 104, 961–969. [Google Scholar] [CrossRef]
- Finnerty, D.T.; Buggy, D.J. A novel role for lidocaine in COVID-19 patients? Br. J. Anaesth. 2020, 125, e391–e394. [Google Scholar] [CrossRef]
- Hollmann, M.W.; Durieux, M.E. Local anesthetics and the inflammatory response: A new therapeutic indication? Anesthesiology 2000, 93, 858–875. [Google Scholar] [CrossRef]
- Azuma, Y.; Shinohara, M.; Wang, P.L.; Suese, Y.; Yasuda, H.; Ohura, K. Comparison of inhibitory effects of local anesthetics on immune functions of neutrophils. Int. J. Immunopharmacol. 2000, 22, 789–796. [Google Scholar] [CrossRef] [PubMed]
- Hattori, M.; Dohi, S.; Nozaki, M.; Niwa, M.; Shimonaka, H. The inhibitory effects of local anesthetics on superoxide generation of neutrophils correlate with their partition coefficients. Anesth. Analg. 1997, 84, 405–412. [Google Scholar] [CrossRef] [PubMed]
- Kiefer, R.-T.; Ploppa, A.; Krueger, W.A.; Plank, M.; Nohé, B.; Haeberle, H.A.; Unertl, K.; Dieterich, H.-J. Local anesthetics impair human granulocyte phagocytosis activity, oxidative burst, and CD11b expression in response to Staphylococcus aureus. Anesthesiology 2003, 98, 842–848. [Google Scholar] [CrossRef] [PubMed]
- Kolle, G.; Metterlein, T.; Gruber, M.; Seyfried, T.; Petermichl, W.; Pfaehler, S.-M.; Bitzinger, D.; Wittmann, S.; Bredthauer, A. Potential Impact of Local Anesthetics Inducing Granulocyte Arrest and Altering Immune Functions on Perioperative Outcome. J. Inflamm. Res. 2021, 14, 1–12. [Google Scholar] [CrossRef]
- Trabold, B.; Gruber, M.; Fröhlich, D. Functional and phenotypic changes in polymorphonuclear neutrophils induced by catecholamines. Scand. Cardiovasc. J. 2007, 41, 59–64. [Google Scholar] [CrossRef]
- Bitzinger, D.I.; Zausig, Y.A.; Paech, C.; Gruber, M.; Busse, H.; Sinner, B.; Graf, B.M.; Trabold, B. Modulation of immune functions in polymorphonuclear neutrophils induced by physostigmine, but not neostigmine, independent of cholinergic neurons. Immunobiology 2013, 218, 1049–1054. [Google Scholar] [CrossRef]
- Hollmann, M.W.; Kurz, K.; Herroeder, S.; Struemper, D.; Hahnenkamp, K.; Berkelmans, N.S.; den Bakker, C.G.; Durieux, M.E. The effects of S(-)-, R(+)-, and racemic bupivacaine on lysophosphatidate-induced priming of human neutrophils. Anesth. Analg. 2003, 97, 1053–1058. [Google Scholar] [CrossRef]
- Welters, I.D.; Menzebach, A.; Langefeld, T.W.; Menzebach, M.; Hempelmann, G. Inhibitory effects of S-(-) and R-(+) bupivacaine on neutrophil function. Acta Anaesthesiol. Scand. 2001, 45, 570–575. [Google Scholar] [CrossRef]
- Hundhammer, T.; Gruber, M.; Wittmann, S. Paralytic Impact of Centrifugation on Human Neutrophils. Biomedicines 2022, 10, 2896. [Google Scholar] [CrossRef]
- Kupke, L.S.; Arndt, S.; Lenzer, S.; Metz, S.; Unger, P.; Zimmermann, J.L.; Bosserhoff, A.-K.; Gruber, M.; Karrer, S. Cold Atmospheric Plasma Promotes the Immunoreactivity of Granulocytes In Vitro. Biomolecules 2021, 11, 902. [Google Scholar] [CrossRef]
- Ivetic, A.; Hoskins Green, H.L.; Hart, S.J. L-selectin: A Major Regulator of Leukocyte Adhesion, Migration and Signaling. Front. Immunol. 2019, 10, 1068. [Google Scholar] [CrossRef]
- Kishimoto, T.K.; Jutila, M.A.; Berg, E.L.; Butcher, E.C. Neutrophil Mac-1 and MEL-14 adhesion proteins inversely regulated by chemotactic factors. Science 1989, 245, 1238–1241. [Google Scholar] [CrossRef] [PubMed]
- Torsteinsdóttir, I.; Arvidson, N.G.; Hällgren, R.; Håkansson, L. Enhanced expression of integrins and CD66b on peripheral blood neutrophils and eosinophils in patients with rheumatoid arthritis, and the effect of glucocorticoids. Scand. J. Immunol. 1999, 50, 433–439. [Google Scholar] [CrossRef] [PubMed]
- Zhao, L.; Xu, S.; Fjaertoft, G.; Pauksen, K.; Håkansson, L.; Venge, P. An enzyme-linked immunosorbent assay for human carcinoembryonic antigen-related cell adhesion molecule 8, a biological marker of granulocyte activities in vivo. J. Immunol. Methods 2004, 293, 207–214. [Google Scholar] [CrossRef]
- Ploppa, A.; Kiefer, R.-T.; Krueger, W.A.; Unertl, K.E.; Durieux, M.E. Local anesthetics time-dependently inhibit staphylococcus aureus phagocytosis, oxidative burst and CD11b expression by human neutrophils. Reg. Anesth Pain Med. 2008, 33, 297–303. [Google Scholar] [CrossRef]
- Henderson, L.M.; Chappell, J.B. Dihydrorhodamine 123: A fluorescent probe for superoxide generation? Eur. J. Biochem. 1993, 217, 973–980. [Google Scholar] [CrossRef]
- Dupré-Crochet, S.; Erard, M.; Nüβe, O. ROS production in phagocytes: Why, when, and where? J. Leukoc. Biol. 2013, 94, 657–670. [Google Scholar] [CrossRef]
- Panaro, M.A.; Mitolo, V. Cellular responses to FMLP challenging: A mini-review. Immunopharmacol. Immunotoxicol. 1999, 21, 397–419. [Google Scholar] [CrossRef]
- Chen, L.B. Mitochondrial membrane potential in living cells. Annu. Rev. Cell Biol. 1988, 4, 155–181. [Google Scholar] [CrossRef]
- Futosi, K.; Fodor, S.; Mócsai, A. Neutrophil cell surface receptors and their intracellular signal transduction pathways. Int. Immunopharmacol. 2013, 17, 638–650. [Google Scholar] [CrossRef] [PubMed]
- Smirnova, T.; Segall, J.E. Amoeboid chemotaxis: Future challenges and opportunities. Cell Adhes. Migr. 2007, 1, 165–170. [Google Scholar] [CrossRef] [PubMed][Green Version]
- Xu, J.; Wang, F.; van Keymeulen, A.; Herzmark, P.; Straight, A.; Kelly, K.; Takuwa, Y.; Sugimoto, N.; Mitchison, T.; Bourne, H.R. Divergent signals and cytoskeletal assemblies regulate self-organizing polarity in neutrophils. Cell 2003, 114, 201–214. [Google Scholar] [CrossRef] [PubMed]
- Bagorda, A.; Parent, C.A. Eukaryotic chemotaxis at a glance. J. Cell Sci. 2008, 121, 2621–2624. [Google Scholar] [CrossRef]
- Nishio, M.; Watanabe, K.; Sasaki, J.; Taya, C.; Takasuga, S.; Iizuka, R.; Balla, T.; Yamazaki, M.; Watanabe, H.; Itoh, R.; et al. Control of cell polarity and motility by the PtdIns(3,4,5)P3 phosphatase SHIP1. Nat. Cell Biol. 2007, 9, 36–44. [Google Scholar] [CrossRef] [PubMed]
- Ali, Z.A.; El-Mallakh, R.S. Nebulized Lidocaine in COVID-19, An Hypothesis. Med. Hypotheses 2020, 144, 109947. [Google Scholar] [CrossRef]
- Karnina, R.; Arif, S.K.; Hatta, M.; Bukhari, A. Molecular mechanisms of lidocaine. Ann. Med. Surg. 2021, 69, 102733. [Google Scholar] [CrossRef]
- Sur, C.C.; Giaglis, S.; Walker, U.A.; Buser, A.; Hahn, S.; Hasler, P. Enhanced neutrophil extracellular trap generation in rheumatoid arthritis: Analysis of underlying signal transduction pathways and potential diagnostic utility. Arthritis Res. Ther. 2014, 16, R122. [Google Scholar] [CrossRef]
- Carmona-Rivera, C.; Zhao, W.; Yalavarthi, S.; Kaplan, M.J. Neutrophil extracellular traps induce endothelial dysfunction in systemic lupus erythematosus through the activation of matrix metalloproteinase-2. Ann. Rheum. Dis. 2015, 74, 1417–1424. [Google Scholar] [CrossRef]
- Garcia-Romo, G.S.; Caielli, S.; Vega, B.; Connolly, J.; Allantaz, F.; Xu, Z.; Punaro, M.; Baisch, J.; Guiducci, C.; Coffman, R.L.; et al. Netting neutrophils are major inducers of type I IFN production in pediatric systemic lupus erythematosus. Sci. Transl. Med. 2011, 3, 73ra20. [Google Scholar] [CrossRef]
- Hakkim, A.; Fürnrohr, B.G.; Amann, K.; Laube, B.; Abed, U.A.; Brinkmann, V.; Herrmann, M.; Voll, R.E.; Zychlinsky, A. Impairment of neutrophil extracellular trap degradation is associated with lupus nephritis. Proc. Natl. Acad. Sci. USA 2010, 107, 9813–9818. [Google Scholar] [CrossRef]
- Villanueva, E.; Yalavarthi, S.; Berthier, C.C.; Hodgin, J.B.; Khandpur, R.; Lin, A.M.; Rubin, C.J.; Zhao, W.; Olsen, S.H.; Klinker, M.; et al. Netting neutrophils induce endothelial damage, infiltrate tissues, and expose immunostimulatory molecules in systemic lupus erythematosus. J. Immunol. 2011, 187, 538–552. [Google Scholar] [CrossRef] [PubMed]
- Stasia, M.J.; Li, X.J. Genetics and immunopathology of chronic granulomatous disease. Semin. Immunopathol. 2008, 30, 209–235. [Google Scholar] [CrossRef]
- Thiam, H.R.; Wong, S.L.; Wagner, D.D.; Waterman, C.M. Cellular Mechanisms of NETosis. Annu. Rev. Cell Dev. Biol. 2020, 36, 191–218. [Google Scholar] [CrossRef] [PubMed]
- Kenny, E.F.; Herzig, A.; Krüger, R.; Muth, A.; Mondal, S.; Thompson, P.R.; Brinkmann, V.; von Bernuth, H.; Zychlinsky, A. Diverse stimuli engage different neutrophil extracellular trap pathways. eLife 2017, 6, 24437. [Google Scholar] [CrossRef] [PubMed]
- Chen, L.; Liu, C.; Liu, L.; Cao, X. Changes in osmolality modulate voltage-gated sodium channels in trigeminal ganglion neurons. Neurosci. Res. 2009, 64, 199–207. [Google Scholar] [CrossRef]
- Rimboeck, J.; Gruber, M.; Wittmann, S. Is the In Vitro Observed NETosis the Favored Physiological Death of Neutrophils or Mainly Induced by an Isolation Bias? Int. J. Mol. Sci. 2023, 24, 7368. [Google Scholar] [CrossRef]
- Pérez-Figueroa, E.; Álvarez-Carrasco, P.; Ortega, E.; Maldonado-Bernal, C. Neutrophils: Many Ways to Die. Front. Immunol. 2021, 12, 631821. [Google Scholar] [CrossRef]
- Kim, S.Y.; Kim, N.K.; Baik, S.H.; Min, B.S.; Hur, H.; Lee, J.; Noh, H.; Lee, J.H.; Koo, B.-N. Effects of Postoperative Pain Management on Immune Function After Laparoscopic Resection of Colorectal Cancer: A Randomized Study. Medicine 2016, 95, e3602. [Google Scholar] [CrossRef]
- Sarenac, O.; Lazovic, R.; Vukcevic, B.; Lazovic, J.R.; Palibrk, I.G. Impact of Perioperatively Administered Amino Acids, Lidocaine, and Magnesium on Inflammatory Response and Pain Associated with Abdominal Surgery: A Prospective Clinical Study. Med. Sci. Monit. Int. Med. J. Exp. Clin. Res. 2023, 29, e939204. [Google Scholar] [CrossRef]
- Yokoyama, M.; Nakatsuka, H.; Itano, Y.; Hirakawa, M. Stellate ganglion block modifies the distribution of lymphocyte subsets and natural-killer cell activity. Anesthesiology 2000, 92, 109–115. [Google Scholar] [CrossRef]


| Method | PMN Function | Parameter |
|---|---|---|
| Live Cell Imaging | Migration | Track length (TL) |
| Track displacement along the chemotactic gradient (TDX) | ||
| Track duration (TD) | ||
| Observation time | ||
| NETosis | Time for half-maximal NETosis (ET50NETosis) | |
| Concentration to reach half-maximal reduction of ET50NETosis for each LA (EC50NETosis) | ||
| ROS production | Percentage of detectable cases | |
| Flow cytometry | Viability | Percentage of dead cells |
| ROS production | Conversion to rhodamine 123 | |
| Activation | Expression of CD62L, CD11b, CD66b |
| LA | Concentration Group | Incubation Time [h] | CD62L | CD11b [×102] | CD66b [×102] |
|---|---|---|---|---|---|
| Control | Control | 0.5 | 63.8 ± 7.81 | 11.9 ± 6.42 | 3.72 ± 1.57 |
| 3 | 27.4 ± 2.43 | 23.3 ± 0.89 | 13.7 ± 2.35 | ||
| 6 | 24.6 ± 0.473 | 20.9 ± 1.64 | 12.9 ± 2.36 | ||
| 12 | 19.1 ± 1.97 | 17.9 ± 2.20 | 11.6 ± 2.14 | ||
| Bupivacaine | Low | 0.5 | 149 ± 9.45 | 2.55 ± 1.68 | 2.09 ± 0.19 |
| 3 | 82.7 ± 12.1 | 6.55 ± 1.47 | 3.11 ± 0.87 | ||
| 6 | 41.0 ± 4.29 | 8.74 ± 4.75 | 4.10 ± 0.32 | ||
| 12 | 10.4 ± 5.20 | 3.68 ± 4.53 | 2.04 ± 0.79 | ||
| High | 0.5 | 132 ± 34.8 | 3.68 ± 0.65 | 2.07 ± 0.28 | |
| 3 | 85.1 ± 52.7 | 2.39 ± 1.61 | 2.53 ± 0.84 | ||
| 6 | 40.0 ± 21.3 | 2.48 ± 2.67 | 2.23 ± 0.52 | ||
| 12 | 8.7 ± 1.5 | 3.82 ± 0.31 | 2.05 ± 0.16 | ||
| Levobupivacaine | Low | 0.5 | 137 ± 14.6 | 1.83 ± 1.63 | 2.05 ± 0.25 |
| 3 | 94.7 ± 17.8 | 0.784 ± 2.98 | 2.53 ± 0.61 | ||
| 6 | 48.7 ± 13.1 | 4.26 ± 7.34 | 2.59 ± 1.76 | ||
| 12 | 9.0 ± 6.1 | 4.22 ± 4.87 | 2.17 ± 0.92 | ||
| High | 0.5 | 137 ± 19.2 | 3.46 ± 1.60 | 2.15 ± 0.79 | |
| 3 | 97.3 ± 28.3 | 7.64 ± 2.41 | 3.13 ± 0.53 | ||
| 6 | 42.6 ± 2.85 | 4.14 ± 8.23 | 2.11 ± 2.04 | ||
| 12 | 8.8 ± 6.0 | 4.37 ± 4.97 | 2.25 ± 1.16 | ||
| Lidocaine | Low | 0.5 | 121 ± 23.7 | 2.11 ± 1.05 | 1.88 ± 0.28 |
| 3 | 22.1 ± 37.1 | 4.10 ± 1.37 | 2.37 ± 0.54 | ||
| 6 | 9.1 ± 5.5 | 3.53 ± 0.12 | 2.11 ± 0.42 | ||
| 12 | 8.1 ± 1.1 | 3.62 ± 0.13 | 2.41 ± 0.19 | ||
| High | 0.5 | 25.9 ± 18.1 | 3.05 ± 1.40 | 2.37 ± 0.25 | |
| 3 | 6.7 ± 1.4 | 0.573 ± 1.53 * | 1.95 ± 0.39 * | ||
| 6 | 7.6 ± 1.2 | 2.55 ± 0.63 | 2.13 ± 0.31 | ||
| 12 | 9.7 ± 1.1 | 2.69 ± 1.26 * | 5.00 ± 2.73 |
| LA | Concentration Group | Incubation Time [h] | Dead [%] | Rhodamin 123 | ||||
|---|---|---|---|---|---|---|---|---|
| No Activation | FMLP | PMA | No Activation | FMLP | PMA | |||
| Control | Control | 0.5 | 0.52 ± 0.17 | 0.98 ± 0.66 | 0.81 ± 0.26 | 2 ± 3 | 46 ± 66 | 437 ± 542 |
| 3 | 0.79 ± 0.22 | 0.44 ± 0.61 | 0.81 ± 3.91 | 2 ± 4 | 13 ± 20 | 1610 ± 1070 | ||
| 6 | 1.00 ± 0.36 | 0.56 ± 0.86 | 0.67 ± 0.85 | 13 ± 8 | 34 ± 22 | 723 ± 448 | ||
| 12 | 1.59 ± 0.06 | 1.50 ± 0.66 | 2.01 ± 0.85 | 3 ± 13 | 16 ± 26 | 155 ± 181 | ||
| Bupivacaine | Low | 0.5 | 0.46 ± 0.09 | 0.35 ± 0.08 | 0.57 ± 0.63 | 2 ± 4 | 31 ± 59 | 359 ± 930 |
| 3 | 0.29 ± 0.10 | 0.28 ± 0.08 | 0.38 ± 0.70 | 9 ± 5 | 106 ± 48 | 1100 ± 913 | ||
| 6 | 0.69 ± 0.17 | 0.59 ± 0.29 | 0.89 ± 0.80 | 11 ± 7 | 47 ± 20 | 1030 ± 717 | ||
| 12 | 1.92 ± 1.40 | 1.50 ± 1.78 | 2.12 ± 2.06 | 7 ± 9 | 1 ± 10 | 2 ± 15 | ||
| High | 0.5 | 1.01 ± 0.50 | 0.60 ± 0.30 | 0.69 ± 1.87 | 2 ± 4 | 13 ± 37 | 389 ± 891 | |
| 3 | 1.16 ± 1.69 | 1.52 ± 1.92 | 0.65 ± 3.66 | 11 ± 6 | 22 ± 44 | 751 ± 588 | ||
| 6 | 1.58 ± 3.12 | 1.75 ± 3.77 | 1.75 ± 3.67 | 9 ± 8 | 12 ± 6 | 246 ± 227 | ||
| 12 | 6.67 ± 21.8 | 7.18 ± 21.6 | 7.58 ± 20.2 | 10 ± 7 | 10 ± 7 | 10 ± 7 | ||
| Levobupivacaine | Low | 0.5 | 0.52 ± 0.38 | 0.67 ± 0.31 | 1.39 ± 0.89 | 2 ± 4 | 23 ± 46 | 441 ± 891 |
| 3 | 0.23 ± 0.15 | 0.39 ± 0.22 | 0.30 ± 1.82 | 10 ± 5 | 106 ± 46 | 1260 ± 1190 | ||
| 6 | 0.64 ± 0.27 | 0.62 ± 0.11 | 0.85 ± 0.77 | 9 ± 8 | 20 ± 27 | 538 ± 609 | ||
| 12 | 3.01 ± 1.58 | 3.10 ± 0.66 | 3.07 ± 0.95 | 11 ± 9 | 12 ± 9 | 12 ± 28 | ||
| High | 0.5 | 0.86 ± 0.49 | 0.42 ±0.23 | 1.05 ± 0.73 | 3 ± 4 | 12 ± 34 | 594 ± 828 | |
| 3 | 0.57 ± 0.56 | 0.79 ± 0.23 | 2.11 ± 2.66 | 10 ± 5 | 57 ± 27 | 1240 ± 1140 | ||
| 6 | 0.79 ± 0.13 | 0.78 ± 0.08 | 0.83 ± 2.80 | 9 ± 8 | 12 ± 36 | 368 ± 714 | ||
| 12 | 5.92 ± 7.23 | 4.69 ± 2.97 | 5.80 ± 7.41 | 12 ± 8 | 12 ± 9 | 13 ± 29 | ||
| Lidocaine | Low | 0.5 | 1.54 ± 0.81 | 1.26 ± 1.70 | 2.02 ± 1.21 | 2 ± 4 | 17 ± 23 | 331 ± 763 |
| 3 | 7.27 ± 4.37 | 6.96 ± 4.95 | 7.49 ± 4.46 | 18 ± 10 | 28 ± 14 | 947 ± 666 | ||
| 6 | 8.49 ± 10.2 | 7.36 ± 9.64 | 8.84 ± 8.55 | 11 ± 7 | 12 ± 5 | 28 ± 77 | ||
| 12 | 23.8 ± 33.1 | 27.6 ± 32.4 | 33.1 ± 26.7 | 2 ± 10 | 2 ± 9 | 9 ± 9 | ||
| High | 0.5 | 5.68 ± 0.54 | 7.03 ± 2.82 | 8.26 ± 2.43 | 3 ± 4 | 6 ± 23 | 466 ± 827 | |
| 3 | 10.9 ± 2.40 | 10.4 ± 1.66 | 11.6 ± 2.44 | 18 ± 9 | 19 ± 10 | 19 ± 148 | ||
| 6 | 25.0 ± 22.2 | 21.6 ± 24.5 | 20.4 ± 21.5 | 12 ± 7 | 12 ± 6 | 13 ± 4 | ||
| 12 | 74.2 ± 10.2 * | 68.7 ± 13.4 * | 67.6 ± 22.6 * | 2 ± 12 | 1 ± 11 | 2 ± 11 | ||
| Control | Bupivacaine | Levobupivacaine | Lidocaine | |
|---|---|---|---|---|
| Not measurable | 5 | 15 | 12 | 10 |
| Not measurable [%] | 19.2 | 68.2 | 60.0 | 100 |
| Measurable | 21 | 7 | 8 | 0 |
| Measurable [%] | 80.8 | 31.8 | 40.0 | 0.0 |
| Overall | 26 | 22 | 20 | 10 |
| LA | Time [h] | Concentration Group | TL [µm/30 min] | rTL [%] |
|---|---|---|---|---|
| Bupivacaine | 0–10 | Control | 135 | 100 |
| Low | 83.1 * | 67.6 * | ||
| High | 77.1 * | 52.1 * | ||
| 10–15 | Control | 105 | 100 | |
| Low | 136 * | 92.8 * | ||
| High | 66.8 * | 43.1 * | ||
| 15–21 | Control | 81.1 | 100 | |
| Low | 112 * | 135 * | ||
| High | 56.7 * | 68.0 * | ||
| Levobupivacaine | 0–10 | Control | 100 | 100 |
| Low | 82.4 * | 61.8 * | ||
| High | 77.5 * | 56.7 * | ||
| 10–15 | Control | 126 | 100 | |
| Low | 116 * | 75.5 * | ||
| High | 73.2 * | 48.8 * | ||
| 15–21 | Control | 145 | 100 | |
| Low | 108 * | 72.1 * | ||
| High | 67.7 * | 44.8 * | ||
| Lidocaine | 0–10 | Control | 173 | 100 |
| Low | 63.8 * | 32.3 * | ||
| High | 53.4 * | 31.6 * | ||
| 10–15 | Control | 199 | 100 | |
| Low | 56.9 * | 39.5 * | ||
| High | 50.0 * | 28.9 * | ||
| 15–21 | Control | 207 | 100 | |
| Low | 45.2 * | 40.8 * | ||
| High | 39.2 * | 33.4 * |
| LA | Time [h] | Concentration Group | TDX [µm/30 min] | rTDX [%] |
|---|---|---|---|---|
| Bupivacaine | 0–10 | Control | 27.5 | 100 |
| Low | 1.6 * | 5.0 * | ||
| High | 2.0 * | 5.6 * | ||
| Levobupivacaine | 0–10 | Control | 11.2 | 100 |
| Low | 1.2 * | 5.1 * | ||
| High | 2.1 * | 8.9 * | ||
| Lidocaine | 0–10 | Control | 8.3 | 100 |
| Low | 0.9 * | 3.9 * | ||
| High | 0.2 * | 0.6 * |
Disclaimer/Publisher’s Note: The statements, opinions and data contained in all publications are solely those of the individual author(s) and contributor(s) and not of MDPI and/or the editor(s). MDPI and/or the editor(s) disclaim responsibility for any injury to people or property resulting from any ideas, methods, instructions or products referred to in the content. |
© 2023 by the authors. Licensee MDPI, Basel, Switzerland. This article is an open access article distributed under the terms and conditions of the Creative Commons Attribution (CC BY) license (https://creativecommons.org/licenses/by/4.0/).
Share and Cite
Sixt, S.; Gruber, M.; Kolle, G.; Galla, T.; Bitzinger, D. The Effect of Local Anesthetics on Neutrophils in the Context of Different Isolation Techniques. Biomedicines 2023, 11, 2170. https://doi.org/10.3390/biomedicines11082170
Sixt S, Gruber M, Kolle G, Galla T, Bitzinger D. The Effect of Local Anesthetics on Neutrophils in the Context of Different Isolation Techniques. Biomedicines. 2023; 11(8):2170. https://doi.org/10.3390/biomedicines11082170
Chicago/Turabian StyleSixt, Sara, Michael Gruber, Gesche Kolle, Thies Galla, and Diane Bitzinger. 2023. "The Effect of Local Anesthetics on Neutrophils in the Context of Different Isolation Techniques" Biomedicines 11, no. 8: 2170. https://doi.org/10.3390/biomedicines11082170
APA StyleSixt, S., Gruber, M., Kolle, G., Galla, T., & Bitzinger, D. (2023). The Effect of Local Anesthetics on Neutrophils in the Context of Different Isolation Techniques. Biomedicines, 11(8), 2170. https://doi.org/10.3390/biomedicines11082170