Article

Unveiling the Silent Danger of Childhood Obesity: Non-Invasive Biomarkers Such as Carotid Intima-Media Thickness, Arterial Stiffness Surrogate Markers, and Blood Pressure Are Useful in Detecting Early Vascular Alterations in Obese Children

1
Department of Doctoral Studies, Victor Babes University of Medicine and Pharmacy, 300041 Timisoara, Romania
2
Center of Molecular Research in Nephrology and Vascular Disease, Faculty of Medicine, Victor Babes University of Medicine and Pharmacy, 300041 Timisoara, Romania
3
Department of Pediatrics, Victor Babes University of Medicine and Pharmacy, 300041 Timisoara, Romania
4
2nd Department of Internal Medicine, Victor Babes University of Medicine and Pharmacy, 300041 Timisoara, Romania
5
3rd Department of Odontotherapy and Endodontics, Faculty of Dental Medicine, Victor Babes University of Medicine and Pharmacy, 300041 Timisoara, Romania
6
Department of Functional Sciences—Pathophysiology, Center for Translational Research and Systems Medicine, Victor Babes University of Medicine and Pharmacy, 300173 Timisoara, Romania
*
Author to whom correspondence should be addressed.
Biomedicines 2023, 11(7), 1841; https://doi.org/10.3390/biomedicines11071841
Submission received: 1 June 2023 / Revised: 17 June 2023 / Accepted: 23 June 2023 / Published: 26 June 2023
(This article belongs to the Special Issue Recent Advances in Obesity and Hypertension)

Abstract

:
Obese children present a higher cardio-metabolic risk. Measuring vascular biomarkers that assess the evolution of arterial stiffness, subclinical atherosclerosis, and hypertension in such patients could be helpful in the long term. We studied 84 children, aged from 6 to 18 years: 50 obese subjects, versus 34 of normal weight. Clinical examination involved: BMI, waist circumference, waist-to-height ratio, and detection of the presence of acanthosis nigricans and irregular menstrual cycles (the latter in adolescent girls). The carotid intima-media thickness (CIMT) was measured with the Aixplorer MACH 30 echography device. The pulse wave velocity (PWV), augmentation index (AIx), and peripheral and central blood pressures (i.e., SBP, DBP, cSBP, cDBP, and cPP) were acquired through a Mobil-O-Graph device. Obese subjects underwent body composition analysis with a Tanita BC-418. Blood tests were: HOMA-IR, lipid panel, uric acid, and 25-OH vitamin D. All vascular biomarkers presented increased values in obese subjects versus controls. The following cut-off values were significant in detecting obesity: for PWV > 4.6 m/s, cSBP > 106 mmHg for the <12-year-olds, PWV > 4.5 m/s and cSBP > 115 mmHg for the 12–15-year-olds, and PWV > 5 m/s, cSBP > 123 mmHg for the >15-year-olds. AIx is higher in obese children, regardless of their insulin resistance status. Waist circumference and waist-to-height ratio correlate to all vascular parameters. HOMA-IR is an independent predictor for all vascular parameters except CIMT. Cut-off values for PWV of >4.8 m/s, SBP > 125 mmHg, and a cSBP > 117 mmHg predicted the presence of acanthosis nigricans. Obese girls with irregular menses displayed significantly higher PWV, SBP, and DPB. Elevated levels of uric acid, LDL-c, non-LDL-c, triglycerides, and transaminases, and low levels of HDL-c and 25-OH vitamin D correlated with higher arterial stiffness and CIMT values. We conclude that CIMT and the markers of arterial stiffness are useful in the early detection of vascular damage in obese children.

1. Introduction

Childhood obesity is a significant preventable health problem requiring continuous attention and effort. The latest statistics show that, in the European Region, around 60% of adults and 29% of school-aged children are overweight or obese [1,2]. In the United States, the prevalence of obesity in children older than two is 19.7% [3]. During the SARS-COV-2 pandemic, body mass index rates nearly doubled [4], with notable increases in overweight and obesity rates across different age groups [5].
Obesity requires a comprehensive framework encompassing prevention and treatment to avoid long-term complications, particularly when it begins, in its early stages. Overlaying complications include metabolic syndrome, metabolic associated fatty liver disease, polycystic ovary syndrome (PCOS), and sleep apnea, all of which contribute to vascular damage [6,7,8].
Our aim is to address the early stages of atherosclerosis, a dangerous complication of excess weight. Detecting visible signs of vascular disruptions is crucial for effective management of childhood obesity and its long-term vascular consequences. Our previous research has linked intima-media thickness [9], pulse wave velocity, and blood pressure to childhood obesity [10]. This study focuses on providing additional data on subclinical atherosclerosis and arterial stiffness in the same type of individuals.
Atherosclerosis is caused by lipid deposits in arterial walls and is driven by pro-inflammatory signaling and immune cell infiltration. Low-density lipoproteins (LDL-c) contribute to endothelial lipid accumulation. Atherosclerosis is most prominent near arterial bends and bifurcations with altered blood flow [11]. Excess adipose tissue in obesity triggers chronic inflammation, disrupting the balance of nitric oxide and constricting hormones [12]. This impairs vasodilation, damages arterial elasticity, and is worsened by high blood pressure, insulin resistance/glucose intolerance, and dyslipidemia [13,14]. Arterial stiffness, as influenced by age and various factors, is significantly aggravated by childhood obesity, which is probably the most important preventable cause [13].
Carotid intima-media thickness (CIMT) measures the gap between the intimal and medial layers of an artery, indicating generalized atherosclerosis [14,15]. It is a non-invasive marker observed through ultrasonography, and is commonly used for cardiovascular diagnosis and risk assessment in adults [14,15]. In obese children, CIMT values are higher compared to normal-weight peers and serve as predictors of future cardiovascular diseases [16,17].
Arterial stiffness can be assessed using two markers: pulse wave velocity (PWV) and augmentation index (AIx). PWV measures the speed of the pulse through the arterial tree, reflecting the elasticity of large arteries and predicting cardiovascular events [18,19,20]. Obese children have higher PWV, which is strongly correlated with BMI and waist circumference [21,22,23]. AIx evaluates small artery elasticity by estimating the augmentation caused by the reflected wave during systole [24,25]. In adults, the AIx predicts organ damage in cardiovascular conditions [26]. However, the AIx in children is influenced by height and sympathetic nervous system activity [27,28]. Small heights are associated with a higher AIx [27]. The intensified activity of the sympathetic nervous system is a coping mechanism in obese children, and seems to be associated with a lower AIx [27,28]. In our previous work regarding arterial stiffness in obese children, we could not determine a consistency in the causal relation between weight excess or cardio-metabolic risk factors and a higher value of AIx, and concluded that more research was needed [29].
Higher blood pressure in obese children (i.e., peripheral BP > 95th percentile) worsens atherosclerosis and arterial stiffness [30,31]. Elevated peripheral BP is associated with higher CIMT and PWV [32,33]. In adults, central BP (cSBP and cDBP) correlates more strongly with vascular markers such as CIMT and left ventricular mass [34,35]. The severity of obesity directly relates to increased central BP in children and youth [36,37,38]. Central pulse pressure (cPP), calculated as the difference between cSBP and cDBP, is also higher in obese children [29,39,40]. Although cPP may predict hypertension and arterial stiffness, caution is advised when using peripheral or central PP as surrogate markers, due to a significant level of mismatch between PP and arterial stiffness [41]. However, when both cPP and PWV are elevated, cardiovascular risk significantly increases [41].
The value of generally evaluating the CIMT and arterial stiffness in children at risk does not assume a diagnostic of atherosclerosis, the detection of atherosclerotic plaques, or a finding of extremely elevated levels for arterial stiffness surrogate markers. As clinicians, we do not expect to find pathological values in our determinations when evaluating obese children with no other chronic diseases. We propose this practice in order to more accurately evaluate the cardiovascular status of these patients right from the start and to provide a more efficient long-term medical management plan in order to prevent the progression of atherosclerosis and avoid cardiovascular events in young adults. Moreover, measuring these vascular biomarkers at young ages increases awareness among pediatric patients and their families about cardiovascular risk, opening new channels of doctor-patient communication relevant to the patient’s goals for a healthier future.

2. Materials and Methods

The study involved 84 children aged from six to eighteen and was conducted from June 2022 to December 2022 at the Pediatric Endocrinology Department of the “Pius Brinzeu” Emergency County Hospital in Timisoara.
The patients who were addressed to our department were asked to participate in the study if they presented chronic primary obesity (BMI > 95th percentile), or if they were overweight according to their BMI (>85th percentile), but had a waist circumference (WC) >90th percentile, and did not present other comorbidities. The patients who presented with known contributors to secondary obesity (e.g., endocrinological disorders such as hypothyroidism, type 2 diabetes mellitus, hypothalamic injury/disorders, Cushing syndrome, genetic disorders such as Prader–Willi Syndrome, ghrelin–leptin dysfunction, and use of medication that can induce weight gain such as glucocorticosteroids, sulphonylureas, tricyclic antidepressants, and anti-psychotics) [42,43], or conditions that might lead to increased arterial stiffness (e.g, acute illnesses with systemic inflammatory components, chronic kidney disease, congenital heart disease, oral conditions, familial hypercholesterolemia, vasculitis, and type 1 and 2 diabetes mellitus) were excluded [44]. Fifty patients met the criteria and were included in the present study. Thirty-four age-matched, normal-weight (BMI ranging between percentiles 5 and 85) volunteers made up the control group. The exclusion criteria were applied to them as well. All children included were Caucasian, 86% were of Romanian ethnicity, 12% were of Hungarian ethnicity, and 2% were of Serbian ethnicity.
The University of Medicine and Pharmacy Victor Babes Timisoara’s Ethics Council for Scientific Research approved the study, in accordance with the Helsinki Declaration. Prior to being included in the study, the patients and their legal guardians were informed of all the medical procedures that would take place. Informed consent was signed by all legal guardians of minors and by all 18-year-old patients.

2.1. Physical Examination

The physical examination of our patients included measurements of their weight, height, and waist circumference. After calculating the body mass index (BMI, kg/m2), the 2022 BMI-for-age extended growth charts were used in order to establish percentiles for BMI [45,46]. The cut-off values proposed by Zong et al. were used in order to establish the percentiles for WC [47]. The waist-to-height ratio (WHR) was also calculated, mindful that a WHR > 0.6 is considered at risk for metabolic syndrome [48]. The puberty development of each subject was established according to Tanner stages [49]. Menstruating girls were asked whether they had regular or irregular menses. Irregular menses were considered menstrual cycles of <21 or >35 days, or missing ≥3 menses in a row, in girls who had their menarche at least 2 years before [50]. The presence of acanthosis nigricans was noted in the patients who displayed it [51].
These formulas were used for the calculation of:
BMI = Weight (kg)/Height2 (m) [45]
WHR = WC (m)/Height (m) [48]

2.2. Body Composition Analysis

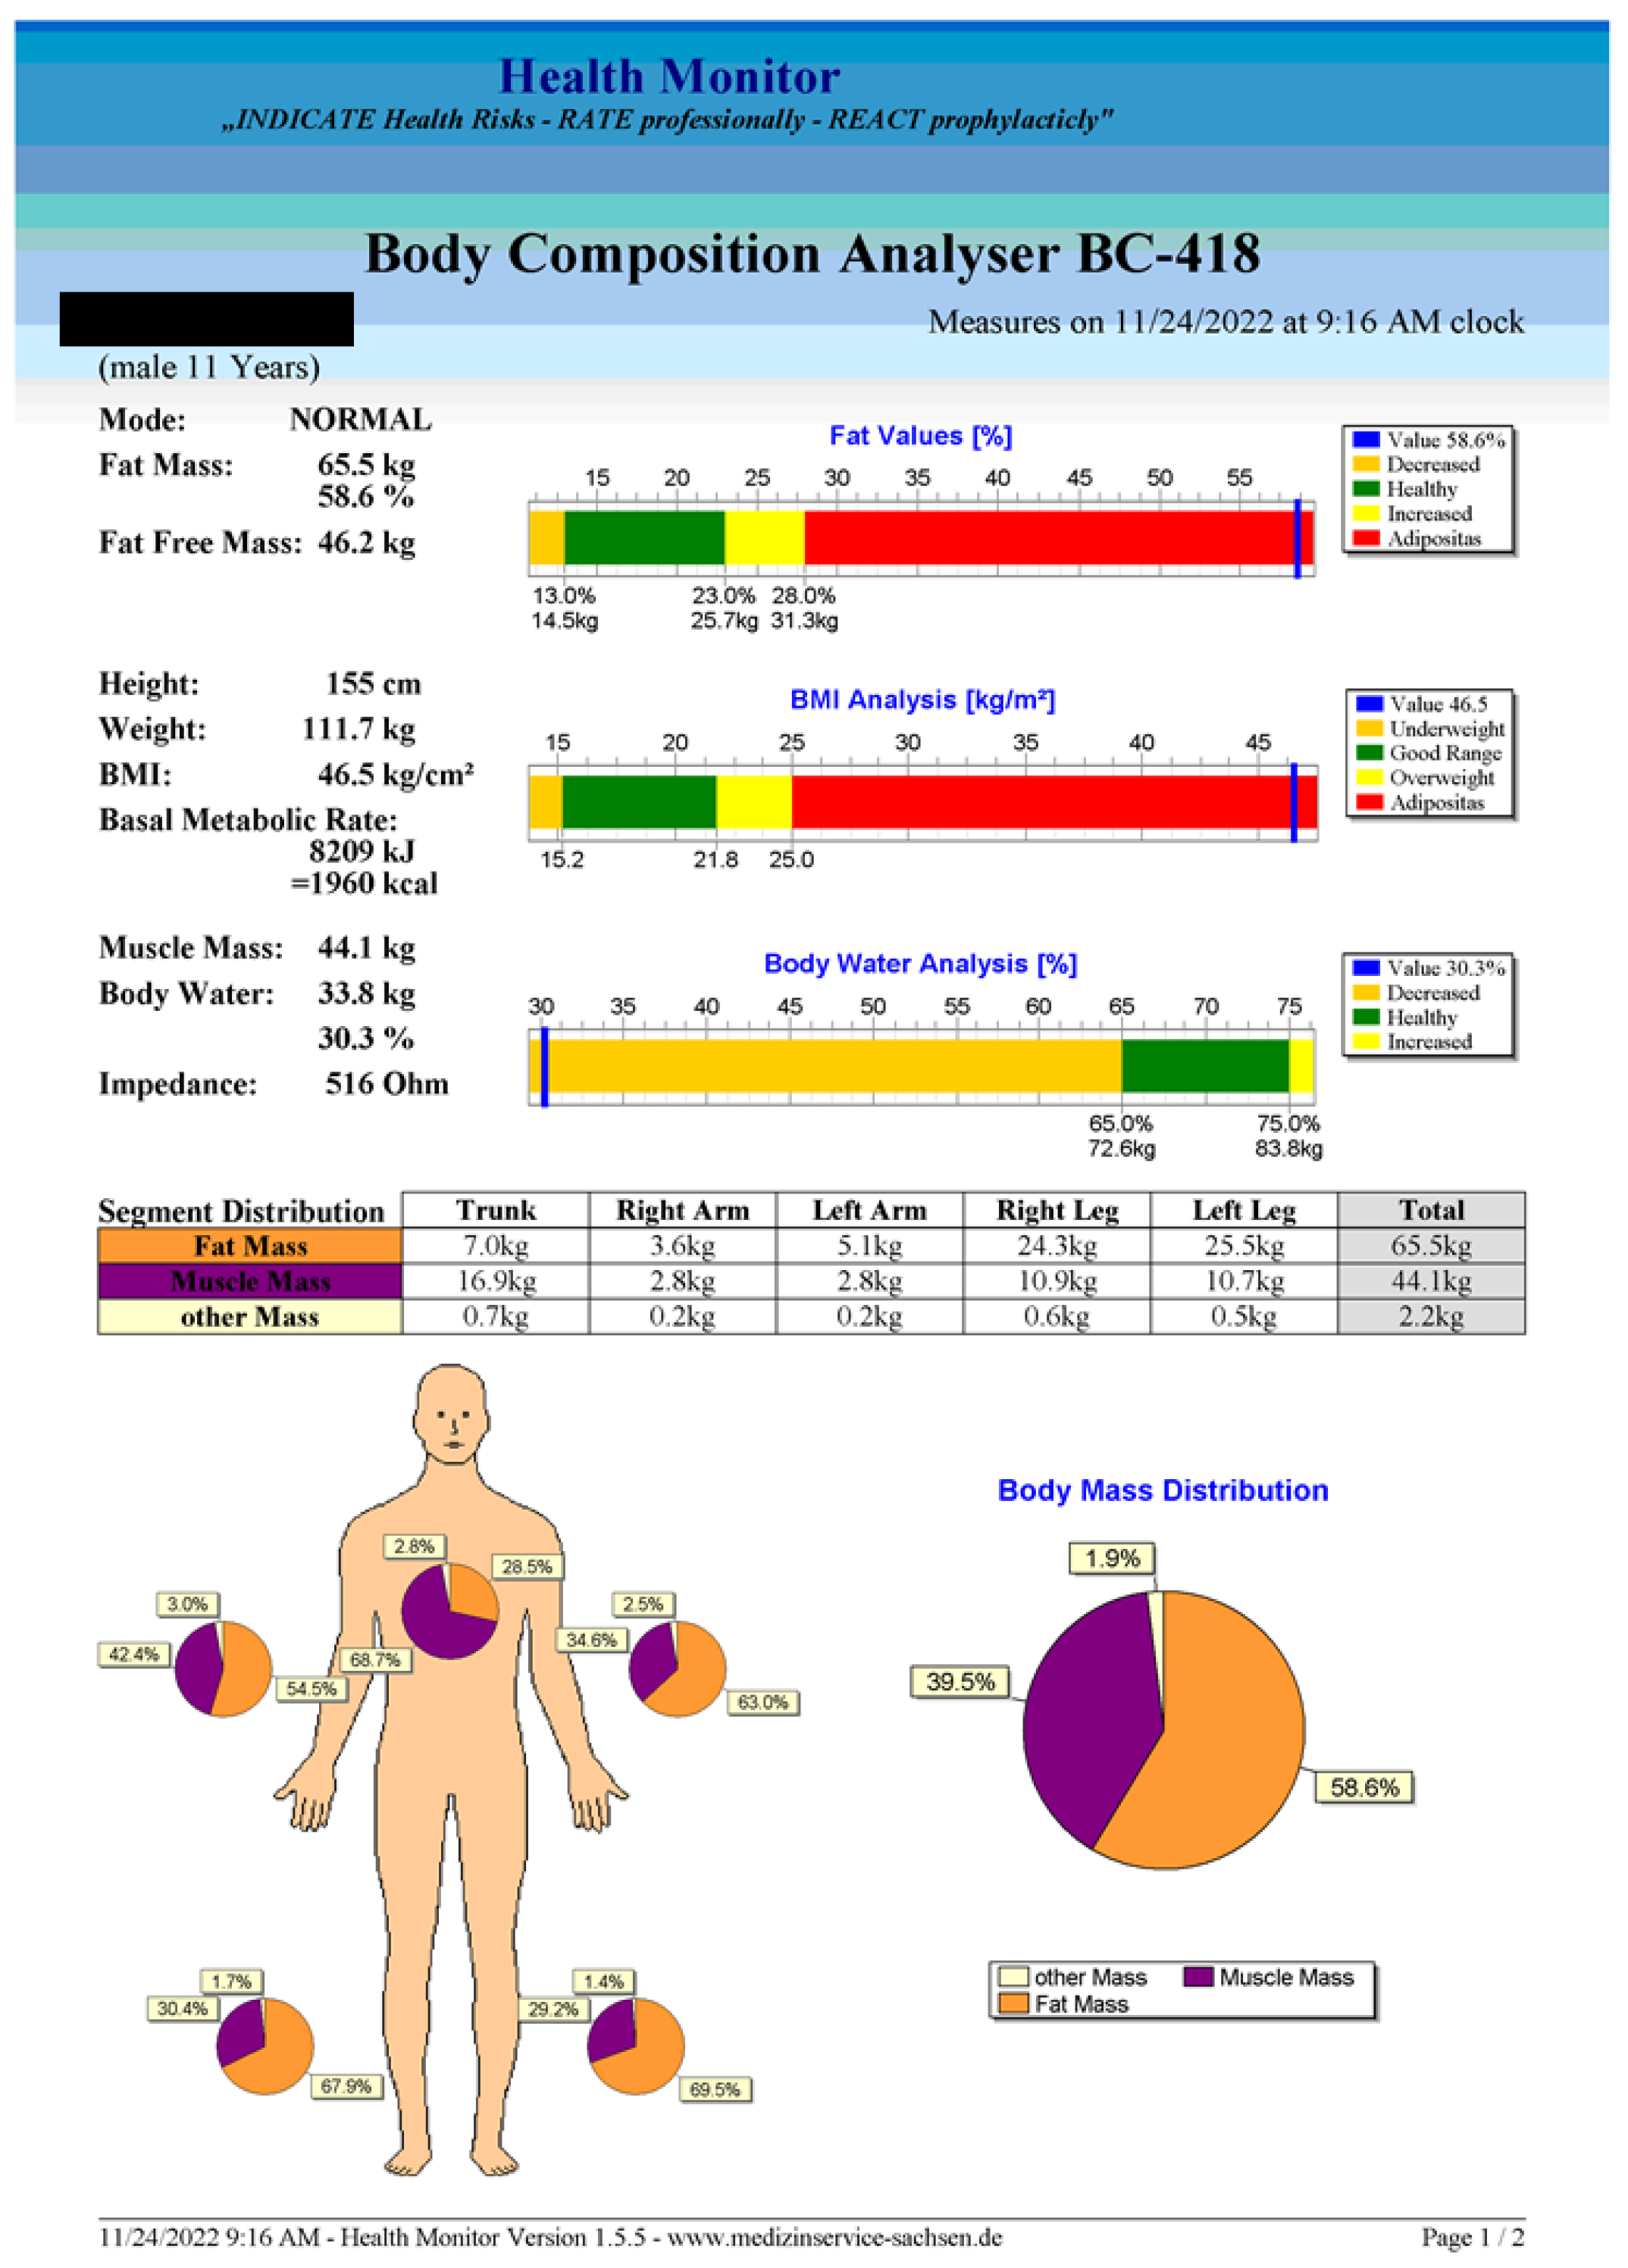
The subjects included in the obese group underwent a body composition analysis through body impedance with the Tanita Body Composition Analyzer BC-418 device MA III (T5896, Tokyo, Japan). The device works through 8 electrodes which provide a high-frequency current of 50 kHz, 500 μA that moves through the fingertips of both hands and the tips of the toes of both feet. The voltage is measured on the thenar region of both hands and on the heel region of both feet, respectively. This means that the device has two handles and a support for each foot.
The following procedures are necessary in order to obtain correct results:
According to the manufacturer, the use of this device is advised only for children over 6 years old;
The software requires the examiner to enter the following data for each patient: identification data, birth date, sex, weight, height, and clothes’ weight;
The subject steps with bare feet on the device’s foot electrodes, making sure that their feet are positioned exactly in the pre-determined shapes, and then grabs both handles, which contain the hand electrodes;
The subject needs to maintain a stable and straight position throughout the measurement;
After the measurement is accomplished, the software provides an explicit report (an example is given in Figure A1, Appendix A).
The device uses the body’s bioelectrical impedance to accurately estimate body composition, including fat mass and muscle mass. The concept is based on the electricity’s characteristics of passing easily through water, and with difficulty through fat tissue. Hence, the electrical resistance is a measure of how difficult it is for electricity to travel through a substance, and measurements of this resistance can be used to determine the amounts of fat and other body components. The parameters used in this study were the fat mass (kg), trunk fat mass (kg), muscle mass (kg), and body water (kg).

2.3. Arterial Stiffness Measurements

The Mobil-O-Graph® 24 Hour ABPM oscillometric arteriograph (M26101200, IEM® GmbH, Stolberg, Germany) was used to acquire the parameters known as biomarkers of arterial stiffness: PWV (m/s), AIx (%), heart rate (HR, beat/minute), and peripheral and central BP (mmHg), as well as the mean arterial pressure (MAP) and central PP (mmHg). The instrument’s one-time measurement feature was utilized.
Details of the methodology and specifics of the device have been presented in our previous work as well [10,40].
We performed a single-point brachial measurement on the naked left upper arm of each subject under the following conditions:
There had been no ongoing acute illness, and no exposure to smoke for at least four hours prior to the measurements, with no consumption of caffeinated drinks allowed for at least a day prior, and a full eight-hour night sleep was had the night before the measurement;
Ten-minutes rest in a supine position was taken prior to the measurement;
The appropriate cuff size had to be chosen for each patient according to the measurement of their upper arm: extra small: 14–20 cm, small: 20–24 cm, medium: 24–32 cm, and large: 32–38 cm;
The measurement was made in the supine position and the subjects needed to be still, silent, and relaxed;
If the measurement’s accuracy was declared subpar by the device’s software, we retook it after a five-minute pause [10,40].
The Mobil-O-Graph may be used in children older than three, according to the manufacturer, after multiple validating studies [52,53,54]. Our team has previously used the device on both children and adults [10,20,40,55]. It is a device well accepted by children, easy to use, and one with reproducible results.

2.4. The Carotid Intima-Media Thickness Measurement

The carotid ultrasonography was carried out using the Aixplorer MACH 30 echography device (Country-SuperSonic Imagine, Aix-en-Provence, France). The SL 10-2 (2–10 MHz) or the SL 18-5 (5–18 MHz) linear ultrasound probes were used, depending on the volume of adipous tissue in the cervical region of each subject. The echography machine software (SuperSonic Imagine 3.0, Aix-en-Provence, France) is able to calculate the CIMT values automatically.
The ultrasonography technique
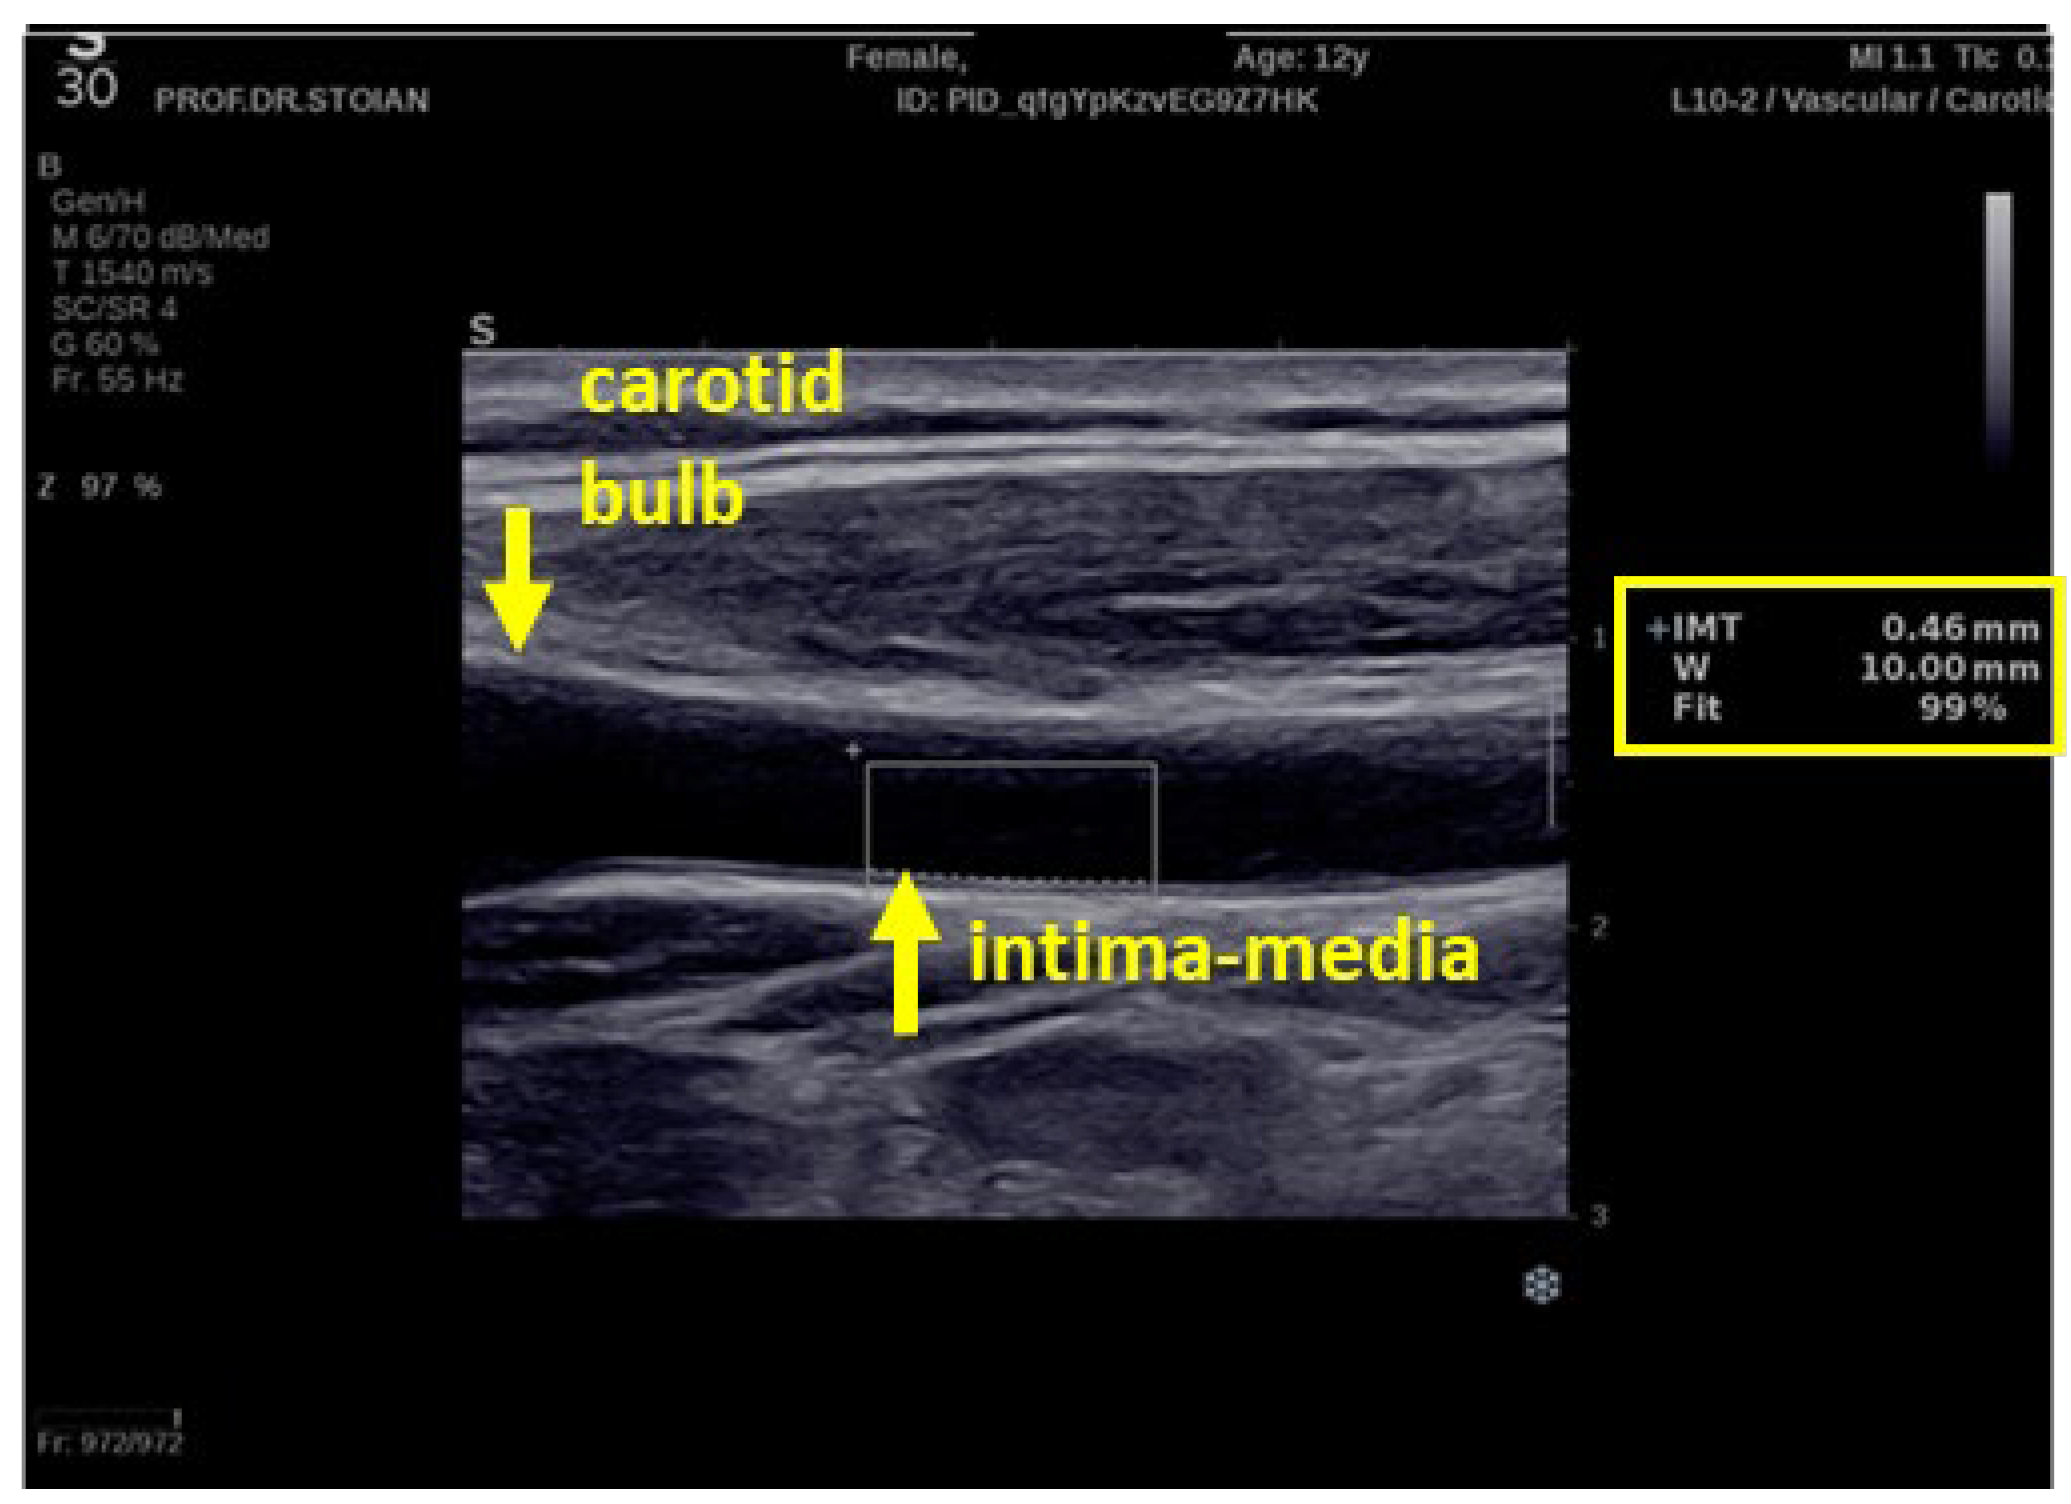
An experienced and certified sonographer performed the carotid ultrasonography on each patient. The subject was asked to lie down and extend their neck backward as much as possible in order to facilitate a better view of the common right and left carotid arteries. The examiner selected the appropriate ultrasound settings (carotid evaluation in B-mode) and the appropriate ultrasound probe. Starting from the clavicle upwards, on each side, the scanning was transversal in order to locate the carotid bulb and the sequential bifurcation of the common carotid into the internal and external carotids. Once the bulb was located, the probe orientation was changed to longitudinal scanning: the carotid was seen in a longitudinal section, with the carotid bulb on the left side of the screen and the image clear enough to distinguish the intima-media. The region recommended for the measurement of the CIMT is located on the posterior carotid wall of the carotid segment, 1–2 cm caudally from the carotid bulb, as exemplified in Figure A2 (see Appendix A) [56,57]. The images were acquired synchronously with an ECG assay, and the CIMT measurement was made during the end-diastole [58]. The software performed the automatic measurement of the CIMT [59]. For each patient, we performed 3 measurements on each carotid artery and used the mean values in our study.

2.5. Blood Tests

The following blood tests were obtained: serum insulin, fasting glucose, Homeostatic Model Assessment for Insulin Resistance (HOMA-IR), uric acid, creatinine, lipid profile (total cholesterol, LDL-c, HDL-c), triglycerides, thyroid-stimulating hormone, free T4, 8 a.m. serum cortisol, aspartate aminotransferase, alanine aminotransferase, ionized calcium, and 25-OH vitamin D. The blood samples were taken within a maximum of 2 weeks after the clinical consultation in the Pediatric Endocrinology Department and processed within the hospital’s accredited laboratory. The patients were advised to abstain from consuming foods for at least 12 h prior to their blood tests. The blood tests were scheduled within the 7:30-8:30 a.m. interval.
The following formula was used for calculating the HOMA-IR:
HOMA-IR = [Glucose (mg/dl) × Insulin (µU/mL)]/405 [60].
Due to the fact that HOMA-IR is influenced by puberty development, for the analysis of the obese group concerning the insulin-resistance status, the cut-off values for HOMA-IR were considered to be the following:
For pre-pubertal children (Tanner stage 1) the HOMA-IR cut-off was considered 2.3, and for pubertal children (Tanner stages 2, 3, and 4), 3.4, as defined in a large study on Italian Caucasian obese children aged 8–15 [61];
For post-pubertal children (Tanner stage 5), the HOMA-IR cut-off remains 3.4, as a study on normal-weight and obese children aged 2–17.8 years old placed the cut-off value for obese children at 3.42, at the 75% percentile, for individuals that may develop cardiovascular risk factors very early in life [62].

2.6. Statistical Analysis

Microsoft Excel was used for data collection and MedCalc Statistical Software version 20.111 (MedCalc Soft-ware Ltd., Ostend, Belgium) and DATAtab: Online Statistics Calculator (Graz, Austria) were used for the statistics.
The analysis focused on the relationships between clinical and paraclinical parameters (CIMT, arterial stiffness parameters, and blood tests). The normality of data distribution was tested by the Shapiro–Wilk test. Consequentially, we performed statistical tests appropriate for the normality of the data in question: means, Student’s t-test, and Pearson’s correlations for the normally distributed variables and medians, the Mann–Whitney test, and Spearman’s correlation for the non-normal ones. The significance threshold was considered p-value < 0.05. One-way ANOVA post hoc tests were performed when three groups were compared, including Bonferroni-adjusted p-values. ROC-AUC analysis was performed to evaluate the sensibility and specificity of the vascular biomarkers in relation to the presence of obesity and acanthosis nigricans. Multilinear regressions were performed in order to detect which of the clinical parameters and which of the blood tests could act as independent predictors of the vascular biomarkers.

3. Results

Two groups under study were created, one including the obese patients and the overweight who displayed a WC > the 90th percentile (n = 50), and one including the normal-weight volunteers (n = 34). Table 1 depicts the distribution of the subjects included in the two groups by sex (male or female) and age (<12 years old, 12 to 15 years old, or >15 years old). No differences in mean age were detected between the two groups; the mean age in the obese group was 12.5 (SD = 3.28), while in the control group, it was 12 (SD = 3.61), p = 0.48.
Comparisons between all boys and all girls included in the study showed that CIMT values were significantly higher in boys, with a median value of 0.45 mm, compared to 0.43 mm in girls (p = 0.01). Other significant differences were not detected in the rest of the vascular biomarkers. We also did not detect any differences between obese girls and obese boys in any vascular parameter.
Regarding differences in the mean values of the vascular parameters between the three age groups which included obese patients, we performed one-way ANOVA post hoc tests, Bonferroni-adjusted, and we detected the following significant results: CIMT was higher in subjects aged from 12 to 15 years than in those <12 years old (p = 0.02); PWV and cSBP were higher in >15-year-olds than in <12-year-olds (p = 0.01 and p = 0.02, respectively). No differences were detected across groups for AIx (p = 0.31), HR (p = 0.33), SBP (p = 0.59), DBP (p = 0.35), MAP (p = 0.09), cDBP (p = 0.2), and cPP (p = 0.59). See Table 2.
The obese subjects were divided into subgroups according to the Tanner stages: pre-pubertal (Tanner 1), pubertal (Tanner 2, 3, and 4), and post-pubertal (Tanner 5). The ANOVA analysis detected significant differences across the three groups in all vascular biomarkers except for HR (see Table 3). No significant differences were detected between HR values after the Bonferroni correction.

3.1. The Vascular Biomarkers in Relation to the Weight Excess

3.1.1. The Vascular Biomarkers and the BMI, WC, and WHR

The significant differences noted between the two groups of study with regard to the subject’s weight excess, as clinically objectified through the BMI, WC, and WHR, are depicted in Table 4.
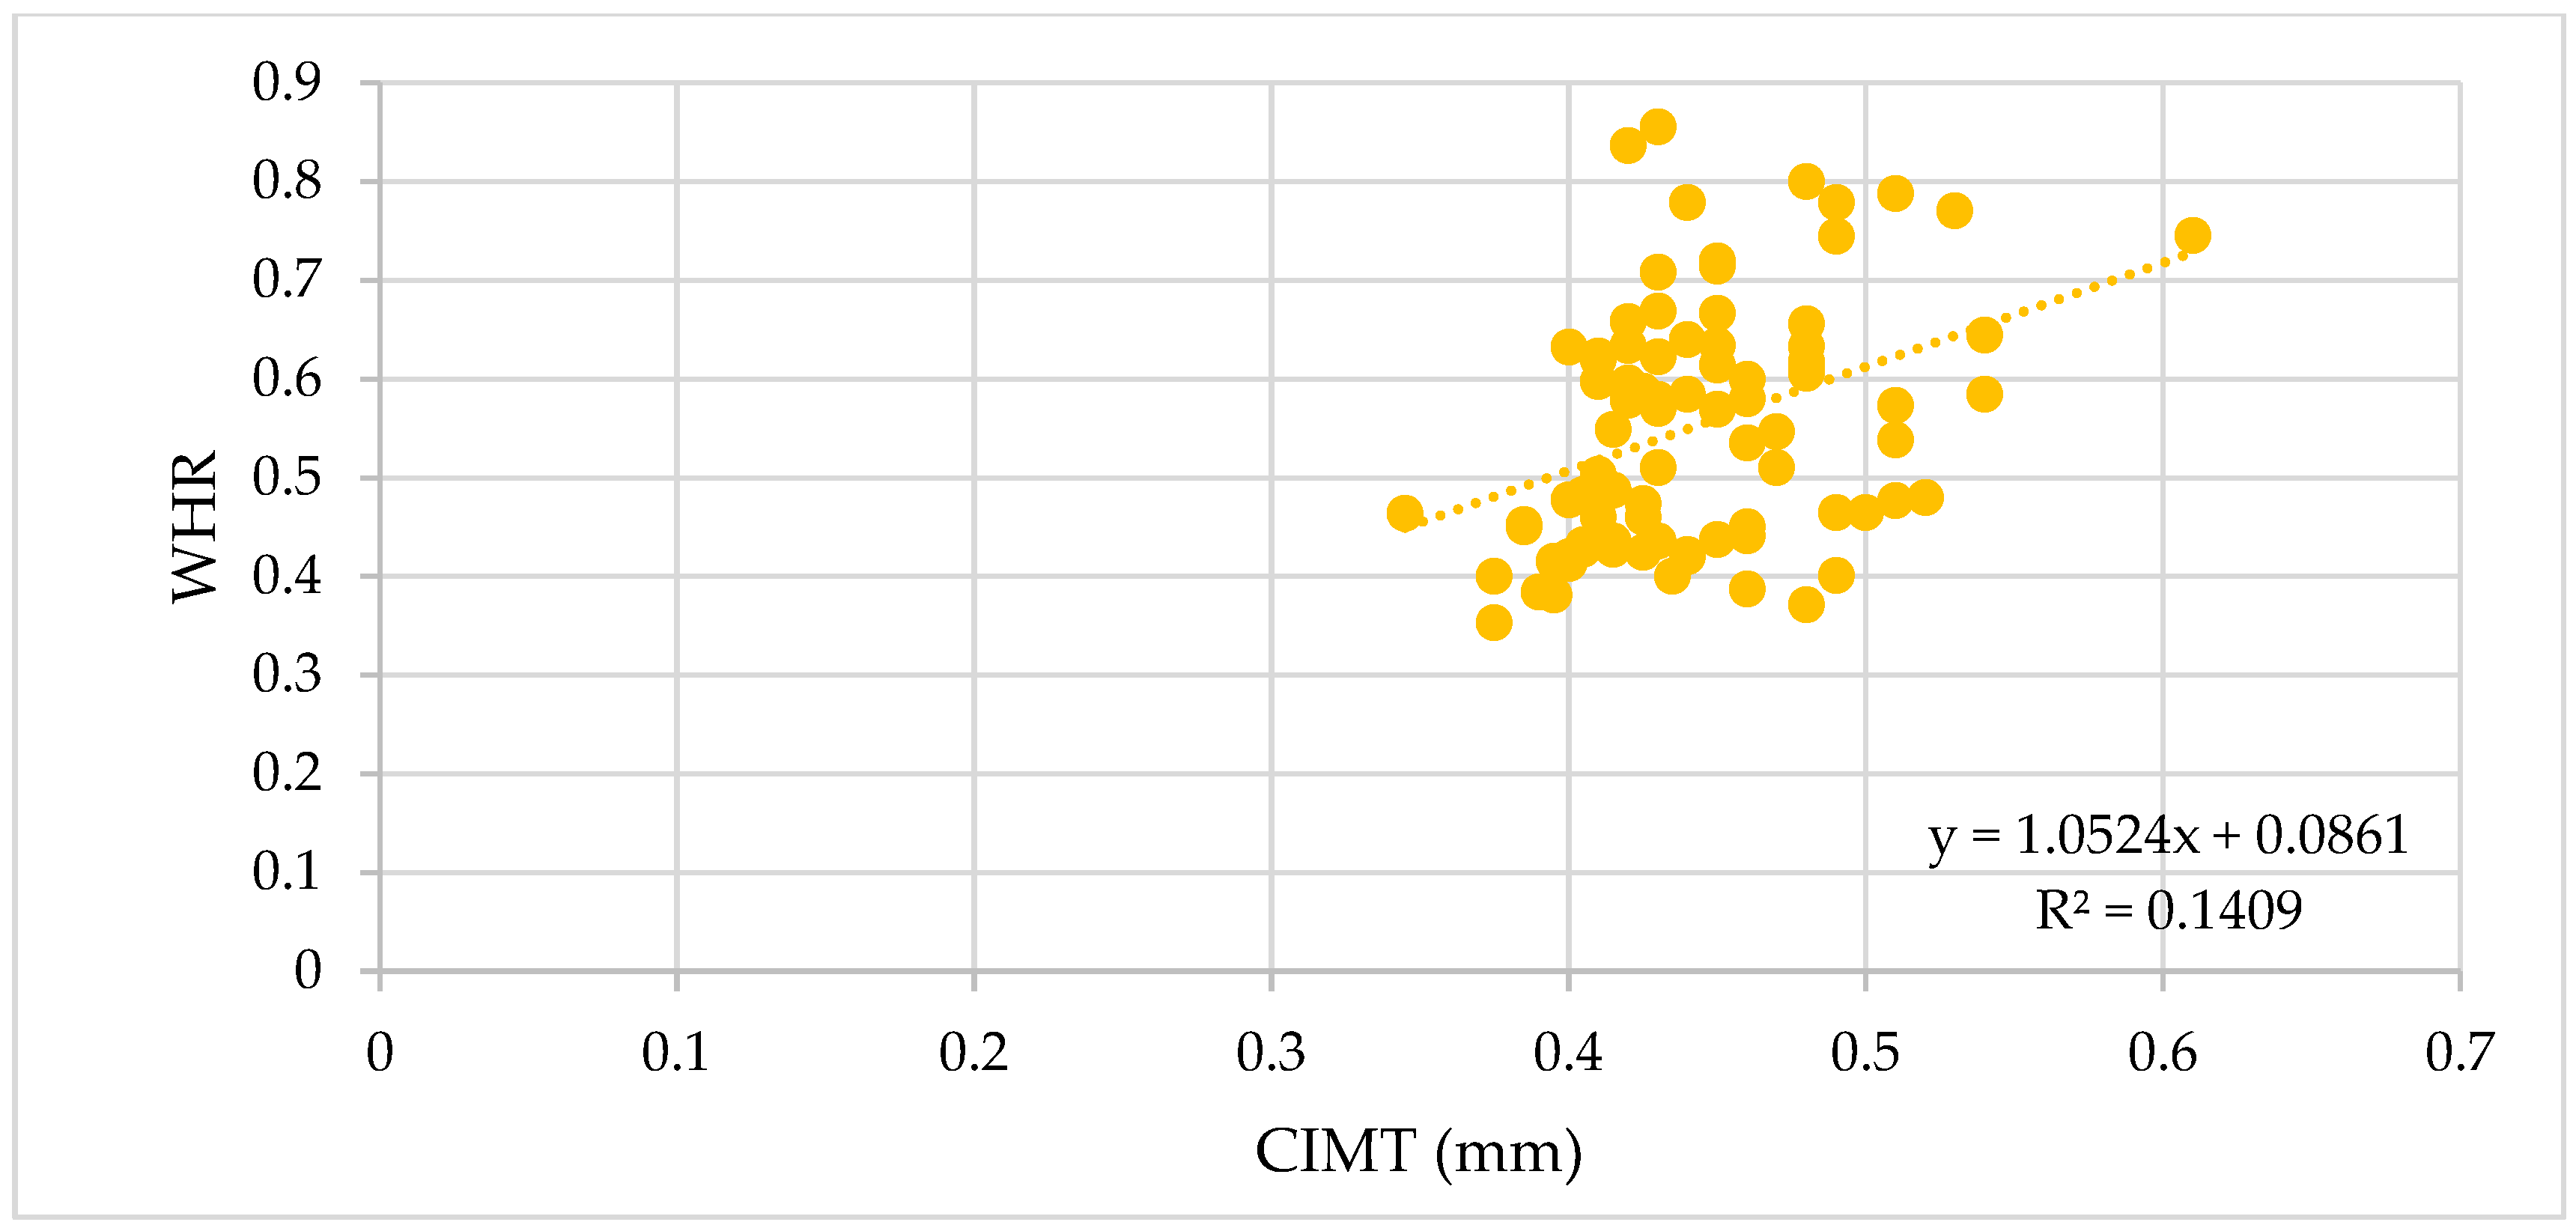
The correlation analysis between BMI, WC, and WHR and the vascular biomarkers revealed significant positive correlations with the vascular biomarkers measured, as depicted in Table 5, with the strongest correlations observed for PWV, SBP, and cSBP. For CIMT 1, AIx, MAP, cDBP, and cPP, we observed moderate correlations (Figure 1, Figure 2 and Figure 3).
The clinical parameters—Tanner stages, clinical adiposity indicators (W, BMI, WC, and WHR), and the presence of acanthosis nigricans—were included as independent factors in a multiple regression to determine which of them would be significant predictors of the vascular biomarkers. In the model regression, the vascular parameters each served as a dependent variable. The most significant variances explained by clinical parameters for the value of a vascular parameter were observed in the case of PWV (64.09%), SBP (62.81%), and cSBP (67.21%), whereas the least significant variance was noted for HR (6.92%). Table 6 presents the model for each regression.
Furthermore, the multiple regressions detected significant independent predictors of peripheral and central BP values, as depicted in Table 7. Although the clinical markers of adiposity showed significant correlations to CIMT, PWV, and AIx (Table 5), the regressions did not confirm them as independent predictors for these vascular markers. The presence of acanthosis nigricans was not confirmed as a significant predictor, either. The level of pubertal development (Tanner stages) does not present a relationship with CIMT, PWV, and AIx independently of the markers of adiposity, but represents a significant predictor for central BP values.

3.1.2. The Vascular Biomarkers and the Body Composition Analysis

The body composition analysis performed on the obese subjects showed reliable correlations between the vascular parameters measured and the fat, muscle, and water masses of each patient, as depicted in Table 8. The BMI and fat mass of the obese patients were strongly positively correlated (ρ = 0.87, p < 0.0001), as were the WC and trunk fat mass (ρ = 0.78, p < 0.0001). The WHR and trunk fat mass were moderately correlated (ρ = 0.37, p = 0.008).

3.1.3. Comparisons of Vascular Markers between Obese and Normal-Weight Subjects

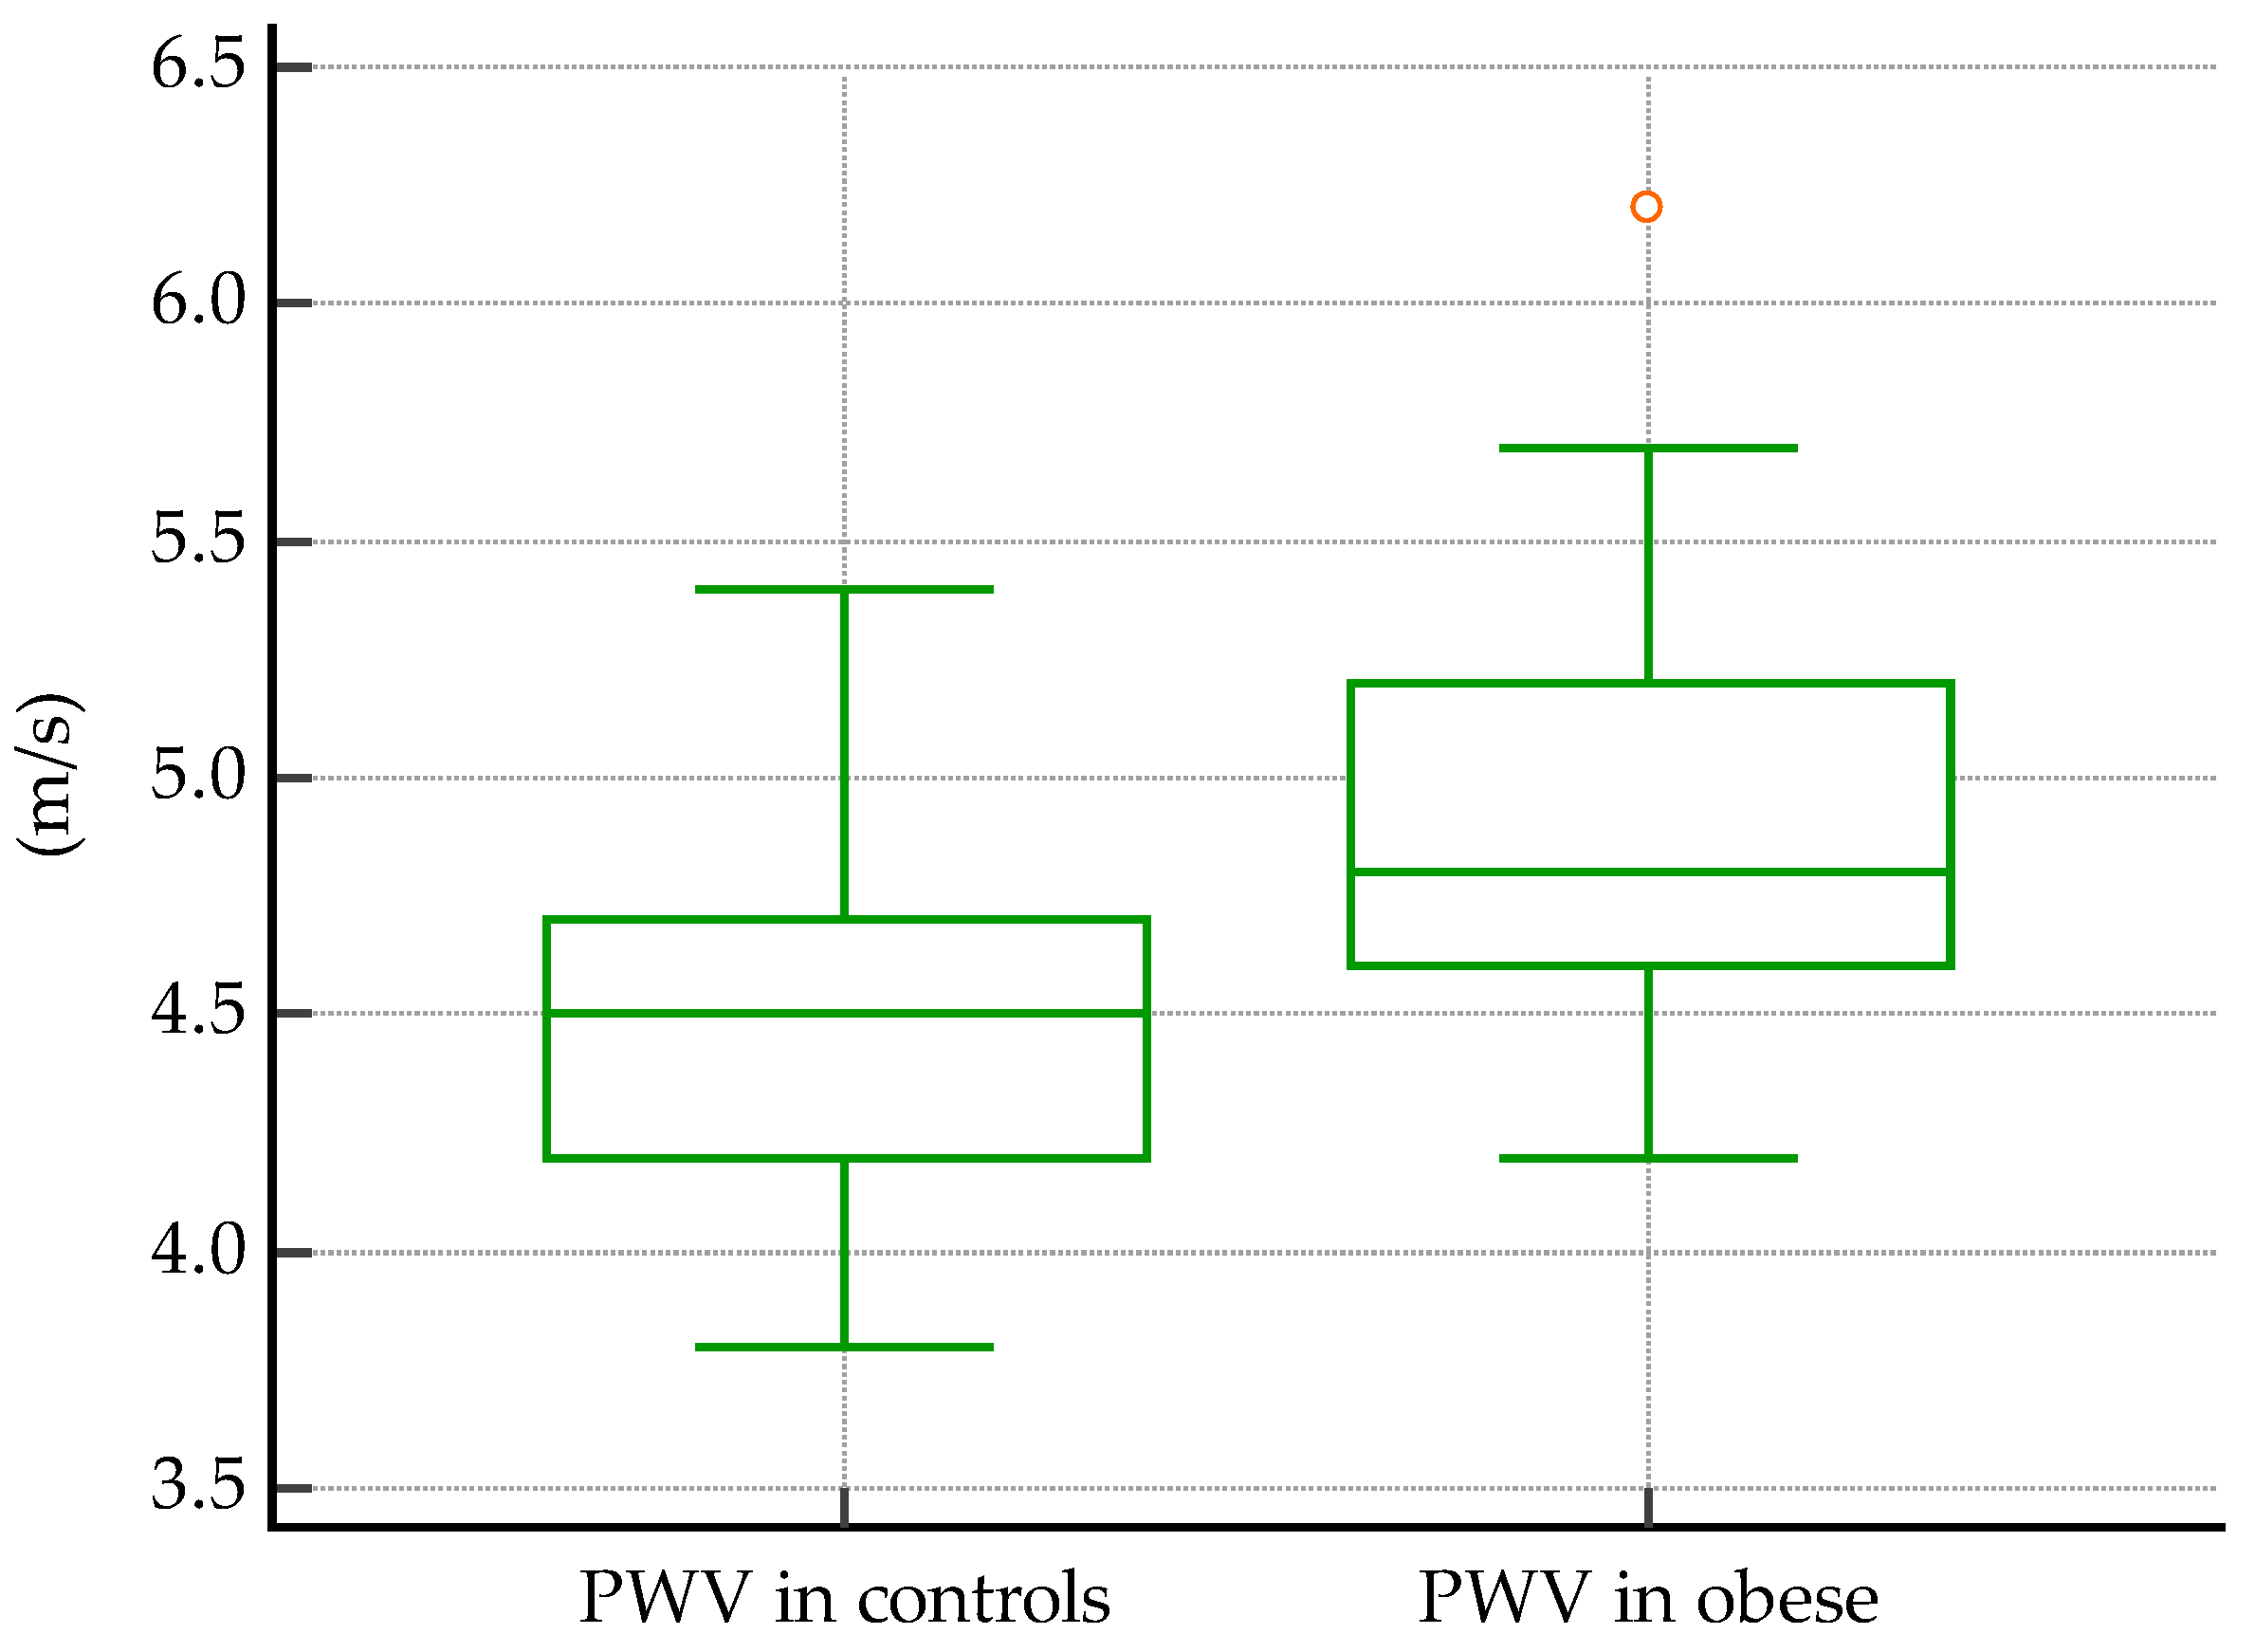
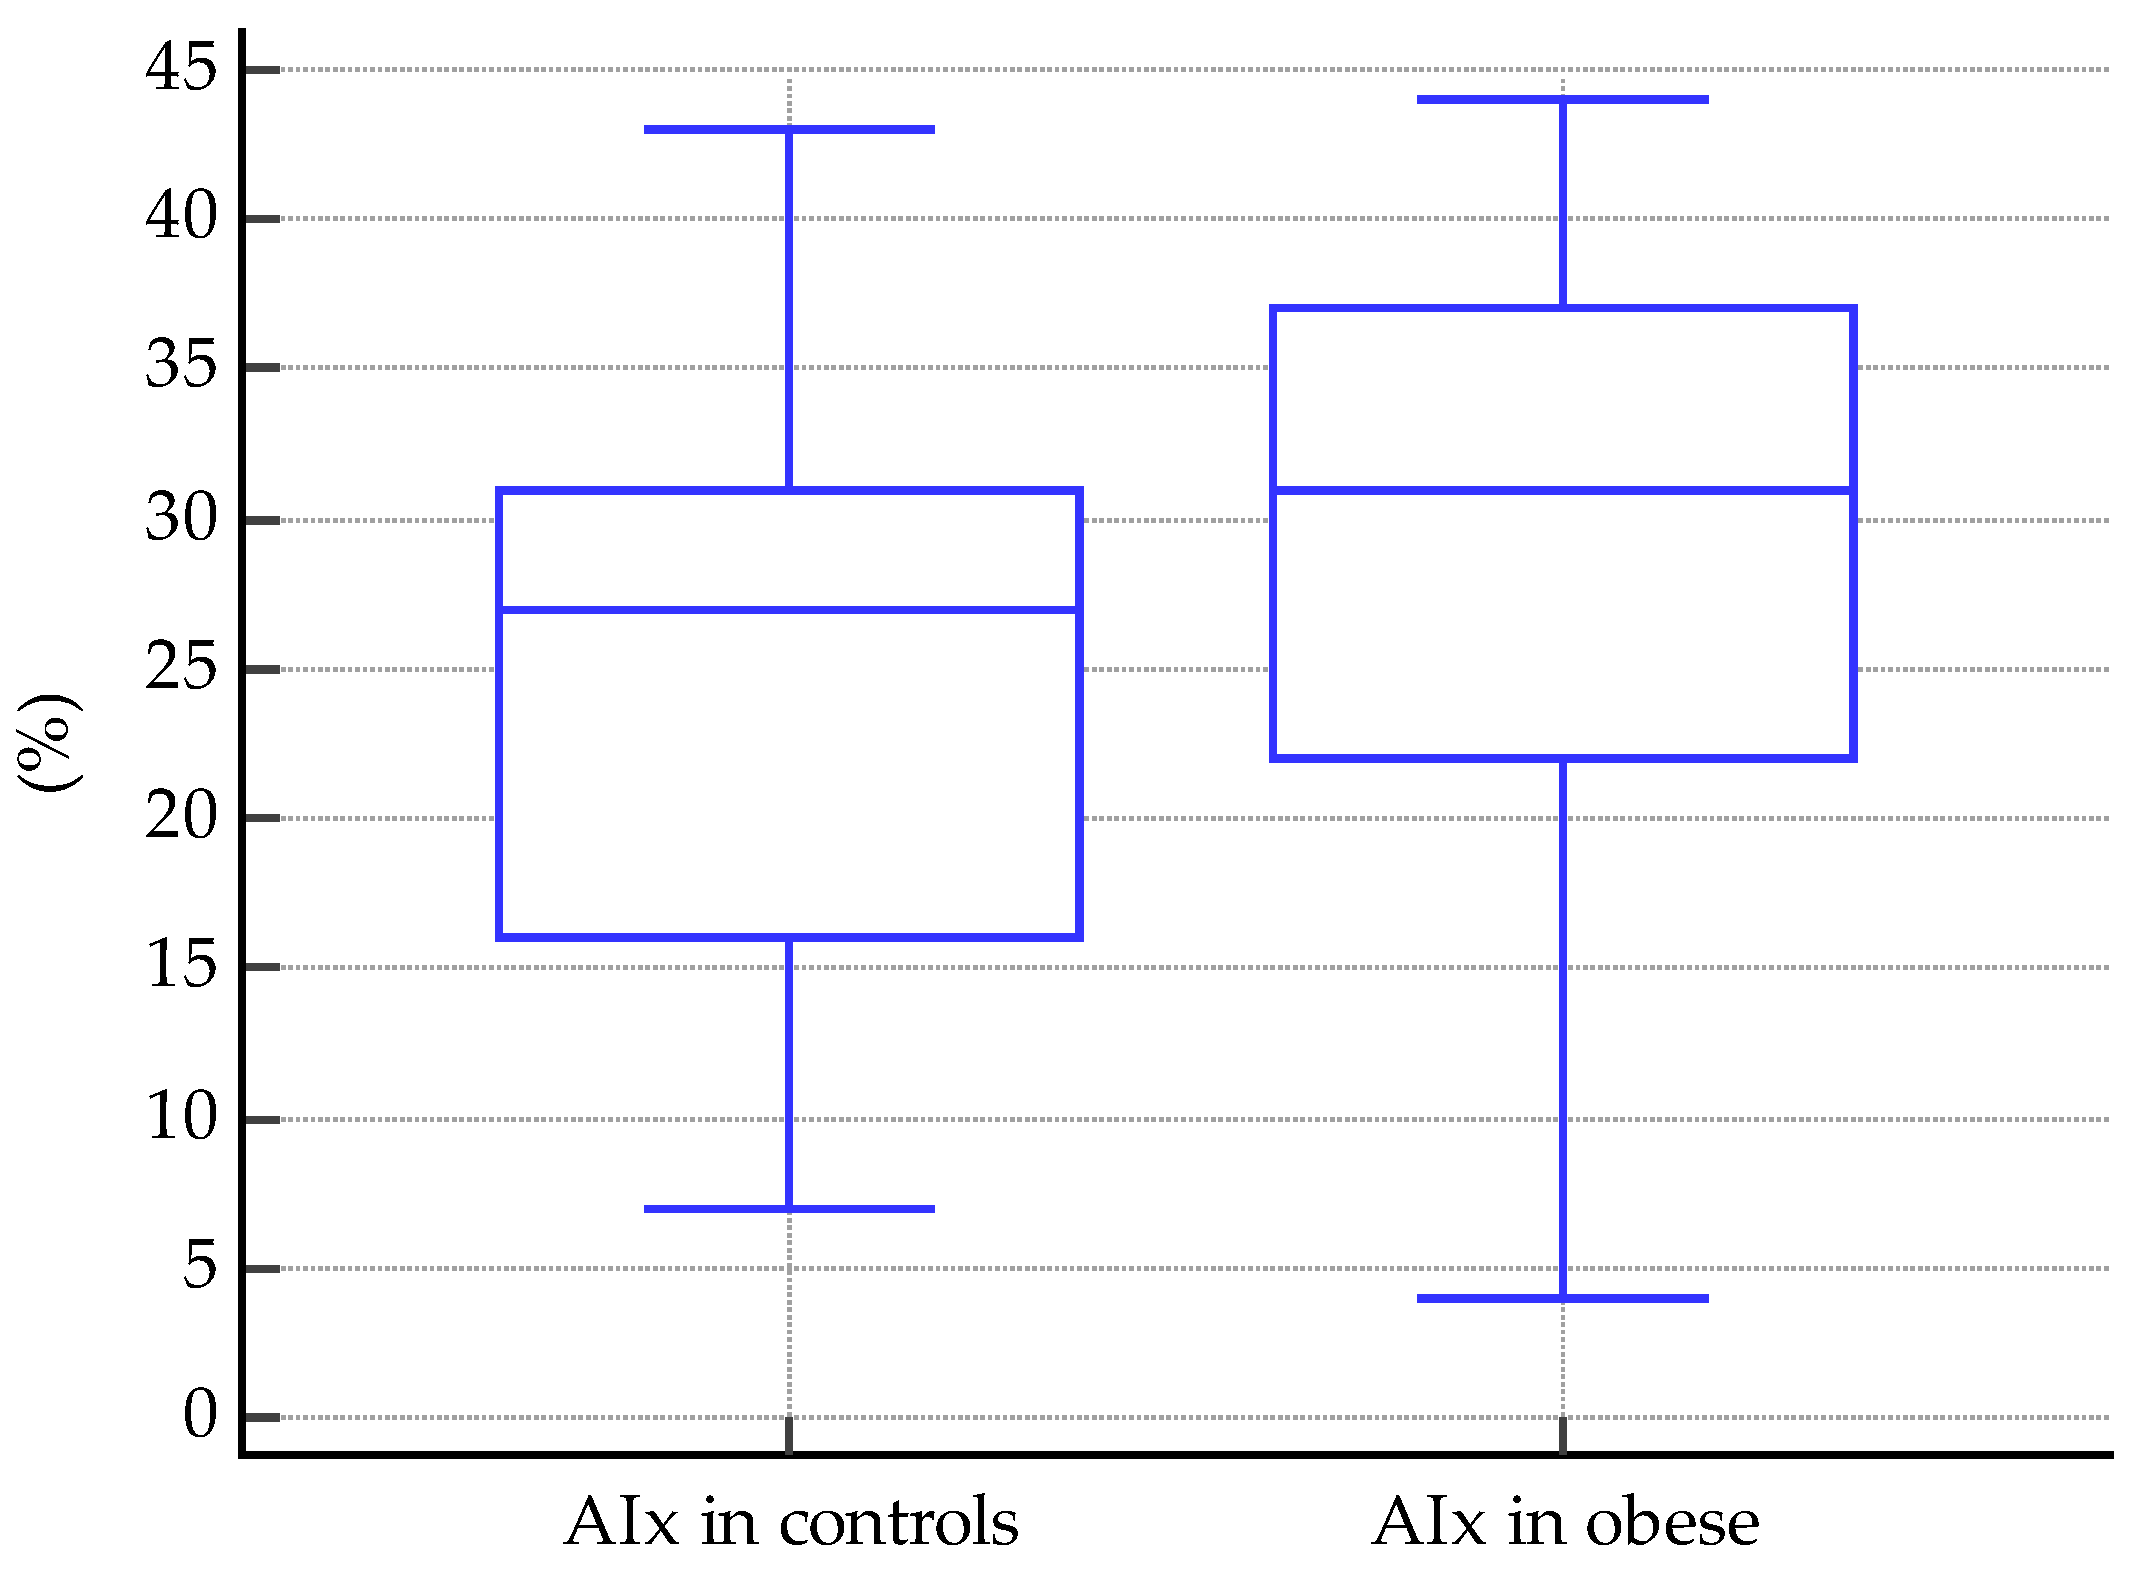
Significant differences were detected when comparing the vascular biomarkers of obese subjects vs. controls. For PWV, median values were 4.8 m/s in obese subjects, and 4.5 m/s in controls, p < 0.0001 (Figure 4). The same was found for AIx, with a mean value of 29.28% in obese subjects and 24.58% in controls, p = 0.03 (Figure 5).
Median values for SBD were significantly higher in obese subjects, 124.5 mmHg vs. 116 mmHg in controls, p < 0.0001 (Figure 6). However, the differences between DBP median values were not significant between the two groups (79.5 mmHg in obese subjects and 78.5 mmHg in controls, p = 0.63, Figure 6). The analysis showed significant differences between the median values of MAP in obese and normal-weight subjects (100 mmHg and 96.5 mmHg, respectively, p = 0.008). (As depicted in Figure 6.)
Furthermore, the analysis showed significantly higher cSBP median values in obese children, 116.5 mmHg, than in controls, 103 mmHg (p < 0.0001), see Figure 7. The same was observed in the case of cDBP: a mean value of 77.08 mmHg in obese subjects vs. 69.52 mmHg in controls, p = 0.003 (Figure 7). Median values for cPP were also significantly higher in the obese group: 41.7 mmHg vs. 33.4 mmHg, p = 0.0001 (Figure 7).
With regard to HR, significantly higher values were detected in obese children: 91 beats/minute vs. 82 beats/minute (p = 0.02).

3.1.4. Predictive Cut-Off Values for the Vascular Biomarkers

Predictive cut-off values for the vascular biomarkers in all subjects
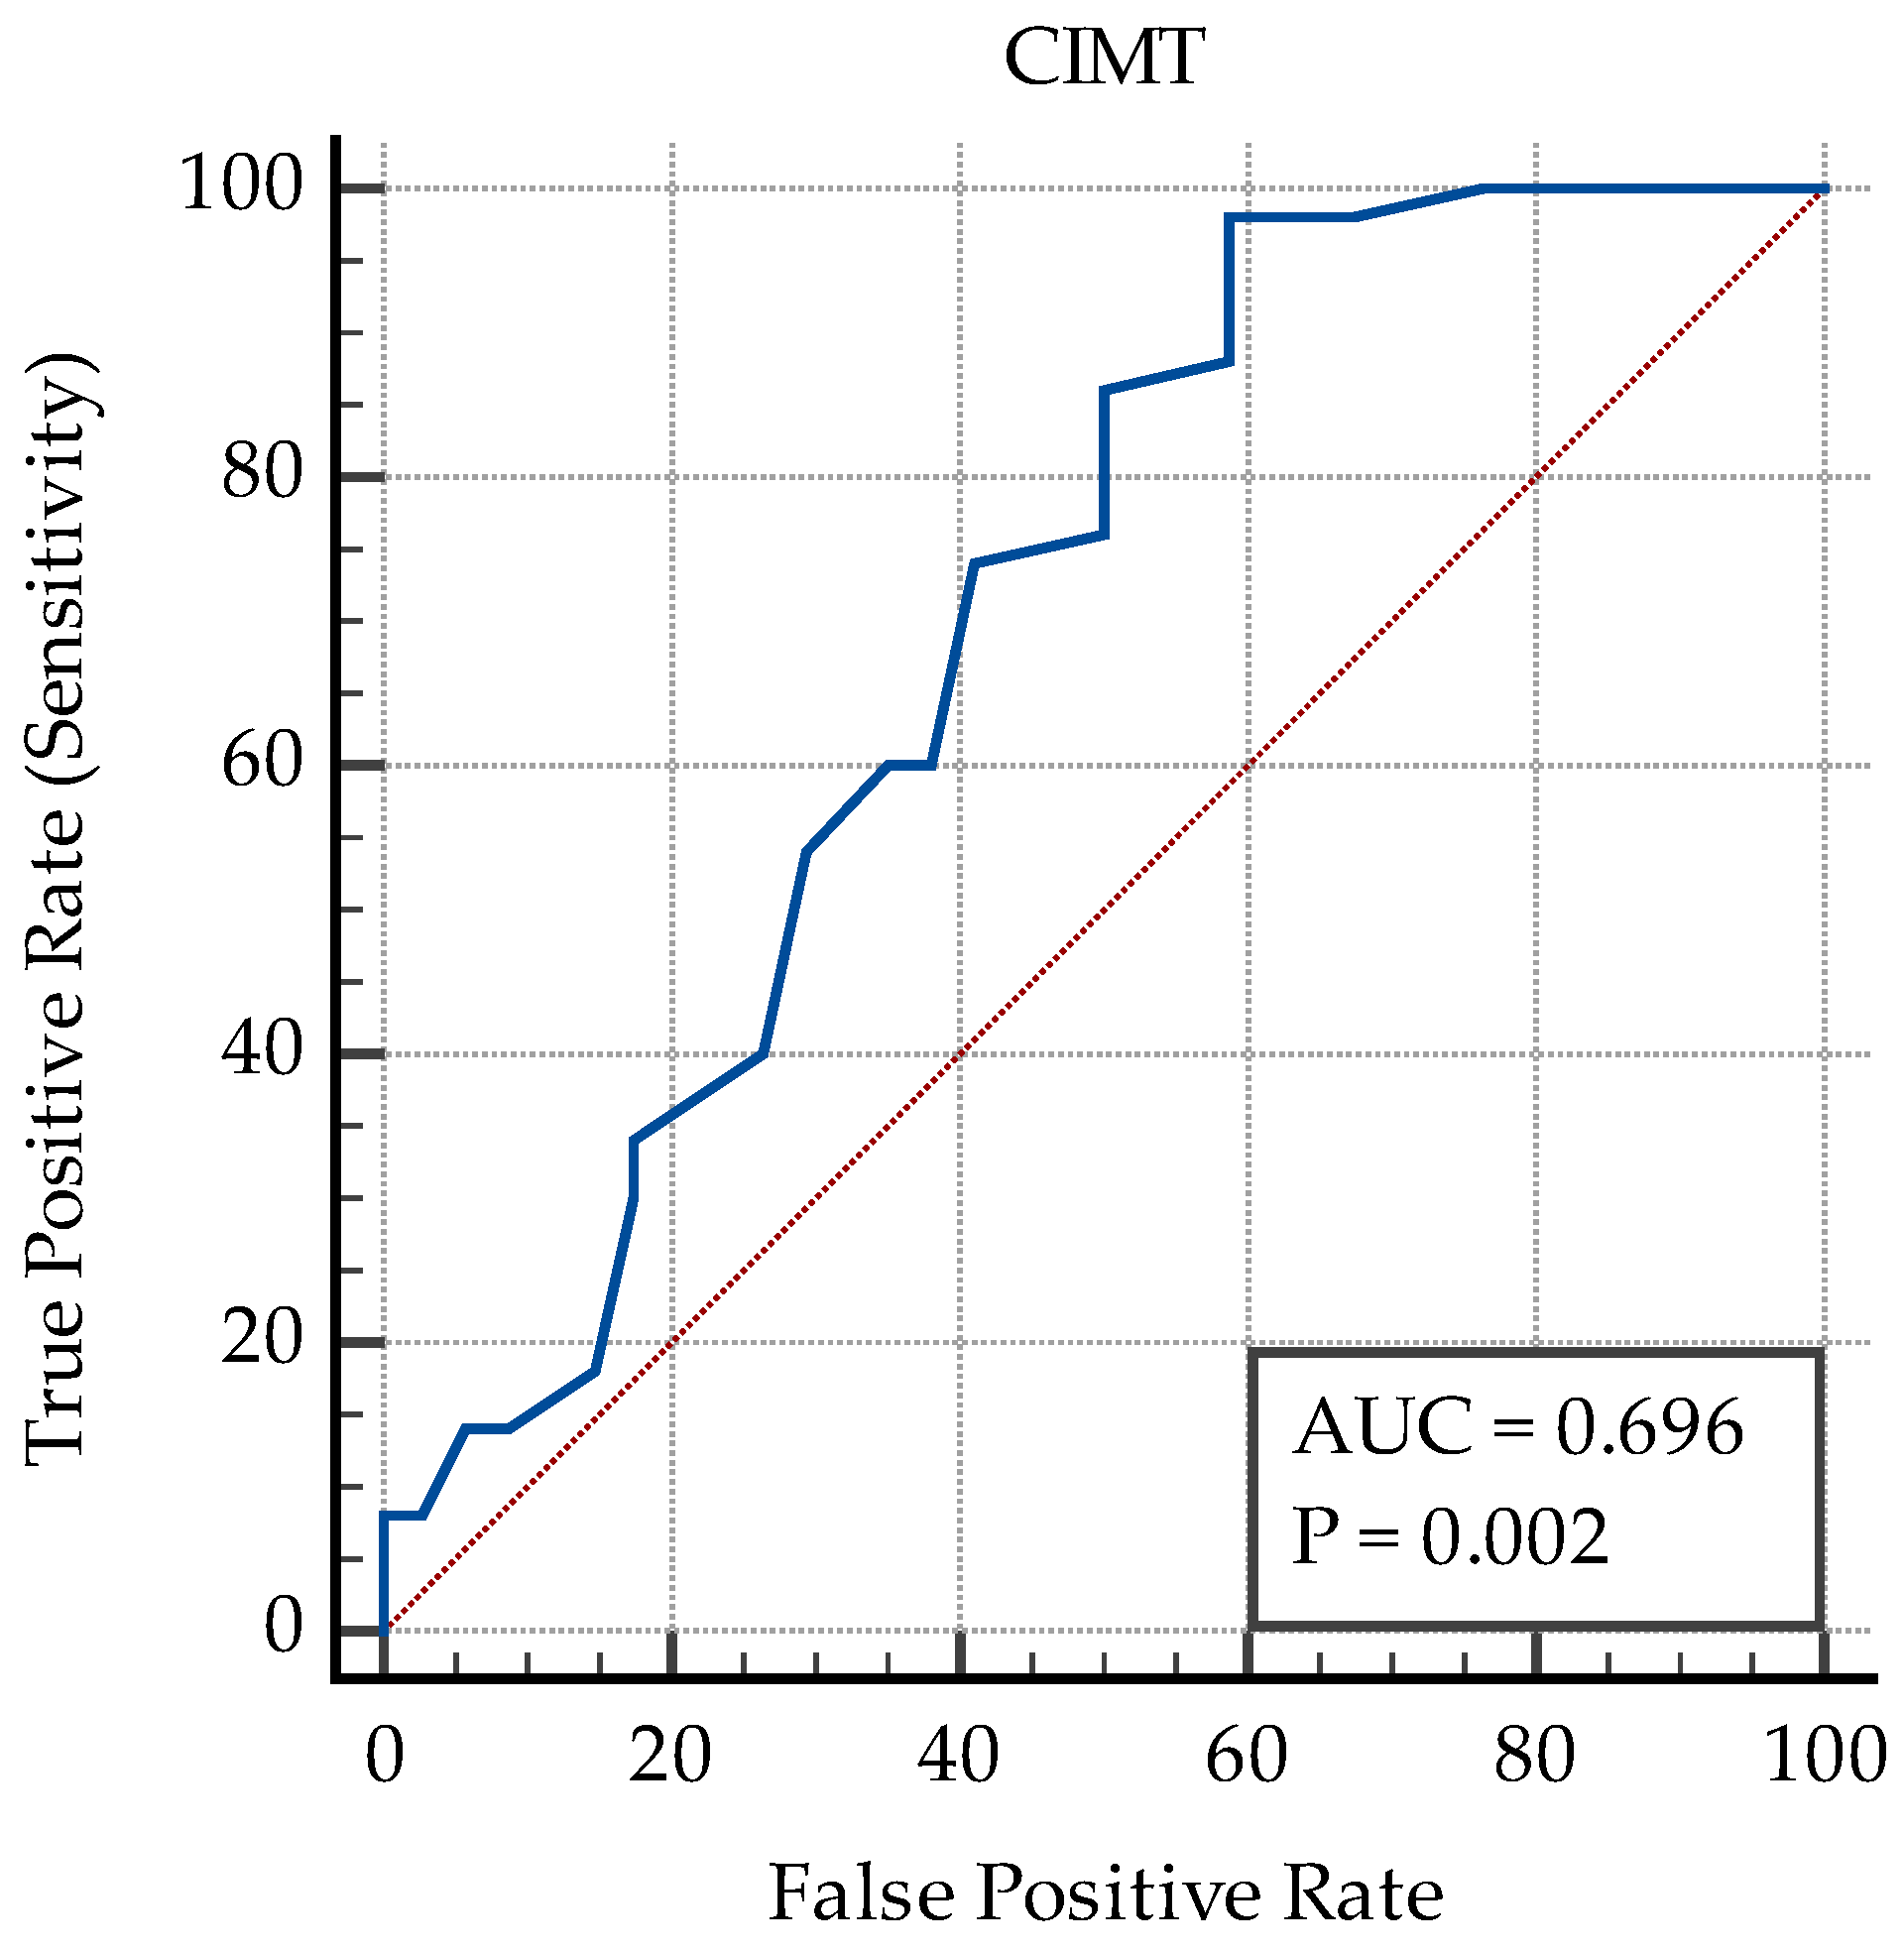
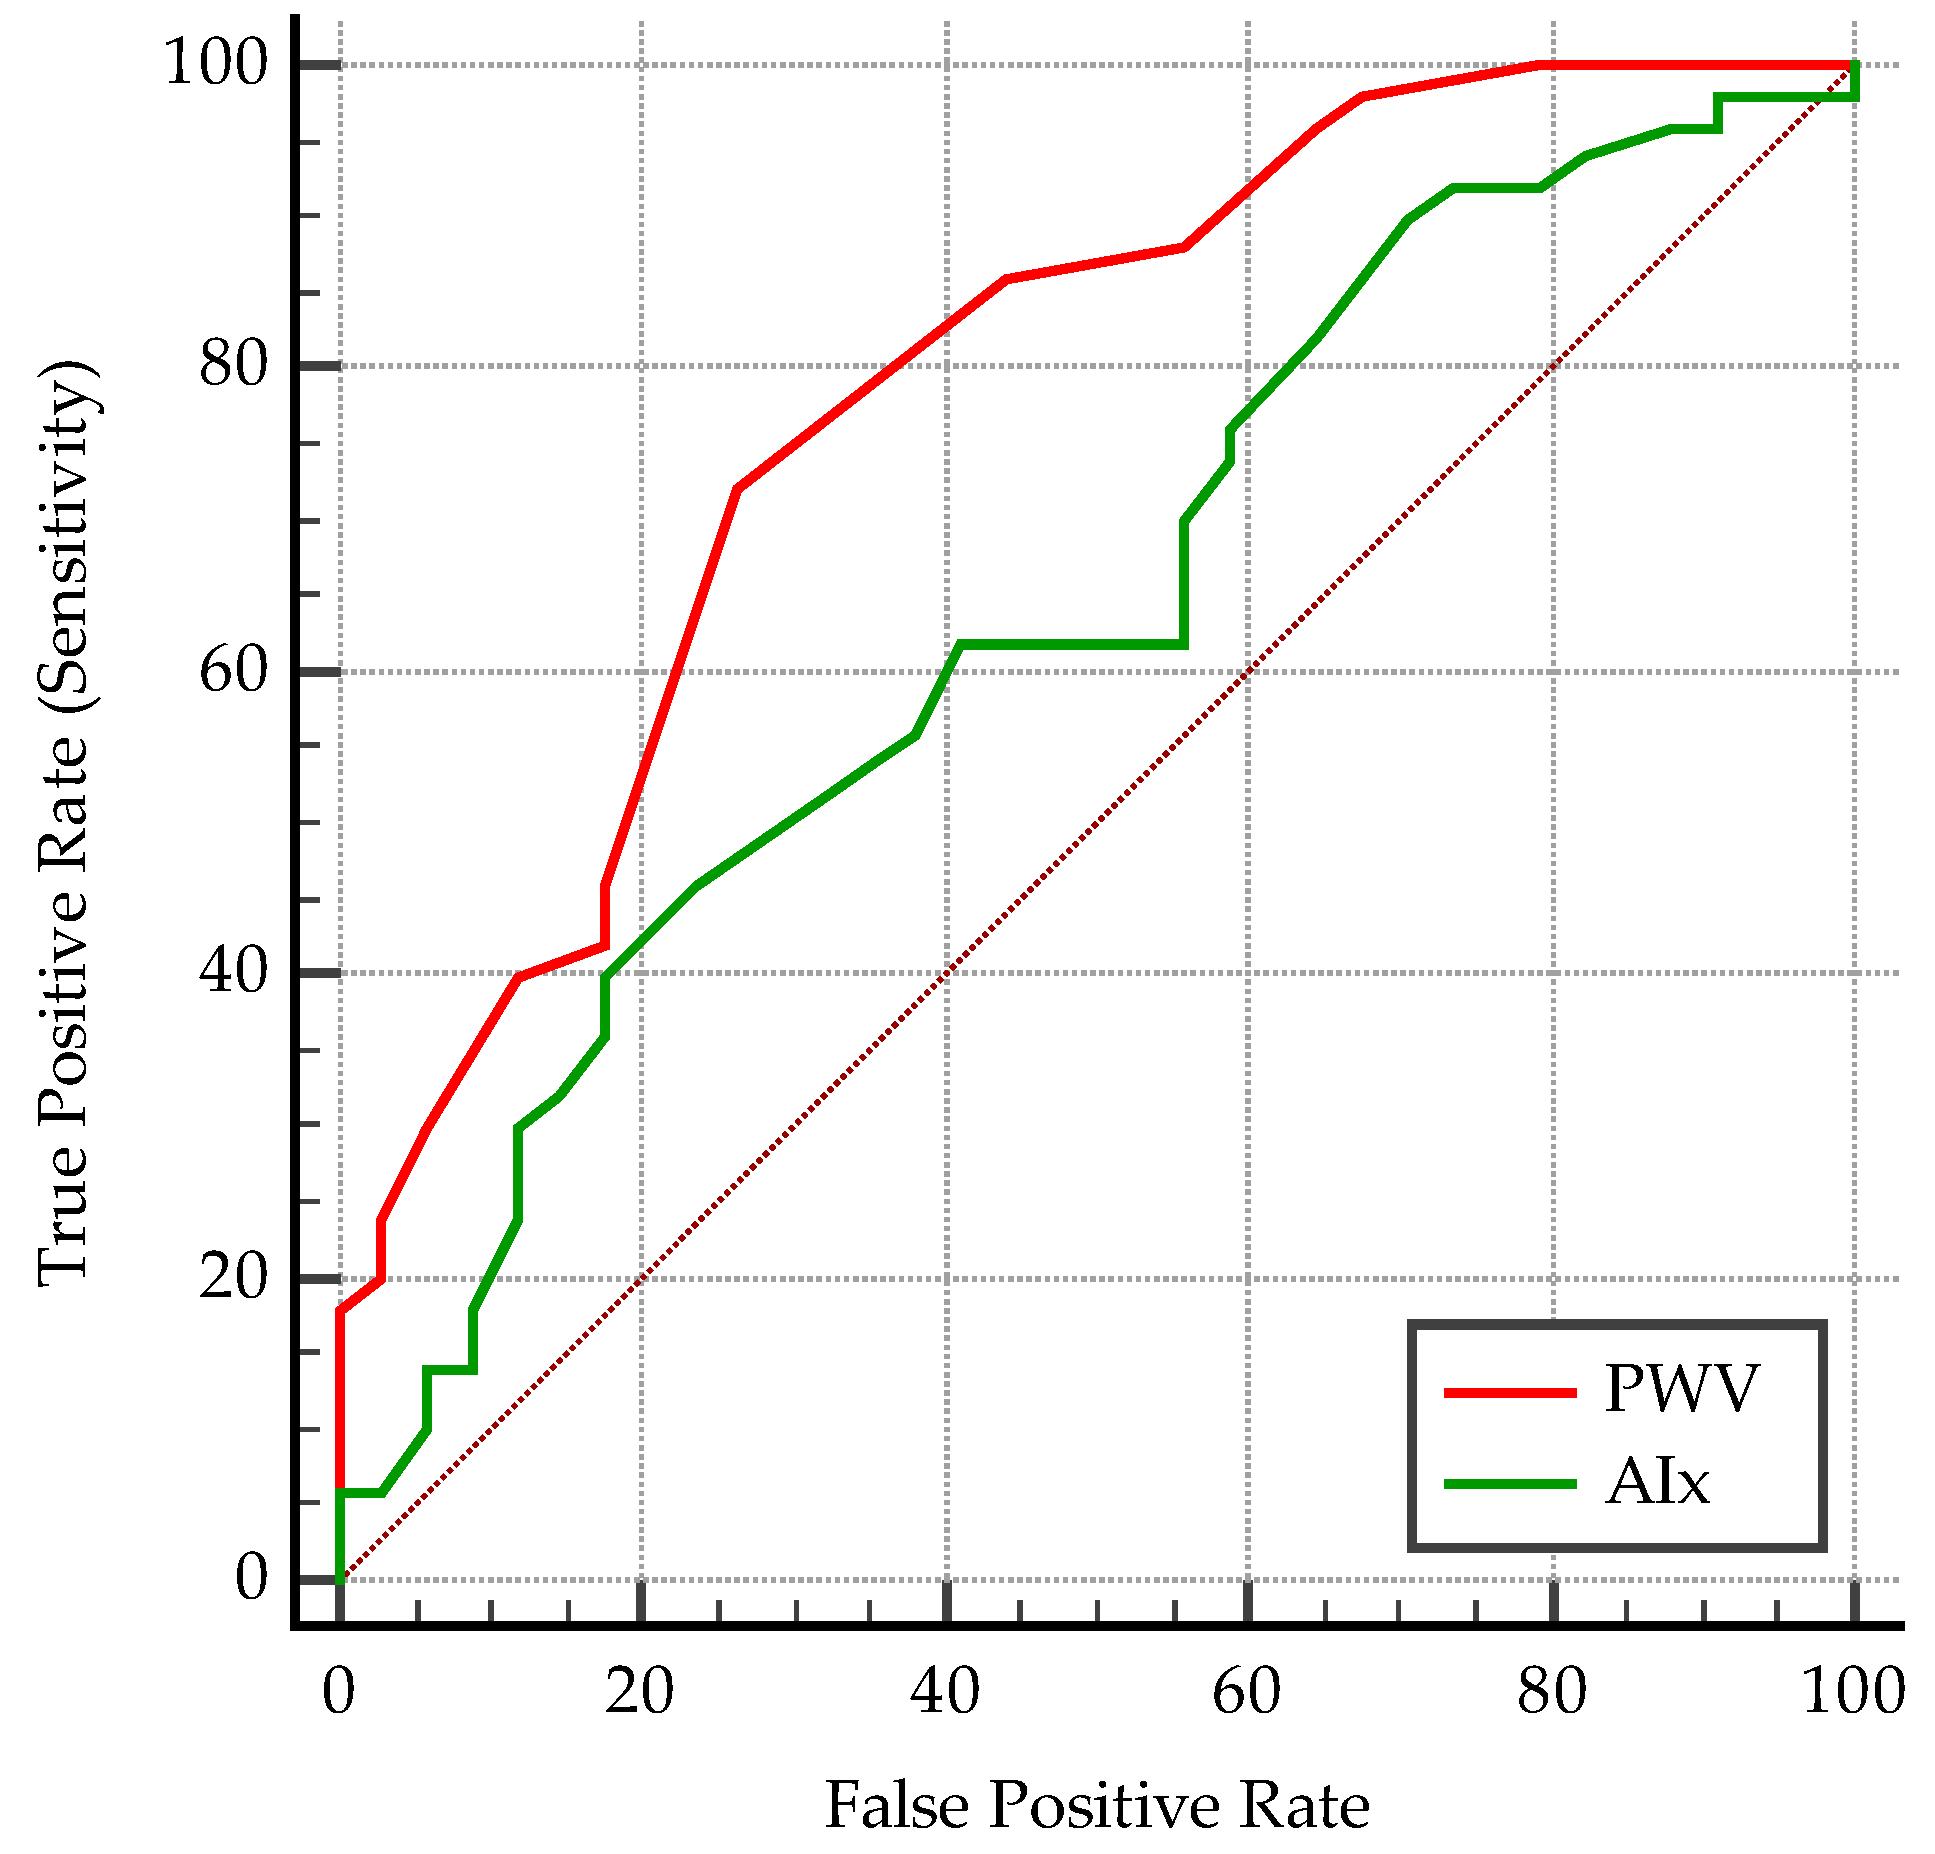
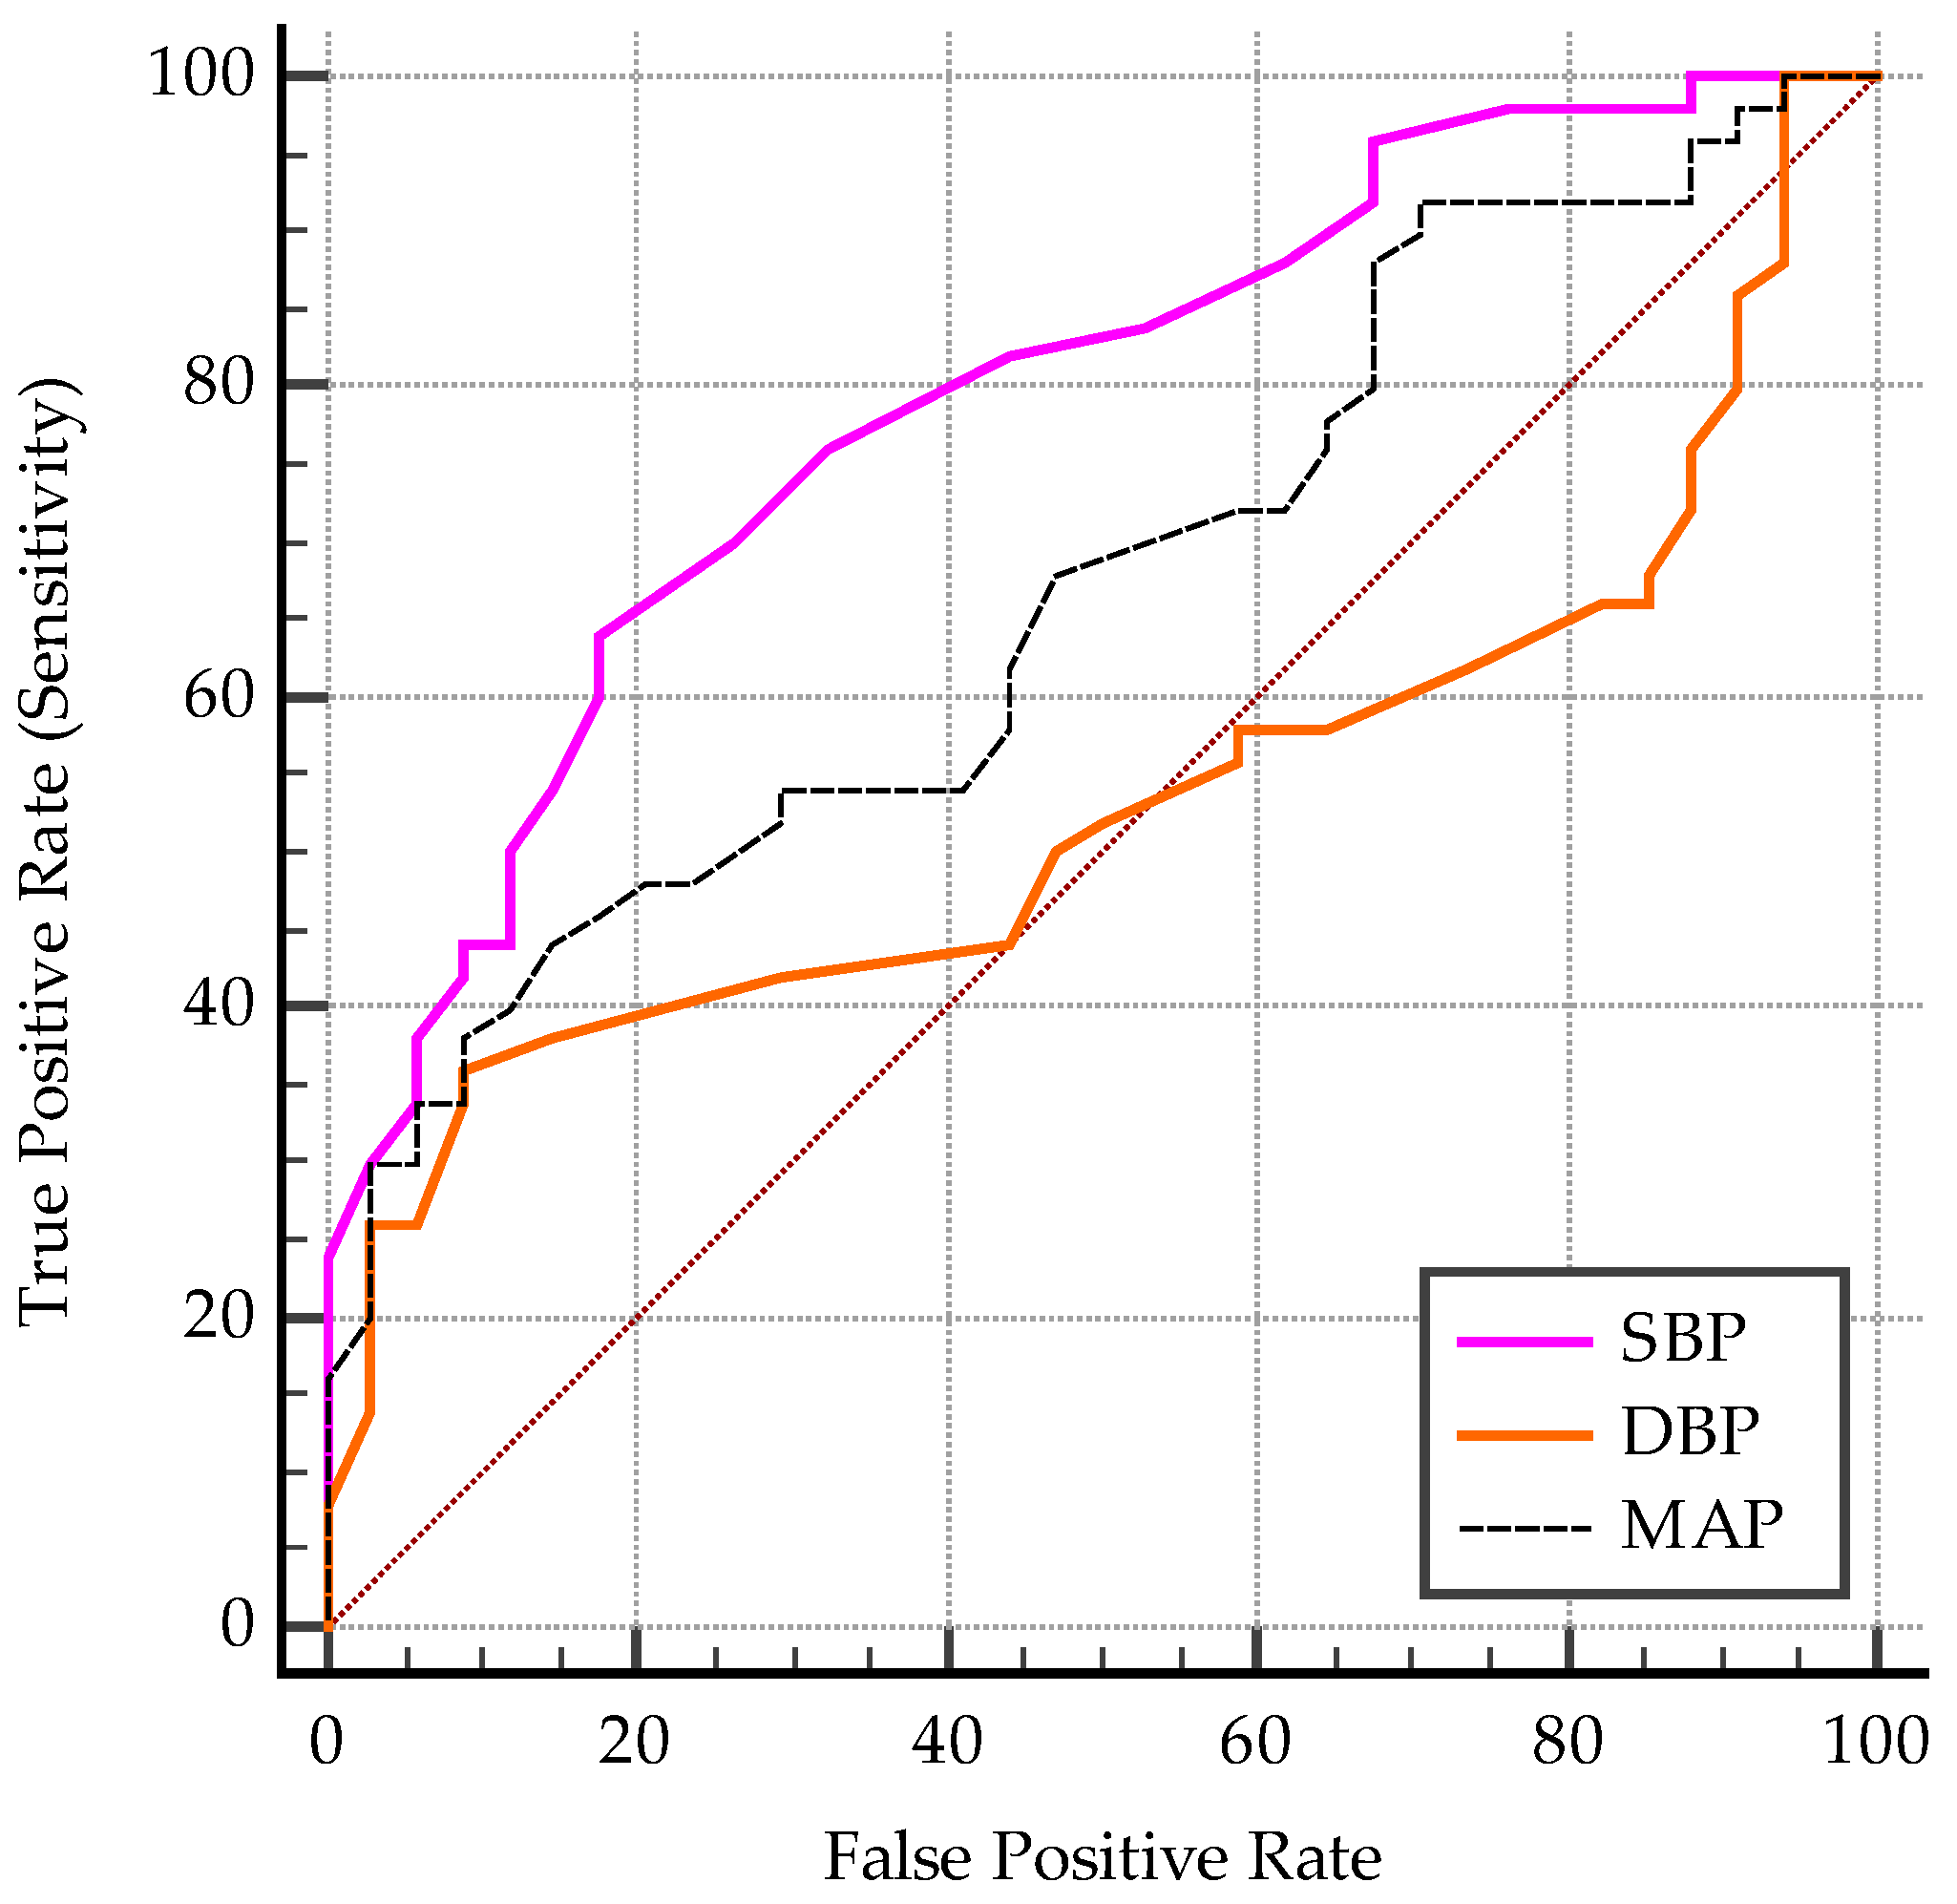
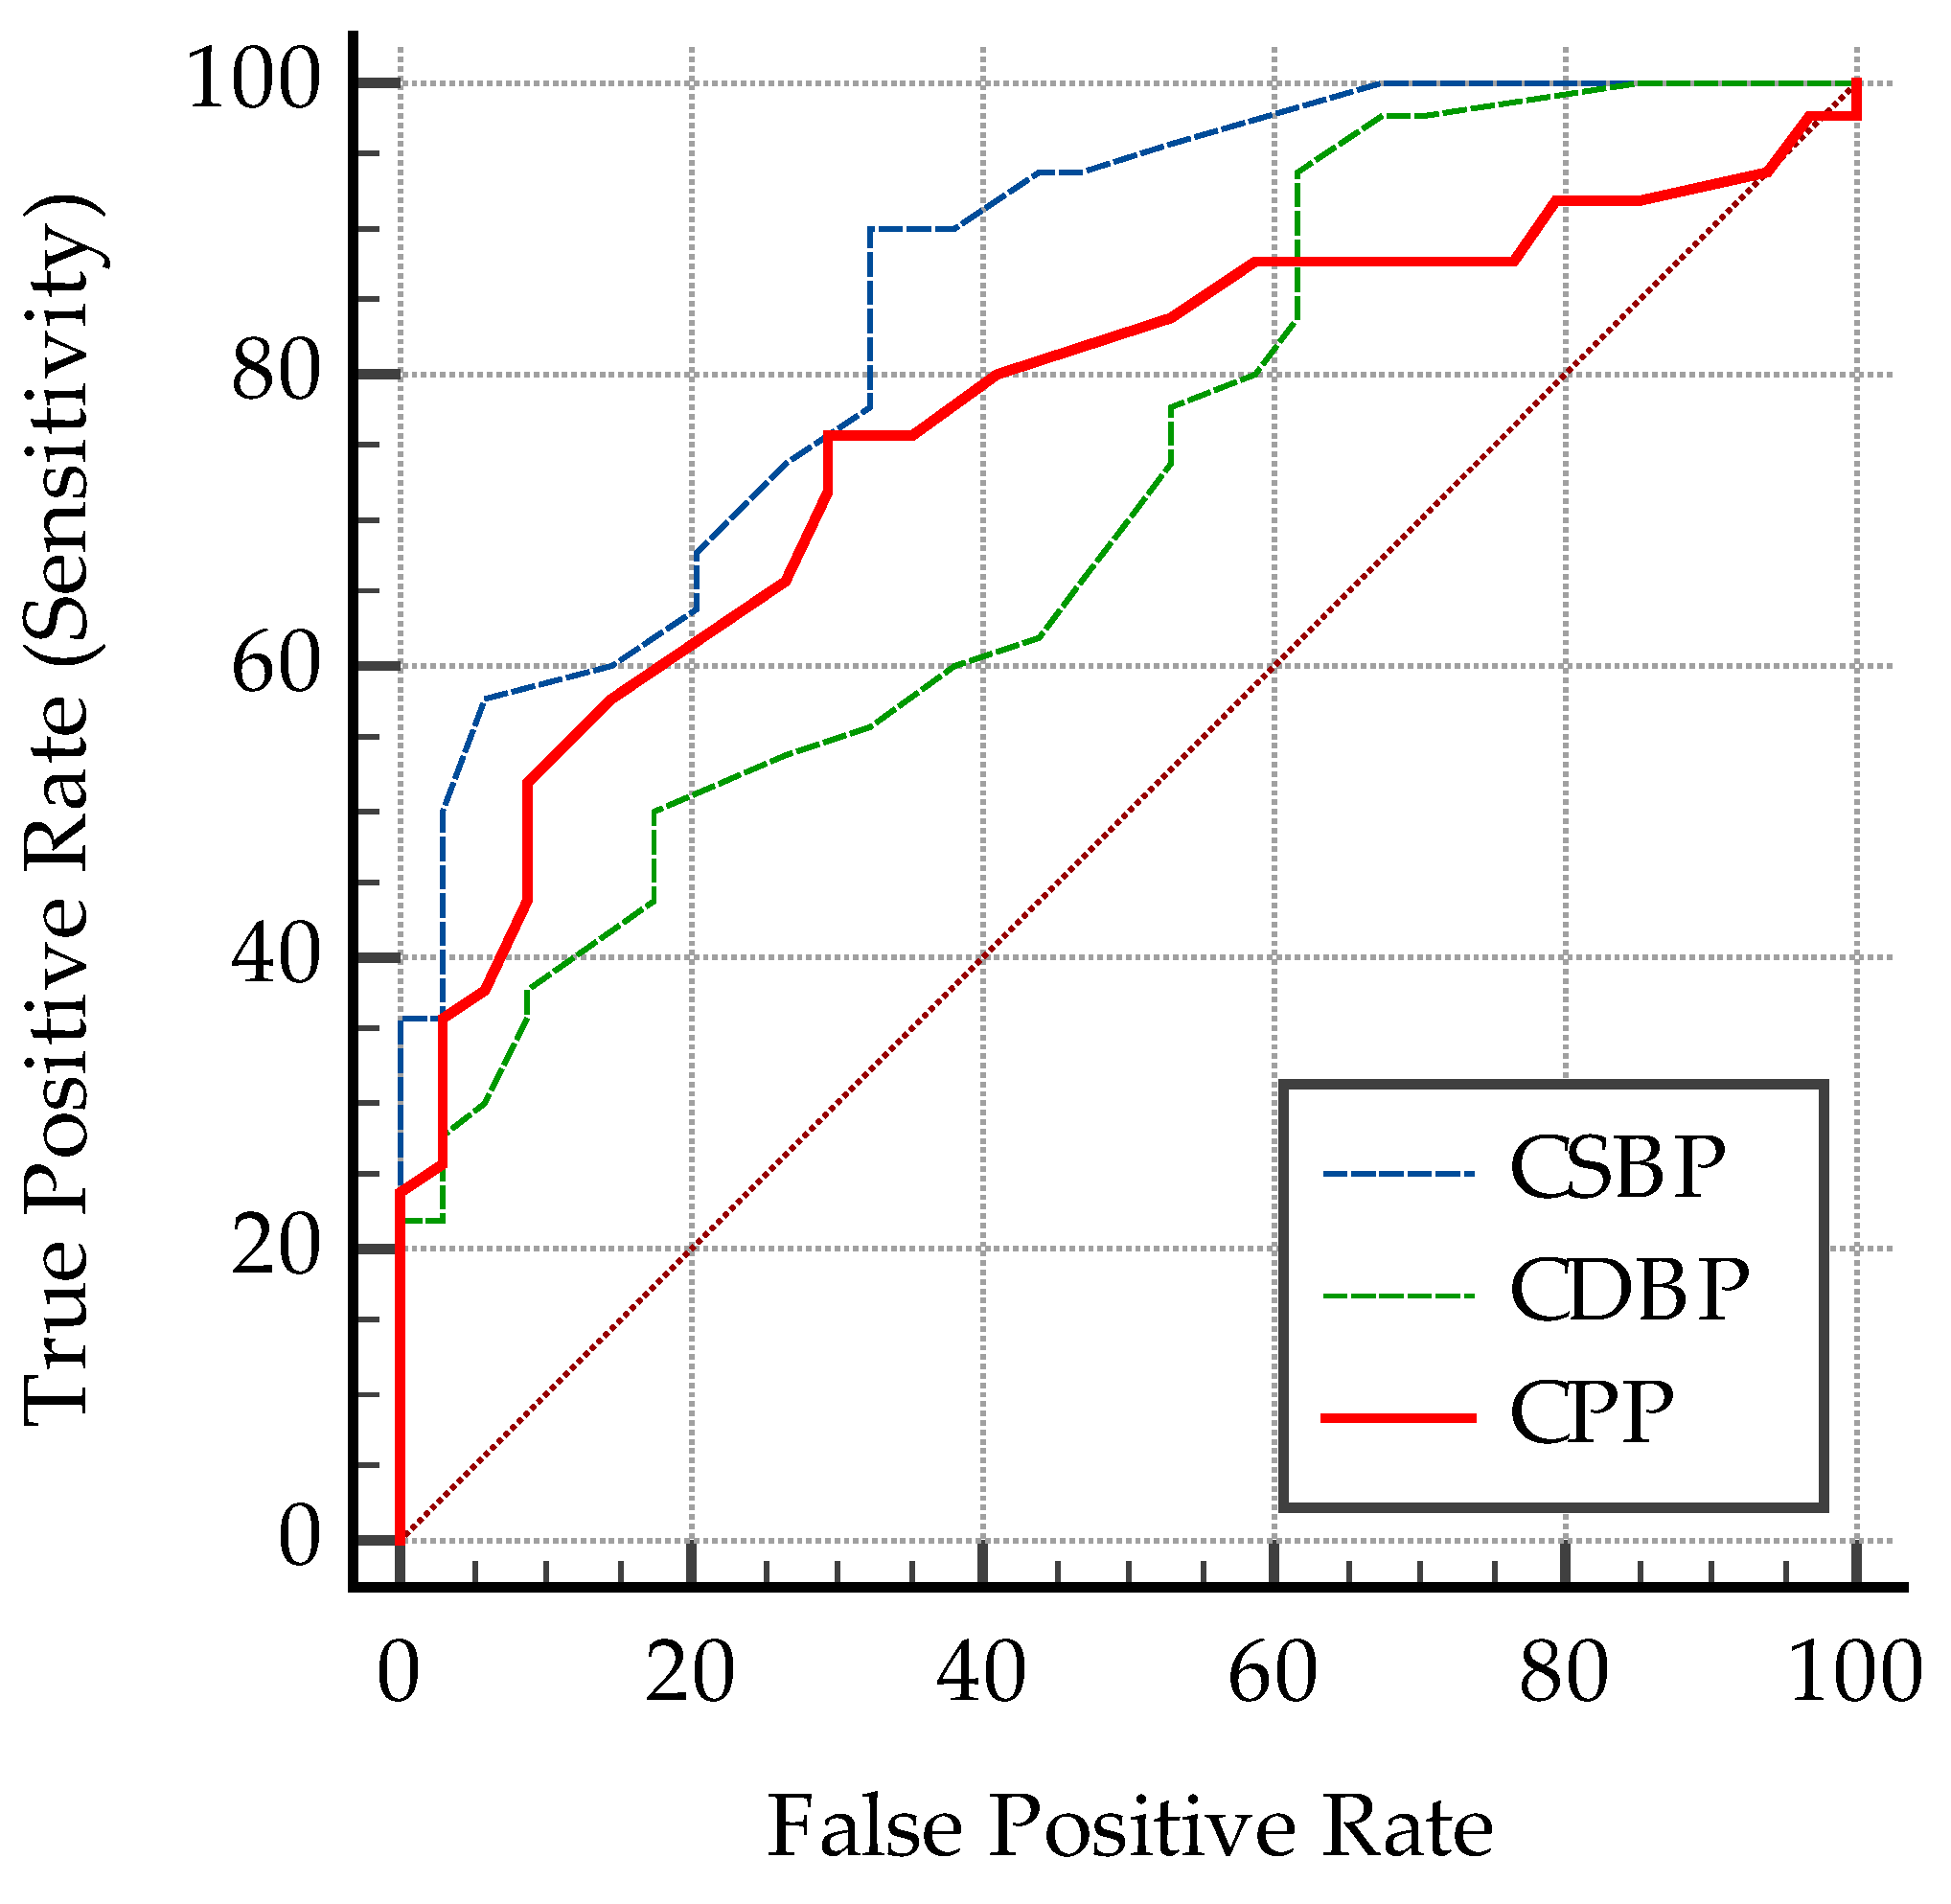
The AUC-ROC analysis was made for each vascular parameter, in order to detect the presence of obesity. The optimal cut-off values, defined as the highest sum of sensitivity (Se) and specificity (Sp) for predicting the presence of obesity in children, are depicted in Table 9, and the ROC curves are graphically represented in Figure A3, Figure A4, Figure A5 and Figure A6 (see Appendix A).
Predictive cut-off values for the vascular biomarkers according to age groups
The AUC-ROC analysis was performed on each of the age groups in order to evaluate cut-off values that discriminate between obese and normal-weight children (Table 10).

3.2. The Vascular Biomarkers and the Glucose Metabolism

3.2.1. HOMA-IR–A Biomarker of Insulin Resistance

The HOMA-IR index is strongly positively correlated with the BMI, ρ = 0.66, p < 0.0001 (n = 84), as depicted in Figure 8. HOMA-IR is also strongly correlated with WC (ρ = 0.69, p < 0.0001) and WHR (ρ = 0.51, p < 0.0001).
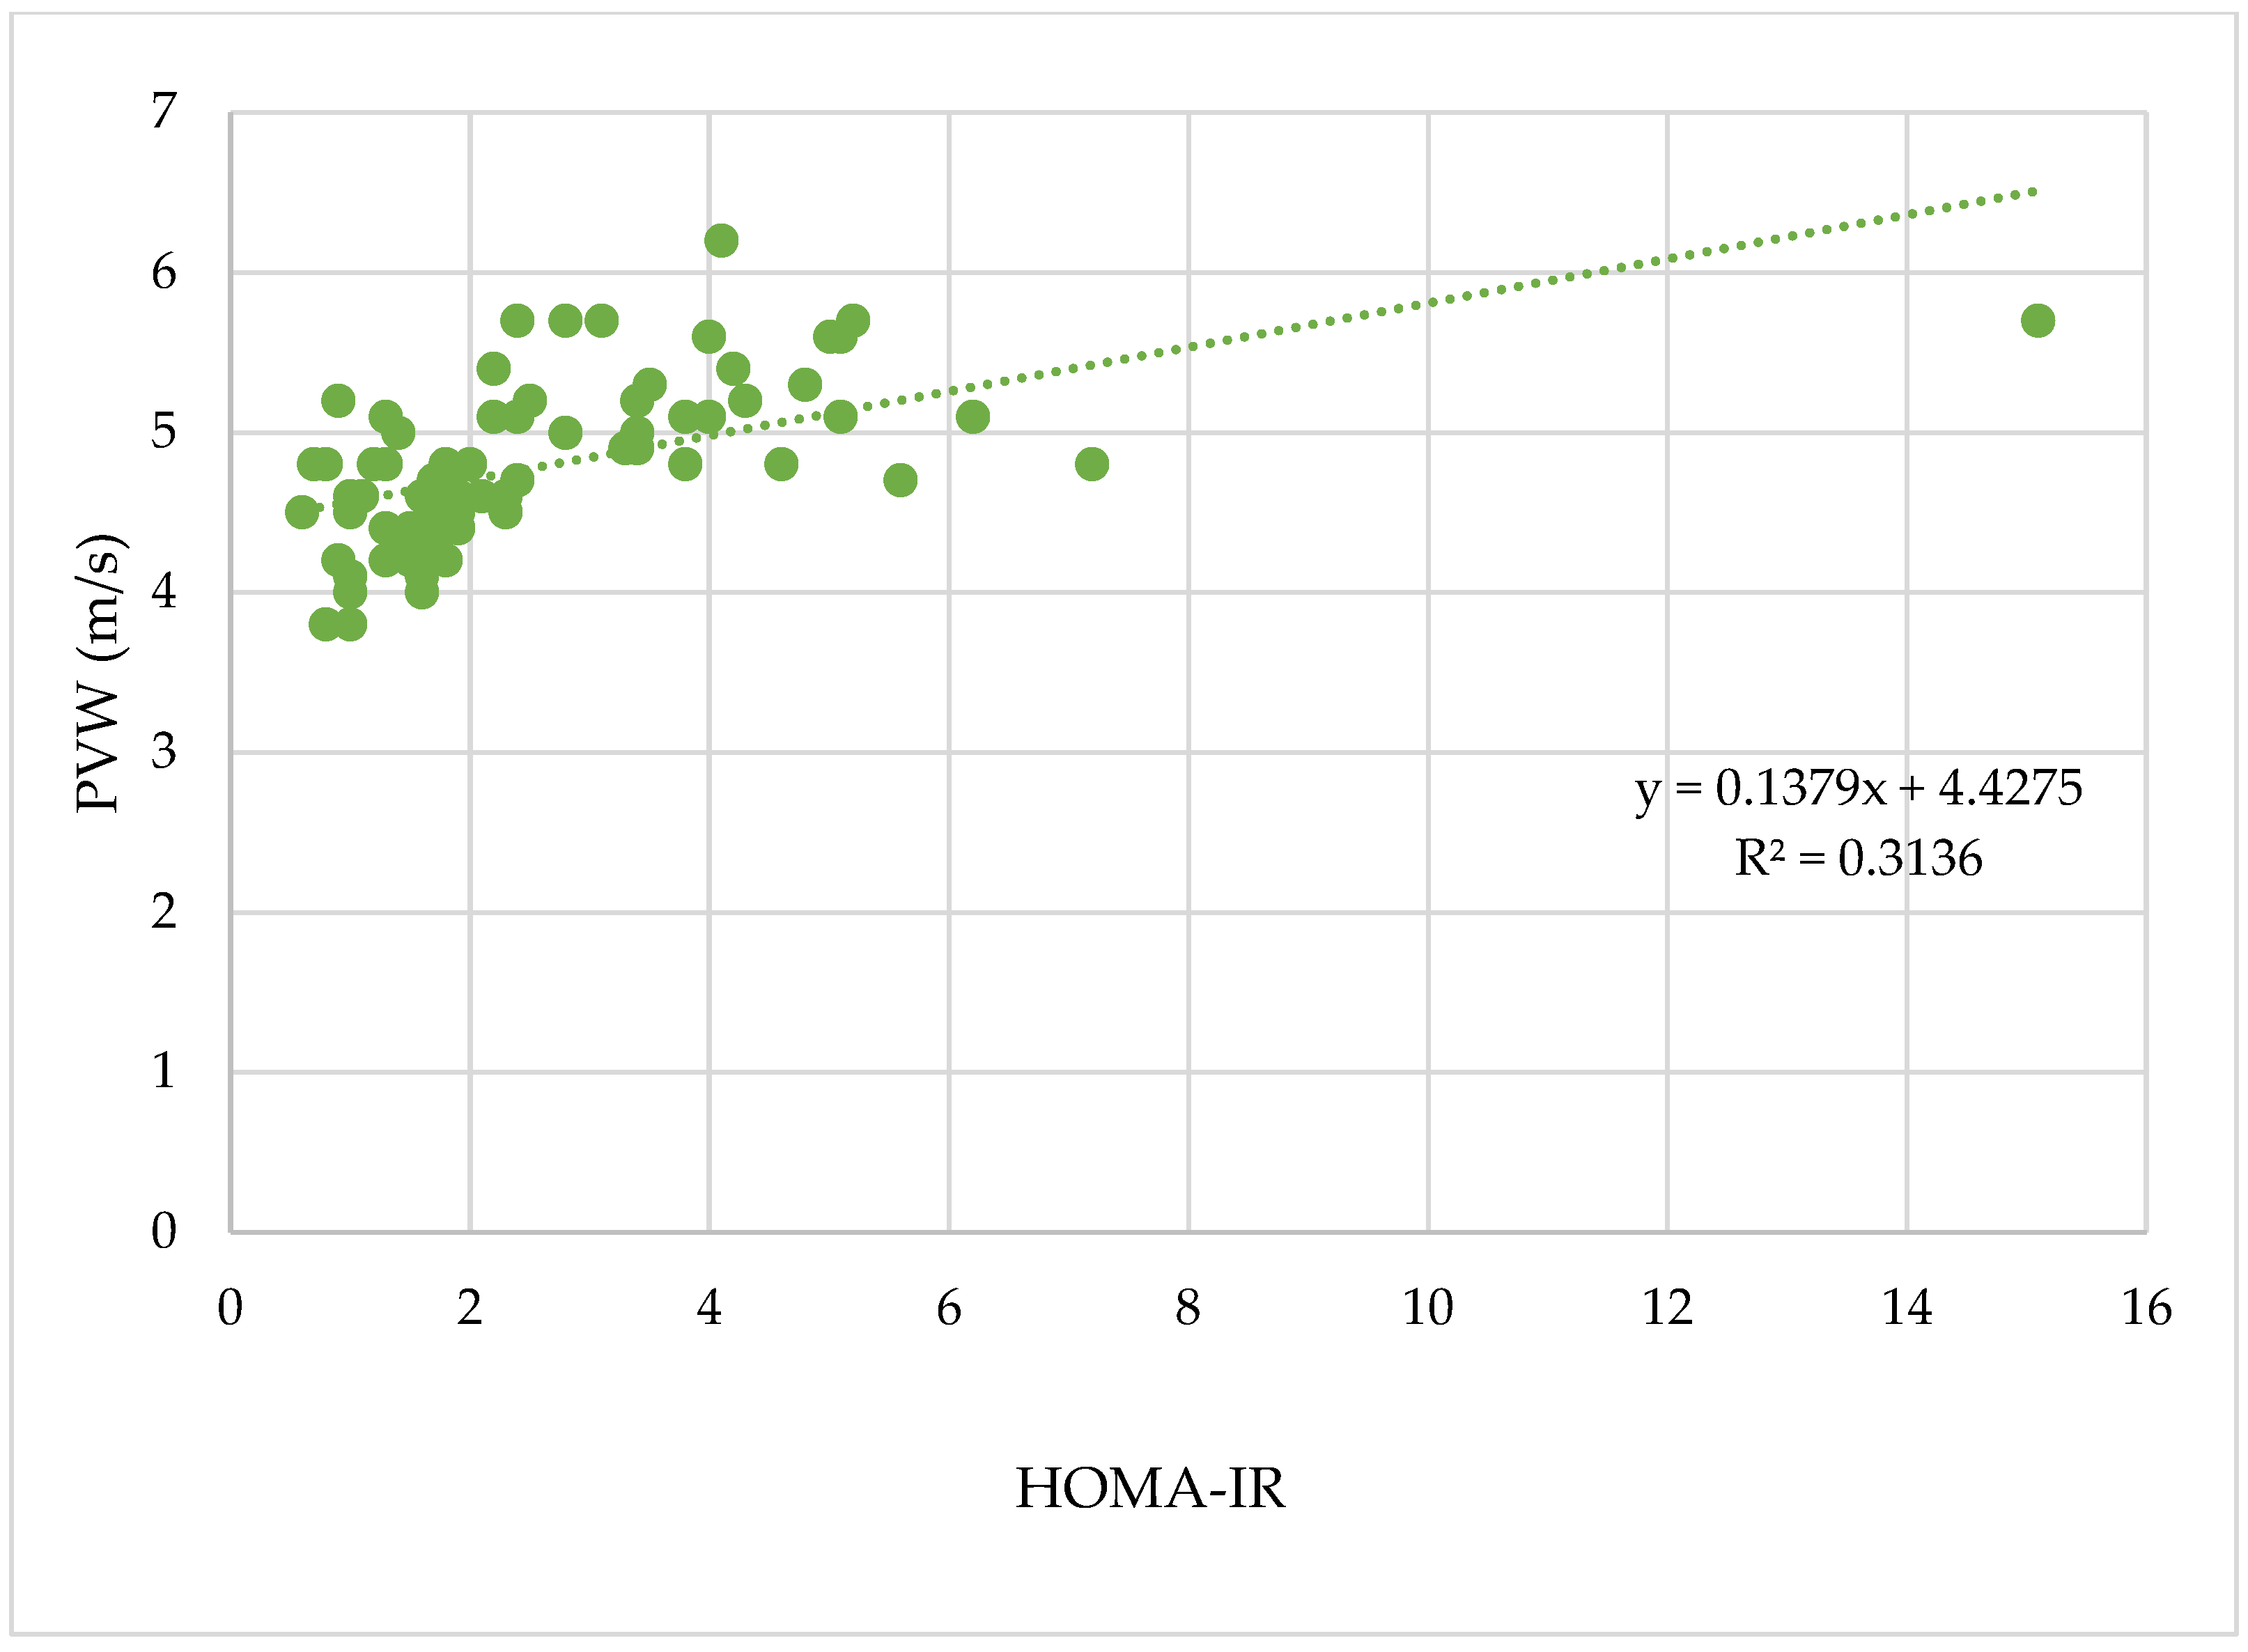
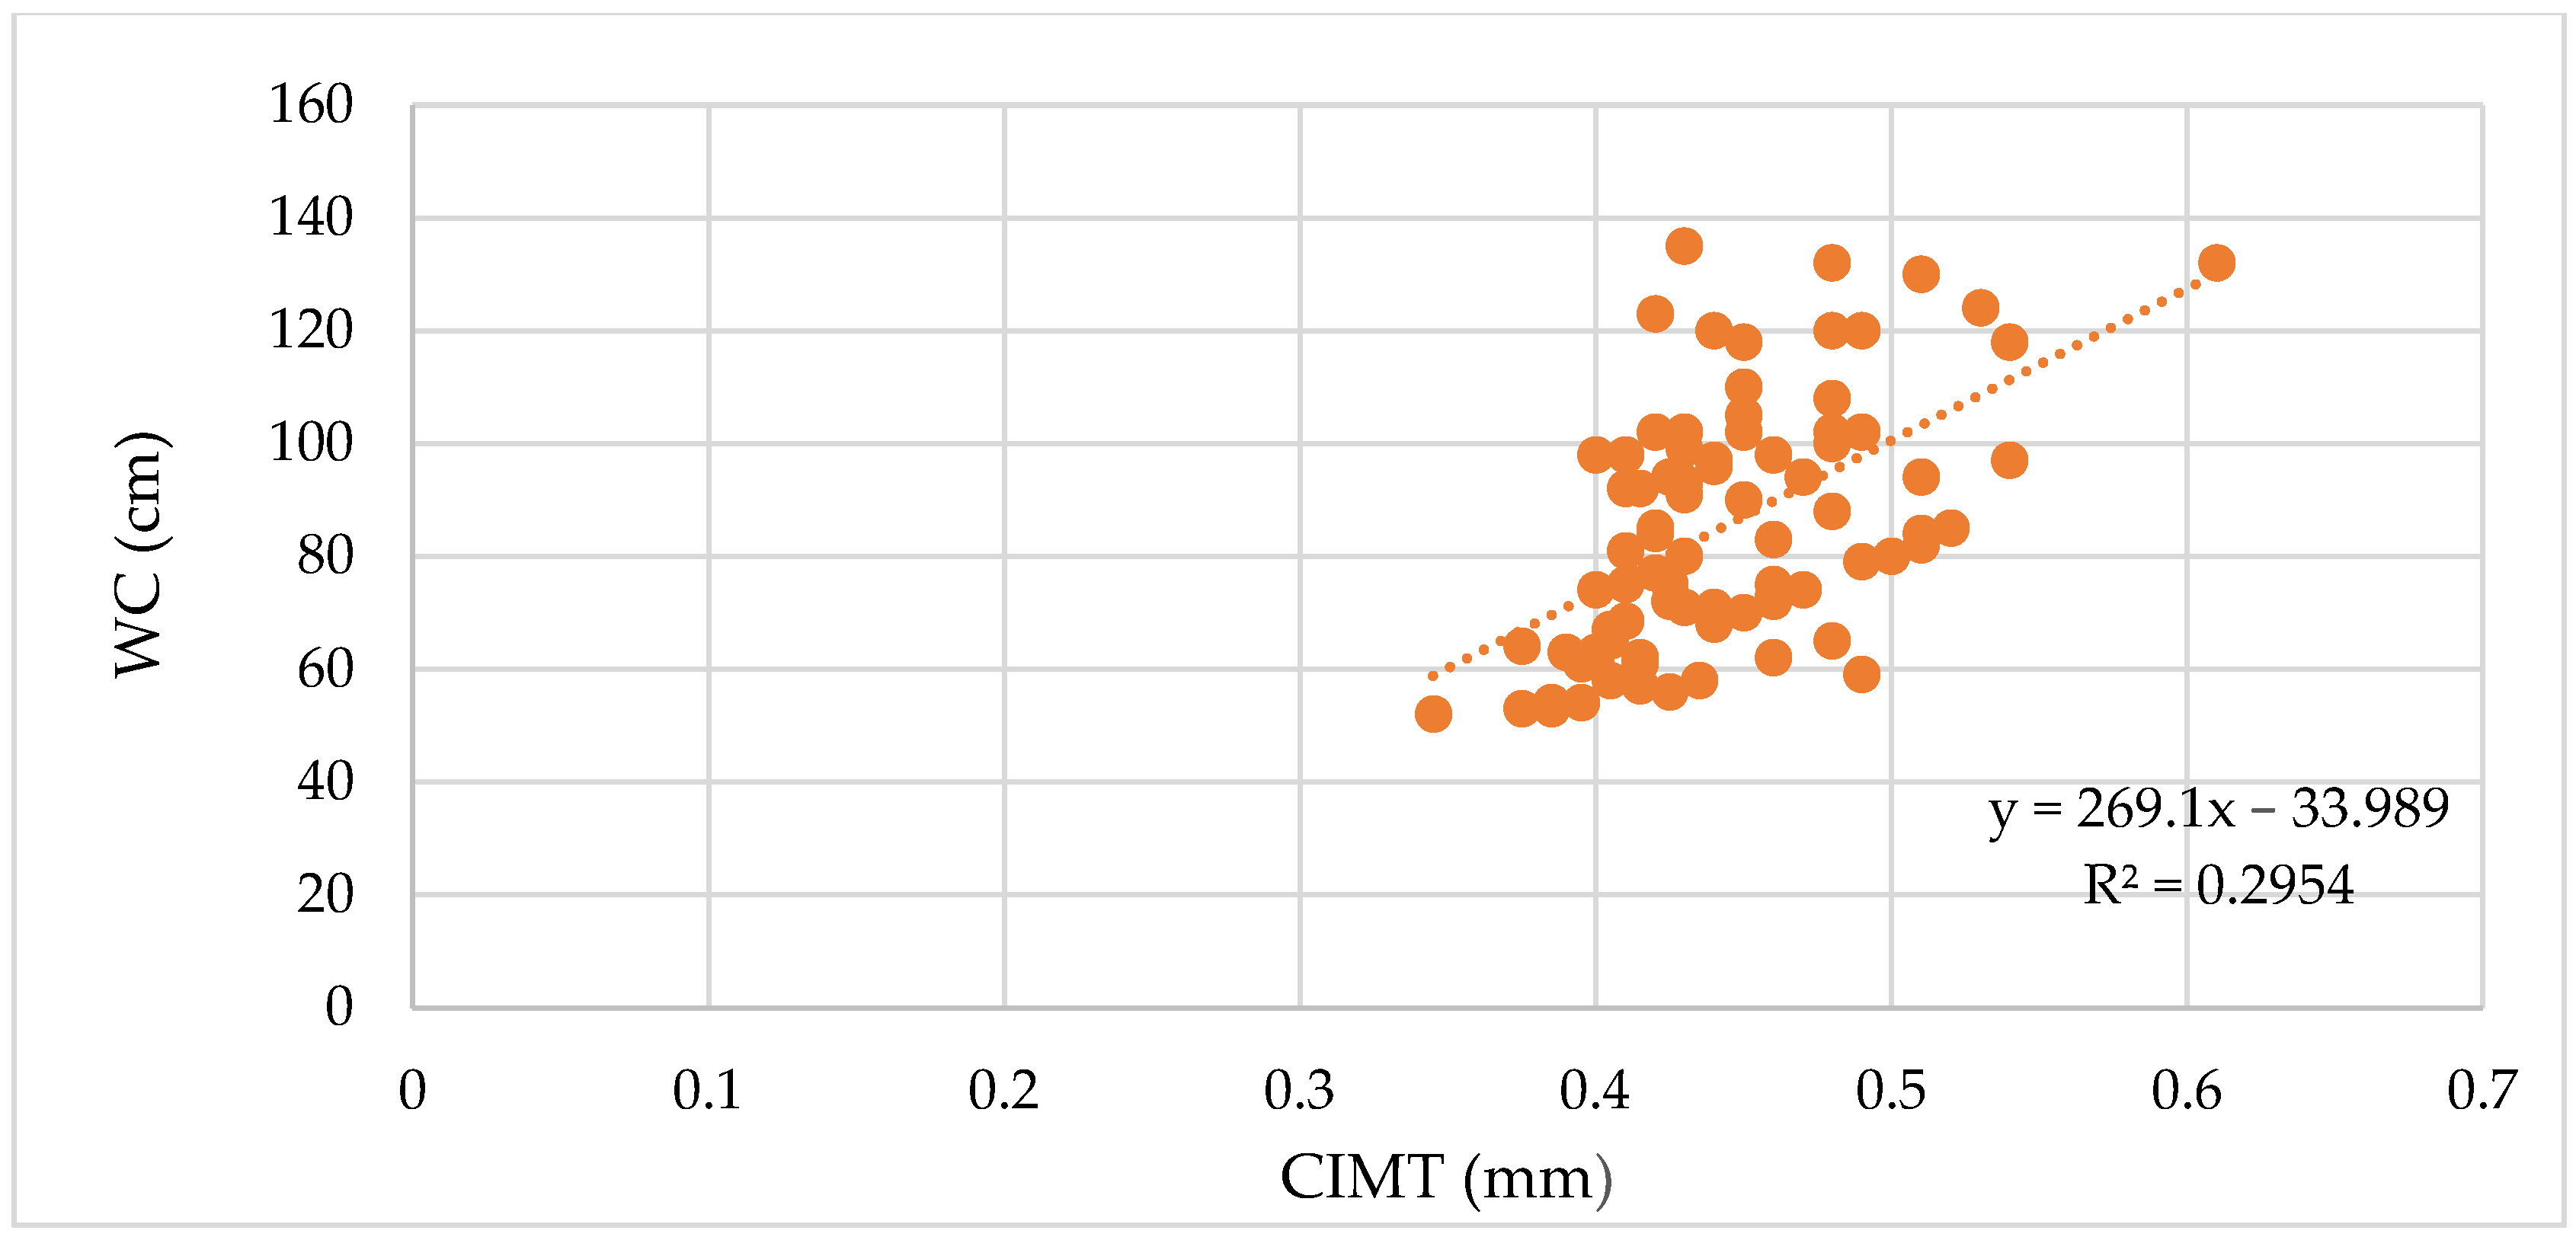
Extremely significant positive correlations were found between the HOMA-IR and the values of vascular markers, as depicted in Table 11 and Figure A7 and Figure A8 (see Appendix A).
Significantly higher values for HOMA-IR were observed in obese pre-pubertal and post-pubertal subjects, compared to their normal-weight peers with the same puberty development (Table 12).
Significant correlations between HOMA-IR values and the vascular biomarkers, according to the aforementioned Tanner stages, were detected in the pre-pubertal and post-pubertal subjects (Table 13).

3.2.2. Acanthosis Nigricans—A Clinical Sign of Insulin Resistance

Out of the 50 obese subjects, 24 (48%) presented the clinical sign of acanthosis nigricans, while none of the normal-weight subjects presented it.
The cut-off value for HOMA-IR for obese pre-pubertal subjects was set to 2.3. Out of the twelve subjects (Tanner 1), five (41.6%) presented HOMA-IR values ≥ 2.3. Out of these subjects, three presented acanthosis nigricans. For the Tanner 1 obese patients who did not present HOMA-IR values higher than the cut-off value (seven subjects), only one presented acanthosis nigricans (Table 14).
The cut-off value for HOMA-IR for obese pubertal and post-pubertal subjects was set to 3.4. Out of the 38 subjects (Tanner 2–5), 39.5% presented a HOMA-IR ≥ 3.4. Out of these subjects, 86.6% presented acanthosis nigricans. Meanwhile, of the obese subjects presenting a HOMA-IR < 3.4, only 30.4% presented acanthosis nigricans. These particular subjects displayed a mean HOMA-IR value of 2.1 (SD = 0.8); see Table 14.
The AUC-ROC analysis made for the vascular parameters, with the presence/absence of acanthosis nigricans being the dichotomous variable, showed an optimal cut-off value for PWV at >4.8 m/s (AUC = 0.77, Se = 75%, and Sp = 80.8%). Also, an SBP value >125 mmHg (AUC = 0.79, Se = 75%, Sp = 84.6%) and a cSBP > 117 mmHg (AUC = 0.8, Se = 70.8%, Sp = 80.8%) are predictive of the presence of acanthosis nigricans. See Table 15.

3.3. The Vascular Biomarkers in Relation to the Menstrual Cycle Regularity

The subgroup of girls associated with Tanner stage 5 was evaluated with regard to their menstrual cycles. According to the regularity of their menses, the obese girls were divided into two subgroups: girls with regular menstrual cycles and girls with irregular ones. No girl included in the normal-weight group reported irregular menses (Table 16).
Although the subgroups are very small (only six subjects in each one), we performed comparison T-Student tests for the vascular biomarkers between the obese girls with regular and irregular menses. The girls who reported irregular menstrual cycles presented significantly higher values for PWV, SBP, DBP, MAP, and cSBP (see Table 17).

3.4. The Vascular Biomarkers in Relation to the Blood Tests

The blood test analysis showed significantly higher values in the obese group for the following markers: LDL-c, TG, GPT, GOT, creatinine, uric acid, and ionized calcium (see Table 18).
The correlation analysis detected multiple significant, moderate, and strong correlations between the evaluated blood tests in the obese group, as depicted in Table 19.
A multilinear regression which included all blood parameters and HOMA-IR as independent variables was performed in order to detect which of them would be significant predictors of the vascular biomarkers. The vascular parameters acted in turn as dependent variables in the model regression. The significant independent predictors of vascular biomarkers are represented in Table 20.

4. Discussion

This research emphasizes early vascular evaluation in children with obesity, a common cardiovascular risk factor. Despite public health efforts, obesity prevalence in children continues to rise, leading to increased cardiovascular issues in young adults. Therefore, pediatric specialists should consider non-invasive vascular biomarkers for improved diagnosis and management of patients at risk. These biomarkers help detect arterial wall changes before any significant narrowing and impairment occur.
This study focuses on two of the three most important non-invasive markers of atherosclerosis: pulse wave analysis and intima-media thickness. The marker that could not be included in this particular study, flow-mediated dilatation, or nitric oxide-mediated dilation, assesses the earliest alterations in endothelial dilatation function [63]. Pulse wave analysis assesses the intermediate stages of atherosclerosis, evaluating both the function and structure of the blood vessels, by estimating the stiffness of the arteries. The CIMT, which evaluates the structural alterations of the arterial wall, measures subclinical atherosclerosis. Measurements of peripheric and central blood pressure levels represent additional valuable vascular biomarkers, which are intricately involved in the progression of atherosclerosis.
Undoubtedly, our opinion that obese children present vascular disruptions earlier than their normal-weight peers accords with that of most researchers. The more severe the excess in weight, the higher the values of all the vascular biomarkers measured; strong, significant positive correlations were detected between each vascular parameter and BMI, WC, and WHR (see Table 5). Although BMI is a widely used tool, in both children and adults, for diagnosis of overweight patients and patients with obesity, it does have a serious limitation in its ability to detect body fat percentage. Discrepancies regarding the detection of obesity in different genders, ages, and races are also worrying. However, using BMI in varying combinations with WC and WHR reliably increases the accuracy of health evaluations [64]. This is the reason why we used all three clinical markers of adiposity in our study, in addition to performing bioimpedance body composition analysis for the obese subjects.
With regard to PWV and BP levels, although many studies [22,23,24,65,66,67], including our own [10,40], have shown increased values in children with excess adiposity, the contradictory results of Jakab et al. must be mentioned, as their study included 6816 children [68]. Nevertheless, our results showed significantly higher mean values for CIMT, PWV, AIx, peripheral and central BP, and central PP in obese children. Bittencourt et al. recently published their results, also obtained through a Mobil-O-Graph device, on 5 to 12-year-old children, proposing PWV > 4.09 m/s and cSBPc >  86.17 mmHg as cut-off values for discriminating between obese and non-obese patients [39]. In contrast, our proposed cut-off values for the entire cohort are PWV > 4.6 m/s, Aix > 31%, SBP > 119 mmHg, MAP > 102.5 mmHg, cSBP > 106 mmHg, cDBP > 76 mmHg, and cPP > 36 mmHg. After the AUROC analysis according to age groups, we propose PWV > 4.6 m/s and cSBP > 106 mmHg for the group age <12 years old, a PWV > 4.5 m/s and cSBP > 115 mmHg for the group age 12 to 15 years old, and PWV > 5 m/s and cSBP > 123 mmHg for the subjects older than 15 years old. Sensibility and specificity values, as well as other significant vascular biomarkers according to age groups, can be observed in Table 9 and Table 10.
In a study similar to ours, Lentferink et al. used a SphygmoCor tonometry device on 62 obese children and adolescents aged from 9 to 19 years old, compared to normal-weight controls, and showed that their average PWV = 4.1 m/s was significantly higher than the PWV of normal-weight subjects [67]. In our study, the mean PWV of the obese group was 4.8 m/s, significantly higher than in controls (p < 0.0001, Figure 4). Furthermore, Lentferik et al. also showed that AIx is significantly higher in obese children with insulin resistance than without [67]. In contrast, we showed that AIx is higher in obese children, with or without insulin resistance (p = 0.03, Figure 5).
A very interesting prospective study on obese adolescents conducted over a 5-year period showed that, although the BMI of the subjects increased similarly in both obese and controls, over the course of 5 years, the PWV increased by 25% in the obese subjects, while only by 3% in the lean ones. Similarly, the DBP levels grew by 23% in the obese, compared to 6% in the controls [69].
Concerning CIMT, cut-off values for the pediatric population are still not standardized, but most studies show that obesity and metabolic syndrome are promoters of an increased CIMT, mainly due to inflammation processes. Farello et al. showed that obese children display higher CIMT regardless of their metabolic status. This team also showed that a higher CIMT in a child with metabolic syndrome represents a significant predictor for cardiovascular events in early adulthood [17]. A very important study on 3497 children aged 6–17 years from five cross-sectional studies conducted on subjects from Brazil, China, Greece, Italy, and Spain showed that CIMT is higher in metabolically healthy obese and overweight children [70]. Our findings confirm the significantly higher values for CIMT among obese children. The results propose a CIMT > 0.4 mm for discriminating obesity in children under 12 years old and >0.46 mm for adolescents (see Table 10).
The fact that obese children and adolescents display higher peripheral BP values than their lean peers is not a novelty. Obesity in children promotes hypertension through adipokines such as leptin, increasing sympathetic nervous system (SNS) activity [71]. SNS activation constricts renal vascular beds and stimulates the renin–angiotensin–aldosterone system (RAAS). Adipocyte-released RAAS hormones and substances exacerbate RAAS, leading to high blood pressure via vasoconstriction and salt/water retention [72,73]. A study on a cohort of 100.000 children showed undoubtedly strong correlations between higher BMI and higher BP values, with the largest increase in BP levels being observed in the children who became obese earliest in life [74]. Moreover, the study showed that, compared to lean age-matched children, obese subjects were two times more likely to develop high BP, while severely obese children were over four times more likely to become hypertensive [71]. Obesity-related hypertension in children remains reversible for a long time [75,76], but its effects are cumulative with all the processes involved in atherosclerosis and metabolic impairment [77]. Our results are in line with previous findings; we showed strong positive correlations between clinical measurements such as BMI, WC, WHR, general fat mass, truncal fat mass, and both peripheral and central BP (Table 5 and Table 8). Measurements of central BP in children are cautiously regarded due to several studies which have suggested that the values obtained by tonometry and oscillometry devices may be underestimated [78,79,80]. Especially in children with risk factors for high BP, obtaining correct measurements is very important. A recent study on 1324 children aged from 6 to 8 years, using a Mobil-O-Graph device, showed that both weight and body fat mass are independently correlated with central BP and cPP levels, and recommended these measurements as valuable screening tools for CV risk assessment [81]. In a study involving 348 subjects aged from 8 to 18 years, severe obesity was associated with significantly higher central BP levels, compared to less critical weight excess [78].
As mentioned earlier, an important aspect of screening for obese patients at higher risk of developing metabolic and cardiovascular disorders is the assessment of abdominal adiposity. Measuring the waist circumference and calculating the waist-to-height ratio are crucial parts of the physical examination of obese children and should not be overlooked. Waist circumference, an acknowledged marker of insulin resistance [82], presented, in our study, a strong correlation with the truncal fat mass measured by body composition analysis through electrical impedance (ρ = 0.78, p < 0.0001). It is not only strongly correlated with HOMA-IR (ρ = 0.69, p < 0.0001), but also with every single vascular biomarker assessing atherosclerosis and arterial stiffness that has been included in the study (Table 5). WHR is considered a more sensible central adiposity marker, one less dependent on age than WC, with a cut-off value of 0.5 being validated for children ≥ 6 years old and adults [83,84], and a cut-off of 0.6 placing the child at risk for metabolic syndrome [48]. It is an anthropometric marker very reliably associated with visceral adiposity, being a better predictor of body fat percentage than are BMI and WC [85]. A cross-sectional study including 14.493 children aged from 5 to 18 years old showed that a rise in WHR was substantially linked with an increase in cardio-metabolic risk in overweight and obese participants: of obese children with a WHR ≥ 0.6, 32% had metabolic syndrome, 26% had raised non-HDL-c levels, 18% had elevated C-reactive protein levels, and 69% had elevated HOMA-IR values [86]. Our results showed strong correlations between WHR and HOMA-IR (ρ = 0.51, p < 0.0001), as well as with all the vascular biomarkers, except for DBP (Table 5). Both WC and WHR were shown to be independent predictors of peripheral and central BP levels (Table 7).
In normal-weight children and adolescents, CIMT is not influenced by sex or age [87], but in adults, men display higher CIMT than women [88]. PWV and central BP are more elevated in healthy prepubescent girls than in prepubescent boys, but once puberty is completed, boys present higher markers than girls [89]. These differences in PWV between the sexes in healthy children and young individuals are attributed to the protective roles of estrogen and progesterone [90]. Moreover, it seems that the fluctuation of hormones during the phases of the menstrual cycle has a particular role regarding arterial stiffness [91,92], and that the lower BP levels during the luteal phase could be one of the causes [90]. Although testosterone is a predictor of arterial stiffness in both males [90] and females [93], recent studies have recognized its positive effect on arterial elasticity [94] and reactivity [95] in men. These differences in arterial stiffness are seen in healthy, lean individuals. The pro-inflammatory activity of excess adipose tissue seems to partially erase the physiological influence of sex hormones, as obese children present both hormonal alterations and metabolic impairments [67]. Our study detected significantly higher CIMT in boys (p = 0.01) when assessing all boys versus all girls, but no difference when comparing only obese boys versus obese girls. No differences among the rest of the vascular biomarkers were attributed to sex.
The lifelong atherosclerotic processes commence in early childhood,, as influenced by genetics and environment [96]. Age-related arterial stiffness is caused by collagen changes and reduced endothelial elastin [97]. Excess adiposity accelerates these processes. In children, age does not seem to be such a relevant factor in either the values of CIMT or PWV, as the inflammatory atherosclerotic processes caused by excessive weight affect the endothelial wall far more than age [9,40,98]. Our results showed significantly higher values for CIMT in children aged from 12 to 15 years than in those <12 years old (p = 0.02) and higher PWV and cSBP levels in > 15-year-olds compared to <12-year-olds (p = 0.01, and p = 0.02, respectively). No differences were detected across groups for the rest of the vascular biomarkers (Table 2). We can make a case, therefore, for affirming that older obese children present higher CIMT, PWV, and cSBP levels than do younger ones. However, in such young, obese individuals, age has a smaller impact on the arterial walls, which, in any case, is very difficult to estimate and separate from the processes caused by puberty in the presence of obesity [99,100,101].
Puberty itself does not cause atherosclerosis or arterial stiffness [67]. During puberty, the body is significantly less insulin sensitive due to hormonal and metabolic changes [102]. However, there is sufficient proof that children who start puberty being obese remain insulin-resistant post-puberty as well [102]. Our study has detected significantly higher HOMA-IR in obese pre- and post-pubertal subjects compared to their lean peers having the same Tanner stage, but not a significant difference between pubertal subjects of the two groups (Table 12). This goes to show that insulin resistance affects pubertal lean subjects as well. Contrary to our previous work, this study has shown significant differences between pre-pubertal, pubertal, and post-pubertal obese children with regard to the studied vascular biomarkers. We detected significantly higher values in post-pubertal children compared to pre-pubertal ones. Mostly, mean values for pre-pubertal children were significantly lower than in those who had started or finished puberty (Table 3). However, Tanner stages were not observed as independent predictors of CIMT, PWV, and AIx, but only of central BP values (Table 7). Excess androgens in obese girls could cause an accelerated atherosclerotic process, one resulting in higher CIMT and arterial stiffness [93], and this could also account for the differences between pre- and post-pubertal children.
In this study, we managed to focus our attention on the effect of insulin resistance on vascular biomarkers. The insulin resistance associated with obesity represents the greatest risk factor for developing type 2 diabetes and cardiovascular disorders in adulthood [103]. Insulin resistance reduces insulin’s ability to regulate glucose in muscles, adipose cells, and the liver [104]. It affects protein and lipid metabolism, endothelial function, and gene expression [104]. Increased acetyl-coenzyme-A production in the liver leads to adipose tissue inflammation [103]. Excessive fatty acids contribute to insulin resistance in obese children [103]. While euglycemic clamp and minimal-model tests are gold standards, they are invasive and used mainly in research [105]. The oral glucose tolerance test (OGTT) is reliable but time-consuming and less reproducible [106,107]. HOMA-IR is an easy and reliable biomarker for obese children, despite being more expensive than fasting glucose or hemoglobin A1c [105]. Insulin resistance varies based on puberty, race, sex, genetics, and environment [104], requiring adjusted HOMA-IR cut-offs. In our study, we used the cut-off values of HOMA-IR proposed in studies made with Caucasian subjects of similar ages to our subjects [61,62]. Our results not only point out the important association between HOMA-IR and weight excess (significant correlations with BMI, WC, and WHR) but also show extremely significant correlations to all vascular biomarkers (Table 11, Figure A7 and Figure A8). We also analyzed the correlation between HOMA-IR and the vascular biomarkers in subjects divided into puberty development stages; we detected significant correlations in the case of pre- and post-pubertal children, but not in the pubertal ones, most likely due to the relative insulin-resistant status of lean pubertal subjects (Table 13). Furthermore, HOMA-IR is an independent predictor for PWV, AIx, SBP, DBP, cSBP, and cDBP, as shown by the regression analysis depicted in Table 20.
We also looked at one of the clinical signs recognized to be a reliable sign of insulin resistance, acanthosis nigricans. HOMA-IR correlates reliably, but not perfectly, with the presence of acanthosis nigricans. The more severe the obesity and the higher the HOMA-IR, the more likely the presence of acanthosis nigricans [108,109,110,111]. In our study, 48% of the obese subjects displayed acanthosis nigricans. We evaluated the association between HOMA-IR and acanthosis nigricans according to Tanner stages, in order to improve the accuracy of our analysis. For pre-pubertal obese subjects, using a HOMA-IR cut-off value of 2.3 [61], out of the five children with a HOMA-IR ≥ 2.3, three presented acanthosis nigricans, while for those with a HOMA-IR < 2.3, out of seven subjects, only one presented acanthosis nigricans. Meanwhile, for pubertal and post-pubertal subjects, almost 40% presented a HOMA-IR above the set cut-off value of 3.4 [62]. Thirteen out of fifteen subjects with HOMA-IR ≥ 3.4 presented acanthosis nigricans. (See Table 14.) Further on, we looked at the possibility of predicting the presence of acanthosis nigricans by evaluating the vascular biomarkers. The AUC-ROC analysis showed optimal cut-off values for PWV at >4.8 m/s, SBP value > 125 mmHg, and a cSBP > 117 mmHg as predictive of the presence of acanthosis nigricans. (See Table 15.) CIMT has been shown to present significantly larger values in individuals with acanthosis nigricans [112]. Severe-grade acanthosis nigricans associates a larger PWV, but significance drops when adjusting for age, ethnic group, and BMI, which is the result of a study that suggests caution when interpreting the relevance of acanthosis nigricans for cardiovascular risk [113]. Our opinion is that obese children with acanthosis nigricans should be screened for metabolic and vascular alterations.
Given the intricate associations between insulin resistance, obesity-related hormonal alterations, and puberty itself, we analyzed the post-pubertal girls with regard to the possible menstrual cycle irregularities (a sign of PCOS) that can possibly be associated with increased atherosclerosis and arterial stiffness. It is not clear to what degree each of these pathological mechanisms contributes to vascular damage. PCOS is characterized by non-ovulatory menstrual cycles, hyperandrogenism, and insulin resistance. A recent study showed that individuals with PCOS displayed significantly larger CIMT compared to healthy controls of the same BMI and the same frequency of smoking. Moreover, a PCOS diagnosis was considered the strongest predictor of CIMT, even after adjusting for BMI, age, and smoking [114]. A study on obese adolescents with PCOS showed higher CIMT and lower arterial compliance in the PCOS group, as compared to obese girls [115]. Obese adolescents with PCOS who are also normotensive display higher carotid stiffness, and even left ventricular remodeling, which are both attributed to insulin resistance [116]. In contrast, another study suggests that the greater arterial stiffness in obese girls with PCOS is actually attributed to their central obesity, rather than to PCOS [117]. In our study, we identified twelve obese adolescents, six of whom had irregular menses. Our results showed that obese girls with irregular menses displayed significantly higher PWV, SBP, and DPB levels, but not higher CIMT or central BP levels (Table 15). These girls also presented higher HOMA-IR (mean value of 4.8), BMI, WC, and WHR, as well as a higher prevalence of acanthosis nigricans (Table 16). Further evaluations are, of course, needed, as a proper analysis needs far more subjects than ours had.
The results of the blood tests analysis included in this study strengthen our previous findings and complement them with new data. Of the significant differences in blood parameters between obese and controls, we have mentioned the higher LDL-c, TG, GPT, GOT, creatinine, uric acid, and lower ionized calcium detected in obese children (Table 18). Uric acid, a catabolic metabolite, is elevated in children with obesity, as a consequence of increased dietary intake of purines and due to the impaired glycolytic pathway, which results in accumulation of substrate for uric acid and the alterations of uric acid renal excretion, both caused by insulin resistance [118]. Uric acid in children with obesity is related to body composition, and its serum levels are lowered by weight loss [119]. Recent studies suggest that uric acid may serve as a target in the therapy of type 2 diabetes, due to the fact that elevated uric acid levels may be interpreted as a marker of risk for developing type 2 diabetes [120,121]. Our results show that serum uric acid is not only strongly correlated with PWV and peripheral and central BP levels (Table 19), but is an independent predictor of CIMT, PWV, SBP, and cPP (Table 20). These results are in line with other recent publications which have shown that the relation between uric acid and vascular stiffness in children is mediated by insulin resistance and BP levels [122], and that there is an association between high levels of uric acid and carotid atherosclerosis [123].
Having discussed the rest of the other serum parameters in our previous work [9,10], we will only reiterate the significant results, which strengthen our previous claims. LDL-c, probably the biggest contributor to atherosclerotic plaque [124], correlates with CIMT, and with arterial stiffness markers as well. HDL-c, an anti-inflammatory, protective lipoprotein [125] displaying low values in sedentary obese children [124], presented significant negative correlations with central BP levels in the present study. Non-HDL-c, a marker of atherosclerosis as reliable as LDL-c is [126], correlated significantly with PWV. High TG levels, a marker of metabolic syndrome caused by a chaotic and unhealthy lifestyle and diet and an important parameter for evaluating one’s cardiovascular risk [127], showed significant correlations, not only with PWV but with both peripheral and central systolic BP. The lipid ratios, LDL-c/HDL-c ratio, TG/HDL-c ratio, and TC/HDL-c ratio are reliable indicators of metabolic distress, as well as of dysglicemic and cardiovascular risk [128,129,130,131]. Although, in this study, we did not observe significant mean differences between the lipid ratios of obese vs. normal-weight children, in our previous work, we showed significant associations between the TG/HDL-c ratio and TC/HDL-c ratio, respectively, as well as the markers of arterial stiffness [10]. The only significant correlations the present study has detected with regard to lipid ratios was for the LDL-c/HDL-c ratio, which positively correlated with DBP and cDBP values (Table 19). The LDL-c/HDL-c ratio represents a predictor of cardiovascular risk, and can even be used in predicting glycemic control in patients with type 2 diabetes mellitus [131]. Efficiently managing the dyslipidemic lipid values in adolescence helps decrease the risk of high CIMT in young adulthood, because dyslipidemia secondary to obesity at adolescent age increases the risk of a higher CIMT as young adults, compared to adolescents who do not present both risk factors [132].
Elevated transaminase levels are very significant to vascular health [10,133]. This study showed that GPT correlates to CIMT, PWV, and central and peripheral systolic BP levels. GOT was correlated only with peripheral BP levels.
25-OH vitamin D has been shown to interact with vascular vitamin D receptors of the endothelium, decreasing the proliferation of smooth cell muscles, and thus providing a cardiovascular protective role [134]. In obese children, vitamin D levels are usually low [135], and correcting their blood levels was proven to improve insulin sensitivity and lower BP levels [136]. Both 25-OH vitamin D and ionized calcium serum levels negatively correlated with PWV and peripheral and central BP levels in this study (Table 19). The lower ionized calcium levels are most likely associated with low vitamin D levels and the children’s unbalanced diet.
The multilinear regression model detected GPT as a significant predictor of PWV, SBP, and cSBP, TC/HDL-c as a predictor of cDBP, and TG as a predictor of cPP. These results show that there is an intricate connection between the serum tests that are taken by clinicians on a daily basis and the vascular biomarkers which announce the deterioration of vascular health; hence, these correlations should determine clinicians’ practices to more properly detect patients at risk and to further investigate them more efficiently.
The key strength of this study is that the findings confirm the initial premise that obese children present detectable vascular disruption, although being almost completely asymptomatic. The highlight of our work is that we managed to integrate CIMT, a marker of subclinical atherosclerosis, and PWV, a marker of arterial stiffness, as well as peripheral and central BP levels, and not only analyze them all in multiple contexts but also propose cut-off values. To our knowledge, this makes our research unique, as other scientific papers on the subject have focused either on CIMT, or on arterial stiffness surrogate markers in the case of obese children. We were also successful in showing the importance of evaluating the insulin resistance status, by both clinical and laboratory methods, in painting a more accurate picture of an obese child’s cardiovascular risk. We showed that the insulin resistance status represents a crucial factor in the progression of vascular damage. We consider that failing to perform the flow-mediated dilation and liver elastography measurements are the greatest limitations of this study, but we plan on integrating these techniques in our future research. The number of subjects involved in the study could have been larger, but, according to our pre-statistical estimations, the ratios were sufficient to provide statistical significance.

5. Conclusions

Excess weight in children represents a promoter of arterial stiffness and subclinical atherosclerosis starting at young ages, progressively aggravating the vascular disruptions and increasing the risk of developing cardiovascular disorders earlier in their adult life.
Waist circumference and waist-to-height ratio are crucial clinical markers, strongly correlated with CIMT, PWV, AIx, peripheral and central BP, and HOMA-IR.
Insulin-resistant obese children present increased arterial stiffness and subclinical atherosclerosis. HOMA-IR is an independent predictor of all the vascular biomarkers analyzed, except for CIMT. Acanthosis nigricans is a significant marker of vascular damage associated with insulin resistance; hence, the vascular health of the children displaying it should be more extensively investigated.
Increased levels of uric acid, LDL-c, non-LDL-c, TG, GOP, and GPT, and low levels of HDL-c and 25-OH vitamin D should enable clinicians to more accurately identify patients at risk and to further explore their vascular health.
We conclude that CIMT and the markers of arterial stiffness are non-invasive vascular biomarkers that could significantly elevate any clinician’s work with obese children. Providing a better understanding of how these patients develop irreversible cardiovascular damage, and at a time when these alterations are completely preventable, is an endeavor worth undertaking. Therefore, future prospective research is planned for these patients in order to detect how weight loss or progressive weight gain affect these vascular biomarkers.

Author Contributions

Conceptualization, D.S. and M.S.M.; methodology, D.S., M.S.M., and I.M.; software, A.B. and C.M.R.; validation, D.S., C.P., and O.-A.V.-B.; formal analysis, M.S.M. and I.M.; investigation, M.S.M. and C.P.; resources, C.P., A.B., and D.S.; data curation, O.-A.V.-B.; writing—original draft preparation, M.S.M.; writing—review and editing, D.S. and C.P.; visualization, A.B. and C.M.R.; supervision, D.S.; project administration, I.M. and C.P. All authors have read and agreed to the published version of the manuscript.

Funding

This research received no external funding.

Institutional Review Board Statement

Ethical review and approval for this study was conducted and conferred by the Ethics Committee of Scientific Research of the University of Medicine and Pharmacy Victor Babes Timisoara (No. 03/19.01.2021).

Informed Consent Statement

The legal guardians of all underage subjects and all 18-year-old subjects signed informed consent before participating in the study. Written consent for publication of this paper has been obtained from all participants.

Data Availability Statement

Only the corresponding author may provide access to the data reported in this study. Due to privacy limitations, the data are not publicly accessible.

Acknowledgments

We thank all of the authors for their fruitful contributions and our affiliated centers for their assistance in making this study possible. We would like to thank all of the participants in our study for their cooperation and wish them all good health.

Conflicts of Interest

The authors declare no conflict of interest.

Abbreviations

AIxIndex of augmentation
AUCArea under the receiver operating characteristic curve
BMIBody mass index
BPBlood pressure
cDBPCentral diastolic blood pressure
CIMTCarotid intima-media thickness
cPPCentral pulse pressure
cSBPCentral systolic blood pressure
DBPDiastolic blood pressure
GOTAspartate aminotransferase
GPTAlanine aminotransferase
HHeight
HDL-cHigh-density lipoprotein cholesterol
HOMA-IRHomeostatic model assessment for insulin resistance
HRHeart rate
LDL-cLow-density lipoprotein cholesterol
MAPMean arterial pressure
nNumber of subjects
PCOSPolycystic ovary syndrome
PWVPulse wave velocity
ROCReceiver operating characteristic
SBPSystolic blood pressure
SDStandard deviation
SeSensitivity
SpSpecificity
Std.Standard
TCTotal cholesterol
TGTriglycerides
vs.Versus
WWeight
WCWaist circumference
WHRWaist-to-height ratio
yYears

Appendix A

Figure A1. Example of a Body Composition Analysis report for an 11-year-old boy.
Biomedicines 11 01841 g0a1
Figure A2. Example of a CIMT measurement for a 12-year-old obese girl (from authors’ collection).
Biomedicines 11 01841 g0a2
Figure A3. ROC curve for CIMT measurements (CIMT ROC curve is represented in blue).
Biomedicines 11 01841 g0a3
Figure A4. ROC curves for PWV and AIx.
Biomedicines 11 01841 g0a4
Figure A5. ROC curves for SBP, DBP, and MAP (the red dashed line is the line of equality, otherwise known as the random chance line).
Biomedicines 11 01841 g0a5
Figure A6. ROC curves for cSBP, cDBP, and cPP (the red dashed line is the line of equality, otherwise known as the random chance line).
Biomedicines 11 01841 g0a6
Figure A7. Correlation between HOMA-IR values and CIMT (ρ = 44, p < 0.0001).
Biomedicines 11 01841 g0a7
Figure A8. Correlation between HOMA-IR values and PWV (ρ = 64, p < 0.0001).
Biomedicines 11 01841 g0a8

References

  1. WHO European Regional Obesity Report 2022. Copenhagen: WHO Regional Office for Europe; 2022. Licence: CC BY-NC-SA 3.0 IGO. Available online: https://apps.who.int/iris/bitstream/handle/10665/353747/9789289057738-eng.pdf (accessed on 6 March 2023).
  2. Report on the Fifth Round of Data Collection, 2018–2020: WHO European Childhood Obesity Surveillance Initiative (COSI). Copenhagen: WHO Regional Office for Europe; 2022. Licence: CC BY-NC-SA 3.0 IGO. Available online: https://apps.who.int/iris/rest/bitstreams/1476879/retrieve (accessed on 6 March 2023).
  3. Stierman, B.; Afful, J.; Carroll, M.D.; Chen, T.-C.; Davy, O.; Fink, S.; Fryar, C.D.; Gu, Q.; Hales, C.M.; Hughes, J.P.; et al. National Health and Nutrition Examination Survey 2017–March 2020 Prepandemic Data Files Development of Files and Prevalence Estimates for Selected Health Outcomes. Natl. Health Stat. Rep. 2021. NHSR No. 158. Available online: https://stacks.cdc.gov/view/cdc/106273 (accessed on 6 March 2023).
  4. Lange, S.J.; Kompaniyets, L.; Freedman, D.S.; Kraus, E.M.; Porter, R.; Blanck, H.M. Longitudinal Trends in Body Mass Index Before and During the COVID-19 Pandemic Among Persons Aged 2–19 Years—United States, 2018–2020. MMWR Morb. Mortal. Wkly. Rep. 2021, 70, 1278–1283. [Google Scholar] [CrossRef] [PubMed]
  5. Woolford, S.J.; Sidell, M.; Li, X.; Else, V.; Young, D.; Resnicow, K.; Koebnick, C. Changes in Body Mass Index Among Children and Adolescents During the COVID-19 Pandemic. JAMA 2021, 326, 1434–1436. [Google Scholar] [CrossRef] [PubMed]
  6. Balasundaram, P.; Krishna, S. Obesity Effects on Child Health. In StatPearls [Internet]; StatPearls Publishing: Treasure Island, FL, USA, 2022. Available online: https://www.ncbi.nlm.nih.gov/books/NBK570613/ (accessed on 6 March 2023).
  7. Zieske, A.W.; Malcom, G.T.; Strong, J.P. Natural history and risk factors of atherosclerosis in children and youth: The PDAY study. Pediatr. Pathol. Mol. Med. 2002, 21, 213–237. [Google Scholar] [CrossRef] [PubMed]
  8. Abraham, T.M.; Pedley, A.; Massaro, J.M.; Hoffmann, U.; Fox, C.S. Association between visceral and subcutaneous adipose depots and incident cardiovascular disease risk factors. Circulation 2015, 132, 1639–1647. [Google Scholar] [CrossRef] [PubMed] [Green Version]
  9. Mihuta, M.-S.; Paul, C.; Ciulpan, A.; Dacca, F.; Velea, I.P.; Mozos, I.; Stoian, D. Subclinical Atherosclerosis Progression in Obese Children with Relevant Cardiometabolic Risk Factors Can Be Assessed through Carotid Intima Media Thickness. Appl. Sci. 2021, 11, 10721. [Google Scholar] [CrossRef]
  10. Mihuta, M.S.; Stoian, D.; Borlea, A.; Roi, C.M.; Velea-Barta, O.-A.; Mozos, I.; Paul, C. Evaluating the Arterial Stiffness as a Useful Tool in the Management of Obese Children. Children 2023, 10, 183. [Google Scholar] [CrossRef]
  11. Nikiforov, N.G.; Zlenko, D.V.; Orekhova, V.A.; Melnichenko, A.A.; Orekhov, A.N. Local Accumulation of Lymphocytes in the Intima of Human Aorta Is Associated with Giant Multinucleated Endothelial Cells: Possible Explanation for Mosaicism of Atherosclerosis. Int. J. Mol. Sci. 2022, 23, 1059. [Google Scholar] [CrossRef]
  12. Yasin, J.; Sharma, C.; Hashim, M.J.; Al Hamed, S.; AlKaabi, J.; Aburawi, E.H. Cross-Sectional Association Between Body Fat Composition and Biomarkers of Inflammation and Endothelial Dysfunction in Children with Overweight/Obesity. Diabetes. Metab. Syndr. Obes. 2023, 16, 483–493. [Google Scholar] [CrossRef]
  13. Zieman, S.J.; Melenovsky, V.; Kass, D.A. Mechanisms, pathophysiology, and therapy of arterial stiffness. Arterioscler. Thromb. Vasc. Biol. 2005, 25, 932–943. [Google Scholar] [CrossRef] [Green Version]
  14. Tounian, P.; Aggoun, Y.; Dubern, B.; Varille, V.; Guy-Grand, B.; Sidi, D.; Girardet, J.P.; Bonnet, D. Presence of increased stiffness of the common carotid artery and endothelial dysfunction in severely obese children: A prospective study. Lancet 2001, 358, 1400–1404. [Google Scholar] [CrossRef]
  15. Bots, M.L.; Hofman, A.; De Jong, P.T.; Grobbee, D.E. Common carotid intima-media thickness as an indicator of atherosclerosis at other sites of the carotid artery. The Rotterdam Study. Ann. Epidemiol. 1996, 6, 147–153. [Google Scholar] [CrossRef] [PubMed] [Green Version]
  16. Beauloye, V.; Zech, F.; Tran, H.T.; Clapuyt, P.; Maes, M.; Brichard, S.M. Determinants of early atherosclerosis in obese children and adolescents. J. Clin. Endocrinol. Metab. 2007, 92, 3025–3032. [Google Scholar] [CrossRef] [PubMed] [Green Version]
  17. Farello, G.; Antenucci, A.; Stagi, S.; Mazzocchetti, C.; Ciocca, F.; Verrotti, A. Metabolically healthy and metabolically unhealthyobese children both have increased carotid intima-media thickness: A case control study. BMC Cardiovasc. Disord. 2018, 18, 1–6. [Google Scholar] [CrossRef] [Green Version]
  18. Simmonds, M.; Llewellyn, A.; Owen, C.G.; Woolacott, N. Predicting adult obesity from childhood obesity: A systematic reviewand meta-analysis. Obes. Rev. 2016, 17, 95–107. [Google Scholar] [CrossRef] [Green Version]
  19. Reusz, G.S.; Cseprekal, O.; Temmar, M.; Kis, E.; Cherif, A.B.; Thaleb, A.; Fekete, A.; Szabó, A.J.; Benetos, A.; Salvi, P. Reference values of pulse wave velocity in healthy children and teenagers. Hypertension 2010, 56, 217–224. [Google Scholar] [CrossRef] [PubMed] [Green Version]
  20. Berenson, G.S.; Srinivasan, S.R.; Bao, W.; Newman, W.P., 3rd; Tracy, R.E.; Wattigney, W.A. Association between multiple cardiovascular risk factors and atherosclerosis in children and young adults. The Bogalusa Heart Study. N. Engl. J. Med. 1998, 338, 1650–1656. [Google Scholar] [CrossRef]
  21. Sakuragi, S.; Abhayaratna, K.; Gravenmaker, K.J.; O’Reilly, C.; Srikusalanukul, W.; Budge, M.M.; Telford, R.D.; Abhayaratna, W.P. Influence of adiposity and physical activity on arterial stiffness in healthy children: The lifestyle of our kids study. Hypertens 2009, 53, 611–616. [Google Scholar] [CrossRef] [PubMed] [Green Version]
  22. Kulsum-Mecci, N.; Goss, C.; Kozel, B.A.; Garbutt, J.M.; Schechtman, K.B.; Dharnidharka, V.R. Effects of Obesity and Hypertension on Pulse Wave Velocity in Children. J. Clin. Hypertens. 2017, 19, 221–226. [Google Scholar] [CrossRef] [Green Version]
  23. Herouvi, D.; Karanasios, E.; Karayianni, C.; Karavanaki, K. Cardiovascular disease in childhood: The role of obesity. Eur. J. Pediatr. 2013, 172, 721–732. [Google Scholar] [CrossRef]
  24. Wilenius, M.; Tikkakoski, A.J.; Tahvanainen, A.M.; Haring, A.; Koskela, J.; Huhtala, H.; Kähönen, M.; Kööbi, T.; Mustonen, J.T.; Pörsti, I.H. Central wave reflection is associated with peripheral arterial resistance in addition to arterial stiffness in subjects without antihypertensive medication. BMC Cardiovasc. Disord. 2016, 16, 131. [Google Scholar] [CrossRef] [Green Version]
  25. Močnik, M.; Nikolić, S.; Varda, N.M. Arterial Compliance Measurement in Overweight and Hypertensive Children. Indian J. Pediatr. 2016, 83, 510–516. [Google Scholar] [CrossRef] [PubMed]
  26. Shimizu, M.; Kario, K. Review: Role of the augmentation index in hypertension. TACA 2008, 2, 25–35. [Google Scholar] [CrossRef] [PubMed] [Green Version]
  27. Hughes, A.D.; Park, C.; Davies, J.; Francis, D.; Thom, S.A.M.G.; Mayet, J.; Parker, K.H. Limitations of augmentation index in the assessment of wave reflection in normotensive healthy individuals. PLoS ONE 2013, 8, e59371. [Google Scholar] [CrossRef] [PubMed] [Green Version]
  28. Qi, Z.; Ding, S. Obesity-associated sympathetic overactivity in children and adolescents: The role of catecholamine resistance in lipid metabolism. J. Pediatr. Endocrinol. Metab. 2016, 29, 113–125. [Google Scholar] [CrossRef]
  29. Mihuta, M.S.; Paul, C.; Borlea, A.; Cepeha, C.M.; Velea, I.P.; Mozos, I.; Stoian, D. The Oscillometric Pulse Wave Analysis Is Useful in Evaluating the Arterial Stiffness of Obese Children with Relevant Cardiometabolic Risks. J. Clin. Med. 2022, 11, 5078. [Google Scholar] [CrossRef]
  30. Reilly, J.; Kelly, J. Long-term impact of overweight and obesity in childhood and adolescence on morbidity and premature mortality in adulthood: Systematic review. Int. J. Obes. 2011, 35, 891–898. [Google Scholar] [CrossRef] [Green Version]
  31. Neuhauser, H.K.; Büschges, J.; Schaffrath Rosario, A.; Anja Schienkiewitz, A.; Sarganas, G.; Königstein, K.; Schweizer, D.; Schmidt-Trucksäss, A. Carotid Intima-Media Thickness Percentiles in Adolescence and Young Adulthood and Their Association with Obesity and Hypertensive Blood Pressure in a Population Cohort. Hypertens 2022, 79, 1167–1176. [Google Scholar] [CrossRef]
  32. Urbina, E.M.; Khoury, P.R.; McCoy, C.; Daniels, S.R.; Kimball, T.R.; Dolan, L.M. Cardiac and vascular consequences of prehypertension in youth. J. Clin. Hypertens. 2011, 13, 332–342. [Google Scholar] [CrossRef] [Green Version]
  33. Urbina, E.M.; Kimball, T.R.; Khoury, P.R.; Daniels, S.R.; Dolan, L.M. Increased arterial stiffness is found in adolescents with obesity or obesity-related type 2 diabetes mellitus. J. Hypertens. 2010, 28, 1692–1698. [Google Scholar] [CrossRef] [Green Version]
  34. McEniery, C.M.; Cockcroft, J.R.; Roman, M.J.; Franklin, S.S.; Wilkinson, I.B. Central blood pressure: Current evidence and clinical importance. Eur. Heart J. 2014, 35, 1719–1725. [Google Scholar] [CrossRef] [Green Version]
  35. Roman, M.J.; Devereux, R.B.; Kizer, J.R.; Lee, E.T.; Galloway, J.M.; Ali, T.; Umans, J.G.; Howard, B.V. Central pressure more strongly relates to vascular disease and outcome than does brachial pressure: The strong heart study. Hypertens 2007, 50, 197–203. [Google Scholar] [CrossRef] [PubMed] [Green Version]
  36. Pichler, G.; Martinez, F.; Vicente, A.; Solaz, E.; Calaforra, O.; Lurbe, E.; Redon, J. Influence of obesity in central blood pressure. J. Hypertens. 2015, 33, 308–313. [Google Scholar] [CrossRef] [PubMed]
  37. Muntner, P.; He, J.; Cutler, J.A.; Wildman, R.P.; Whelton, P.K. Trends in blood pressure among children and adolescents. JAMA 2004, 291, 2107–2113. [Google Scholar] [CrossRef] [PubMed] [Green Version]
  38. Brion, M.A.; Ness, A.R.; Davey Smith, G.; Leary, S.D. Association between body composition and blood pressure in a contemporary cohort of 9-year-old children. J. Hum. Hypertens. 2007, 21, 283–290. [Google Scholar] [CrossRef] [Green Version]
  39. Bittencourt, J.C.; Scheinbein, G.H.A.; de Oliveira Junior, W.C.; Bassi, R.L.; Moura, L.B.; Correa, A.L.D.; de Lima Bernardes, R.G.; Freitas, L.S.; Lemos, J.C.; Gonçalves, G.K.N.; et al. Arterial stiffness indices, pulse wave velocity and central systolic blood pressure, are able to discriminate between obese and non-obese children. Eur. J. Pediatr. 2023, 21, 1–13. [Google Scholar] [CrossRef]
  40. Wójtowicz, J.; Łempicka, A.; Łuczyński, W.; Szczepański, W.; Zomerfeld, A.; Semeran, K.; Bossowski, A. Central aortic pressure, arterial stiffness and echocardiographic parameters of children with overweight/obesity and arterial hypertension. Adv. Clin. Exp. Med. Off Organ. Wroclaw. Med. Univ. 2017, 26, 1399–1404. [Google Scholar] [CrossRef] [Green Version]
  41. Niiranen, T.J.; Kalesan, B.; Mitchell, G.F.; Ramachandran, S.V. Relative Contributions of Pulse Pressure and Arterial Stiffness to Cardiovascular Disease—The Framingham Heart Study. Hypertension 2019, 73, 712–717. [Google Scholar] [CrossRef]
  42. Hale, P.M.; Cushman, T.T.; Kimball, E.S.; Nair, A.; Shaffer, R.G. Secondary Causes of Obesity in Childhood. In Management of Pediatric Obesity and Diabetes. Nutrition and Health; Ferry, R., Jr., Ed.; Humana Press: Totowa, NJ, USA, 2011. [Google Scholar] [CrossRef]
  43. Velea, I.P.; Albulescu, R.; Arghirescu, S.T. Obezitatea la copil. In Pediatrie-Curs pentru Studentii Facultătii de Medicină: Obezitatea la Copil; Velea, I., Ed.; Editura Victor Babes: Timisoara, Romania, 2016; pp. 289–297. [Google Scholar]
  44. Cheung, Y.F. Arterial stiffness in the young: Assessment, determinants, and implications. Korean Circ. J. 2010, 40, 153–162. [Google Scholar] [CrossRef] [Green Version]
  45. NHLBI Obesity Education Initiative Expert Panel on the Identification Evaluation and Treatment Obesity in Adults. In Clinical Guidelines on the Identification, Evaluation, and Treatment of Overweight and Obesity in Adults; National Heart, Lung and Blood Institute (Ed.) NHLBI Obesity Education Initiative Expert Panel on the Identification, Evaluation, and Treatment of Obesity in Adults (US): Bethesda, MD, USA, 1998. [Google Scholar]
  46. Hampl, S.E.; Hassink, S.G.; Skinner, A.C.; Armstrong, S.C.; Barlow, S.E.; Bolling, C.F.; Edwards, K.A.; Eneli, I.; Hamre, R.; Joseph, M.; et al. Clinical Practice Guideline for the Evaluation and Treatment of Children and Adolescents with Obesity. Pediatrics 2023, 151, e2022060640. [Google Scholar] [CrossRef]
  47. Xi, B.; Zong, X.; Kelishadi, R.; Litwin, M.; Hong, Y.M.; Poh, B.K.; Steffen, L.M.; Galcheva, S.V.; Herter-Aeberli, I.; Nawarycz, T.; et al. International Waist Circumference Percentile Cutoffs for Central Obesity in Children and Adolescents Aged 6 to 18 Years. J. Clin. Endocrinol. Metab. 2020, 1, e1569–e1583. [Google Scholar] [CrossRef]
  48. Santoro, N.; Amato, A.; Grandone, A.; Brienza, C.; Savarese, P.; Tartaglione, N.; Marzuillo, P.; Perrone, L.; Miraglia Del Giudice, E. Predicting metabolic syndrome in obese children and adolescents: Look, measure and ask. Obes. Facts 2013, 6, 48–56. [Google Scholar] [CrossRef] [PubMed]
  49. Emmanuel, M.; Bokor, B.R. Tanner Stages. In StatPearls [Internet]; StatPearls Publishing: Treasure Island, FL, USA, 2022. Available online: https://www.ncbi.nlm.nih.gov/books/NBK470280/ (accessed on 5 June 2022).
  50. Itriyeva, K. The effects of obesity on the menstrual cycle. Curr. Probl. Pediatr. Adolesc. Health Care 2022, 52, 101241. [Google Scholar] [CrossRef] [PubMed]
  51. Radu, A.M.; Carsote, M.; Dumitrascu, M.C.; Sandru, F. Acanthosis Nigricans: Pointer of Endocrine Entities. Diagnostics 2022, 12, 2519. [Google Scholar] [CrossRef] [PubMed]
  52. Weiss, W.; Gohlisch, C.; Harsch-Gladisch, C.; Tölle, M.; Zidek, W.; van der Giet, M. Oscillometric estimation of central bloodpressure: Validation of the Mobil-O-Graph in comparison with the SphygmoCor device. Blood Press. Monit. 2012, 17, 128–131. [Google Scholar] [CrossRef] [Green Version]
  53. Mynard, J.P.; Goldsmith, G.; Springall, G.; Eastaugh, L.; Lane, G.K.; Zannino, D.; Smolich, J.J.; Avolio, A.; Cheung, M.M.H. Central aortic blood pressure estimation in children and adolescents: Results of the KidCoreBP study. J. Hypertens. 2020, 38, 821–828. [Google Scholar] [CrossRef]
  54. Lim, S.H.; Kim, S.H. Blood pressure measurements and hypertension in infants, children, and adolescents: From the postmercury to mobile devices. Clin. Exp. Pediatr. 2022, 65, 73–80. [Google Scholar] [CrossRef]
  55. Mozos, I.; Gug, C.; Mozos, C.; Stoian, D.; Pricop, M.; Jianu, D. Associations between Intrinsic Heart Rate, P Wave and QT Interval Durations and Pulse Wave Analysis in Patients with Hypertension and High Normal Blood Pressure. Int. J. Environ. Res. Public Health 2020, 17, 4350. [Google Scholar] [CrossRef]
  56. Gómez-Marcos, M.A.; Recio-Rodríguez, J.I.; Patino-Alonso, M.C.; Agudo-Conde, C.; Gómez-Sanchez, L.; Gómez-Sanchez, M.; Rodríguez-Sánchez, E.; García-Ortiz, L. Protocol for measuring carotid intima-media thickness that best correlates with cardio-vascular risk and target organ damage. Am. J. Hypertens. 2012, 25, 955–961. [Google Scholar] [CrossRef] [Green Version]
  57. El Jalbout, R. Intima-Media Thickness Measurement in Children; Techniques and Reference Values. Am. J. Biomed. Sci. Res. 2020, 7, 101–103. [Google Scholar] [CrossRef] [Green Version]
  58. Polak, J.F.; Meisner, A.; Pencina, M.J.; Wolf, P.A.; D’Agostino, R.B. Variations in common carotid artery intima-media thickness during the cardiac cycle: Implications for cardiovascular risk assessment. J. Am. Soc. Echocardiogr. 2012, 25, 1023–1028. [Google Scholar] [CrossRef] [Green Version]
  59. Vermeersch, S.; Rietzschel, E.; De Buyzere, M.; Van Bortel, L.M.; D’Asseler, Y.; Gillebert, T.C.; Verdonck, P.R.; Segers, P. Validation of a new automated IMT measurement algorithm. J. Hum. Hypertens. 2007, 21, 976–978. [Google Scholar] [CrossRef] [PubMed] [Green Version]
  60. Matthews, D.R.; Hosker, J.P.; Rudenski, A.S.; Naylor, B.A.; Treacher, D.F.; Turner, R.C. Homeostasis model assessment: Insulin resistance and beta-cell function from fasting plasma glucose and insulin concentrations in man. Diabetologia 1985, 28, 412–419. [Google Scholar] [CrossRef] [PubMed] [Green Version]
  61. Vizzuso, S.; Del Torto, A.; Dilillo, D.; Calcaterra, V.; Di Profio, E.; Leone, A.; Gilardini, L.; Bertoli, S.; Battezzati, A.; Zuccotti, G.V.; et al. Visceral Adiposity Index (VAI) in Children and Adolescents with Obesity: No Association with Daily Energy Intake but Promising Tool to Identify Metabolic Syndrome (MetS). Nutrients 2021, 13, 413. [Google Scholar] [CrossRef]
  62. Shashaj, B.; Luciano, R.; Contoli, B.; Morino, G.S.; Spreghini, M.R.; Rustico, C.; Sforza, R.W.; Dallapiccola, B.; Manco, M. Reference ranges of HOMA-IR in normal-weight and obese young Caucasians. Acta. Diabetol. 2016, 53, 251–260. [Google Scholar] [CrossRef] [PubMed]
  63. Harris, R.A.; Nishiyama, S.K.; Wray, D.W.; Richardson, R.S. Ultrasound assessment of flow-mediated dilation. Hypertens 2010, 55, 1075–1085. [Google Scholar] [CrossRef]
  64. Khanna, D.; Peltzer, C.; Kahar, P.; Parmar, M.S. Body Mass Index (BMI): A Screening Tool Analysis. Cureus 2022, 14, e22119. [Google Scholar] [CrossRef]
  65. Savant, J.D.; Furth, S.L.; Meyers, K.E.C. Arterial stiffness in children: Pediatric measurement and considerations. Pulse 2015, 2, 69–80. [Google Scholar] [CrossRef] [Green Version]
  66. Ben-Shlomo, Y.; Spears, M.; Boustred, C.; May, M.; Anderson, S.G.; Benjamin, E.J.; Boutouyrie, P.; Cameron, J.; Chen, C.H.; Cruickshank, J.K. Aortic pulse wave velocity improves cardiovascular event prediction: An individual participant meta-analysis of prospective observational data from 17,635 subjects. J. Am. Coll. Cardiol. 2014, 63, 636–646. [Google Scholar] [CrossRef]
  67. Lentferink, Y.E.; Kromwijk, L.A.J.; van der Aa, M.P.; Knibbe, C.A.J.; van der Vorst, M.M.J. Increased Arterial Stiffness in Adolescents with Obesity. Glob. Pediatr. Health 2019, 6, 2333794X19831297. [Google Scholar] [CrossRef] [Green Version]
  68. Jakab, A.E.; Hidvégi, E.V.; Illyés, M.; Cziráki, A.; Kalmár, T.; Maróti1, Z.; Bereczki, C. Childhood Obesity: Does it Have Any Effect on Young Arteries? Front. Pediatr. 2020, 8, 398. [Google Scholar] [CrossRef]
  69. Dangardt, F.; Chen, Y.; Berggren, K.; Osika, W.; Friberg, P. Increased rate of arterial stiffening with obesity in adolescents: A five-year follow-up study. PLoS ONE 2013, 8, e57454. [Google Scholar] [CrossRef]
  70. Zhao, M.; López-Bermejo, A.; Caserta, C.A.; Medeiros, C.C.M.; Kollias, A.; Bassols, J.; Romeo, E.; Ramos, T.D.A.; Stergiou, G.; Yang, L.; et al. International Childhood Vascular Structure Evaluation Consortium. Metabolically Healthy Obesity and High Carotid Intima-Media Thickness in Children and Adolescents: International Childhood Vascular Structure Evaluation Consortium. Diabetes Care. 2019, 42, 119–125. [Google Scholar] [CrossRef] [Green Version]
  71. Brady, T.M. Obesity-Related Hypertension in Children. Front. Pediatr. 2017, 25, 197. [Google Scholar] [CrossRef] [Green Version]
  72. Kalil, G.Z.; Haynes, W.G. Sympathetic nervous system in obesity-related hypertension: Mechanisms and clinical implications. Hypertens. Res. 2012, 35, 4–16. [Google Scholar] [CrossRef] [PubMed] [Green Version]
  73. Vecchiola, A.; Lagos, C.F.; Carvajal, C.A.; Baudrand, R.; Fardella, C.E. Aldosterone production and signaling dysregulation in obesity. Curr. Hypertens. Rep. 2016, 18, 20. [Google Scholar] [CrossRef]
  74. Parker, E.D.; Sinaiko, A.R.; Kharbanda, E.O.; Margolis, K.L.; Daley, M.F.; Trower, N.K.; Sherwood, N.; Greenspan, L.; Lo, J.; Magid, D.; et al. Change in weight status and development of hypertension. Pediatrics 2016, 137, e20151662. [Google Scholar] [CrossRef] [Green Version]
  75. Reinehr, T.; de Sousa, G.; Toschke, A.M.; Andler, W. Long-term follow-up of cardiovascular disease risk factors in children after an obesity intervention. Am. J. Clin. Nutr. 2006, 84, 490–496. [Google Scholar] [CrossRef] [Green Version]
  76. Rocchini, A.P.; Katch, V.; Anderson, J.; Hinderliter, J.; Becque, D.; Martin, M.; Marks, C. Blood pressure in obese adolescents: Effect of weight loss. Pediatrics 1988, 82, 16–23. [Google Scholar] [PubMed]
  77. Henning, R.J. Obesity and obesity-induced inflammatory disease contribute to atherosclerosis: A review of the pathophysiology and treatment of obesity. Am. J. Cardiovasc. Dis. 2021, 11, 50–529. [Google Scholar]
  78. Harbin, M.M.; Hultgren, N.E.; Kelly, A.S.; Dengel, D.R.; Evanoff, N.G.; Ryder, J.R. Measurement of central aortic blood pressure in youth: Role of obesity and sex. Am. J. Hypertens. 2018, 31, 1286–1292. [Google Scholar] [CrossRef] [PubMed] [Green Version]
  79. Cai, T.Y.; Qasem, A.; Ayer, J.G.; Butlin, M.; O’Meagher, S.; Melki, C.; Marks, G.B.; Avolio, A.; Celermajer, D.S.; Skilton, M.R. Central blood pressure in children and adolescents: Non-invasive development and testing of novel transfer functions. J. Hum. Hypertens. 2017, 31, 831–837. [Google Scholar] [CrossRef] [PubMed]
  80. Walter, L.M. Obesity and Central Blood Pressure in Children and Adolescents. Am. J. Hypertens 2018, 31, 1266–1267. [Google Scholar] [CrossRef] [PubMed] [Green Version]
  81. Köchli, S.; Deiseroth, A.; Hauser, C.; Streese, L.; Schmidt-Trucksäs, A.; Faude, O.; Hanssen, H. Body Composition and Physical Fitness Affect Central Hemodynamics in Young Children. Front. Pediatr. 2021, 9, 750398. [Google Scholar] [CrossRef] [PubMed]
  82. Bassali, R.; Waller, J.L.; Gower, B.; Allison, J.; Davis, C.L. Utility of waist circumference percentile for risk evaluation in obese children. Int. J. Pediatric Obes. 2010, 5, 97–101. [Google Scholar] [CrossRef]
  83. Ashwell, M.; Gunn, P.; Gibson, S. Waist-to-height ratio is a better screening tool than waist circumference and BMI for adult cardiometabolic risk factors: Systematic review and meta-analysis. Obes Rev. 2012, 13, 275–286. [Google Scholar] [CrossRef]
  84. Yoo, E.G. Waist-to-height ratio as a screening tool for obesity and cardiometabolic risk. Korean J. Pediatr. 2016, 59, 425–431. [Google Scholar] [CrossRef]
  85. Brambilla, P.; Bedogni, G.; Heo, M.; Pietrobelli, A. Waist circumference-to-height ratio predicts adiposity better than body mass index in children and adolescents. Int. J. Obes. 2013, 37, 943–946. [Google Scholar] [CrossRef] [Green Version]
  86. Khoury, M.; Manlhiot, C.; McCrindle, B.W. Role of the waist/height ratio in the cardiometabolic risk assessment of children classified by body mass index. J Am Coll Cardiol. 2013, 62, 742–751. [Google Scholar] [CrossRef] [Green Version]
  87. Baroncini, L.A.; de Sylvestre, L.C.; Pecoits Filho, R. Assessment of Intima-Media Thickness in Healthy Children Aged 1 to 15 Years. Arq. Bras. Cardiol. 2016, 106, 327–332. [Google Scholar] [CrossRef]
  88. Sinning, C.; Wild, P.S.; Echevarria, F.M.; Wilde, S.; Schnabel, R.; Lubos, E.; Herkenhoff, S.; Bickel, C.; Klimpe, S.; Gori, T.; et al. Gutenberg-Heart Study. Sex dif-ferences in early carotid atherosclerosis (from the community-based Gutenberg Heart Study). Am. J. Cardiol. 2011, 107, 1841–1847. [Google Scholar] [CrossRef]
  89. Ahimastos, A.A.; Formosa, M.; Dart, A.M.; Kingwell, B.A. Gender differences in large artery stiffness pre- and post-puberty. J. Clin. Endocrinol. Metab. 2003, 88, 5375–5380. [Google Scholar] [CrossRef] [PubMed]
  90. Du pond, J.J.; Kenney, R.M.; Patel, A.R.; Jaffe, I.Z. Sex differences in mechanisms of arterial stiffness. Br. J. Pharmacol. 2019, 176, 4208–4225. [Google Scholar] [CrossRef]
  91. Robb, A.O.; Mills, N.L.; Din, J.N.; Smith, I.B.; Paterson, F.; Newby, D.E.; Denison, F.C. Influence of the menstrual cycle, pregnancy, and preeclampsia on arterial stiffness. Hypertension 2009, 53, 952–958. [Google Scholar] [CrossRef] [PubMed] [Green Version]
  92. Stamatelopoulos, K.S.; Georgiopoulos, G.; Papaioannou, T.; Lambrinoudaki, I.; Kouzoupis, A.; Vlachopoulos, C.; Sfikakis, P.P. Can premenstrual syndrome affect arterial stiffness or blood pressure? Atherosclerosis 2012, 224, 170–176. [Google Scholar] [CrossRef]
  93. Solorzano, C.M.B.; Helm, K.D.; Patrie, J.T.; Shayya, R.F.; Cook-Andersen, H.L.; Chang, R.J.; McCartney, C.R.; Marshall, J.C. In-creased adrenal androgens in overweight peripubertal girls. J. Endocr. Soc. 2017, 1, 538–552. [Google Scholar] [CrossRef]
  94. Dockery, F.; Bulpitt, C.J.; Donaldson, M.; Fernandez, S.; Rajkumar, C. The relationship between androgens and arterial stiffness in older men. JAGS 2003, 51, 1627–1632. [Google Scholar] [CrossRef]
  95. Webb, C.M.; Elkington, A.G.; Kraidly, M.M.; Keenan, N.; Pennell, D.J.; Collins, P. Effects of oral testosterone treatment on myocardial perfusion and vascular function in men with low plasma testosterone and coronary heart disease. Am. J. Card. 2008, 101, 618–624. [Google Scholar] [CrossRef] [Green Version]
  96. Wilson, D.P. Is Atherosclerosis a Pediatric Disease? In Endotext. South Dartmouth (MA); Feingold, K.R., Anawalt, B., Boyce, A., Chrousos, G., de Herder, W.W., Dhatariya, K., Dungan, K., Hershman, J.M., Hofland, J., Kalra, S., et al., Eds.; MDText.com, Inc: South Dartmouth, MA, USA, 2000. Available online: https://www.ncbi.nlm.nih.gov/books/NBK395576/ (accessed on 12 February 2023).
  97. Qiu, H.; Zhu, Y.; Sun, Z.; Trzeciakowski, J.P.; Gansner, M.; Depre, C.; Vatner, S.F. Short communication: Vascular smooth muscle cell stiffness as a mechanism for increased aortic stiffness with aging. Circ. Res. 2010, 107, 615–619. [Google Scholar] [CrossRef] [Green Version]
  98. van den Munckhof, I.C.L.; Jones, H.; Hopman, M.T.E.; de Graaf, J.; Nyakayiru, J.; van Dijk, B.; Eijsvogels, T.M.H.; Thijssen, D.H.J. Relation between age and carotid artery intima-medial thickness: A systematic review. Clin. Cardiol. 2018, 41, 698–704. [Google Scholar] [CrossRef] [Green Version]
  99. Hidvégi, E.V.; Illyés, M.; Benczúr, B.; Böcskei, R.M.; Rátgéber, L.; Lenkey, Z.; Molnár, F.T.; Cziráki, A. Reference values of aortic pulse wave velocity in a large healthy population aged between 3 and 18 years. J. Hypertens. 2012, 30, 2314–2321. [Google Scholar] [CrossRef] [Green Version]
  100. Jo, C.O.; Lande, M.B.; Meagher, C.C.; Wang, H.; Vermilion, R.P. A simple method of measuring thoracic aortic pulse wave velocity in children: Methods and normal values. J. Am. Soc. Echocardiogr. 2010, 23, 735–740. [Google Scholar] [CrossRef] [PubMed]
  101. Voges, I.; Jerosch-Herold, M.; Hedderich, J.; Pardun, E.; Hart, C.; Gabbert, D.D.; Hansen, J.H.; Petko, C.; Kramer, H.H.; Rickers, C. Normal values of aortic dimensions, distensibility, and pulse wave velocity in children and young adults: A cross-sectional study. J. Cardiovasc. Magn. Reson. 2012, 14, 77. [Google Scholar] [CrossRef] [PubMed] [Green Version]
  102. Kelsey, M.M.; Zeitler, P.S. Insulin Resistance of Puberty. Curr. Diab. Rep. 2016, 16, 64. [Google Scholar] [CrossRef] [PubMed]
  103. Tagi, V.M.; Chiarelli, F. Obesity and insulin resistance in children. Curr. Opin. Pediatr. 2020, 32, 582–588. [Google Scholar] [CrossRef]
  104. Chiarelli, F.; Marcovecchio, M.L. Insulin resistance and obesity in childhood. Eur. J. Endocrinol. 2008, 159, S67–S74. [Google Scholar] [CrossRef] [Green Version]
  105. Kurtoğlu, S.; Hatipoğlu, N.; Mazıcıoğlu, M.; Kendirici, M.; Keskin, M.; Kondolot, M. Insulin resistance in obese children and adolescents: HOMA-IR cut-off levels in the prepubertal and pubertal periods. J. Clin. Res. Pediatr. Endocrinol. 2010, 2, 100–106. [Google Scholar] [CrossRef]
  106. Sabin, M.A.; Hunt, L.P.; Ford, A.L.; Werther, G.A.; Crowne, E.C.; Shield, J.P.H. Elevated glucose concentrations during an oral glucose tolerance test are associated with the presence of metabolic syndrome in childhood obesity. Diab. Med. 2008, 25, 3. [Google Scholar] [CrossRef]
  107. Roman, R.; Zeitler, P.S. Oral Glucose Tolerance Testing in Asymptomatic Obese Children: More Questions than Answers. J. Clin. Endocrinol. MetabVolume. 2008, 93, 4228–4230. [Google Scholar] [CrossRef] [PubMed] [Green Version]
  108. Kluczynik, C.E.; Mariz, L.S.; Souza, L.C.; Solano, G.B.; Albuquerque, F.C.; Medeiros, C.C. Acanthosis nigricans and insulin resistance in overweight children and adolescents. An. Bras. Dermatol. 2012, 87, 531–537. [Google Scholar] [CrossRef] [PubMed] [Green Version]
  109. Chueh, H.W.; Cho, G.R.; Yoo, J.H. Clinical significance of acanthosis nigricans in children and adolescents with obesity induced metabolic complications. Korean J. Pediatr. 2007, 50, 987–994. [Google Scholar] [CrossRef]
  110. Slyper, A.H.; Kashmer, L.; Huang, W.M.; Re’em, Y. Acanthosis nigricans, vitamin D, and insulin resistance in obese children and adolescents. J. Pediatr. Endocrinol. Metab. 2014, 27, 1107–1111. [Google Scholar] [CrossRef] [PubMed]
  111. Patidar, P.P.; Ramachandra, P.; Philip, R.; Saran, S.; Agarwal, P.; Gutch, M.; Gupta, K. Correlation of acanthosis nigricans with insulin resistance, anthropometric, and other metabolic parameters in diabetic Indians. Indian J. Endocrinol. Metab. 2012, 16, S436–S437. [Google Scholar] [CrossRef] [PubMed]
  112. Guevara-Gutiérrez, E.; Tlacuilo-Parra, A.; Gutiérrez-Fajardo, P.; Sánchez-Tenorio, T.; Barba-Gómez, F.; Miranda-Díaz, A. A study of the association of acanthosis nigricans with subclinical atherosclerosis. Indian J. Dermatol. Venereol. Leprol. 2017, 83, 190–194. [Google Scholar] [CrossRef] [PubMed]
  113. Hudson, L.; Kinra, S.; Wong, I.; Viner, R. Arterial stiffening, insulin resistance and acanthosis nigricans in a community sample of adolescents with obesity. Int. J. Obes. 2017, 41, 1454–1456. [Google Scholar] [CrossRef]
  114. Jabbour, R.; Ott, J.; Eppel, W.; Frigo, P. Carotid intima-media thickness in polycystic ovary syndrome and its association with hormone and lipid profiles. PLoS ONE 2020, 15, e0232299. [Google Scholar] [CrossRef] [PubMed]
  115. Patel, S.S.; Truong, U.; King, M.; Ferland, A.; Moreau, K.L.; Dorosz, J.; Hokanson, J.E.; Wang, H.; Kinney, G.L.; Maahs, D.M.; et al. Obese adolescents with polycystic ovarian syndrome have elevated cardiovascular disease risk markers. Vasc. Med. 2017, 22, 85–95. [Google Scholar] [CrossRef] [Green Version]
  116. Cree-Green, M.; Truong, U.; Dorosz, J.L.; Moreau, K.; Coe, G.; Baumgartner, A.; Newnes, L.; Nadeau, K.J. Abstract 12078: Obese Girls With PCOS Have Evidence of Vascular Stiffening and Left Ventricular Hypertrophy Which Relate to Insulin Resistance. Circulation 2014, 130, A12078. [Google Scholar] [CrossRef]
  117. Ketel, I.J.; Stehouwer, C.D.; Henry, R.M.; Serné, E.H.; Hompes, P.; Homburg, R.; Smulders, Y.M.; Lambalk, C.B. Greater arterial stiffness in polycystic ovary syndrome (PCOS) is an obesity--but not a PCOS-associated phenomenon. J. Clin. Endocrinol. Metab. 2010, 95, 4566–4575. [Google Scholar] [CrossRef]
  118. Jørgensen, R.M.; Bøttger, B.; Vestergaard, E.T.; Kremke, B.; Bahnsen, R.F.; Nielsen, B.W.; Bruun, J.M. Uric Acid Is Elevated in Children with Obesity and Decreases After Weight Loss. Front. Pediatr. 2022, 9, 814166. [Google Scholar] [CrossRef]
  119. Tsouli, S.G.; Liberopoulos, E.N.; Mikhailidis, D.P.; Athyros, V.G.; Elisaf, M.S. Elevated serum uric acid levels in metabolic syndrome: An active component or an innocent bystander? Metabolism 2006, 55, 1293–1301. [Google Scholar] [CrossRef]
  120. Mortada, I. Hyperuricemia, type 2 diabetes mellitus, and hypertension: An emerging association. Curr. Hypertens. Rep. 2017, 19, 69. [Google Scholar] [CrossRef] [PubMed]
  121. Borghi, C.; Agabiti-Rosei, E.; Johnson, R.J.; Kielstein, J.T.; Lurbe, E.; Mancia, G.; Redon, J.; Stack, A.; Tsioufis, K. Hyperuricaemia and gout in cardiovascular, metabolic and kidney disease. Eur. J. Int. Med. 2020, 80, 1–11. [Google Scholar] [CrossRef] [PubMed]
  122. Genovesi, S.; Montelisciani, L.; Viazzi, F.; Giussani, M.; Lieti, G.; Patti, I.; Orlando, A.; Antolini, L.; Salvi, P.; Parati, G. Uric acid and arterial stiffness in children and adolescents: Role of insulin resistance and blood pressure. Front. Cardiovasc. Med. 2022, 11, 978366. [Google Scholar] [CrossRef] [PubMed]
  123. Pacifico, L.; Cantisani, V.; Anania, C.; Bonaiuto, E.; Martino, F.; Pascone, R.; Chiesa, C. Serum uric acid and its association with metabolic syndrome and carotid atherosclerosis in obese children. Eur. J. Endocrinol. 2009, 160, 45–52. [Google Scholar] [CrossRef] [Green Version]
  124. Hatami, M.; Tohidi, M.; Mohebi, R.; Khalili, D.; Azizi, F.; Hadaegh, F. Adolescent lipoprotein classifications according to National Health and Nutrition Examination Survey (NHANES) vs. National Cholesterol Education Program (NCEP) for predicting abnormal lipid levels in adulthood in a Middle East population. Lipids Health Dis. 2012, 11, 107. [Google Scholar] [CrossRef] [Green Version]
  125. Kosmas, C.E.; Martinez, I.; Sourlas, A.; Bouza, K.V.; Campos, F.N.; Torres, V.; Montan, P.D.; Guzman, E. High-density lipoprotein (HDL) functionality and its relevance to atherosclerotic cardiovascular disease. Drugs. Context. 2018, 7, 212525. [Google Scholar] [CrossRef]
  126. Frontini, M.G.; Srinivasan, S.R.; Xu, J.; Tang, R.; Bond, M.G.; Berenson, G.S. Usefulness of childhood non-high density lipoprotein cholesterol levels versus other lipoprotein measures in predicting adult subclinical atherosclerosis: The Bogalusa HeartStudy. Pediatrics 2008, 121, 924–929. [Google Scholar] [CrossRef]
  127. Boullart, A.C.; de Graaf, J.; Stalenhoef, A.F. Serum triglycerides and risk of cardiovascular disease. Biochim. Et Biophys. Acta (BBA)-Mol. Cell Biol. Lipids 2012, 1821, 867–875. [Google Scholar] [CrossRef]
  128. Krawczyk, M.; Rumińska, M.; Witkowska-Sędek, E.; Majcher, A.; Pyrżak, B. Usefulness of the triglycerides to high-density lipoprotein cholesterol ratio (TG/HDL-C) in prediction of metabolic syndrome in polish obese children and adolescents. Acta-. Biochim. Pol. 2018, 65, 605–611. [Google Scholar] [CrossRef]
  129. Iwani, N.A.K.Z.; Jalaludin, M.Y.; Zin, R.M.W.M.; Fuziah, M.Z.; Hong, J.Y.H.; Abqariyah, Y.; Mokhtar, A.H.; Nazaimoon, W.M.W. TG: HDL-C Ratio Is a Good Marker to Identify Children Affected by Obesity with Increased Cardiometabolic Risk and Insulin Resistance. Int. J. Endocrinol. 2019, 2019, 8586167. [Google Scholar] [CrossRef]
  130. Lemieux, I.; Lamarche, B.; Couillard, C.; Pascot, A.; Cantin, B.; Bergeron, J.; Dagenais, G.R.; Després, J.P. Total Cholesterol/HDL Cholesterol Ratio vs LDL Cholesterol/HDL Cholesterol Ratio as Indices of Ischemic Heart Disease Risk in Men: The Quebec Cardiovascular Study. Arch. Intern. Med. 2001, 161, 2685–2692. [Google Scholar] [CrossRef] [PubMed]
  131. Artha, I.M.J.R.; Bhargah, A.; Dharmawan, N.K.; Pande, U.W.; Triyana, K.A.; Mahariski, P.A.; Yuwono, J.; Bhargah, V.; Prabawa, I.P.Y.; Manuaba, I.B.A.P.; et al. High level of individual lipid profile and lipid ratio as a predictive marker of poor glycemic control in type-2 diabetes mellitus. Vasc. Health Risk Manag. 2019, 15, 149–157. [Google Scholar] [CrossRef] [Green Version]
  132. Magnussen, C.G.; Venn, A.; Thomson, R.; Juonala, M.; Srinivasan, S.R.; Viikari, J.S.; Berenson, G.S.; Dwyer, T.; Raitakari, O.T. The association of pediatric low- and high-density lipoprotein cholesterol dyslipidemia classifications and change in dyslipidemia status with carotid intima-media thickness in adulthood evidence from the cardiovascular risk in Young Finns study, the Bogalusa Heart study, and the CDAH (Childhood Determinants of Adult Health) study. J. Am. Coll. Cardiol. 2009, 53, 860–869. [Google Scholar] [CrossRef] [PubMed] [Green Version]
  133. Man, E.; Cheung, P.T.; Cheung, Y.F. Associations between arterial structure and function and serum levels of liver enzymes in obese adolescents. J. Paediatr. Child. Health 2017, 53, 691–697. [Google Scholar] [CrossRef]
  134. Al Mheid, I.; Patel, R.; Murrow, J.; Morris, A.; Rahman, A.; Fike, L.; Kavtaradze, N.; Uphoff, I.; Hooper, C.; Tangpricha, V.; et al. Vitamin D status is associated with arterial stiffness and vascular dysfunction in healthy humans. J. Am. Coll. Cardiol. 2011, 58, 186–192. [Google Scholar] [CrossRef] [Green Version]
  135. Peterson, C.A.; Belenchia, A.M. Vitamin D deficiency & childhood obesity: A tale of two epidemics. Mo Med. 2014, 111, 49–53. [Google Scholar]
  136. Rajakumar, K.; Moore, C.G.; Khalid, A.T.; Vallejo, A.N.; Virji, M.A.; Holick, M.F.; Greenspan, S.L.; Arslanian, S.; Reis, S.E. Effect of vitamin D3 supplementation on vascular and metabolic health of vitamin D-deficient overweight and obese children: A randomized clinical trial. Am. J. Clin. Nutr. 2020, 111, 757–768. [Google Scholar] [CrossRef] [PubMed]
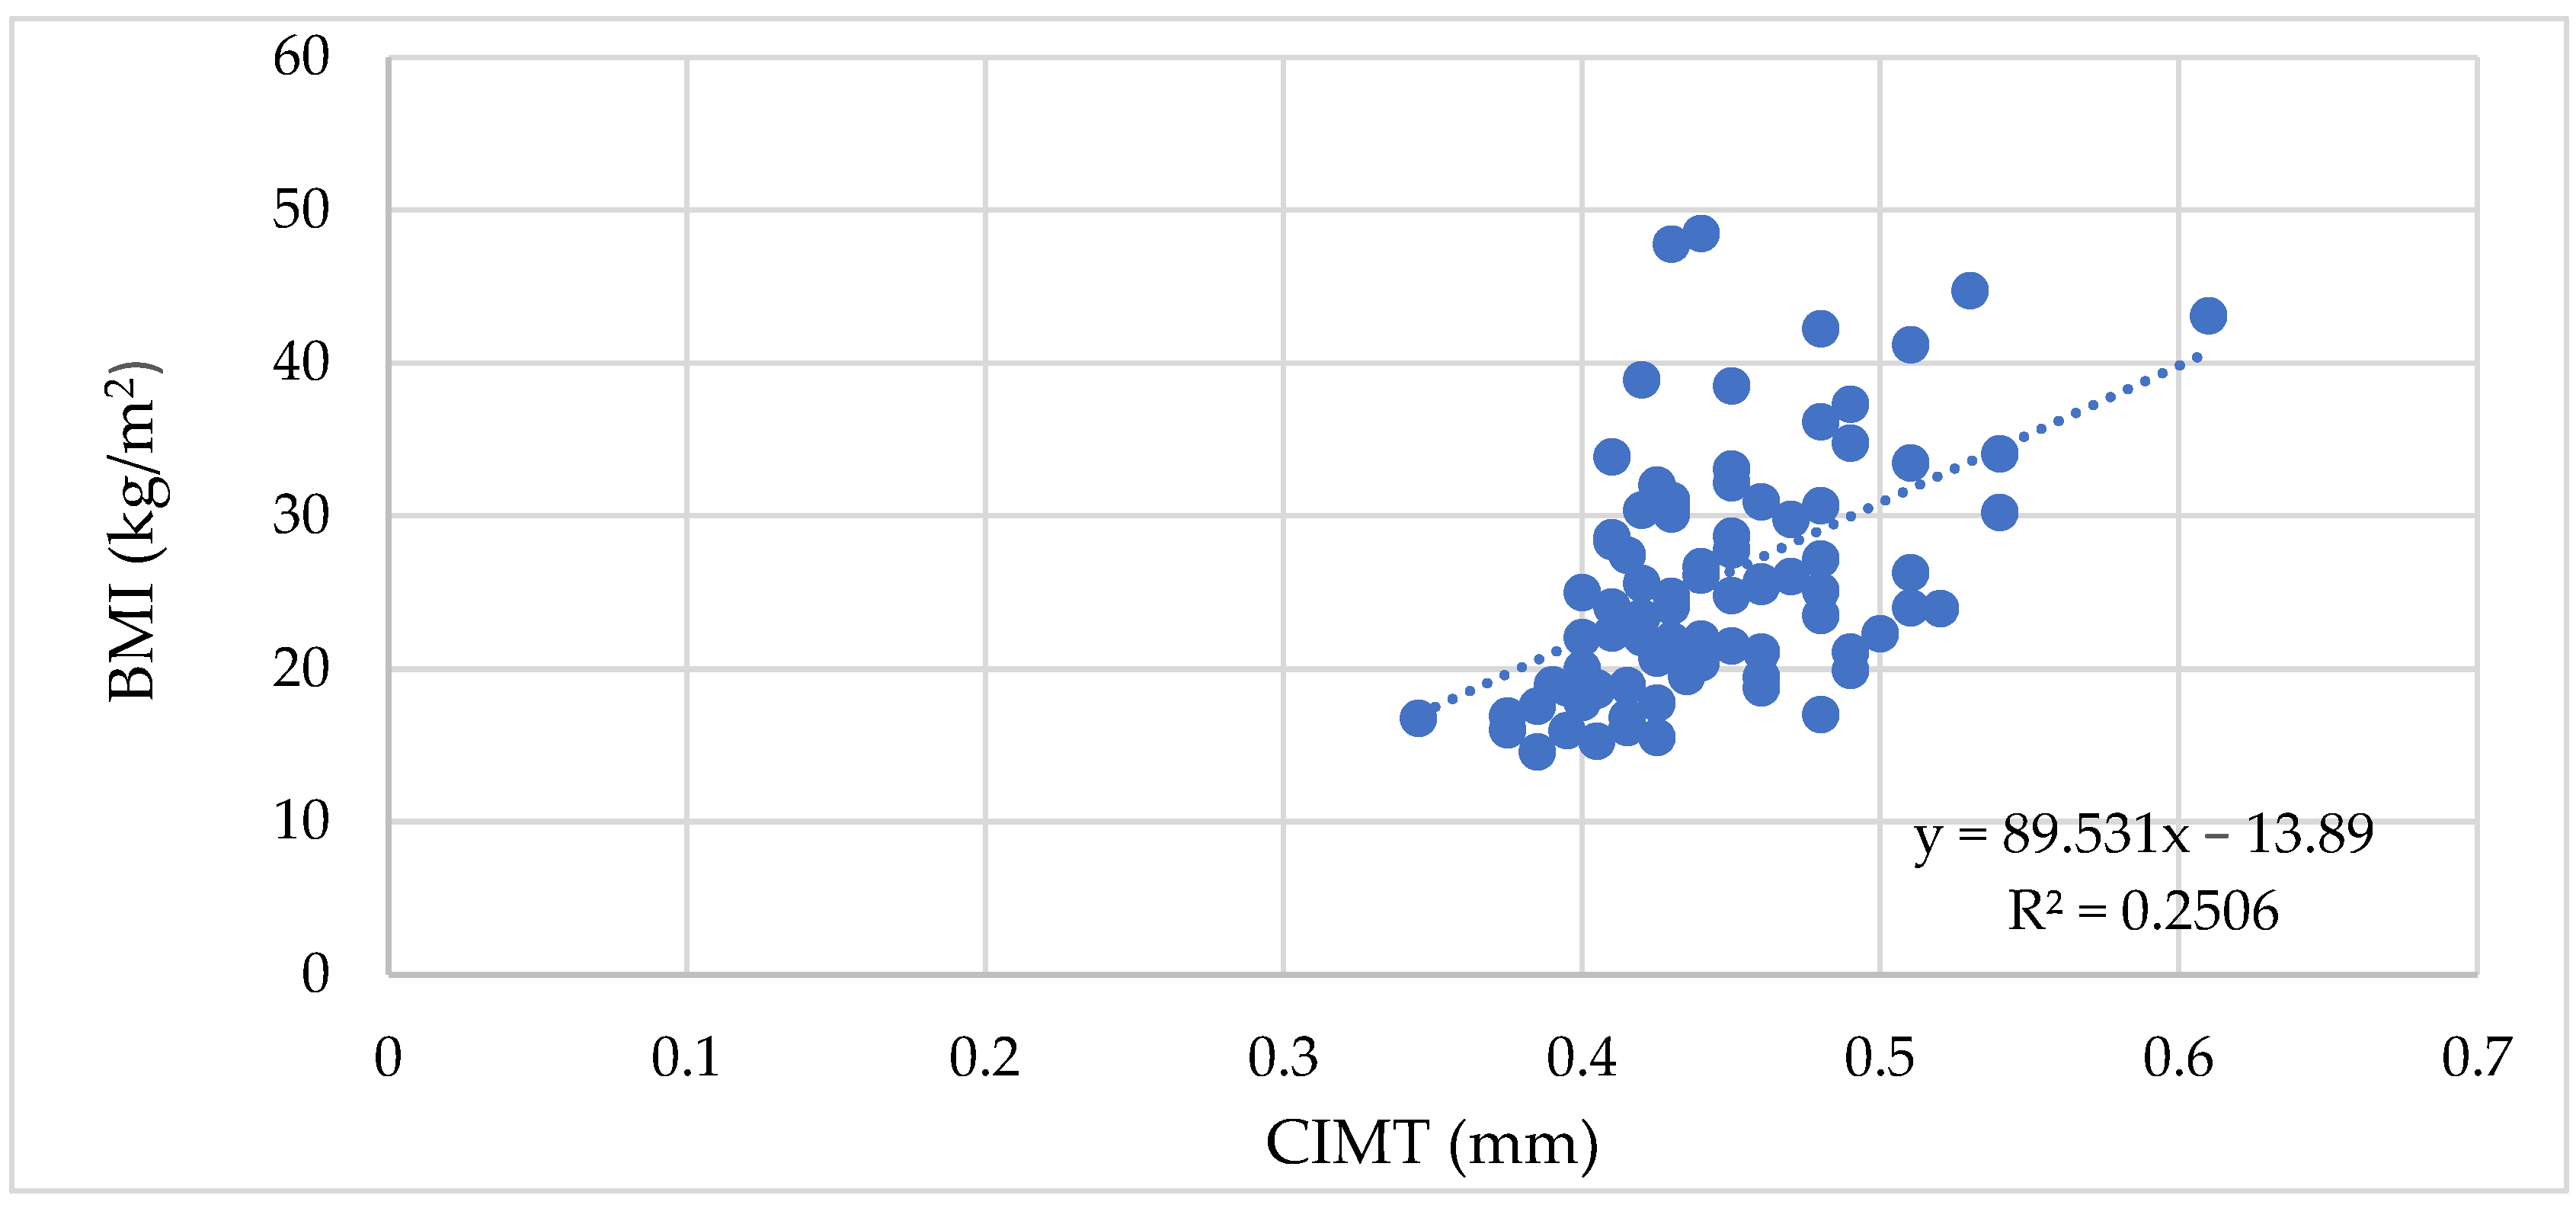
Figure 1. Correlation between the BMI and CIMT in all patients (ρ = 0.52, p < 0.0001).
Biomedicines 11 01841 g001
Figure 2. Correlation between the WC and CIMT in all patients (ρ = 0.53, p < 0.0001).
Biomedicines 11 01841 g002
Figure 3. Correlation between the WHR and CIMT in all patients (ρ = 0.38, p = 0.0004).
Biomedicines 11 01841 g003
Figure 4. PWV median values in controls vs. obese subjects (p < 0.0001).
Biomedicines 11 01841 g004
Figure 5. AIx mean values in controls vs. obese subjects (p = 0.03).
Biomedicines 11 01841 g005
Figure 6. Differences between peripheral BP values: significantly higher SBP (p < 0.0001) and MAP (p = 0.008) in obese subjects vs. controls (the different symbols accompanying the box-and-whisker plots in the figure suggest that different variables are being compared in the three pairs).
Biomedicines 11 01841 g006
Figure 7. Differences between central blood and pulse pressure values: significantly higher cSBP (p < 0.0001), cDBP (p = 0.003), and cPP (p = 0.001) in obese subjects vs. controls (the different symbols accompanying the box-and-whisker plots in the figure suggest that different variables are being compared in the three pairs).
Biomedicines 11 01841 g007
Figure 8. Correlation between HOMA-IR values and BMI.
Biomedicines 11 01841 g008
Table 1. Distribution of subjects by sex and age.
Obese (n = 50)%Controls (n = 34)%
SexFemale23461853
Male27541647
Age<12 y22441338
12–15 y17341338
>15 y1122824
Table 2. One-way ANOVA comparison of obese subjects according to age groups. The p-values in the comparative T-Student tests between groups were Bonferroni-adjusted in order to keep the significance threshold <0.05. The significant results in this table are in bold text.
Mean Valuesp-Values
ANOVA p-value<12 y12–15 y>15 y<12 y
vs. 12–15 y
<12 y
vs. >15 y
12–15 y
vs. >15 y
CIMT0.020.440.470.450.020.680.66
PWV0.014.855.20.240.010.65
cSBP0.04115.4118.94125.450.840.020.5
Table 3. One-way ANOVA comparison of obese subjects according to Tanner-stage groups. The p-values in the comparative T-Student tests between groups were Bonferroni-adjusted in order to keep the significance threshold <0.05. The significant results in this table are in bold text.
Mean Valuesp-Values
ANOVA p-valueTanner 1Tanner 2–4Tanner 5Tanner 1
vs. Tanner 2–4
Tanner 1
vs. Tanner 5
Tanner 2–4
vs. Tanner 5
CIMT0.00090.420.440.460.390.0020.04
PWV0.0024.54.650.90.0030.001
AIx0.00823.3126.3931.580.250.0040.02
SBP0.003117.81119.6127.820.950.020.003
DBP0.0177.867581.90.750.360.003
MAP0.00297.8497.3104.860.960.0570.0006
cSBP0.004106.22111.33118.240.420.010.054
cDBP0.0973.471.7877.030.970.690.04
cPP0.00532.8139.5441.20.020.0030.98
HR0.2188.684.2830.120.090.45
Table 4. Differences between the two study groups for BMI, WC, and WHR.
BMI (kg/m2)WC (cm)WHR
MeanSDMeanSDMeanSD
Obese29.236.7899.4116.680.620.09
Controls19.012.4865.418.960.430.03
p-value<0.0001 <0.0001 <0.0001
Table 5. The vascular biomarkers in correlation to the BMI, WC, and WHR (Spearman’s correlations) in all patients (n = 84).
CorrelationsCIMTPWVAIxSPBDBPMAPcSBPcDBPcPPHR
BMIρ0.520.70.360.70.320.560.750.520.490.37
p-value<0.0001<0.00010.0007<0.00010.003<0.0001<0.0001<0.0001<0.00010.04
WCρ0.530.730.390.720.290.550.760.510.50.24
p-value<0.0001<0.00010.0002<0.00010.007<0.0001<0.0001<0.0001<0.00010.21
WHRρ0.380.580.330.580.20.420.640.380.430.13
p-value0.0004<0.00010.001<0.00010.060.0001<0.00010.0004<0.00010.27
Table 6. The multiple regression models with clinical parameters as independent variables (W, BMI, WC, WHR, Tanner stages, and acanthosis nigricans).
Dependent VariableFp-ValueR2Variance %
CIMT 6.39 <0.001 0.44 43.74
PWV 14.68 <0.001 0.64 64.09
AIx 2.7 0.008 0.25 24.74
SBP 13.89 <0.001 0.63 62.81
DBP 3.28 0.002 0.29 28.55
MAP 9.43 <0.001 0.53 53.42
cSBP 16.86 <0.001 0.67 67.21
cDBP 6.46 <0.001 0.44 43.98
cPP 3.63 <0.001 0.31 30.62
HR 0.61 0.78 0.07 6.92
Table 7. Multiple regression analysis for clinical parameters (Tanner, W, BMI, WC, WHR, and acanthosis nigricans) as predictors of vascular biomarkers.
Dependent
Variable
Independent
Variable
B
Coefficient
Beta
Coefficient
Std. Errortp-Value
SBPWC 1.52 2.77 0.6 2.51 0.01
WHR −204.26 −2.11 89.23 −2.29 0.02
DBP BMI 2.17 1.88 0.99 2.19 0.03
WC 1.32 3.17 0.64 2.08 0.04
WHR −216.47 −2.94 93.89 −2.31 0.02
MAP BMI 1.9 1.58 0.83 2.28 0.02
WC 1.42 3.27 0.53 2.65 0.01
WHR −210.36 −2.75 78.95 −2.66 0.009
cSBPWC 1.7 2.8 0.63 2.71 0.008
WHR −225.68 −2.11 92.71 −2.43 0.01
Tanner 7.13 0.24 3.52 2.02 0.04
cDBP WHR −179.4 −2.31 87.96 −2.04 0.04
Tanner 9.88 0.45 3.34 2.95 0.004
Table 8. Correlations between the vascular biomarkers and body composition parameters in obese patients (Pearson’s r or Spearman’s ρ, according to the normality of the data).
Vascular
Biomarkers
CorrelationsFat Mass
(kg)
Trunk Fat Mass (kg)Muscle Mass (kg)Body Water
(kg)
CIMTρ/r0.390.410.410.4
p-value0.0050.0020.0030.004
PWVρ/r0.650.60.480.47
p-value<0.0001<0.00010.00040.0005
AIxρ/r0.340.320.170.19
p-value0.010.020.220.18
SBPρ/r0.620.530.410.4
p-value<0.00010.00010.0030.004
DBPρ/r0.420.290.240.24
p-value0.0020.040.080.08
MAPρ/r0.550.440.380.37
p-value<0.00010.0010.0060.007
cSBPρ/r0.630.550.460.45
p-value<0.0001<0.00010.00060.0009
cDBPρ/r0.480.380.330.33
p-value0.00040.0060.010.01
cPPρ/r0.180.230.180.18
p-value0.190.10.190.2
HRρ/r0.380.470.260.24
p-value0.0030.020.120.18
Table 9. AUC-ROC analysis for each vascular biomarker with the presence of obesity considered the pathological instance.
Criterion
(Cut-Off)
AUCpSe %95% CISp
%
95% CIPPV
%
NPV
%
CIMT>0.40.690.0029889.4–99.941.224.6–59.37193.3
PWV>4.60.78<0.00017257.5–83.873.555.6–87.179.6164.1
AIx>310.640.024631.8–60.776.558.8–89.374.2249.13
SBP>1190.79<0.00016449.2–77.182.365.5–93.284.1360.81
DBP>840.530.623622.9–50.891.276.3–98.185.7349.23
MAP>102.50.670.0034430–58.785.368.9–9591.4750.9
cSBP>1060.86<0.00019078.2–96.767.649.5–82.680.3182.14
cDBP>760.710.00015035.5–64.582.365.5–93.280.5852.83
cPP>360.77<0.00017661.8–86.970.652.5–84.979.1566.68
Table 10. AUC-ROC analysis for each vascular biomarker, according to age groups, with the presence of obesity considered the pathological instance. The table depicts only the significant results of the analysis.
Age GroupVascular
Biomarker
Criterion
(Cut-Off)
AUCpSe
%
Sp
%
PPV
%
NPV
%
<12 yCIMT>0.40.830.000110061.581.42100
PWV>4.60.80.00172.7584.688.8564.73
SBP>1140.86<0.000190.969.283.2881.83
MAP>93.50.740.0190.961.581.2180.76
cSBP>1060.91<0.000195.4584.691.2791.67
cPP>340.88<0.000181.894.689.9673.35
12–15 yCIMT>0.460.84<0.000152.910010061.89
PWV>4.50.86<0.000194.169.28090
AIx>310.680.0652.992.39060
SBP>1240.710.0352.910010061.9
cSBP>1150.86<0.000164.710010068.4
cDBP>750.770.00164.784.684.664.7
cPP>360.710.0376.569.276.569.2
>15 yPWV>50.740.0481.862.57571.4
SBP>1260.820.000881.87581.875
cSBP>1230.88<0.000172.710010072.7
cDBP>790.760.0263.687.587.563.6
cPP>440.760.0363.610010066.7
Table 11. Correlations between the HOMA-IR and vascular markers (Spearman’s correlation) in all patients (n = 84).
CIMTPWVAIxSPBDBPMAPcSBPcDBPcPPHR
ρ0.440.640.40.630.430.60.590.470.340.22
p-value<0.0001<0.00010.0001<0.0001<0.0001<0.0001<0.0001<0.00010.0010.17
Table 12. Descriptive and comparative data regarding the HOMA-IR, according to Tanner stages.
Tanner StageGroupnBoysGirlsMean AgeSDAge LimitsHOMA-IR
Median Values
SDp-Value
1Obese12938.61.66–11 y1.853.90.01
Controls10647.61.426–10 y10.25
2
3
4
Obese2012811.61.69–15.5 y1.81.490.34
Controls1367121.529–14 y1.630.2
5Obese18612161.2614–18 y3.911.390.002
Controls1147161.2614–18 y2.20.35
Table 13. Correlations between HOMA-IR and the vascular markers, according to Tanner stages (Spearman’s correlations).
CIMTPWVAIxSPBDBPMAPcSBPcDBPcPPHR
Tanner 1
(n = 22)
ρ 0.390.610.560.670.450.640.660.430.520.16
p-value0.070.0020.0060.00070.030.010.00070.040.010.34
Tanner
2, 3, 4
(n = 33)
ρ 0.130.22−0.080.150.020.170.150.160.110.13
p-value0.460.20.620.40.90.320.370.370.520.27
Tanner 5
(n=29)
ρ0.310.660.430.680.570.70.680.660.230.09
p-value0.090.00010.02<0.00010.001<0.0001<0.00010.00010.220.45
The significant results in this table are in bold text.
Table 14. Number of obese subject distribution according to HOMA-IR cut-off values and the presence of acanthosis nigricans.
HOMA-IR
Cut-Off Values
in Obese Subjects
Puberty
Development
nn of Patients with HOMA-IR
>Cut-Off
Acanthosis
Nigricans Present in:
n Of Patients With HOMA-IR
<Cut-Off
Acanthosis Nigricans
Present in:
2.3Pre-pubertal125371
3.4Pubertal and
post-pubertal
381513237
Table 15. AUC-ROC analysis for each vascular biomarker, with the presence of acanthosis nigricans consideredthe pathological instance.
Criterion
(Cut-Off)
AUCpSe %95% CISp
%
95% CIPPV
%
NPV
%
CIMT>0.470.670.025029.1–70.988.469.8–97.686.3654.61
PWV>4.80.770.00017553.3–90.280.860.6–93.485.1468.74
AIx>280.580.3166.744.7–84.453.833.4–73.467.9552.37
SBP>1250.79<0.00017553.3–90.284.665.1–95.687.7369.72
DBP>720.730.00187.567.6–97.353.833.4–73.473.5674.55
MAP>970.82<0.000191.773–9965.444.3–82.879.5684.28
cSBP>1170.8>0.000170.848.9–87.480.860.6–93.484.4165.32
cDBP>740.70.00779.257.8–92.965.444.3–82.877.0768.15
cPP>430.60.2254.232.8–74.476.956.4–9177.5153.33
Table 16. Comparative data of the subgroups created according to the menstrual cycles for Tanner stage 5 girls.
Menstrual CyclesnMean HOMA-IRAcanthosis Nigricans
Present In:
BMI
kg/m2
WC
cm
WHR
ObeseRegular 63.433 girls33.451050.65
Irregular 64.85 girls40.561210.76
ControlsRegular 72.01No girl20.2970.140.42
Table 17. Comparisons between the values of vascular biomarkers of Tanner stage 5 obese girls with regular and irregular menses.
CIMTPWVAIxSPBDBPMAPcSBPcDBPcPP
Regular menses0.434.7628.16122.837799.91114.3377.3337
Irregular menses0.485.3837.16135.3389.33112.33126.8382.6644.16
p-value0.060.0020.090.0060.010.0030.0090.270.26
The significant results in this table are in bold text.
Table 18. Comparisons between the blood biomarkers in the obese vs. controls.
VariablesObese SubjectsNormal-Weight Subjects
Mean/MedianSDMean/MedianSDp-Value
Fasting glucose8112.7180.610.10.6
HDL-c42.77.954110.250.8
LDL-c109.833.8285.5524.860.04
TC174.2833.83160.7627.620.06
TG116.2745.158147.670.02
Non-HDL-c131.5636.62118.2627.920.07
LDL-c/HDL-c 2.371.272.50.770.67
TG/HDL-c2.911.4721.310.1
TC/HDL-c3.91.43.70.880.42
GPT30.515.072410.850.003
GOT2710.98218.740.005
Creatinine0.520.130.40.10.01
Uric acid4.91.443.880.740.0001
TSH3.51.873.470.880.77
FreeT414.991.6915.061.670.86
8 am cortisol17.225.09172.140.88
Ionized calcium3.930.434.10.20.009
25-OH-vitamin D19.849.93248.40.22
The significant results in this table are in bold text.
Table 19. Correlations between the blood parameters and the vascular biomarkers in obese children.
Correlations CIMTPWV AIx SBP DBP MAP cSBP cDBP cPP HR
Fasting glucose−0.19−0.110.050.040.210.16−0.0010.27−0.250.03
p-value0.170.530.690.770.130.260.990.060.070.89
Uric acid0.270.410.090.350.320.40.460.330.120.16
p-value0.050.020.530.010.020.040.00080.010.40.78
Creatinine0.140.240.090.140.010.080.160.020.150.04
p-value0.330.080.490.310.930.550.240.850.290.91
HDL-c−0.02−0.20.07−0.21−0.19−0.210.360.340.10.16
p-value0.860.150.620.140.160.130.020.010.420.64
LDL-c0.310.390.060.420.210.240.360.20.190.07
p-value0.030.020.650.020.090.070.030.160.160.94
Total
cholesterol
0.210.240.10.220.060.150.170.030.250.08
p-value0.270.150.520.080.90.270.240.870.140.69
TG0.270.470.160.320.150.220.380.090.060.04
p-value0.070.010.340.040.220.170.020.660.790.78
Non-HDL-c0.240.330.150.220.140.160.170.180.210.004
p-value0.090.030.320.120.330.350.260.220.130.96
LDL-c/HDL-c
ratio
0.140.170.050.120.220.160.090.230.080.18
p-value0.20.120.640.270.040.130.40.030.430.09
TG/HDL-c
ratio
0.190.230.110.180.090.120.150.190.080.01
p-value0.220.10.430.340.530.460.390.170.540.57
TC/HDL-c
ratio
0.10.040.10.040.170.10.050.240.23−0.07
p-value0.90.760.490.780.210.450.730.090.110.66
GPT0.310.480.160.350.550.440.190.20.210.21
p-value0.030.0010.190.030.0010.010.120.160.160.29
GOT0.090.250.020.310.420.370.170.160.28−0.13
p-value0.540.170.540.0040.0030.020.920.250.040.48
8 a.m. cortisol0.280.160.230.110.210.190.070.2−0.13−0.06
p-value0.040.250.10.410.120.170.610.150.360.72
TSH0.12−0.7−0.5−0.004−0.2−0.110.05−0.150.34−0.03
p-value0.40.630.70.970.140.440.710.30.040.88
FreeT40.170.160.080.160.060.130.090.10.020.09
p-value0.210.260.550.260.660.360.530.470.870.59
25-OH-
vitamin D
−0.190.41−0.090.370.440.430.350.420.10.12
p-value0.170.0030.510.0070.0010.0010.010.0020.470.65
Ionized
calcium
−0.20.350.010.380.350.390.390.32−0.030.11
p-value0.140.010.90.0060.010.0050.0040.020.80.28
The significant results in this table are in bold text.
Table 20. Multiple regression analysis for blood parameters and HOMA-IR as predictors of vascular biomarkers.
Dependent VariableIndependent
Variable
B
Coefficient
Beta
Coefficient
Std. Errortp-Value
CIMTuric acid0.0090.090.0032.680.008
PWVHOMA-IR0.10.410.024.4<0.0001
GPT0.0080.280.0032.740.007
uric acid0.070.190.032.210.02
AIxHOMA-IR1.370.270.522.950.004
SBPHOMA-IR3.360.510.536.3<0.0001
GPT0.180.310.072.440.01
DBPHOMA-IR1.920.370.464.150.0001
MAPHOMA-IR2.830.50.426.63<0.0001
cSBPHOMA-IR2.710.410.654.170.0001
GPT0.180.270.082.110.03
uric acid2.190.290.952.290.02
cDBPHOMA-IR2.150.370.464.63<0.0001
TC/HDL-c ratio1.871.720.742.510.01
cPPuric acid1.910.240.782.440.01
TG0.452.160.182.530.01
Disclaimer/Publisher’s Note: The statements, opinions and data contained in all publications are solely those of the individual author(s) and contributor(s) and not of MDPI and/or the editor(s). MDPI and/or the editor(s) disclaim responsibility for any injury to people or property resulting from any ideas, methods, instructions or products referred to in the content.