
Altered Auditory and Visual Evoked Potentials following Single and Repeated Low-Velocity Head Rotations in 4-Week-Old Swine
 , ,
, ,
Abstract
1. Introduction
2. Methods
2.1. Animal Subjects
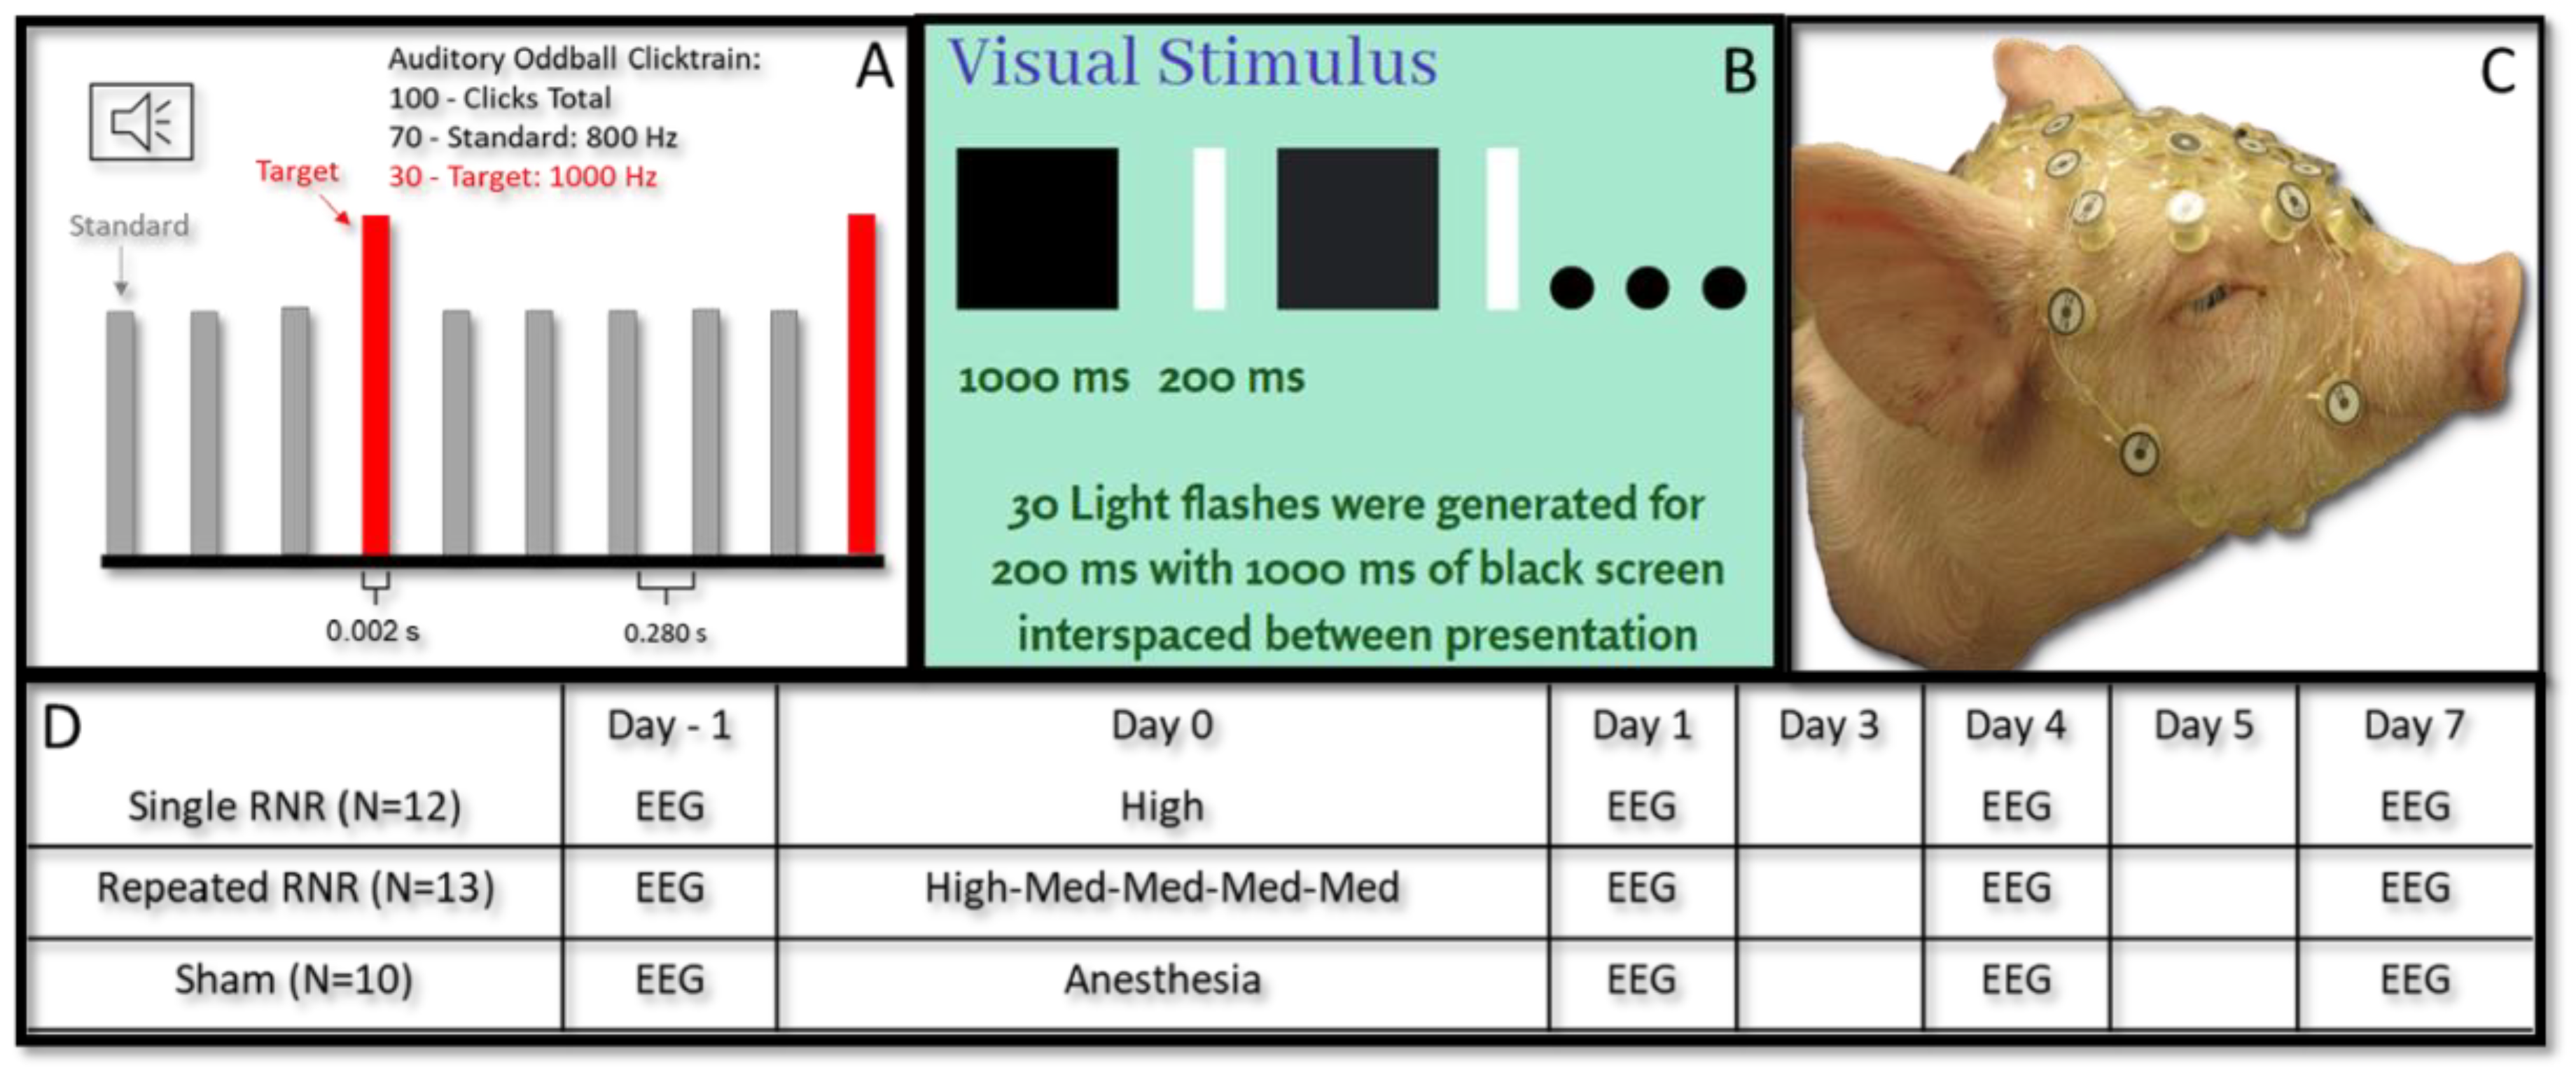
2.2. Rapid Non-Impact Rotational Injury (RNR)
2.3. Electroencephalography Measurements
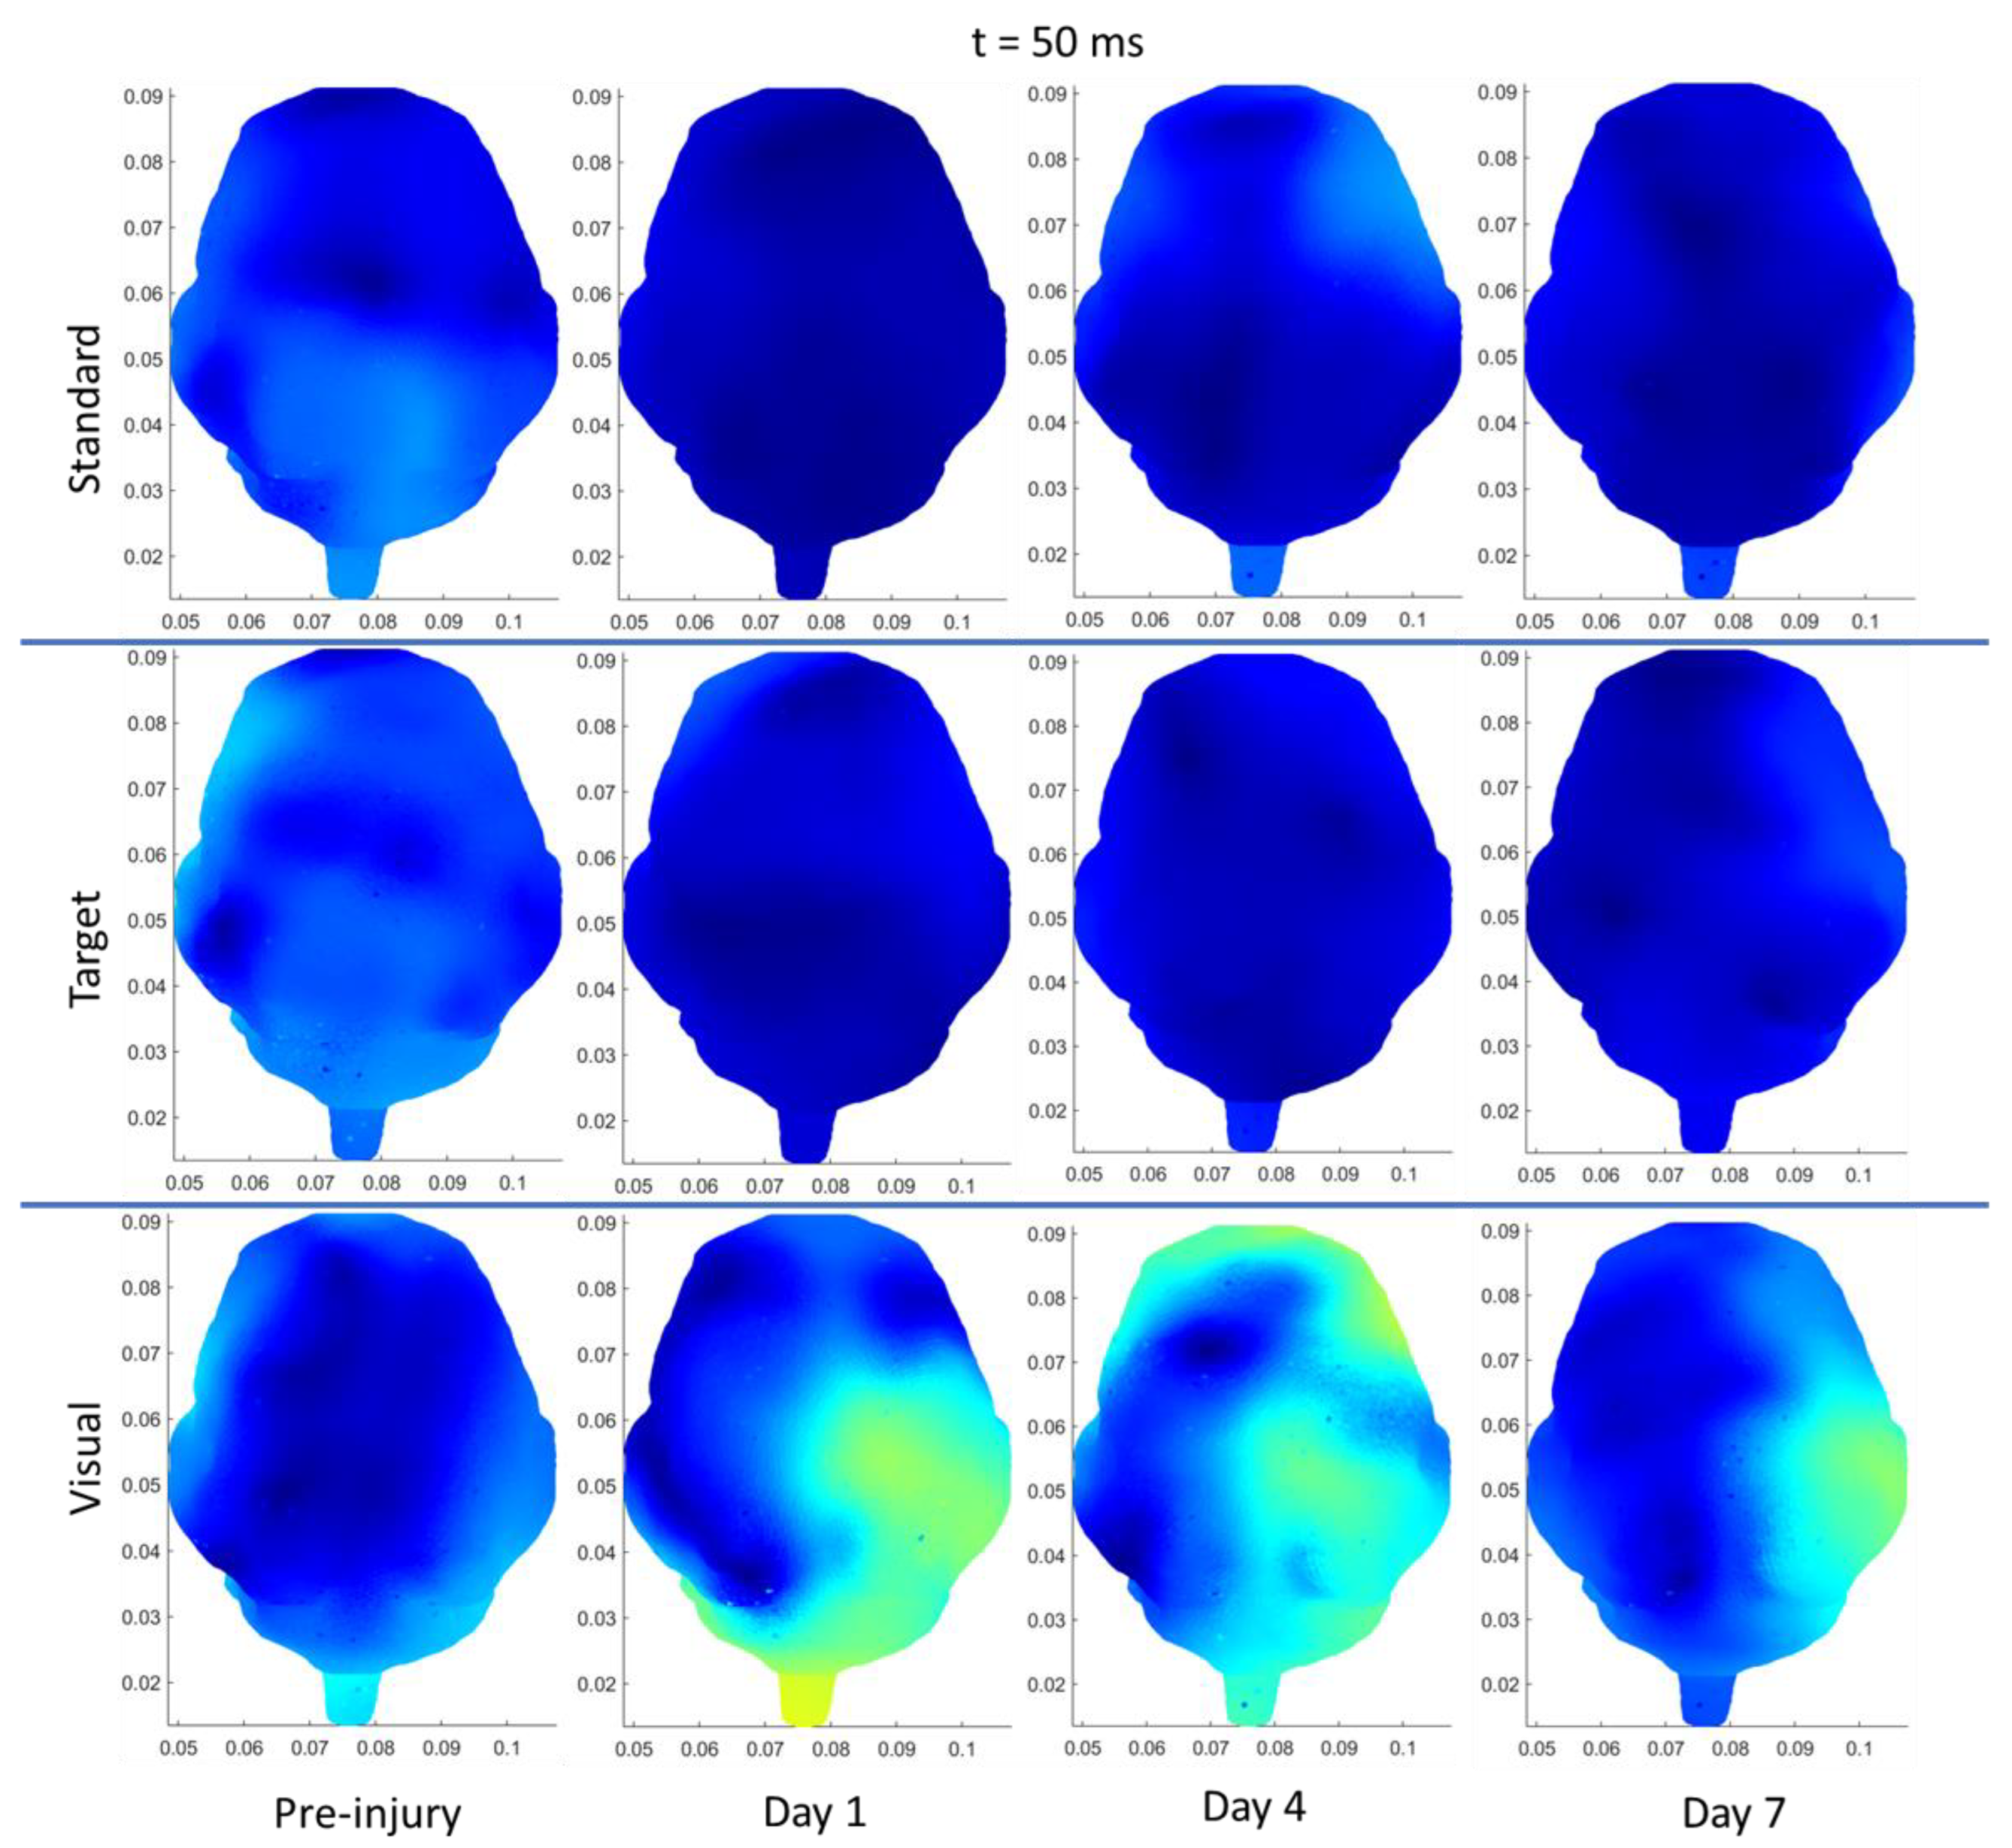
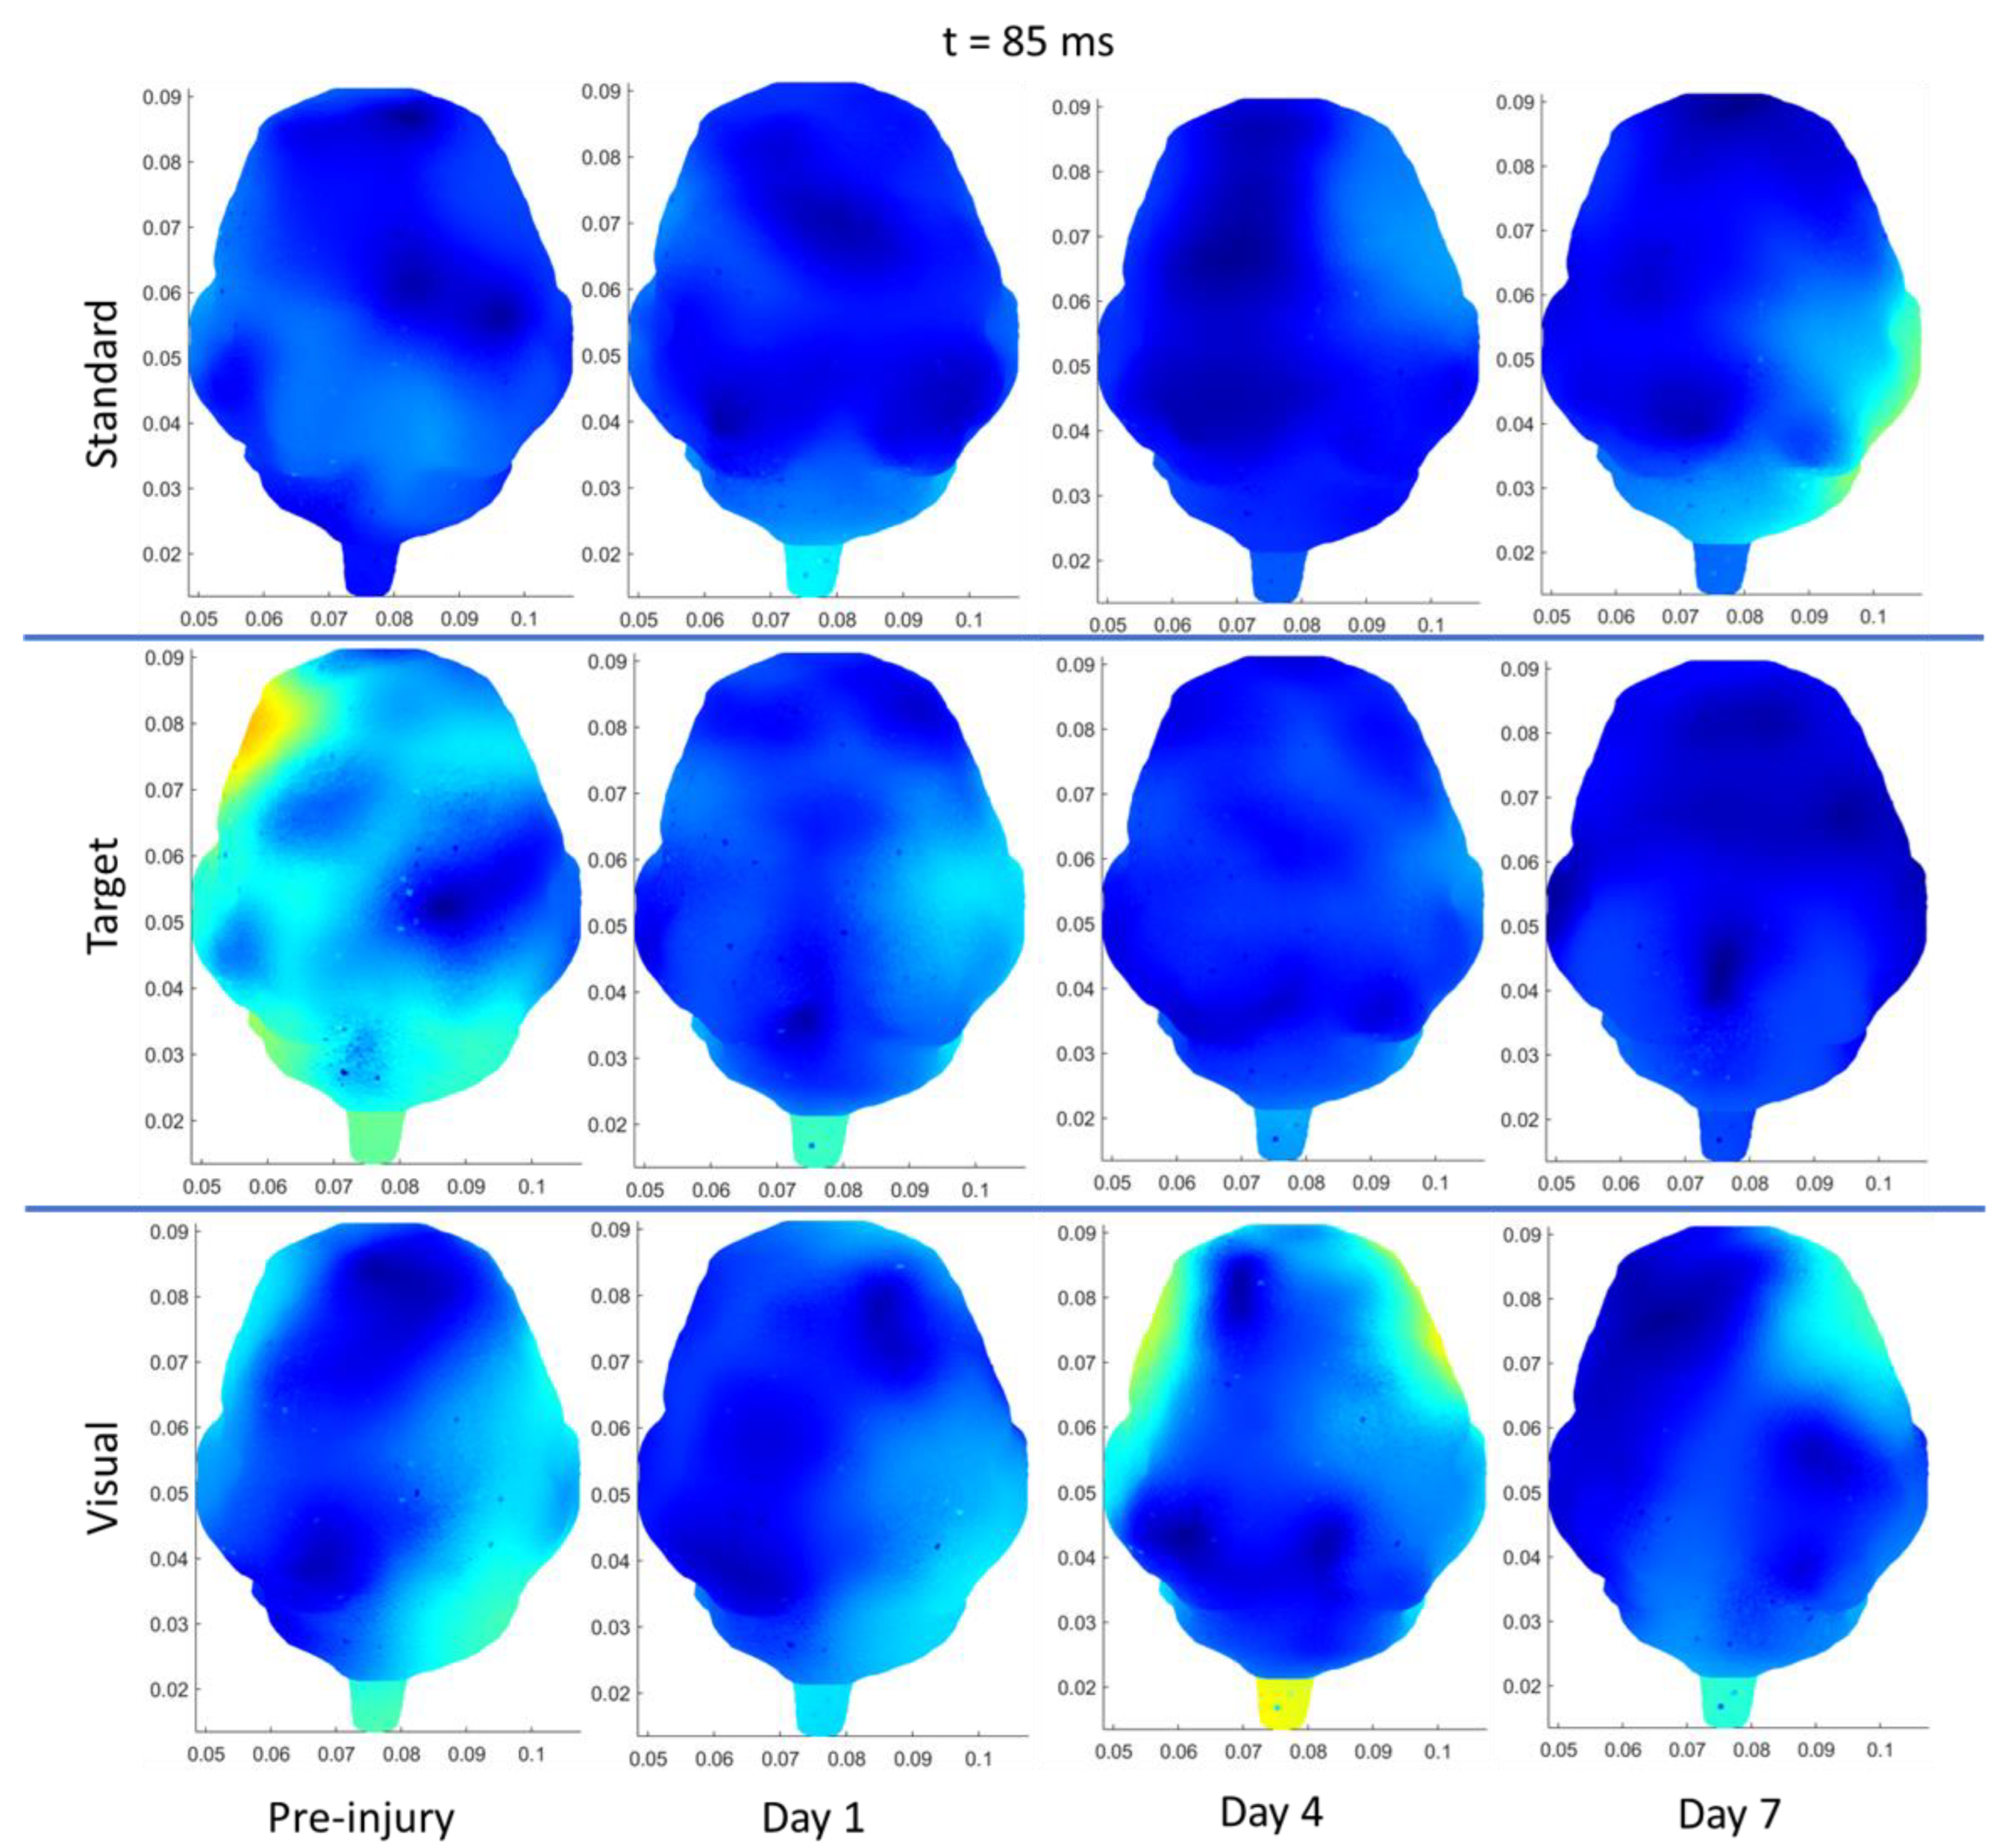
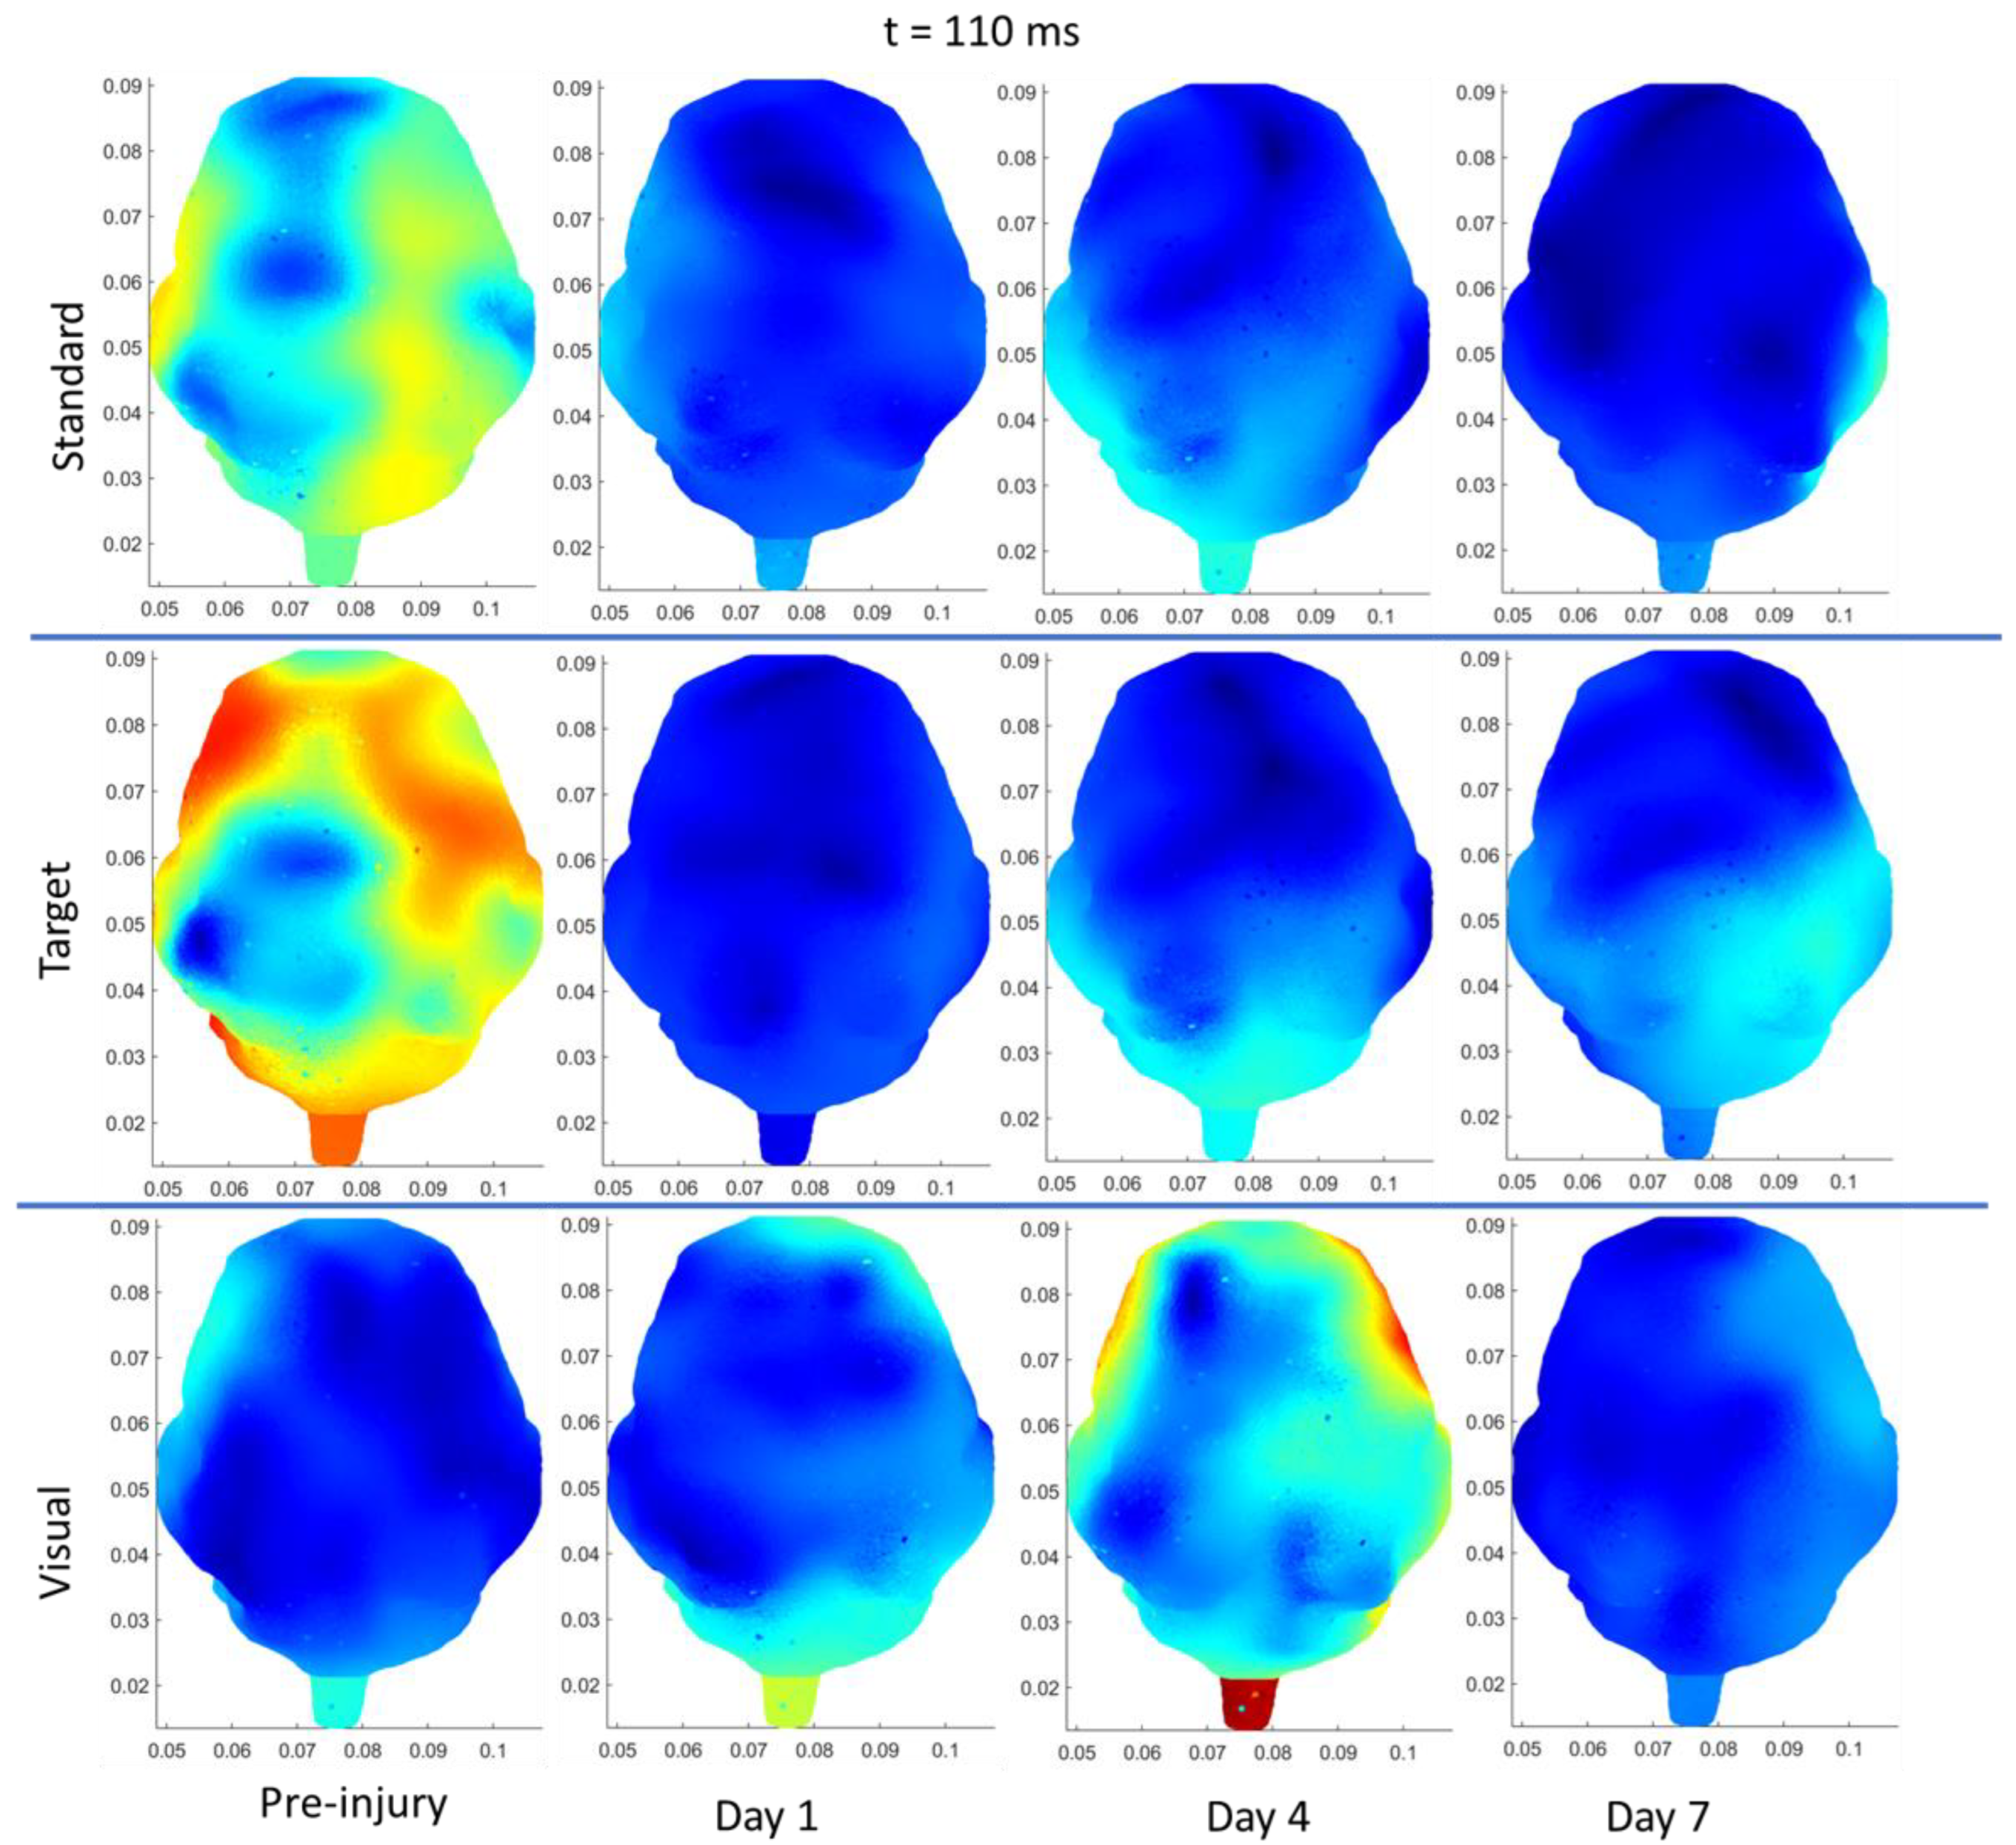
2.4. Source Localization
2.5. Statistics
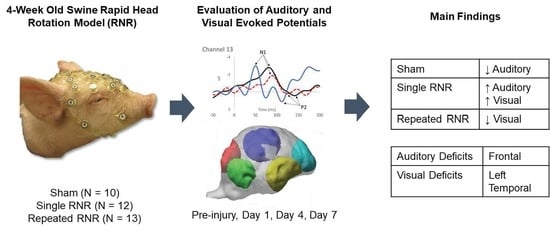
3. Results
3.1. Overview
3.2. Overall Group Differences


3.3. Within Group Differences
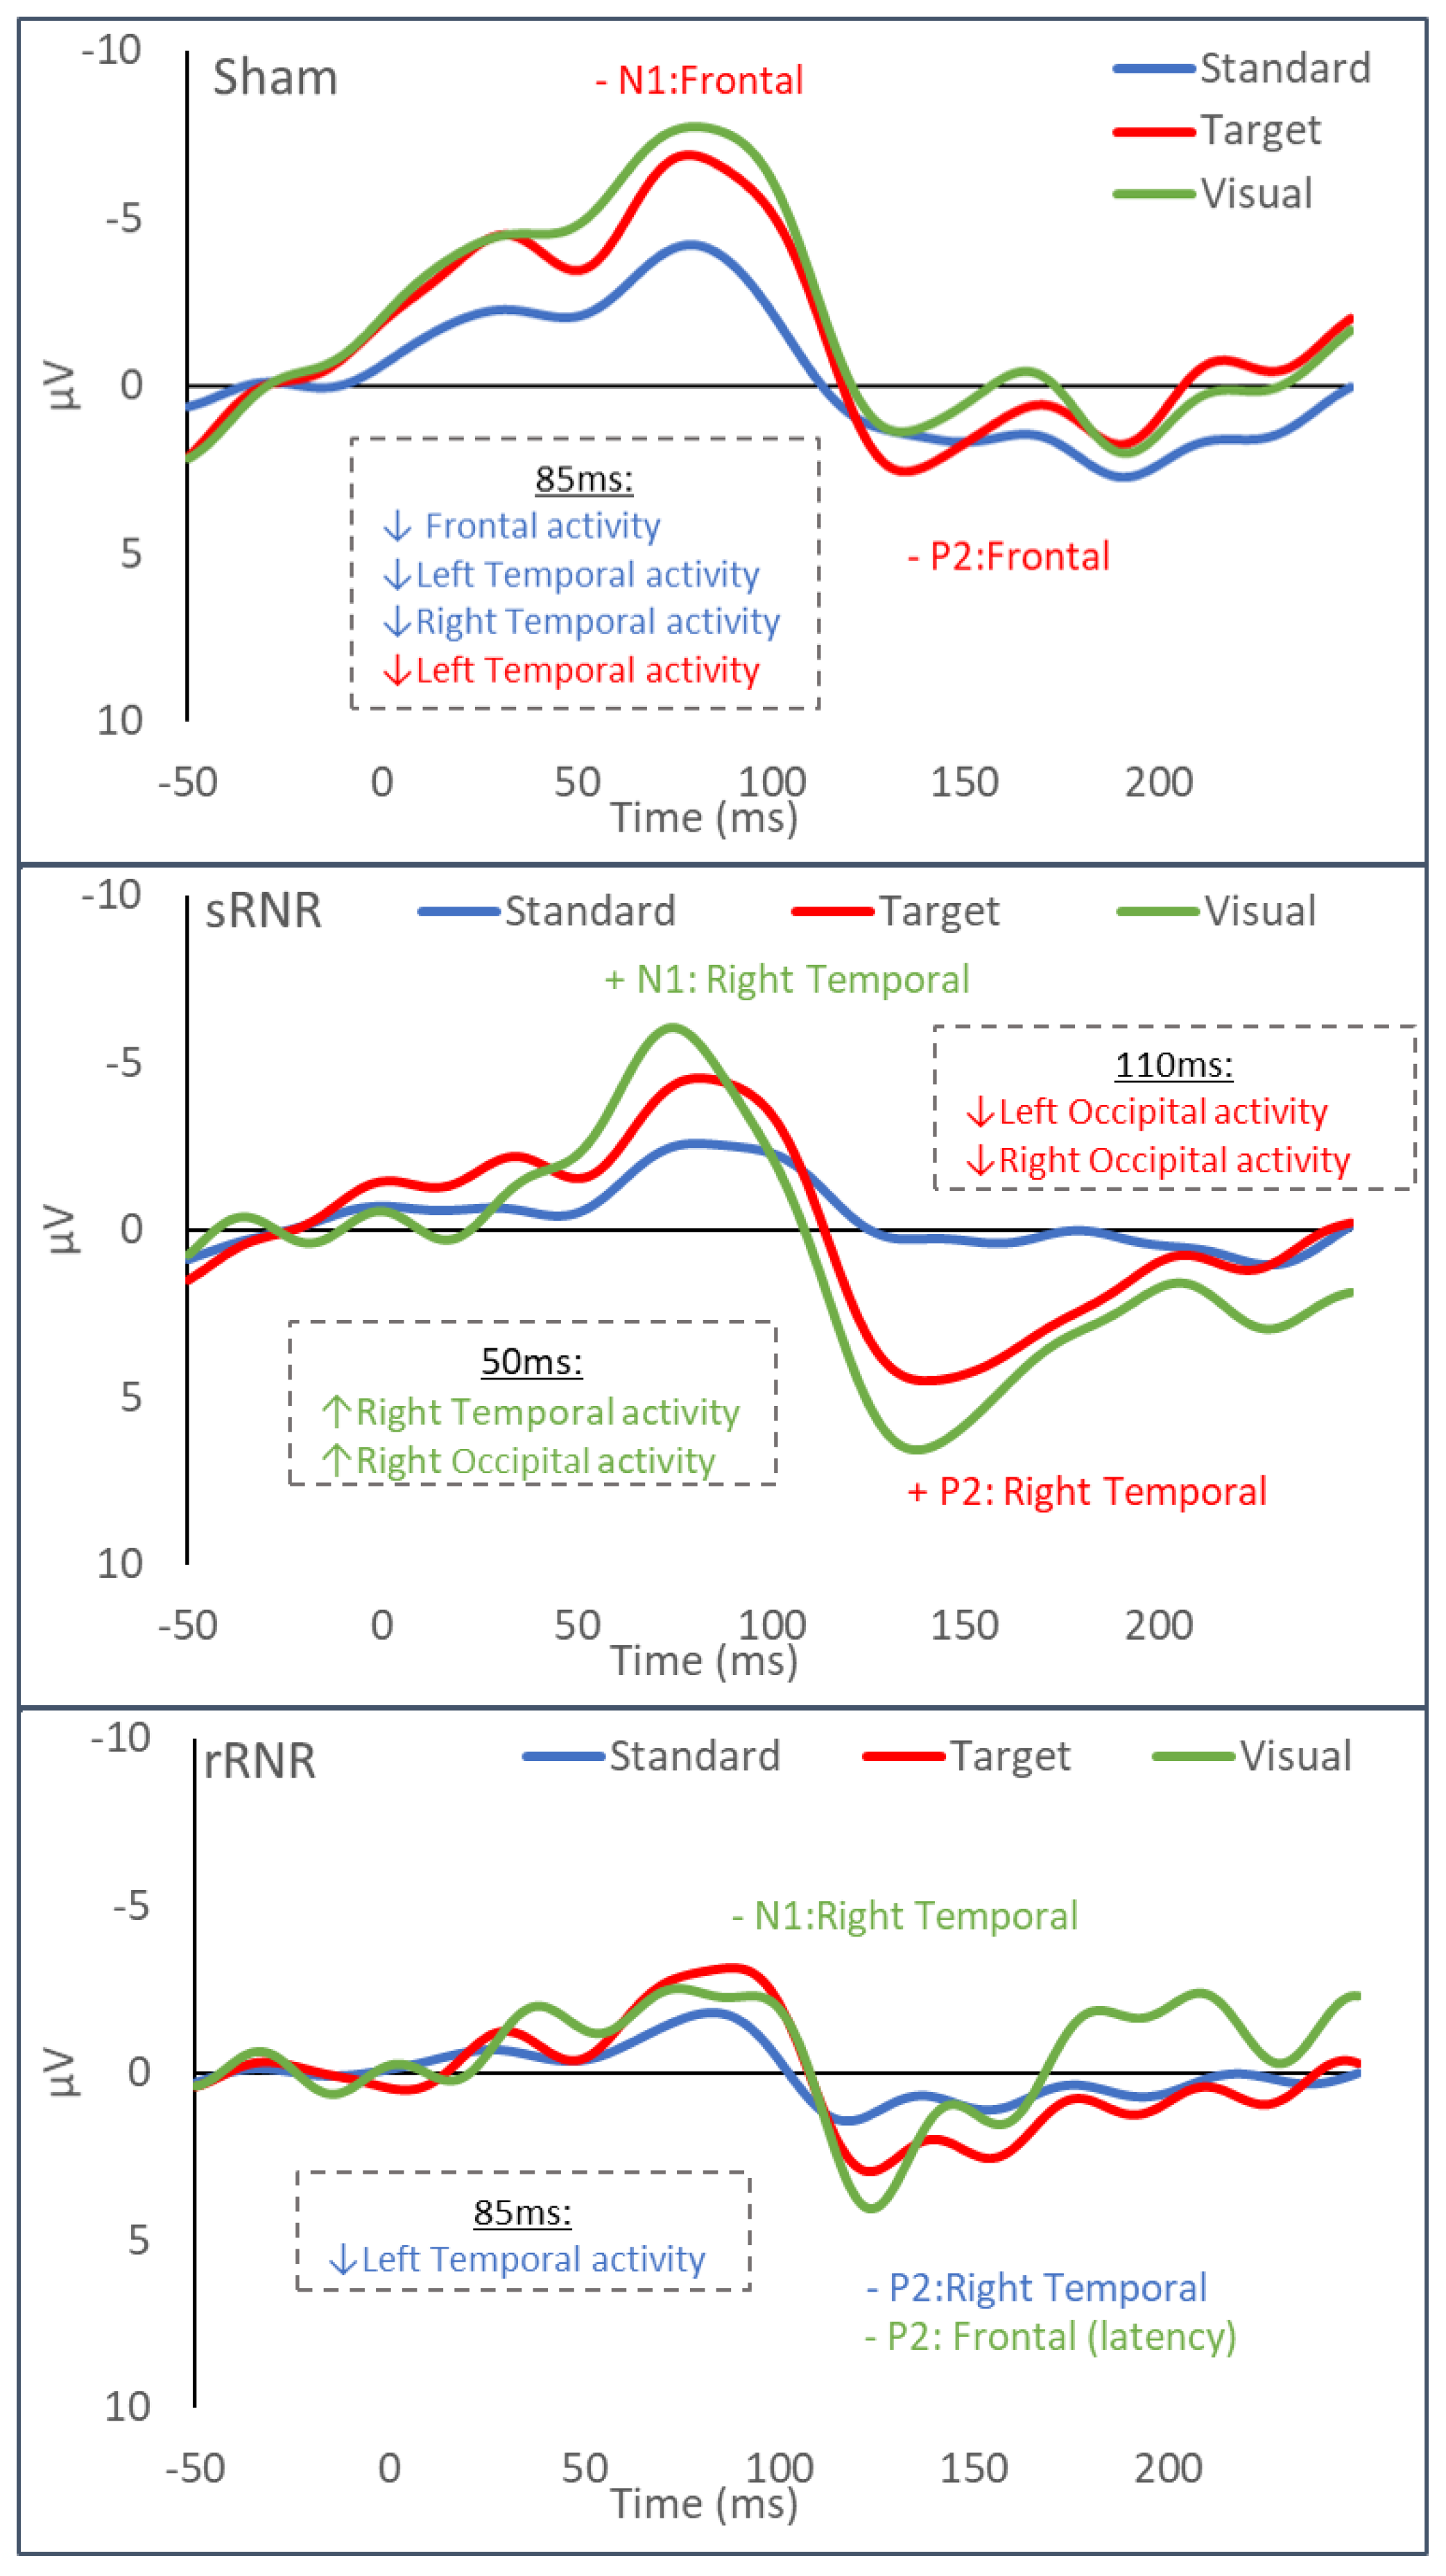
3.3.1. Sham–Anaesthesia Only

3.3.2. sRNR-Single


3.3.3. rRNR–Repeated
4. Discussion
5. Conclusions
Author Contributions
Funding
Institutional Review Board Statement
Informed Consent Statement
Data Availability Statement
Acknowledgments
Conflicts of Interest
References
- Coronado, V.G.; Haileyesus, T.; Cheng, T.A.; Bell, J.M.; Haarbauer-Krupa, J.; Lionbarger, M.R.; Flores-Herrera, J.; McGuire, L.C.; Gilchrist, J. Trends in Sports- and Recreation-Related Traumatic Brain Injuries Treated in US Emergency Departments: The National Electronic Injury Surveillance System-All Injury Program (NEISS-AIP) 2001–2012. J. Head Trauma Rehabil. 2015, 30, 185–197. [Google Scholar] [CrossRef] [PubMed]
- Langlois, J.A.; Rutland-Brown, W.; Wald, M.M. The epidemiology and impact of traumatic brain injury: A brief overview. J. Head Trauma Rehabil. 2006, 21, 375–378. [Google Scholar] [CrossRef]
- McCrory, P.; Meeuwisse, W.; Dvorak, J.; Aubry, M.; Bailes, J.; Broglio, S.; Cantu, R.C.; Cassidy, D.; Echemendia, R.J.; Castellani, R.J.; et al. Consensus statement on concussion in sport—The 5th international conference on concussion in sport held in Berlin, October 2016. Br. J. Sport. Med. 2017, 51, 838–847. [Google Scholar] [CrossRef]
- Giza, C.C.; Prins, M.L.; Hovda, D.A. It’s Not All Fun and Games: Sports, Concussions, and Neuroscience. Neuron 2017, 94, 1051–1055. [Google Scholar] [CrossRef]
- Giza, C.C.; Hovda, D.A. The new neurometabolic cascade of concussion. Neurosurgery 2014, 75 (Suppl. S4), S24–S33. [Google Scholar] [CrossRef] [PubMed]
- Lumba-Brown, A.; Yeates, K.O.; Sarmiento, K.; Breiding, M.J.; Haegerich, T.M.; Gioia, G.A.; Turner, M.; Benzel, E.C.; Suskauer, S.J.; Giza, C.C.; et al. Diagnosis and Management of Mild Traumatic Brain Injury in Children: A Systematic Review. JAMA Pediatr. 2018, 172, e182847. [Google Scholar] [CrossRef]
- Munjal, S.K.; Panda, N.K.; Pathak, A. Audiological Deficits After Closed Head Injury. J. Trauma 2010, 68, 13–18. [Google Scholar] [CrossRef]
- Vander Werff, K.R.; Rieger, B. Impaired auditory processing and neural representation of speech in noise among symptomatic post-concussion adults. Brain Inj. 2019, 33, 1320–1331. [Google Scholar] [CrossRef]
- Nandrajog, P.; Idris, Z.; Azlen, W.N.; Liyana, A.; Abdullah, J.M. The use of event-related potential (P300) and neuropsychological testing to evaluate cognitive impairment in mild traumatic brain injury patients. Asian J. Neurosurg. 2017, 12, 447–453. [Google Scholar] [CrossRef]
- Master, C.L.; Bacal, D.; Grady, M.F.; Hertle, R.; Shah, A.S.; Strominger, M.; Whitecross, S.; Bradford, G.E.; Lum, F.; Donahue, S.P. Vision and Concussion: Symptoms, Signs, Evaluation, and Treatment. Pediatrics 2022, 150, e2021056047. [Google Scholar] [CrossRef]
- Rose, S.C.; Weber, K.D.; Collen, J.B.; Heyer, G.L. The Diagnosis and Management of Concussion in Children and Adolescents. Pediatr. Neurol. 2015, 53, 108–118. [Google Scholar] [CrossRef] [PubMed]
- Kraus, N.; Thompson, E.C.; Krizman, J.; Cook, K.; White-Schwoch, T.; Labella, C.R. Auditory biological marker of concussion in children. Sci. Rep. 2016, 6, 39009. [Google Scholar] [CrossRef] [PubMed]
- Master, C.L.; Podolak, O.E.; Ciuffreda, K.J.; Metzger, K.B.; Joshi, N.R.; McDonald, C.C.; Margulies, S.S.; Grady, M.F.; Arbogast, K.B. Utility of Pupillary Light Reflex Metrics as a Physiologic Biomarker for Adolescent Sport-Related Concussion. JAMA Ophthalmol. 2020, 138, 1135–1141. [Google Scholar] [CrossRef]
- Luck, S.J.; Mathalon, D.H.; O’Donnell, B.F.; Hmlinen, M.S.; Spencer, K.M.; Javitt, D.C.; Uhlhaas, P.J. A roadmap for the development and validation of event-related potential biomarkers in schizophrenia research. Biol. Psychiatry 2011, 70, 28–34. [Google Scholar] [CrossRef] [PubMed]
- Rapp, P.E.; Keyser, D.O.; Albano, A.; Hernandez, R.; Gibson, D.B.; Zambon, R.A.; David Hairston, W.; Hughes, J.D.; Krystal, A.; Nichols, A.S. Traumatic brain injury detection using electrophysiological methods. Front. Hum. Neurosci. 2015, 9, 11. [Google Scholar] [CrossRef] [PubMed]
- Washnik, N.J.; Anjum, J.; Lundgren, K.; Phillips, S. A review of the role of auditory evoked potentials in mild traumatic brain injury assessment. Trends Hear. 2019, 23, 2331216519840094. [Google Scholar] [CrossRef]
- Näätänen, R.; Picton, T. The N1 wave of the human electric and magnetic response to sound: A review and an analysis of the component structure. Psychophysiology 1987, 24, 375–425. [Google Scholar] [CrossRef]
- Lascano, A.M.; Lalive, P.H.; Hardmeier, M.; Fuhr, P.; Seeck, M. Clinical evoked potentials in neurology: A review of techniques and indications. J. Neurol. Neurosurg. Psychiatry 2017, 88, 688–696. [Google Scholar] [CrossRef]
- Broglio, S.P.; Moore, R.D.; Hillman, C.H. A history of sport-related concussion on event-related brain potential correlates of cognition. Int. J. Psychophysiol. 2011, 82, 16–23. [Google Scholar] [CrossRef]
- Gosselin, N.; Thériault, M.; Leclerc, S.; Montplaisir, J.; Lassonde, M. Neurophysiological anomalies in symptomatic and asymptomatic concussed athletes. Neurosurgery 2006, 58, 1151–1160. [Google Scholar] [CrossRef]
- Gaetz, M.; Goodman, D.; Weinberg, H. Electrophysiological evidence for the cumulative effects of concussion. Brain Inj. 2000, 14, 1077–1088. [Google Scholar] [CrossRef]
- Bennys, K.; Busto, G.U.; Touchon, J. Cumulative effects of subsequent concussions on the neural patterns of young rugby athletes: Data from event-related potentials. Res. Sport. Med. 2023, 1–12. [Google Scholar] [CrossRef] [PubMed]
- Ledwidge, P.S.; Molfese, D.L. Long-Term Effects of Concussion on Electrophysiological Indices of Attention in Varsity College Athletes: An Event-Related Potential and Standardized Low-Resolution Brain Electromagnetic Tomography Approach. J. Neurotrauma 2016, 33, 2081–2090. [Google Scholar] [CrossRef]
- Fickling, S.D.; Smith, A.M.; Pawlowski, G.; Ghosh Hajra, S.; Liu, C.C.; Farrell, K.; Jorgensen, J.; Song, X.; Stuart, M.J.; D’Arcy, R.C.N. Brain vital signs detect concussion-related neurophysiological impairments in ice hockey. Brain J. Neurol. 2019, 142, 255–262. [Google Scholar] [CrossRef]
- Molfese, D.L. The Need for Theory to Guide Concussion Research. Dev. Neuropsychol. 2015, 40, 1–6. [Google Scholar] [CrossRef] [PubMed]
- Gomes, J.; Damborská, A. Event-Related Potentials as Biomarkers of Mild Traumatic Brain Injury. Act. Nerv. Super. 2017, 59, 87–90. [Google Scholar] [CrossRef]
- Ommaya, A.K.; Goldsmith, W.; Thibault, L. Biomechanics and neuropathology of adult and paediatric head injury. Br. J. Neurosurg. 2002, 16, 220–242. [Google Scholar] [CrossRef] [PubMed]
- Silva, L.A.F.; Magliaro, F.C.L.; Carvalho, A.C.M.; Matas, C.G. Cortical maturation of long latency auditory evoked potentials in hearing children: The complex P1-N1-P2-N2. CoDAS 2017, 29, e20160216. [Google Scholar] [CrossRef] [PubMed]
- Fitzroy, A.B.; Krizman, J.; Tierney, A.; Agouridou, M.; Kraus, N. Longitudinal maturation of auditory cortical function during adolescence. Front. Hum. Neurosci. 2015, 9, 530. [Google Scholar] [CrossRef]
- Lightfoot, G. Summary of the N1-P2 Cortical Auditory Evoked Potential to Estimate the Auditory Threshold in Adults. Semin. Hear. 2016, 37, 1–8. [Google Scholar] [CrossRef] [PubMed]
- Baillargeon, A.; Lassonde, M.; Leclerc, S.; Ellemberg, D. Neuropsychological and neurophysiological assessment of sport concussion in children, adolescents and adults. Brain Inj. 2012, 26, 211–220. [Google Scholar] [CrossRef] [PubMed]
- Margulies, S.S.; Kilbaugh, T.; Sullivan, S.; Smith, C.; Propert, K.; Byro, M.; Saliga, K.; Costine, B.A.; Duhaime, A.C. Establishing a clinically relevant large animal model platform for TBI therapy development: Using cyclosporin a as a case study. Brain Pathol. 2015, 25, 289–303. [Google Scholar] [CrossRef] [PubMed]
- Sullivan, S.; Friess, S.H.; Ralston, J.; Smith, C.; Propert, K.J.; Rapp, P.E.; Margulies, S.S. Behavioral Deficits and Axonal Injury Persistence after Rotational Head Injury Are Direction Dependent. J. Neurotrauma 2013, 30, 538–545. [Google Scholar] [CrossRef]
- Atlan, L.S.; Lan, I.S.; Smith, C.; Margulies, S.S. Changes in event-related potential functional networks predict traumatic brain injury in piglets. Clin. Biomech. 2018, 64, 14–21. [Google Scholar] [CrossRef]
- Fang, M.; Li, J.; Rudd, J.A.; Wai, S.M.; Yew, J.C.C.; Yew, D.T. fMRI Mapping of cortical centers following visual stimulation in postnatal pigs of different ages. Life Sci. 2006, 78, 1197–1201. [Google Scholar] [CrossRef]
- Barrow, P. Use of the swine pediatric model. In Pediatric Non-Clinical Drug Testing: Principles, Requirements, and Practice; Hoberman, A.M., Lewis, E.M., Eds.; John Wiley & Sons, Inc.: Hoboken, NJ, USA, 2012; pp. 213–229. [Google Scholar]
- Barrow, P. Toxicology testing for products intended for pediatric populations. In Nonclinical Drug Safety Assessment: Practical Considerations for Successful Registration; Sietsema, W.K., Schwen, R., Eds.; FDA News: Washington, DC, USA, 2007; pp. 411–440. [Google Scholar]
- Weeks, D.; Sullivan, S.; Kilbaugh, T.; Smith, C.; Margulies, S.S. Influences of developmental age on the resolution of diffuse traumatic intracranial hemorrhage and axonal injury. J. Neurotrauma 2014, 31, 206–214. [Google Scholar] [CrossRef] [PubMed]
- Ryan, M.C.; Kochunov, P.; Sherman, P.M.; Rowland, L.M.; Wijtenburg, S.A.; Acheson, A.; Hong, L.E.; Sladky, J.; McGuire, S. Miniature pig magnetic resonance spectroscopy model of normal adolescent brain development. J. Neurosci. Methods 2018, 308, 173–182. [Google Scholar] [CrossRef] [PubMed]
- Finnie, J. Comparative approach to understanding traumatic injury in the immature, postnatal brain of domestic animals. Aust. Vet. J. 2012, 90, 301–307. [Google Scholar] [CrossRef] [PubMed]
- Cullen, D.K.; Harris, J.P.; Browne, K.D.; Wolf, J.A.; Duda, J.E.; Meaney, D.F.; Margulies, S.S.; Smith, D.H. A porcine model of traumatic brain injury via head rotational acceleration. Methods Mol. Biol. 2016, 1462, 289–324. [Google Scholar] [CrossRef]
- Raghupathi, R.; Margulies, S.S. Traumatic axonal injury after closed head injury in the neonatal pig. J. Neurotrauma 2002, 19, 843–853. [Google Scholar] [CrossRef]
- Friess, S.H.; Ichord, R.N.; Owens, K.; Ralston, J.; Rizol, R.; Overall, K.L.; Smith, C.; Helfaer, M.A.; Margulies, S.S. Neurobehavioral functional deficits following closed head injury in the neonatal pig. Exp. Neurol. 2007, 204, 234–243. [Google Scholar] [CrossRef] [PubMed]
- Friess, S.H.; Ichord, R.N.; Ralston, J.; Ryall, K.; Helfaer, M.A.; Smith, C.; Margulies, S.S. Repeated traumatic brain injury affects composite cognitive function in piglets. J. Neurotrauma 2009, 26, 1111–1121. [Google Scholar] [CrossRef]
- Coats, B.; Binenbaum, G.; Smith, C.; Peiffer, R.L.; Christian, C.W.; Duhaime, A.C.; Margulies, S.S. Cyclic head rotations produce modest brain injury in infant piglets. J. Neurotrauma 2017, 34, 235–247. [Google Scholar] [CrossRef] [PubMed]
- Oeur, R.A.; Margulies, S.S. Target detection in healthy 4-week old piglets from a passive two-tone auditory oddball paradigm. BMC Neurosci. 2020, 21, 52. [Google Scholar] [CrossRef]
- Oeur, R.A.; Palaniswamy, M.; Ha, M.; Fernandez-Corazza, M.; Margulies, S.S. Regional variations distinguish auditory from visual evoked potentials in healthy 4 week old piglets. Physiol. Meas. 2023, 44, 025006. [Google Scholar] [CrossRef]
- Mull, M.; Aderibigbe, O.; Hajiaghamemar, M.; Oeur, R.A.; Margulies, S.S. Multiple Head Rotations Result in Persistent Gait Alterations in Piglets. Biomedicines 2022, 10, 2976. [Google Scholar] [CrossRef]
- Oeur, A.; Mull, M.; Riccobono, G.; Arbogast, K.B.; Ciuffreda, K.J.; Joshi, N.; Fedonni, D.; Master, C.L.; Margulies, S.S. Pupillary Light Response Deficits in 4-Week-Old Piglets and Adolescent Children after Low-Velocity Head Rotations and Sports-Related Concussions. Biomedicines 2023, 11, 587. [Google Scholar] [CrossRef] [PubMed]
- Hajiaghamemar, M.; Seidi, M.; Oeur, R.A.; Margulies, S.S. Toward development of clinically translatable diagnostic and prognostic metrics of traumatic brain injury using animal models: A review and a look forward. Exp. Neurol. 2019, 318, 101–123. [Google Scholar] [CrossRef]
- Eucker, S.A.; Smith, C.; Ralston, J.; Friess, S.H.; Margulies, S.S. Physiological and histopathological responses following closed rotational head injury depend on direction of head motion. Exp. Neurol. 2011, 227, 79–88. [Google Scholar] [CrossRef]
- Raghupathi, R.; Mehr, M.F.; Helfaer, M.A.; Margulies, S.S. Traumatic Axonal Injury is Exacerbated following Repetitive Closed Head Injury in the Neonatal Pig. J. Neurotrauma 2004, 21, 307–316. [Google Scholar] [CrossRef]
- Hajiaghamemar, M.; Seidi, M.; Patton, D.; Huber, C.; Arbogast, K.B.; Master, C.L.; Margulies, S.S. Using On-Field Human Head Kinematics to Guide Study Design for Animal-Model Based Traumatic Brain Injury. In Proceedings of the National Biomedical Engineering Society (BMES) Annual Meeting, Virtual, 14–17 October 2020. [Google Scholar]
- Wu, T.; Hajiaghamemar, M.; Giudice, J.S.; Alshareef, A.; Margulies, S.S.; Panzer, M.B. Evaluation of Tissue-Level Brain Injury Metrics Using Species-Specific Simulations. J. Neurotrauma 2021, 38, 1879–1888. [Google Scholar] [CrossRef]
- Atlan, L.S.; Margulies, S. Frequency-Dependent Changes in Resting State EEG Functional Networks After Traumatic Brain Injury in Piglets. J. Neurotrauma 2019, 36, 2558–2578. [Google Scholar] [CrossRef]
- Delorme, A.; Makeig, S. EEGLAB: An open source toolbox for analysis of single-trial EEG dynamics including independent component analysis. J. Neurosci. Methods 2004, 134, 9–21. [Google Scholar] [CrossRef] [PubMed]
- Onton, J.; Westerfield, M.; Townsend, J.; Makeig, S. Imaging human EEG dynamics using independent component analysis. Neurosci. Biobehav. Rev. 2006, 30, 808–822. [Google Scholar] [CrossRef] [PubMed]
- Makeig, S.; Onton, J. ERP features and EEG dynamics: An ICA perspective. In The Oxford Handbook of ERP Components; Luck, S.J., Kappenman, E.S., Eds.; Oxford University Press: New York, NY, USA, 2012; pp. 51–86. [Google Scholar]
- Fernandez-Corazza, M.; Sadleir, R.; Turovets, S.; Tucker, D. MRI Piglet Head Model for EIT and IVH Simulation. In Proceedings of the 17th Conference on Electrical Impedance Tomography, Stockholm, Sweden, 19–23 June 2016. [Google Scholar]
- Fang, Q.; Boas, D.A. Tetrahedral mesh generation from volumetric binary and grayscale images. In Proceedings of the 2009 IEEE International Symposium on Biomedical Imaging: From Nano to Macro, Boston, MA, USA, 28 June–1 July 2009. [Google Scholar]
- Von Ellenrieder, N.; Beltrachini, L.; Blenkman, A.; Fernandez-Corrazza, M.; Kochen, S.; Muravchik, C.H. A Robust Photogrammetry Method to Measure Electrode Positions. 2013; Unpublished work. [Google Scholar]
- Pascual-Marqui, R.D. Standardized low-resolution brain electromagnetic tomography (sLORETA): Technical details. Methods Find. Exp. Clin. Pharmacol. 2002, 24 (Suppl. D), 5–12. [Google Scholar]
- Sekihara, K.; Nagarajan, S.S. Adaptive spatial filters. In Adaptive Spatial Filters for Electromagnetic Brain Imaging; Sekihara, K., Nagarajan, S.S., Eds.; Springer: Berlin/Heidelberg, Germany, 2008; pp. 37–63. [Google Scholar]
- Van Hooff, J.C.; de Beer, N.A.M.; Brunia, C.H.M.; Cluitmans, P.J.M.; Korsten, H.H.M. Event-related potential measures of information processing during general anesthesia. Electroencephalogr. Clin. Neurophysiol. 1997, 103, 268–281. [Google Scholar] [CrossRef] [PubMed]
- Mortazavi, M.; Lucini, F.A.; Joffe, D.; Oakley, D.S. Electrophysiological trajectories of concussion recovery: From acute to prolonged stages in late teenagers. J. Pediatr. Rehabil. Med. 2023, 16, 287–299. [Google Scholar] [CrossRef]
- Clayton, G.; Davis, N.; Holliday, A.; Joffe, D.; Oakley, D.S.; Palermo, F.X.; Poddar, S.; Rueda, M. In-clinic event related potentials after sports concussion: A 4-year study. J. Pediatr. Rehabil. Med. 2020, 13, 81–92. [Google Scholar] [CrossRef]
- Gosselin, N.; Erg, C.B.; Chen, J.K.; Huntgeburth, S.C.; Beaumont, L.D.; Petrides, M.; Cheung, B.; Ptito, A. Evaluating the cognitive consequences of mild traumatic brain injury and concussion by using electrophysiology. Neurosurg. Focus 2012, 33, E7. [Google Scholar] [CrossRef]
- Gosselin, N.; Bottari, C.; Chen, J.-K.; Petrides, M.; Tinawi, S.; De Guise, É.; Ptito, A. Electrophysiology and Functional MRI in Post-Acute Mild Traumatic Brain Injury. J. Neurotrauma 2011, 28, 329–341. [Google Scholar] [CrossRef]
- Mäki-Marttunen, V.; Kuusinen, V.; Brause, M.; Peräkylä, J.; Polvivaara, M.; dos Santos Ribeiro, R.; Öhman, J.; Hartikainen, K.M. Enhanced attention capture by emotional stimuli in mild traumatic brain injury. J. Neurotrauma 2015, 32, 272–279. [Google Scholar] [CrossRef] [PubMed]
- Carrier-Toutant, F.; Guay, S.; Beaulieu, C.; Léveillé, E.; Turcotte-Giroux, A.; Papineau, S.D.; Brisson, B.; D’Hondt, F.; De Beaumont, L. Effects of Repeated Concussions and Sex on Early Processing of Emotional Facial Expressions as Revealed by Electrophysiology. J. Int. Neuropsychol. Soc. 2018, 24, 673–683. [Google Scholar] [CrossRef] [PubMed]


| Load Level | Angular Velocity (rad/s) | Angular Acceleration (rad/s2) | |
|---|---|---|---|
| sRNR | High | 104 ± 0.495 | 36,900 ± 1120 |
| rRNR | Medium | 61.2 ± 0.182 | 14,900 ± 175 |
| High | 104 ± 0.414 | 38,300 ± 533 |
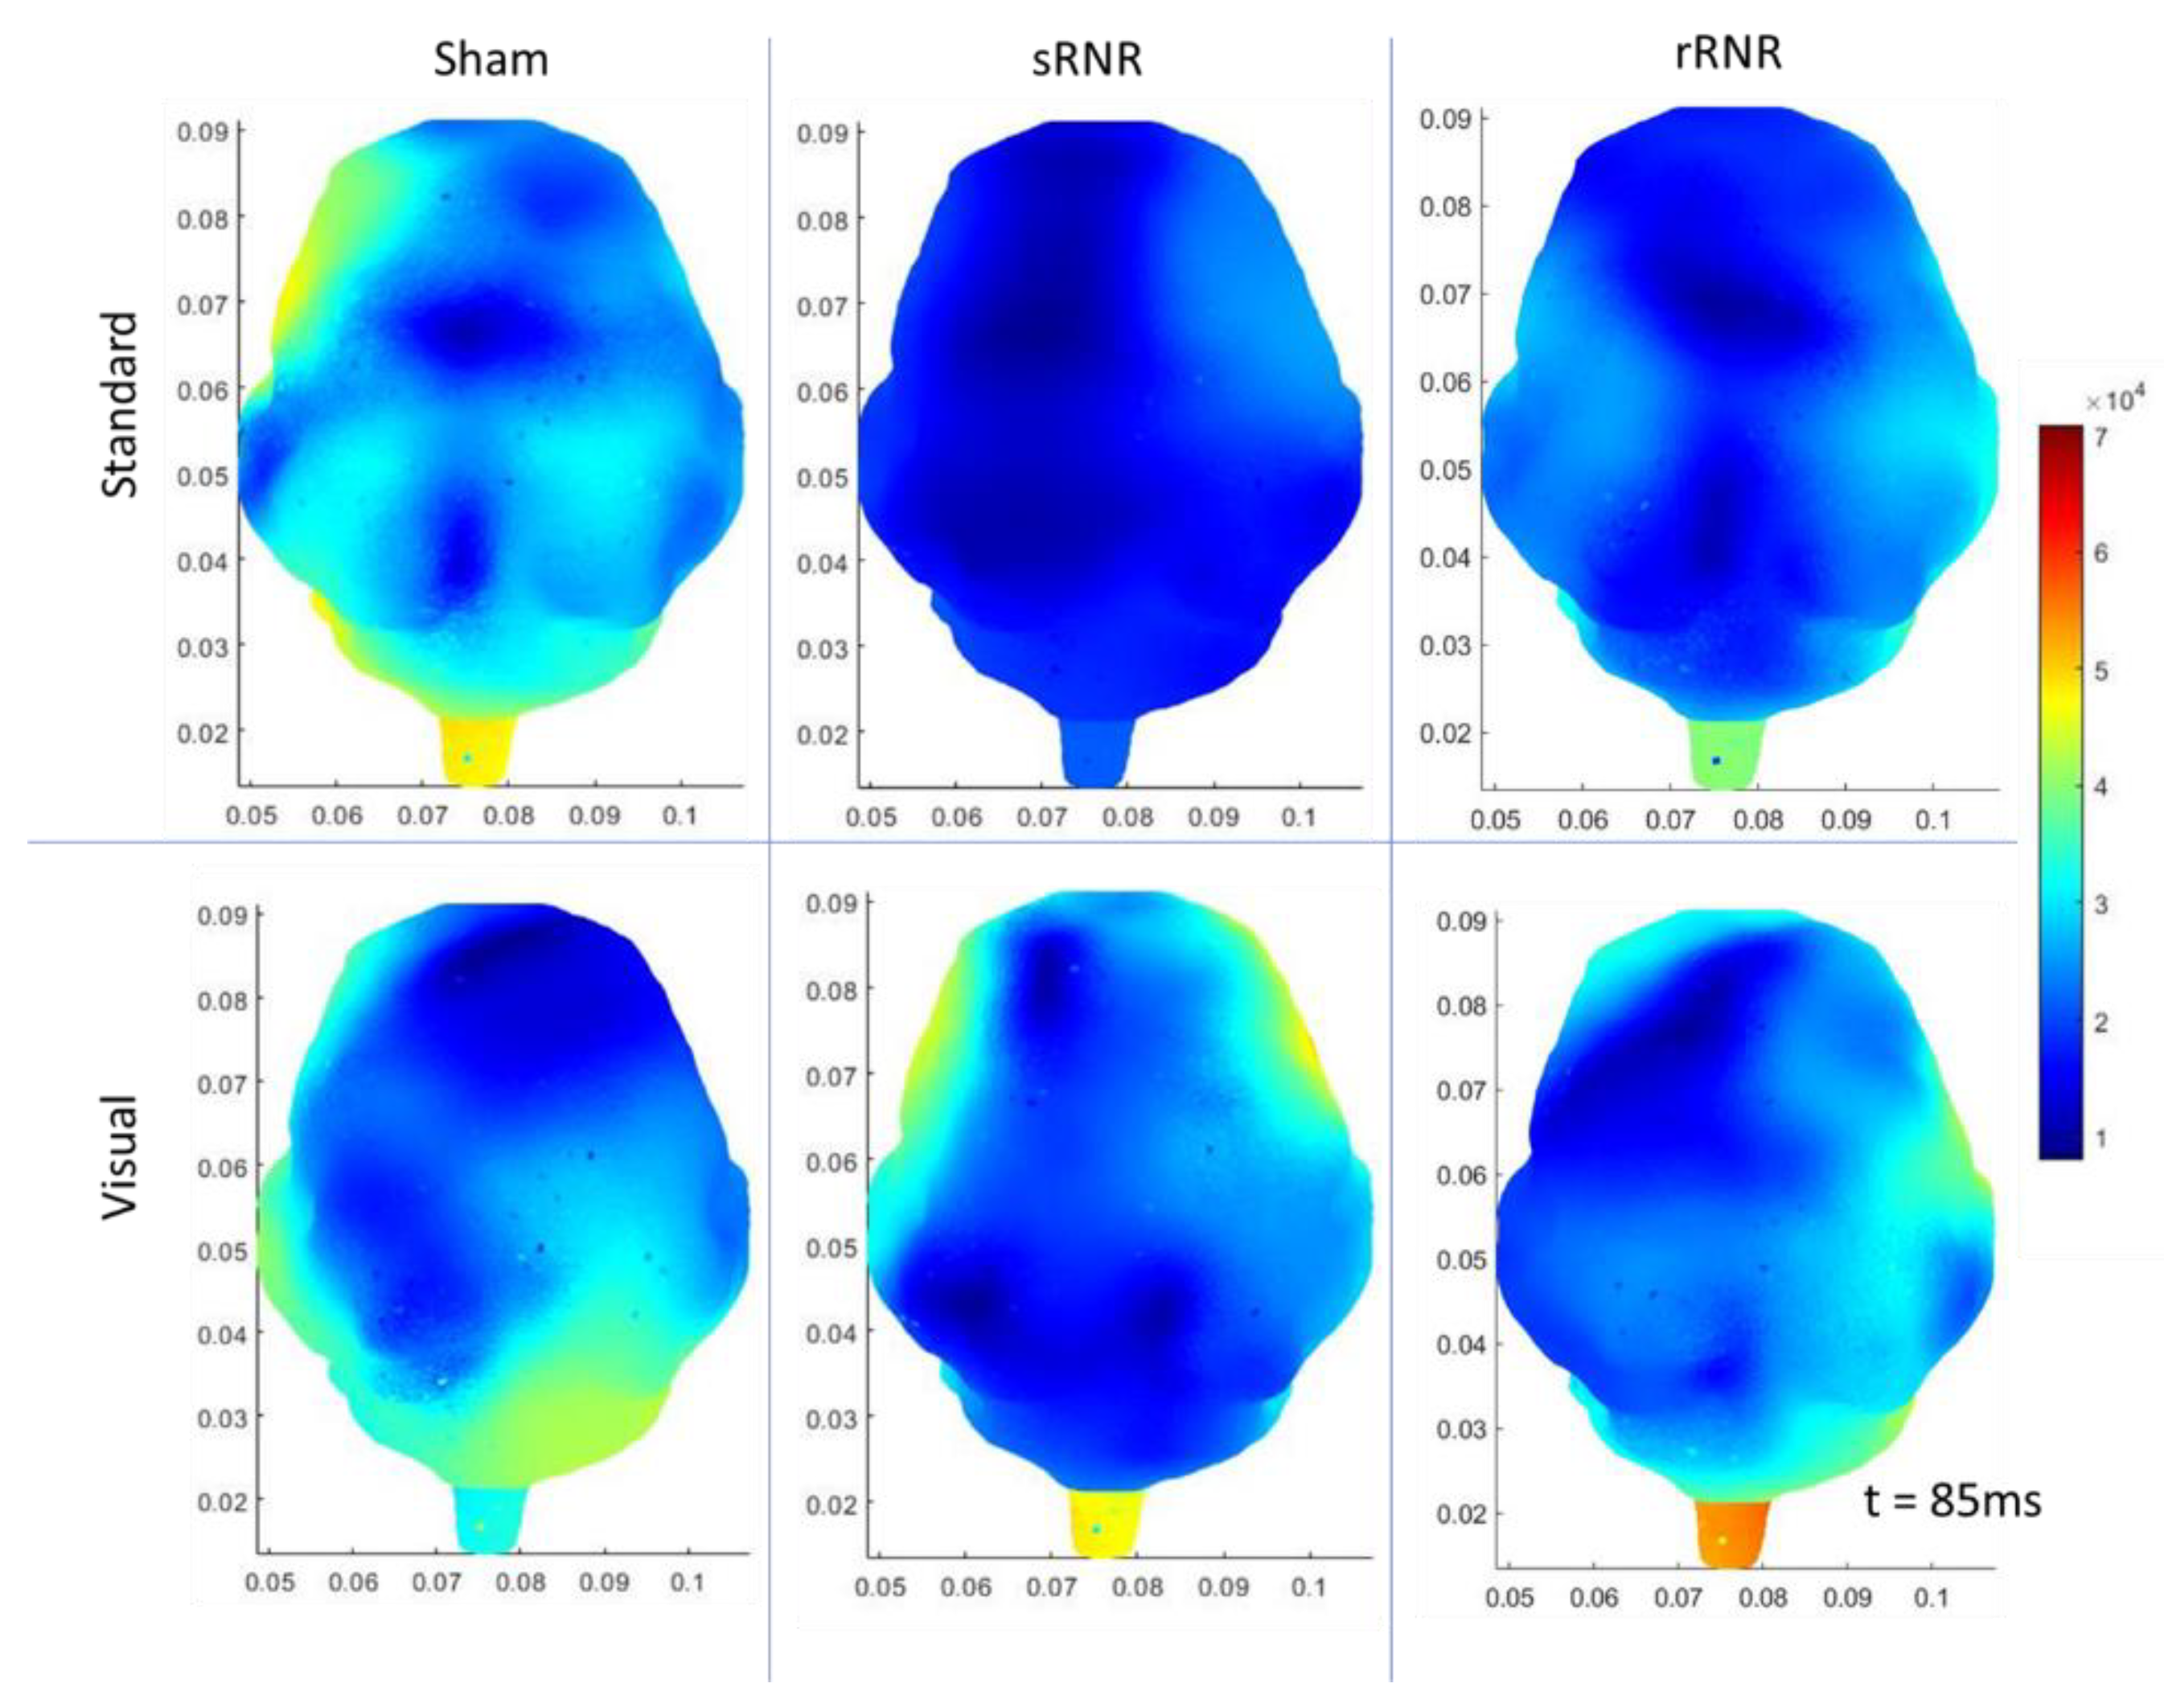
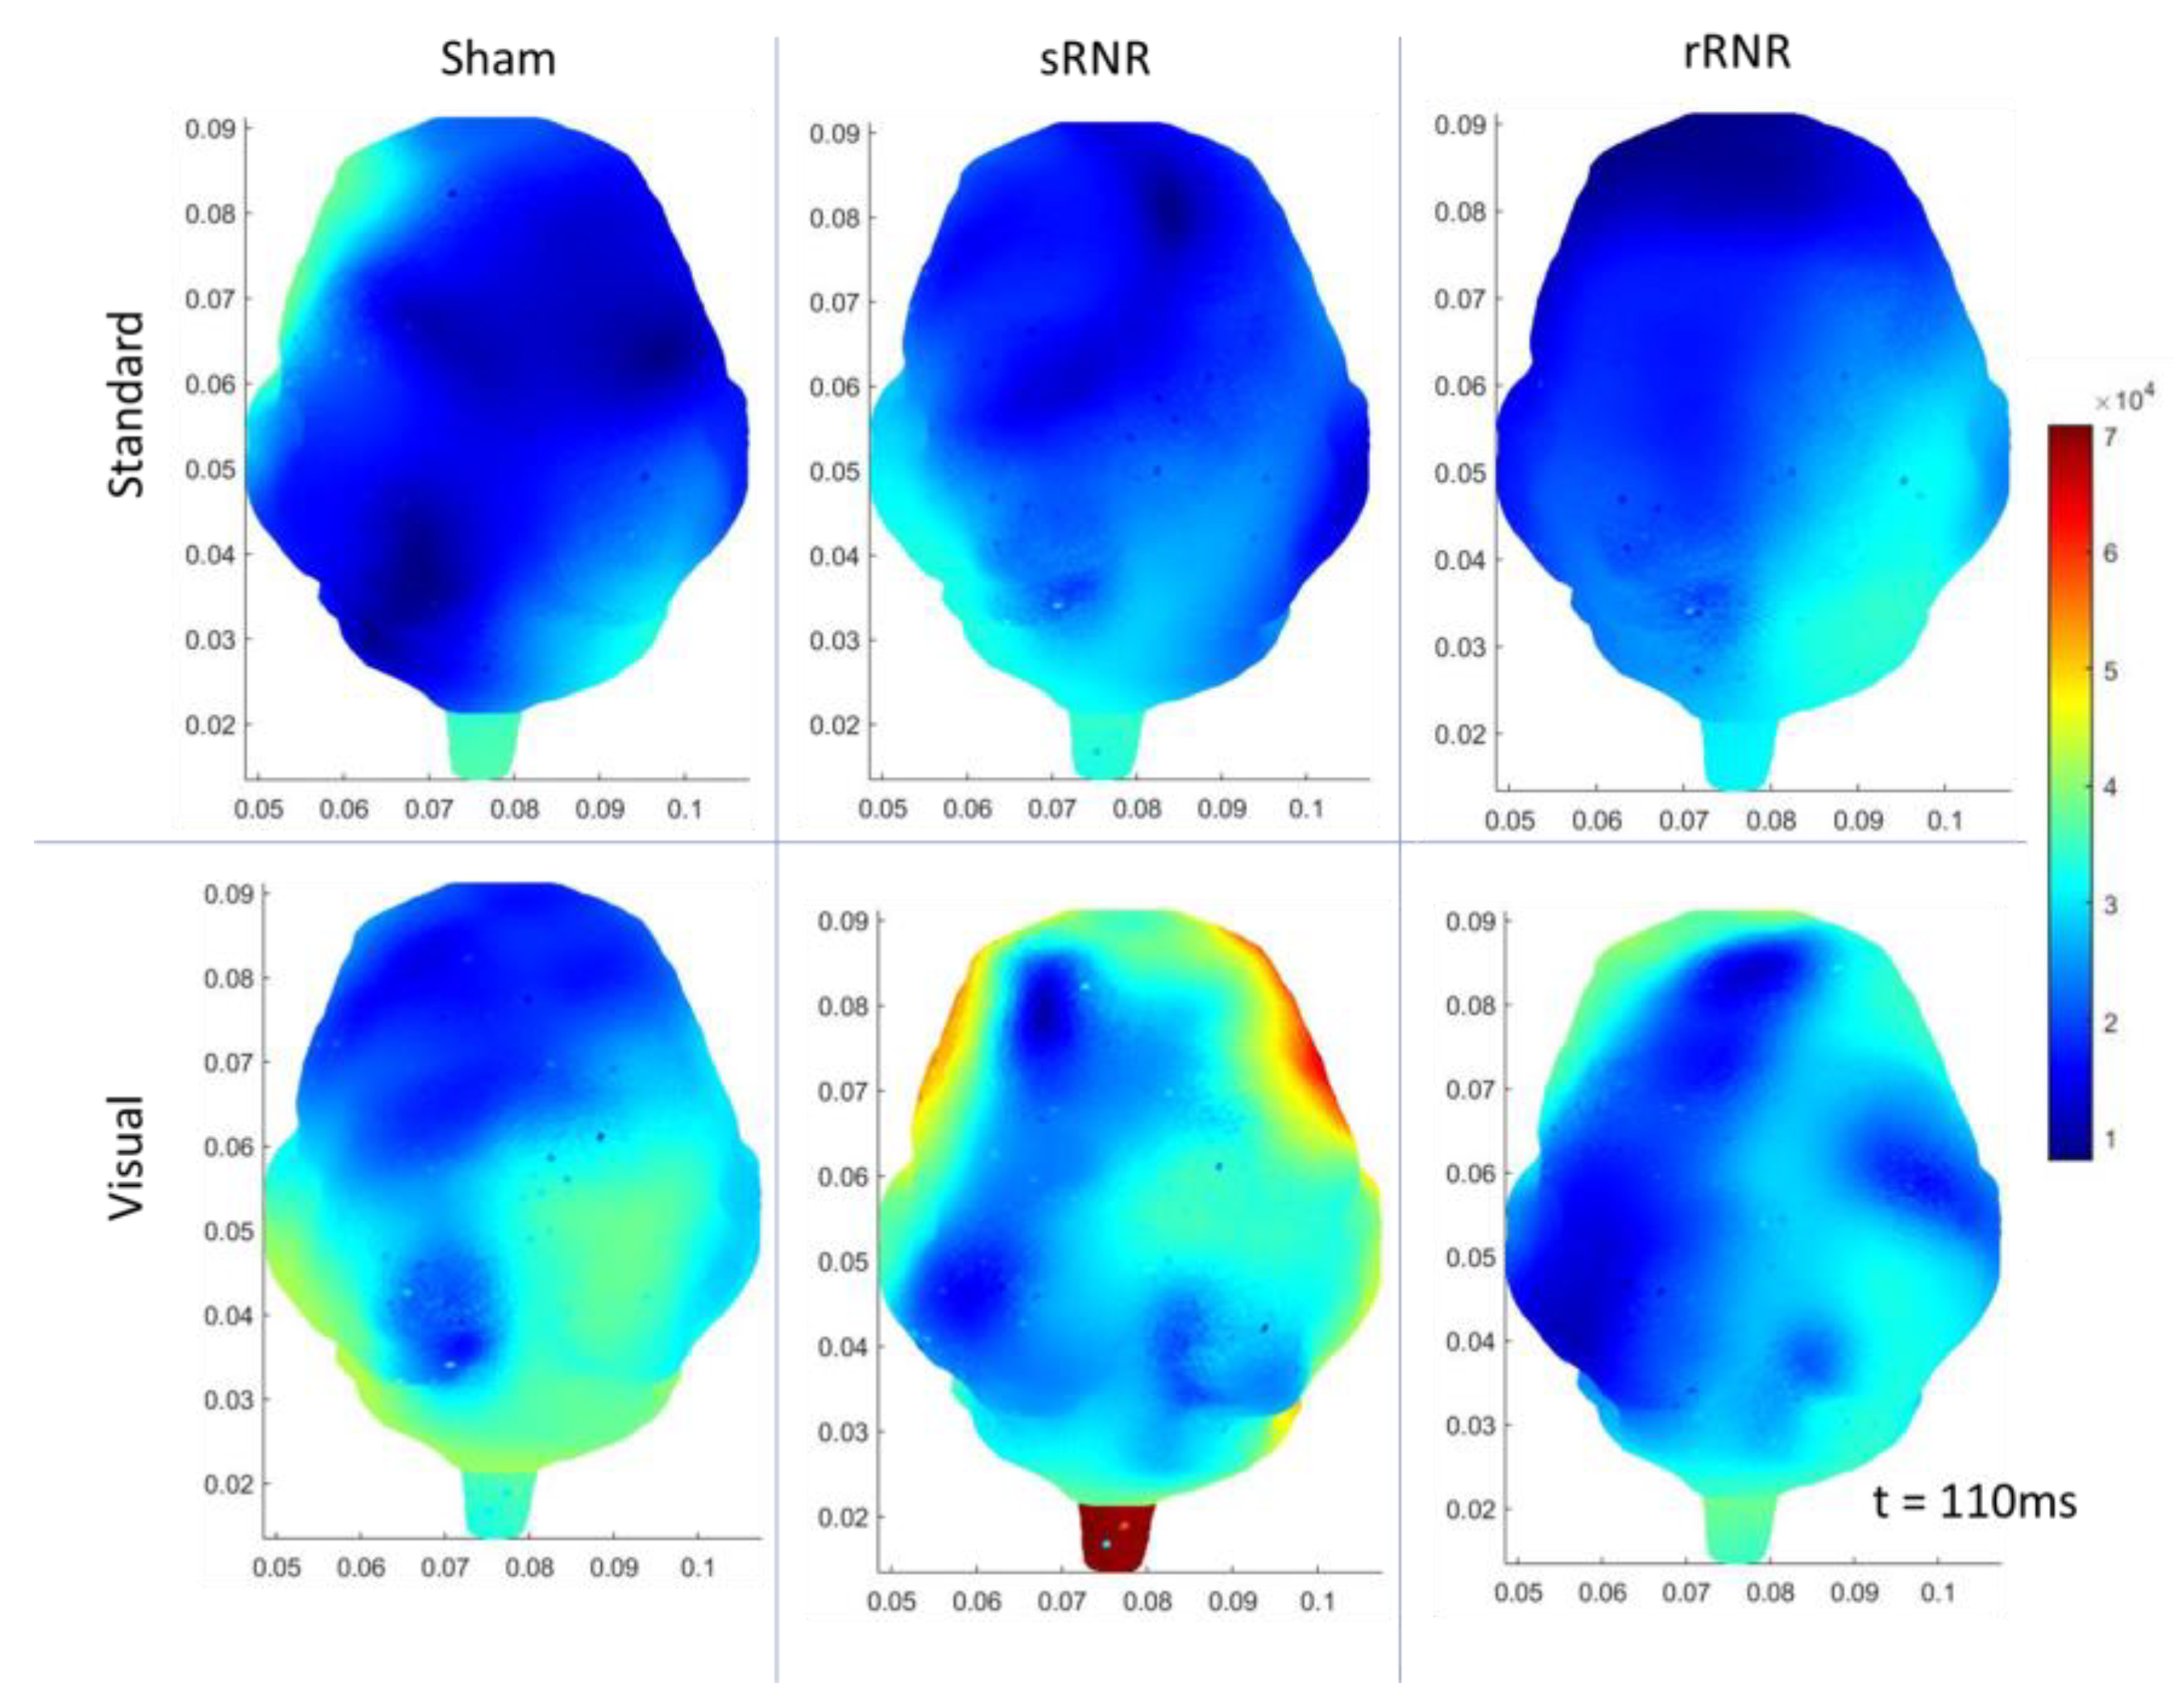
| Region | Stimulus | Significant Change from Pre-Injury | |
|---|---|---|---|
| Sham | Frontal | Auditory–Standard | Decrease (85 ms, current density) |
| Frontal | Auditory–Target | Decrease (N1 and P2 amplitudes) | |
| Left Temporal | Auditory–Standard | Decrease (85 ms, current density) | |
| Left Temporal | Auditory –Target | Decrease (85 ms, current density) | |
| Right Temporal | Auditory–Standard | Decrease (85 ms, current density) | |
| sRNR | Right Temporal | Visual | Increase (N1 amplitude) |
| Right Temporal | Auditory–Target | Increase (P2 amplitude) | |
| Right Temporal | Visual | Increase (50 ms, current density) | |
| Right Occipital | Visual | Increase (50 ms, current density) | |
| Left Occipital | Auditory–Target | Decrease (110 ms, current density) | |
| Right Occipital | Auditory–Target | Decrease (110 ms, current density) | |
| rRNR | Right Temporal | Visual | Decrease (N1 amplitude) |
| Right Temporal | Auditory–Standard | Decrease (P2 amplitude) | |
| Frontal | Visual | Decrease (P2 latency) * | |
| Left Temporal | Auditory–Standard | Decrease (85 ms, current density) |
Disclaimer/Publisher’s Note: The statements, opinions and data contained in all publications are solely those of the individual author(s) and contributor(s) and not of MDPI and/or the editor(s). MDPI and/or the editor(s) disclaim responsibility for any injury to people or property resulting from any ideas, methods, instructions or products referred to in the content. |
© 2023 by the authors. Licensee MDPI, Basel, Switzerland. This article is an open access article distributed under the terms and conditions of the Creative Commons Attribution (CC BY) license (https://creativecommons.org/licenses/by/4.0/).
Share and Cite
Oeur, A.; Torp, W.H.; Arbogast, K.B.; Master, C.L.; Margulies, S.S. Altered Auditory and Visual Evoked Potentials following Single and Repeated Low-Velocity Head Rotations in 4-Week-Old Swine. Biomedicines 2023, 11, 1816. https://doi.org/10.3390/biomedicines11071816
Oeur A, Torp WH, Arbogast KB, Master CL, Margulies SS. Altered Auditory and Visual Evoked Potentials following Single and Repeated Low-Velocity Head Rotations in 4-Week-Old Swine. Biomedicines. 2023; 11(7):1816. https://doi.org/10.3390/biomedicines11071816
Chicago/Turabian StyleOeur, Anna, William H. Torp, Kristy B. Arbogast, Christina L. Master, and Susan S. Margulies. 2023. "Altered Auditory and Visual Evoked Potentials following Single and Repeated Low-Velocity Head Rotations in 4-Week-Old Swine" Biomedicines 11, no. 7: 1816. https://doi.org/10.3390/biomedicines11071816
APA StyleOeur, A., Torp, W. H., Arbogast, K. B., Master, C. L., & Margulies, S. S. (2023). Altered Auditory and Visual Evoked Potentials following Single and Repeated Low-Velocity Head Rotations in 4-Week-Old Swine. Biomedicines, 11(7), 1816. https://doi.org/10.3390/biomedicines11071816