Article

Prevalence of RAF1 Aberrations in Metastatic Cancer Patients: Real-World Data

1
Samsung Medical Center, Division of Hematology-Oncology, Department of Medicine, Sungkyunkwan University School of Medicine, Seoul 06351, Republic of Korea
2
Experimental Therapeutics Development Center, Samsung Medical Center, Seoul 06351, Republic of Korea
3
Samsung Medical Center, Department of Pathology and Translational Genomics, Sungkyunkwan University School of Medicine, Seoul 06351, Republic of Korea
*
Author to whom correspondence should be addressed.
Biomedicines 2023, 11(12), 3264; https://doi.org/10.3390/biomedicines11123264
Submission received: 27 September 2023 / Revised: 27 November 2023 / Accepted: 5 December 2023 / Published: 9 December 2023

Abstract

:
Purpose: Therapeutic targeting of RAF1 is a promising cancer treatment, but the relationship between clinical features and RAF1 aberrations in terms of the MAPK signaling pathway is poorly understood in various solid tumors. Methods: Between October 2019 and June 2023 at Samsung Medical Center, 3895 patients with metastatic solid cancers underwent next-generation sequencing (NGS) using TruSight Oncology 500 (TSO500) assays as routine clinical practice. We surveyed the incidence of RAF1 aberrations including mutations (single-nucleotide variants [SNVs]), amplifications (copy number variation), and fusions. Results: Among the 3895 metastatic cancer patients, 77 (2.0%) exhibited RAF1 aberrations. Of these 77 patients, 44 (1.1%) had RAF1 mutations (SNV), 25 (0.6%) had RAF1 amplifications, and 10 (0.3%) had RAF1 fusions. Among the 10 patients with RAF1 fusions, concurrent RAF1 amplifications and RAF1 mutations were detected in one patient each. The most common tumor types were bladder cancer (11.5%), followed by ampulla of Vater (AoV) cancer (5.3%), melanoma (3.0%), gallbladder (GB) cancer (2.6%), and gastric (2.3%) cancer. Microsatellite instability high (MSI-H) tumors were observed in five of 76 patients (6.6%) with RAF1 aberrations, while MSI-H tumors were found in only 2.1% of patients with wild-type RAF1 cancers (p < 0.0001). Conclusion: We demonstrated that approximately 2.0% of patients with metastatic solid cancers have RAF1 aberrations according to NGS of tumor specimens.

1. Introduction

The RAF family of protein kinases, which includes ARAF, BRAF, and RAF1 (CRAF), comprises RAS-activated enzymes that initiate signaling through the MAPK cascade to control cellular proliferation, differentiation, and survival. The RAF family plays a pivotal role in transducing signals from RAS to downstream kinases, mitogen-activated protein kinase (MAPK), and extracellular signal–regulated kinase (ERK) kinase (MEK1/2) and ERK1/2 [1,2]. Well-known BRAF mutations have been reported in up to 20% of all types of cancers [3,4], and BRAF V600E targeting agents such as dabrafenib, vemurafenib, and encorafenib are used to treat melanoma, lung cancer, and colorectal cancer [5,6,7,8,9]. BRAF fusions are reported in 3% (14/531) of melanomas, 2% (3/1062) of gliomas, and approximately 1% of non-small cell lung carcinomas (NSCLCs) and colorectal cancers [10].
Regarding RAF1, RAF1 mutations are very rare in contrast to BRAF mutations, and it has yet to be determined whether RAF1 mutations constitute oncogenic drivers in human cancers. However, a previous in vitro study confirmed the oncogenic potential of CRAF-S257L and CRAF-S259A as well as the sensitivity of these mutants to RAF inhibition [11]. Recurrent rearrangements in RAF1, which are functionally similar to BRAF fusions, have been found to occur in advanced prostate cancers, gastric cancers, melanomas [12,13,14], and juvenile pilocytic astrocytomas [15].
In addition, amplification of the RAF1 gene has been observed in urothelial cancers, and RAF1 amplification drives the activation of MAPK signaling and exhibits a luminal gene expression pattern [16].
Emerging research on targeting RAF1-mediated signaling and the development of pan-RAF inhibitors are underway. Given their rarity, little is known about the overall incidence of RAF1 aberrations in various solid tumors, and the significance of RAF1 aberrations especially fusions and amplifications in clinical outcomes also remains unclear.
Given the challenges of the therapeutic approach to RAF1 in oncology patients, we analyzed the incidence of RAF1 mutations, amplifications, and fusions in 3895 patients with solid cancers on the basis of clinical sequencing.

2. Materials and Methods

2.1. Patient Enrollment

The collection of specimens and associated clinical data used in this study was approved by the Institutional Review Board of Samsung Medical Center (IRB# 2021-09-052). All patients who participated in this study provided written informed consent prior to enrollment and specimen collection. This study was performed in accordance with the principles of the Helsinki Declaration and the Korean Good Clinical Practice guidelines.

2.2. DNA Extraction

Tumor regions were micro-dissected for most tumor tissues, except for the samples used for genomic DNA extraction. Genomic DNA was isolated from formalin-fixed paraffin-embedded (FFPE) tissue fragments and purified using the AllPrep DNA/RNA FFPE Kit (Qiagen, Venlo, Netherlands). DNA concentrations were measured using a Qubit dsDNA HS assay kit (Thermo Fisher Scientific, Waltham, MA, USA), and 40 ng of DNA was used as the input for library preparation. The DNA integrity number, which is a measure of the DNA fragment size and consequently DNA quality, was determined using the Genomic DNA ScreenTape assay on an Agilent 2200 TapeStation System (Agilent Technologies, Santa Clara, CA, USA).

2.3. Library Preparation and Data Analysis

A DNA library was prepared using a hybrid capture-based TruSight Oncology 500 DNA/RNA NextSeq Kit following the manufacturer’s protocol. During library preparation, enrichment chemistry was optimized to capture nucleic acid targets from FFPE tissues. Unique molecular identifiers (UMIs) were used for TruSight Oncology 500 (TSO 500) analysis to determine the unique coverage at each position and reduce any background noise caused by sequencing and deamination artifacts in FFPE samples. During DNA library preparation, variants with low variant allele frequencies (VAFs) were detected while simultaneously suppressing errors, thereby providing high specificity.
Sequence data were analyzed for clinically relevant classes of genomic alterations, including SNVs and small insertions and deletions (indels), CNVs, and rearrangements/fusions. The results of SNVs and small indels with a variant allele frequency (VAF) of less than 2% were excluded. Average copy number variations of greater than 4 were considered gains, and those of less than one were considered losses. Only gains (amplifications) were analyzed in the TSO 500-CNV analysis, and RNA translocation-supporting reads of more than 4 to 12 were considered as translocations, which was dependent on the quality of the samples. Data outputs exported from the TSO 500 pipeline (Illumina, San Diego, CA, USA, Local App version 1.3.0.39) were annotated using the Ensembl Variant Effect Predictor (VEP) Annotation Engine with information from databases such as dbSNP, gnomAD genome and exome, 1000 Genomes, ClinVar, COSMIC, RefSeq, and Ensembl. The processed genomic changes were categorized according to a 4-tier system proposed by the American Society of Clinical Oncology/College of American Pathologists and annotated with proper references. The TSO 500 pipeline (Illumina, San Diego, CA, USA, Local App version 1.3.0.39) was used to determine the TMB and microsatellite instability (MSI) statuses. TMB was calculated by (1) excluding any variant with an observed allele count ≥ 10 in any of the gnomAD exome and genome and 1000 Genomes databases; including (2) variants in the coding region (RefSeq Cds), (3) variants with a frequency of ≥5%, (4) variants with coverage of ≥50×, (5) SNVs and indels; and excluding (6) nonsynonymous and synonymous variants. The effective panel size for TMB was the total coding region with coverage of >50×. MSI was calculated from the microsatellite sites according to the evidence of instability relative to a set of baseline normal samples based on information entropy metrics. The percentage of unstable MSI sites out of the total assessed MSI sites was reported as a sample-level microsatellite score.

2.4. Statistical Analysis

The data are presented as the mean ± SD. All statistical analyses were performed using R (Ver. 3.4), R studio (https://www.rstudio.com/ accessed on 1 January 2019), and GraphPad Prism 8.0 (GraphPad Software, San Diego, CA, USA; http://www.graphpad.com/ accessed on 1 January 2019). Statistical significance was set at p < 0.05. All statistical tests were two-sided.

3. Results

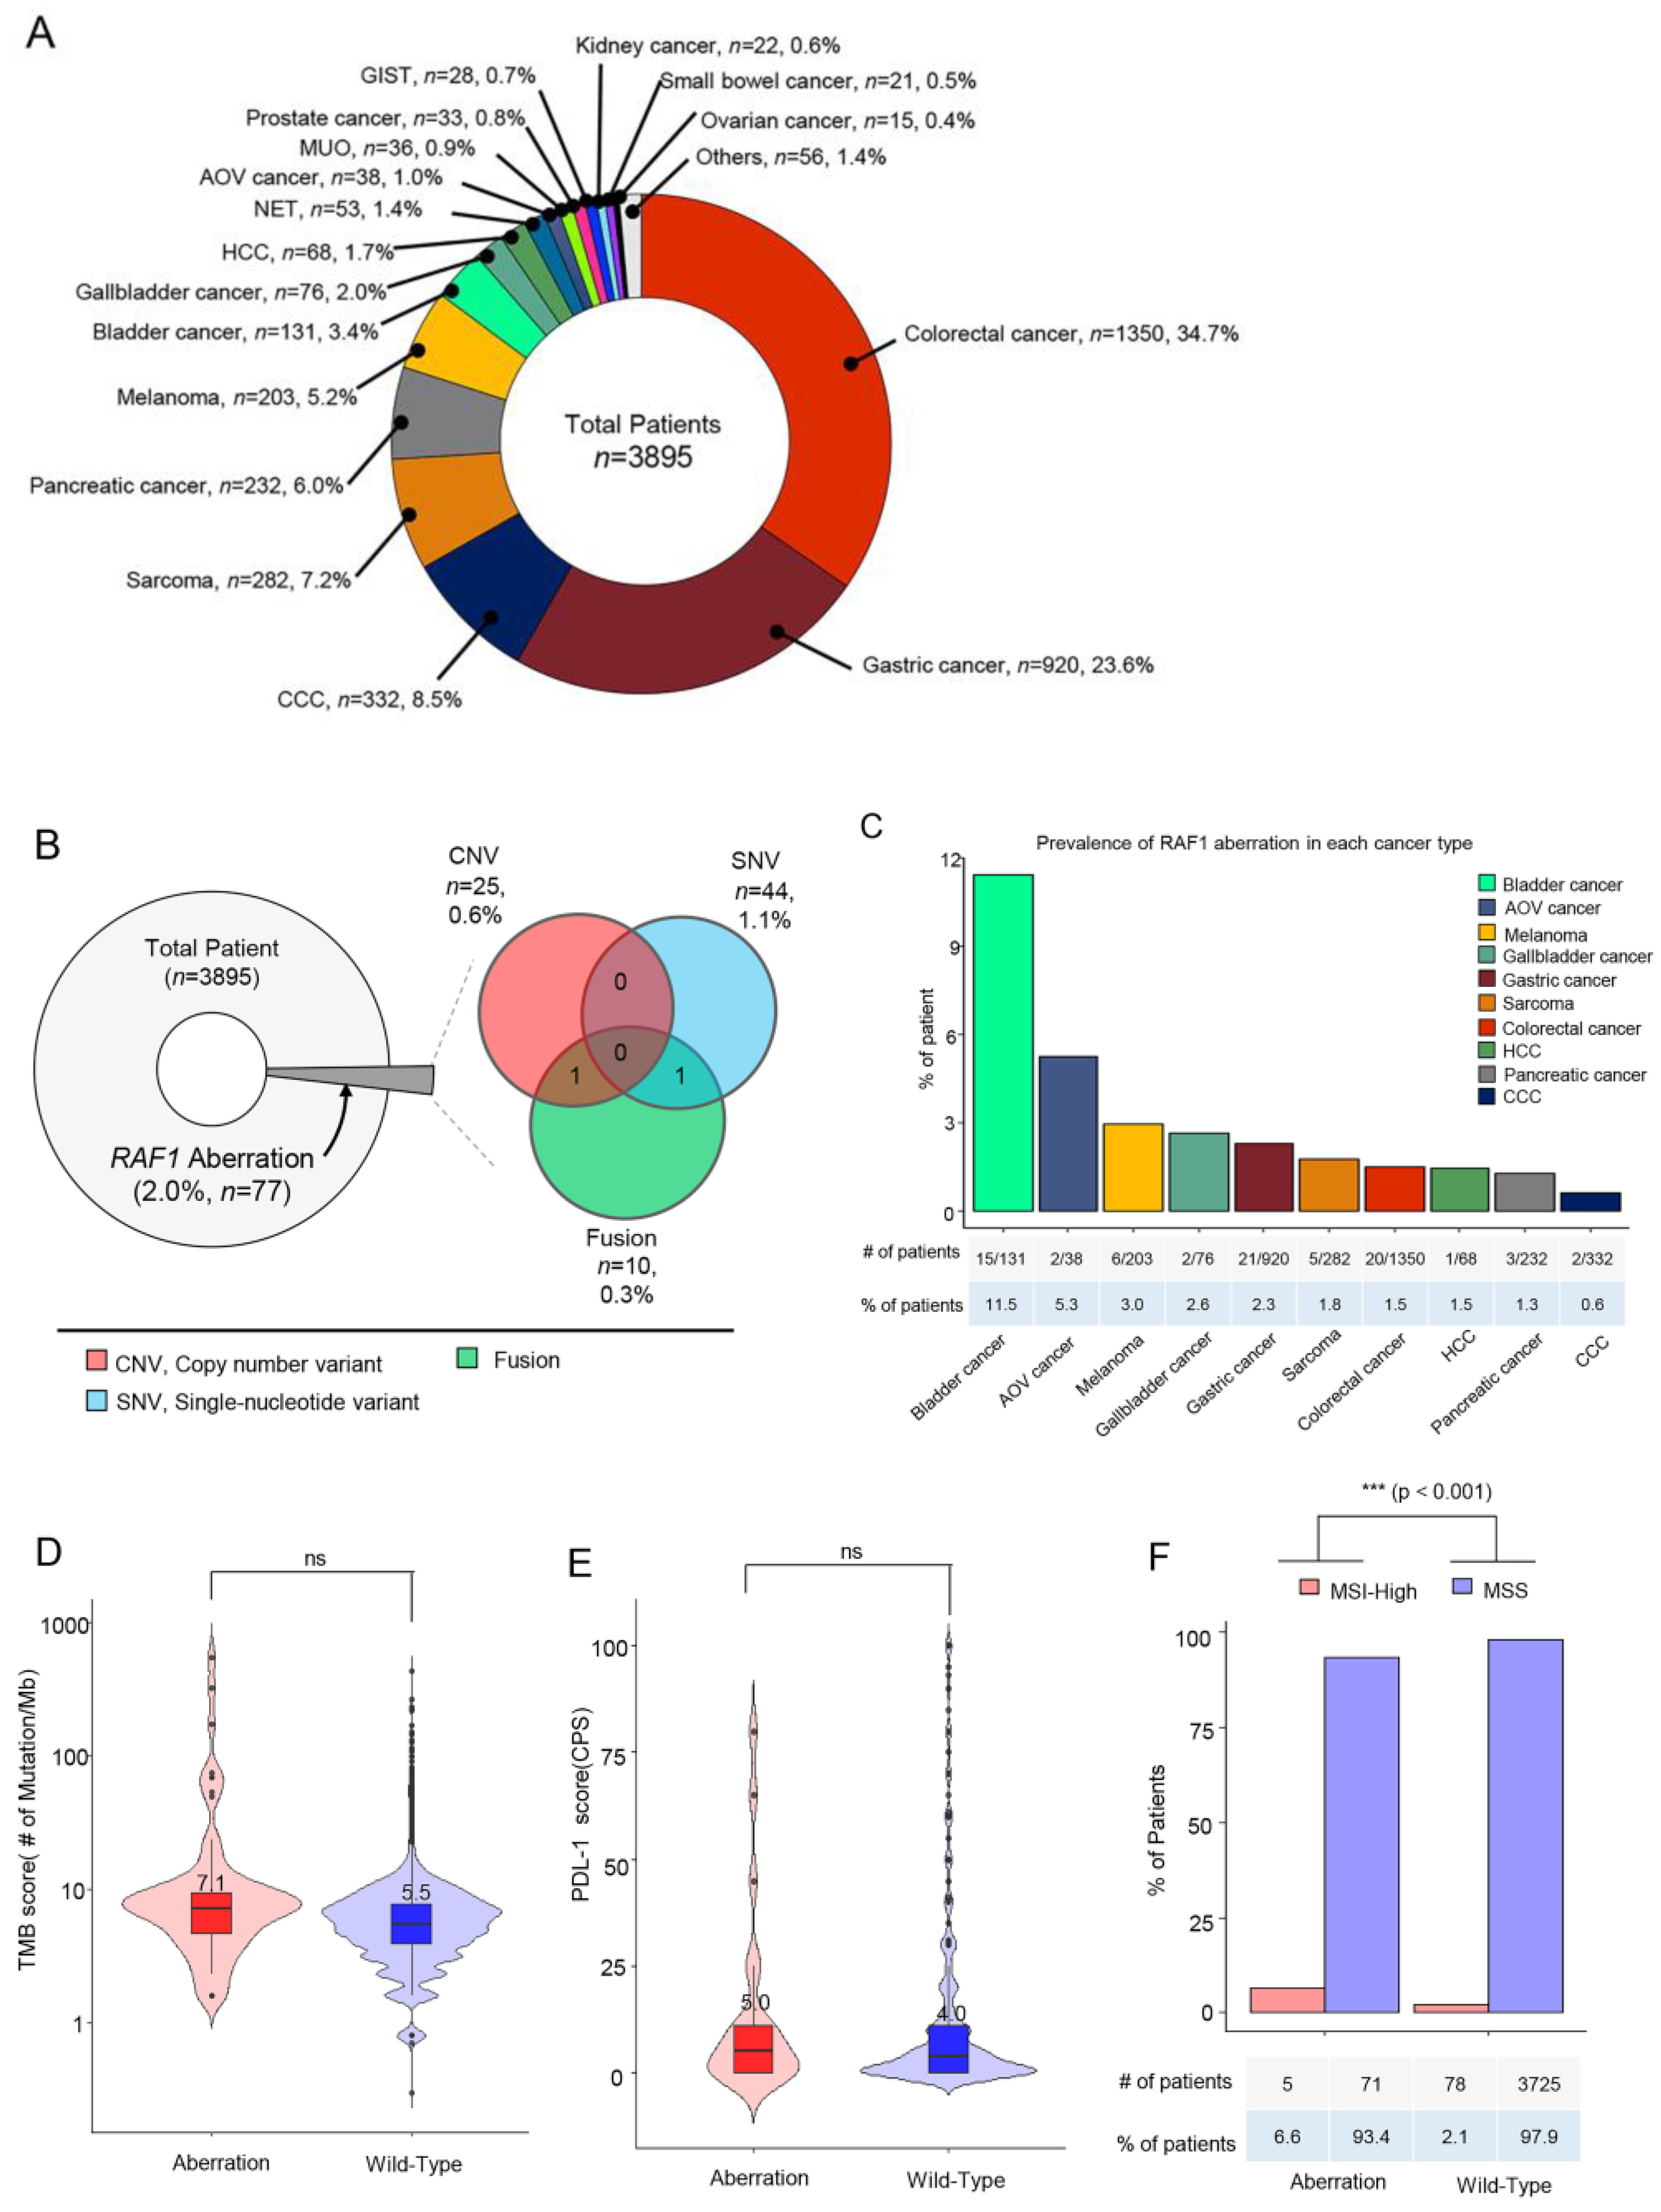
3.1. Patient Characteristics

Samples from a total of 3895 cancer patients were assessed by next-generation sequencing including 523 cancer genes (TSO500; Illumina) as routine clinical practice at Samsung Medical Center between October 2019 and June 2023. The most common tumor types were colorectal cancer (CRC) (n = 1350, 34.7%), gastric cancer (GC) (n = 920, 23.6%), cholangiocarcinoma (CCC) (n = 332, 8.5%), and sarcoma (n = 282, 7.2%) (Figure 1A). The tumor specimens from a total of 77 patients (2.0%) had RAF1 aberrations. Of these 77 patients, 44 (1.1%) had RAF1 mutations (SNV), 25 (0.6%) had RAF1 amplifications, and 10 (0.3%) had RAF1 fusions. Among the 10 patients with RAF1 fusions, concurrent RAF1 amplifications and RAF1 mutations were identified in one each (Figure 1B).
Next, we investigated the prevalence of RAF1 aberrations in each cancer type. The percentage of patients with RAF1 aberrations was the highest in those with bladder cancer (11.5%), followed by ampulla of Vater (AoV) cancer (5.3%), melanoma (3.0%), gallbladder (GB) cancer (2.6%), and gastric cancer (2.3%) (Figure 1C). No significant difference in the tumor mutational burden (TMB) score or the PD-L1 combined positive score (CPS) was observed between patients with and without RAF1 aberrations (Figure 1D,E). The median tumor mutational burden (TMB) score was 7.1 Muts/Mb in patients with RAF1 aberrations compared to 5.5 Muts/Mb in those with wild-type RAF1 (Figure 1D). In patients with RAF1 aberrations, the median PD-L1 (CPS) score was observed to be 5.0, whereas in those with wild-type RAF1, the median PD-L1 (CPS) score was 4.0 (Figure 1E). MSI-H tumors were observed in 5 out of 76 patients (6.6%) with RAF1 aberrations, while MSI-H tumors were found only in 2.1% of wild-type RAF1 cancer patients (p < 0.0001) (Figure 1F). At the time of diagnosis of metastatic disease in all patients, formalin-fixed paraffin-embedded tissue specimens were subjected to NGS. All software tools were used according to the Illumina “TruSight Oncology 500 v2.0 Local App” protocol. DNA alignment was performed using the BWA-MEM (https://bio-bwa.sourceforge.net/ accessed on 1 January 2019), CNV calling was conducted with CRAFT (https://support.illumina.com/help/BS_App_TruSigntTumor170_OLH_1000000028435/Content/Source/Informatics/CopyNumberVariantCaller_CRAFT.htm accessed on 1 January 2019), SNV calling was completed with Pisces (https://github.com/Illumina/Pisces accessed on 1 January 2019), fusion calling was carried out with Manta, annotation was performed with Nilrvana (https://illumina.github.io/NirvanaDocumentation/ accessed on 1 January 2019), TMB calculation was completed with TmbRaider, and MSI assessment was achieved with Hubble (Illumina).

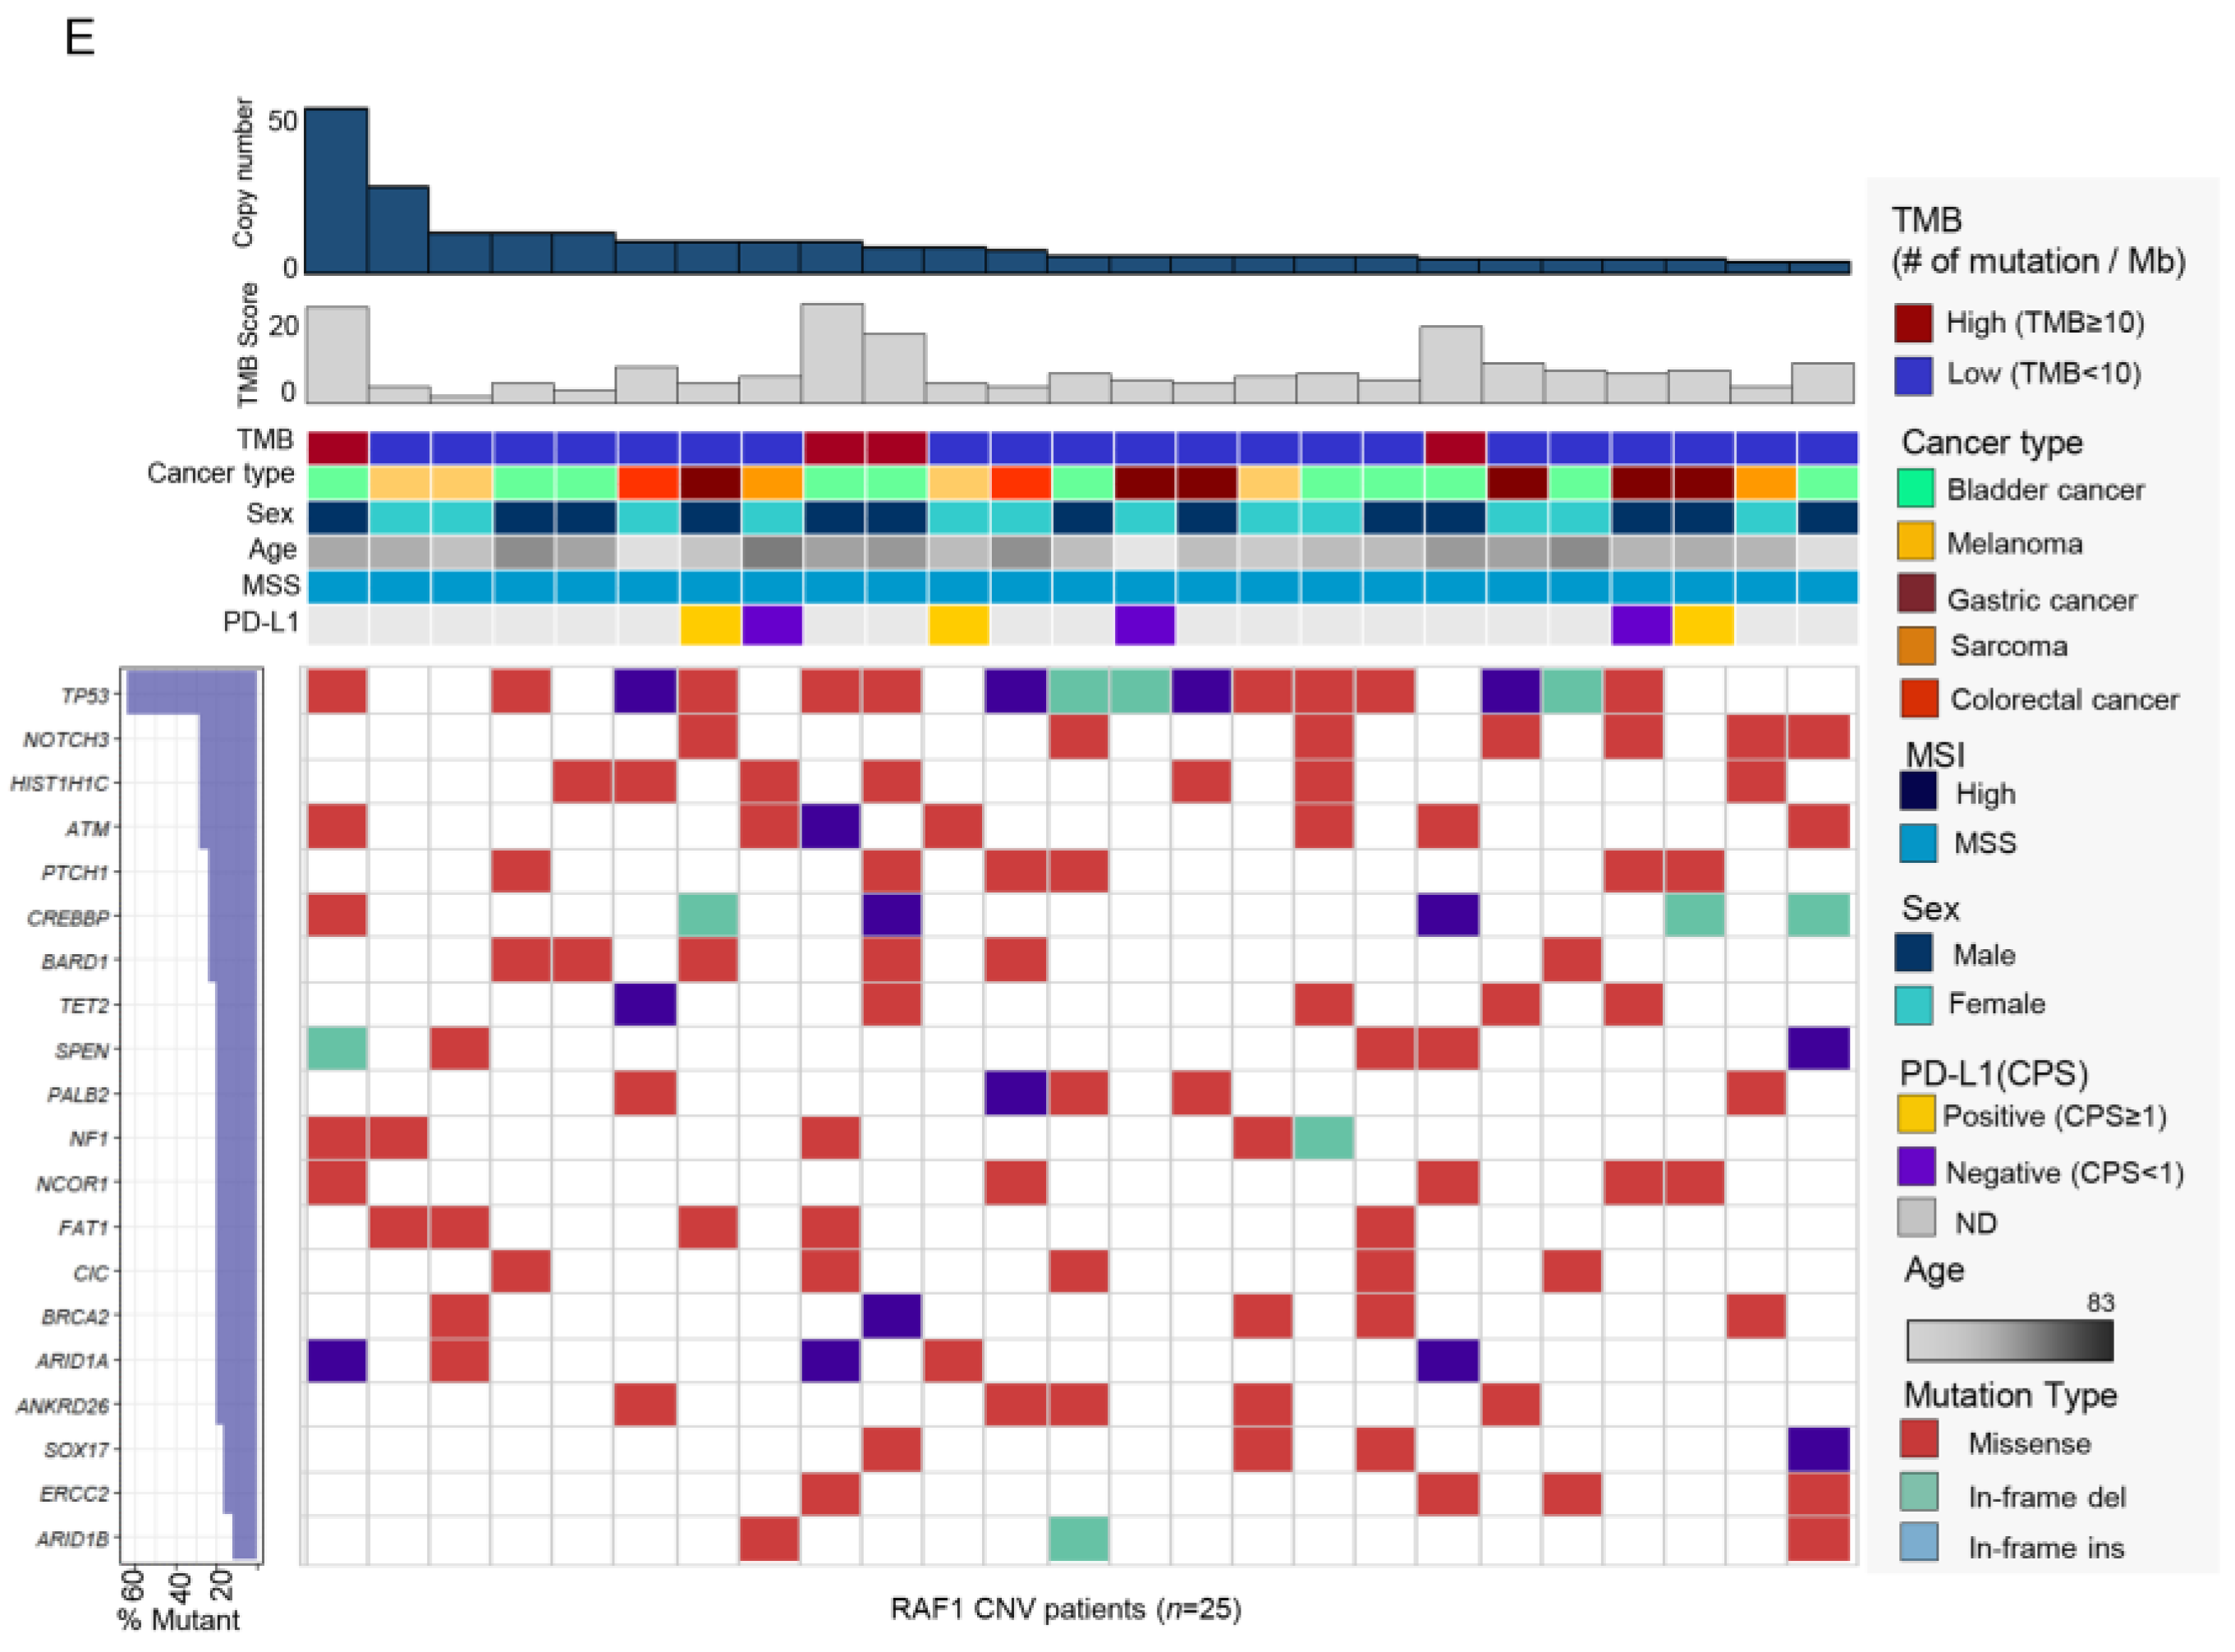
3.2. RAF1 Amplification (CNV)

Of the 77 patients with RAF1 aberrations, 25 patients (32.5%) had RAF1 copy number variations (CNVs) in their tumor specimens. The most prevalent tumor types were bladder cancer (n = 11, 44%), followed by GC (n = 6, 24%), and melanoma (n = 4, 16.0%). RAF1 amplifications were also observed in two patients each with CRC (n = 2, 8.0%) and sarcoma (n = 2, 8.0%) (Figure 2A). The degree of RAF1 amplification ranged from 4.1 to 52.5 (median: 6.0) (Figure 2C). Of note, over 90% of the patients had fewer than 15 copy number of RAF1 amplifications (x < 5; n = 6, 24%, 5 ≤ x < 10: n = 10, 40%, 10 ≤ x < 15: n = 7, 28%). The median value of the copy number was the highest in melanomas (10.5), while it was the lowest in GCs (5.25) (Figure 2B). There were no correlations between copy numbers and TMB scores.
Next, we evaluated RAF1 amplification in correlation with the TMB status (≥ 10 mutations/Mb vs. < 10 mutations/Mb), MSI status (microsatellite stable [MSS] vs. MSI-high), and PD-L1 combined positive scores (CPSs) (CPS 0 v ≥ 1). We determined that four of the 25 patients had concurrent high TMB scores (Figure 2D). Three patients with RAF1 amplifications exhibited positive PD-L1 CPSs, and all RAF1 amplification tumors were MSS. Of note, the most common concomitant genetic aberration was TP53 mutation, which was observed in 64% of all 25 patients. Following the TP53 gene, NOTCH3 (n = 7, 25%), HIST1H1C (n = 7, 25%), and ATM (n = 6, 24%) were the most frequently mutated genes in RAF1-amplified patients (Figure 2E).

3.3. RAF1 Mutation (Single-Nucleotide Variation)

In total, 44 patients (57.1%) had RAF1 mutations among the 77 patients with RAF1 aberrations. The most common cancer types were CRC (n = 18, 40.9%), GC (n = 11, 25.0%), and bladder cancer (n = 4, 9.1%) (Figure 3A). The pattern of nucleotide change varied depending on the cancer type—comparatively, hepatocellular carcinoma (HCC), bladder cancer, CRC, and GC exhibited a high proportion of C to T changes (Figure 3B). SNVs were identified at 40 distinct sites within the RAF1 gene, with the most frequent SNV observed at the Ala529 site (n = 3).
This was followed by SNVs at the Ser257, Ser259, Leu476, and Lsp486 sites, each with two occurrences. Both the mutations at Ala529 and Leu476 were identified in colorectal cancer, while those at Ser257 were exclusively found in gastric cancer (Figure 3C). Mutations in the TP53, SPEN, and ARID1B genes most frequently co-occurred with RAF1 mutations (Figure 3D). On analyzing mutation types, the most common type was missense mutation (n = 461, 87.5%). Ten patients had in-frame insertions, and 17 patients had in-frame deletions (Figure 3D). MSI-H tumors were confirmed in four patients, and two of these patients were diagnosed with CRC, one with GC, and one with pancreatic cancer. PD-L1 positivity was found in the tumors of 12 out of 14 patients for whom PD-L1 assessments were available.

3.4. RAF1 Fusions

Of the 77 patients with RAF1 aberrations, 10 patients (13.0%) had RAF1 fusions in their tumor specimens. However, there was one patient who had four fusions and another patient with three, bringing the total number of fusions to 15. Of the 10 patients, 4 (40%) were diagnosed with GC, 2 with melanoma, 2 with pancreatic cancer, 1 with sarcoma, and 1 with GB cancer (Figure 4A).
Various fusion partners were observed (Figure 4B–D), and in GC patients, the KRT8, LSAMP, TMEM40, and TAMM41 genes were identified. Among the 10 RAF1 fusion (+) patients, one patient with pancreatic cancer had an MSI-H tumor and high TMB. When we assessed the landscape of mutations in RAF1 fusion patients, mutations in TP53, SETBP1, and TET2 genes were most frequent. Out of the 10 individuals with fusions, one did not present mutations in the top 17 genes and was therefore excluded from the landscape analysis (Figure 4D). Of note, RAF1 mutation and amplification were detected simultaneously with RAF1 fusion in one of each. The detailed fusion partners are outlined in Table 1. Except for TMEM40, all other fusion partner genes in this study are reported for the first time.

4. Discussion

This study represents a large-scale real-world data analysis of RAF1 aberrations including amplifications, fusions, and SNVs in various solid cancers. Overall, RAF1 aberrations were observed in the tumors of 77 patients (2.0%) among a total of 3895 patients whose tumor specimens were subjected to NGS. RAF1 mutations represented 57.1% of all RAF1 aberrations, amplifications accounted for 32.5%, and RAF1 fusions were observed in 13.0%. Of note, there was one patient with concurrent RAF1 amplification and RAF1 fusion and one patient with concurrent RAF1 fusion and RAF1 amplification. The frequency of MSI-H tumors was significantly higher in patients with RAF1 aberrations compared to those with RAF1 wild-type cancers (6.6% vs. 2.1%, p < 0.0001). In particular, MSI-H tumors were not found in RAF1-amplified cancers and were only identified in RAF1-mutated or RAF1-fusion cancers.
Our study represents the largest number of various cases of RAF1 gene aberrations described to date. Although RAF1 aberrations are infrequent in advanced solid cancers, RAF1 fusions have been previously identified in several solid tumors especially pediatric brain tumors and pancreatic acinar cell carcinomas [14,17]. A relatively high incidence of RAF1 gene rearrangements of 14.3–18.5% has been reported in pancreatic acinar cell carcinomas [14] and at a frequency of 0.6% (40/7119) in melanoma patients [18]. The prevalence of BRAF fusions has been reported to be approximately 0.3% in samples analyzed with previous comprehensive genomic profiling (0.3%, 55/20,537) [10] and Memorial Sloan Kettering (MSK) Impact testing (0.3%, 33/10,945) [19]. In the present study, RAF1 fusions involving the intact and in-frame RAF1 kinase domain were observed in 0.3% of all samples analyzed, and we observed 10 cases of RAF1 fusion, and these were composed of all different fusion partners: KRT8, TMEM40, LSAMP, and TAMM41 in gastric cancer; VPRBP in gallbladder cancer; TDRD10, IL6R, SHE, and SLC25A20 in melanoma; CACNA2D3 and PFKFB4 in pancreatic cancer; and APPL2 in sarcoma.
RAF1 fusions aberrantly activate the MAPK signaling pathways and additionally activate the phosphoinositide-3 kinase/mammalian target of rapamycin (PI3K/mTOR). Therefore, unlike BRAF fusions, tumors with RAF1 fusions do not respond to RAF inhibitors [17,20,21]. Previously, type-II BRAF inhibitors have shown preclinical activity inhibiting BRAF V600 mutations, BRAF fusions, and RAF1 [22,23]. Pan-RAF inhibitors as well as newer RAF-directed agents with novel mechanisms of action preferentially targeting RAF1-fusion or RAF1-amplified tumors are in development.
Bladder cancer was the most prevalent tumor having RAF1 amplifications with a frequency of 8.4% (11/131), which was slightly less frequent than a previous reported study and TCGA data. Bekele at al. demonstrated that RAF1 inhibition, with pan-RAF inhibitors and the combination of RAF1 inhibition with MEK inhibition, were efficacious in preclinical models harboring RAF1 amplifications [16]. Unlike BRAFV600E function, BRAF inhibitors preferentially bind and inhibit monomeric RAF. Since most RAF1 aberrations activate the MAPK pathway through dimerization, an alternative strategy for targeting RAF1 aberrations is required. Various RAF inhibitors with distinct mechanisms of action are now being tested in patients with tumor MAPK pathway alterations [24].
Among all patients with RAF1 aberrations, RAF1 CNVs were identified in the largest proportion (44 patients), but little is known about the clinical significance of RAF1 mutations. In lung adenocarcinomas with KRAS mutations, RAF1 ablation in tumors leads to significant regressions including some complete regressions [25]. In addition, certain mutations of RAF1 lead to kinase-inactive RAF1 with no effect on MAPK signaling [26]. Kinase-independent functions of RAF1 blocking apoptosis have been reported, and this activity is believed to be mediated by the inactivation of the proapoptotic kinases ASK1 and MST2 [27].
How to therapeutically target tumors driven by RAF aberrations, especially fusions and amplifications, has become an increasingly important question. Our report expands the landscape of oncogenic RAF1 aberrations in various solid cancers, and increasing the recognition of RAF1 aberrations in tumors will assist in further refining tumor classification and hopefully guide the management of patients with tumors bearing these alterations. Further research is warranted to analyze in-depth biological mechanisms and RAF1 aberrations in this patient group.

5. Conclusions

Our data revealed that when tumor specimens from patients with metastatic solid cancers are subjected to NGS, approximately 2.0% of these specimens exhibit RAF1 aberrations. Overall, these findings identify a subset of molecularly defined RAF1-aberrated tumors that could be targeted using RAF1-directed therapy.

Author Contributions

Conception and design: S.H.L., J.J. and J.L. Administrative support: J.J.: Collection and assembly of data: S.H.L., J.J., J.Y.H., S.T.K., S.H.P., J.O.P., K.-M.K. and J.L. Data analysis and interpretation: S.H.L., J.J. and J.L.; Manuscript writing: All authors; Final approval of the manuscript: All authors; Accountable for all aspects of the work: All authors. All authors have read and agreed to the published version of the manuscript.

Funding

This research was supported by the [Bio&Medical Technology Development Program] of the National Research Foundation (NRF) funded by the Korean Government (MSIT) (No RS-2023-00222838).

Institutional Review Board Statement

This study was approved by the Institutional Review Board of Samsung Medical Center (IRB# 2021-09-052/Approved date: 13 September 2023).

Informed Consent Statement

Informed consent was obtained from all subjects involved in the study.

Data Availability Statement

All the data presented in this study are available upon request from the corresponding author. The NGS raw data of 77 patients were uploaded to ENA (European Nucleotide Archive).

Conflicts of Interest

The authors declare no conflict of interest.

References

  1. Hoeflich, K.P.; O’Brien, C.; Boyd, Z.; Cavet, G.; Guerrero, S.; Jung, K.; Januario, T.; Savage, H.; Punnoose, E.; Truong, T.; et al. In vivo antitumor activity of MEK and phosphatidylinositol 3-kinase inhibitors in basal-like breast cancer models. Clin. Cancer Res. 2009, 15, 4649–4664. [Google Scholar] [CrossRef] [PubMed]
  2. Holderfield, M.; Deuker, M.M.; McCormick, F.; McMahon, M. Targeting RAF kinases for cancer therapy: BRAF-mutated melanoma and beyond. Nat. Rev. Cancer 2014, 14, 455–467. [Google Scholar] [CrossRef] [PubMed]
  3. Davies, H.; Bignell, G.R.; Cox, C.; Stephens, P.; Edkins, S.; Clegg, S.; Teague, J.; Woffendin, H.; Garnett, M.J.; Bottomley, W.; et al. Mutations of the BRAF gene in human cancer. Nature 2002, 417, 949–954. [Google Scholar] [CrossRef]
  4. Kandoth, C.; McLellan, M.D.; Vandin, F.; Ye, K.; Niu, B.; Lu, C.; Xie, M.; Zhang, Q.; McMichael, J.F.; Wyczalkowski, M.A.; et al. Mutational landscape and significance across 12 major cancer types. Nature 2013, 502, 333–339. [Google Scholar] [CrossRef]
  5. Tabernero, J.; Grothey, A.; Van Cutsem, E.; Yaeger, R.; Wasan, H.; Yoshino, T.; Desai, J.; Ciardiello, F.; Loupakis, F.; Hong, Y.S.; et al. Encorafenib Plus Cetuximab as a New Standard of Care for Previously Treated BRAF V600E-Mutant Metastatic Colorectal Cancer: Updated Survival Results and Subgroup Analyses from the BEACON Study. J. Clin. Oncol. 2021, 39, 273–284. [Google Scholar] [CrossRef] [PubMed]
  6. Robert, C.; Karaszewska, B.; Schachter, J.; Rutkowski, P.; Mackiewicz, A.; Stroiakovski, D.; Lichinitser, M.; Dummer, R.; Grange, F.; Mortier, L.; et al. Improved overall survival in melanoma with combined dabrafenib and trametinib. N. Engl. J. Med. 2015, 372, 30–39. [Google Scholar] [CrossRef]
  7. Ascierto, P.A.; McArthur, G.A.; Dréno, B.; Atkinson, V.; Liszkay, G.; Di Giacomo, A.M.; Mandalà, M.; Demidov, L.; Stroyakovskiy, D.; Thomas, L.; et al. Cobimetinib combined with vemurafenib in advanced BRAF(V600)-mutant melanoma (coBRIM): Updated efficacy results from a randomised, double-blind, phase 3 trial. Lancet Oncol. 2016, 17, 1248–1260. [Google Scholar] [CrossRef]
  8. Dummer, R.; Ascierto, P.A.; Gogas, H.J.; Arance, A.; Mandala, M.; Liszkay, G.; Garbe, C.; Schadendorf, D.; Krajsova, I.; Gutzmer, R.; et al. Overall survival in patients with BRAF-mutant melanoma receiving encorafenib plus binimetinib versus vemurafenib or encorafenib (COLUMBUS): A multicentre, open-label, randomised, phase 3 trial. Lancet Oncol. 2018, 19, 1315–1327. [Google Scholar] [CrossRef]
  9. Planchard, D.; Smit, E.F.; Groen, H.J.M.; Mazieres, J.; Besse, B.; Helland, Å.; Giannone, V.; D’Amelio, A.M., Jr.; Zhang, P.; Mookerjee, B.; et al. Dabrafenib plus trametinib in patients with previously untreated BRAF(V600E)-mutant metastatic non-small-cell lung cancer: An open-label, phase 2 trial. Lancet Oncol. 2017, 18, 1307–1316. [Google Scholar] [CrossRef]
  10. Ross, J.S.; Wang, K.; Chmielecki, J.; Gay, L.; Johnson, A.; Chudnovsky, J.; Yelensky, R.; Lipson, D.; Ali, S.M.; Elvin, J.A.; et al. The distribution of BRAF gene fusions in solid tumors and response to targeted therapy. Int. J. Cancer 2016, 138, 881–890. [Google Scholar] [CrossRef]
  11. Imielinski, M.; Greulich, H.; Kaplan, B.; Araujo, L.; Amann, J.; Horn, L.; Schiller, J.; Villalona-Calero, M.A.; Meyerson, M.; Carbone, D.P. Oncogenic and sorafenib-sensitive ARAF mutations in lung adenocarcinoma. J. Clin. Investig. 2014, 124, 1582–1586. [Google Scholar] [CrossRef]
  12. Palanisamy, N.; Ateeq, B.; Kalyana-Sundaram, S.; Pflueger, D.; Ramnarayanan, K.; Shankar, S.; Han, B.; Cao, Q.; Cao, X.; Suleman, K.; et al. Rearrangements of the RAF kinase pathway in prostate cancer, gastric cancer and melanoma. Nat. Med. 2010, 16, 793–798. [Google Scholar] [CrossRef] [PubMed]
  13. Kim, K.B.; Semrad, T.; Schrock, A.B.; Ali, S.M.; Ross, J.S.; Singer, M.; Kashani-Sabet, M. Significant Clinical Response to a MEK Inhibitor Therapy in a Patient With Metastatic Melanoma Harboring an RAF1 Fusion. JCO Precis Oncol. 2018, 2, 1–6. [Google Scholar] [CrossRef] [PubMed]
  14. Prall, O.W.J.; Nastevski, V.; Xu, H.; McEvoy, C.R.E.; Vissers, J.H.A.; Byrne, D.J.; Takano, E.; Yerneni, S.; Ellis, S.; Green, T.; et al. RAF1 rearrangements are common in pancreatic acinar cell carcinomas. Mod. Pathol. 2020, 33, 1811–1821. [Google Scholar] [CrossRef] [PubMed]
  15. Jones, D.T.; Kocialkowski, S.; Liu, L.; Pearson, D.M.; Ichimura, K.; Collins, V.P. Oncogenic RAF1 rearrangement and a novel BRAF mutation as alternatives to KIAA1549:BRAF fusion in activating the MAPK pathway in pilocytic astrocytoma. Oncogene 2009, 28, 2119–2123. [Google Scholar] [CrossRef] [PubMed]
  16. Bekele, R.T.; Samant, A.S.; Nassar, A.H.; So, J.; Garcia, E.P.; Curran, C.R.; Hwang, J.H.; Mayhew, D.L.; Nag, A.; Thorner, A.R.; et al. RAF1 amplification drives a subset of bladder tumors and confers sensitivity to MAPK-directed therapeutics. J. Clin. Investig. 2021, 131, e147849. [Google Scholar] [CrossRef]
  17. Roosen, M.; Odé, Z.; Bunt, J.; Kool, M. The oncogenic fusion landscape in pediatric CNS neoplasms. Acta Neuropathol. 2022, 143, 427–451. [Google Scholar] [CrossRef]
  18. Williams, E.A.; Shah, N.; Montesion, M.; Sharaf, R.; Pavlick, D.C.; Sokol, E.S.; Alexander, B.M.; Venstrom, J.M.; Elvin, J.A.; Ross, J.S.; et al. Melanomas with activating RAF1 fusions: Clinical, histopathologic, and molecular profiles. Mod. Pathol. 2020, 33, 1466–1474. [Google Scholar] [CrossRef]
  19. Zehir, A.; Benayed, R.; Shah, R.H.; Syed, A.; Middha, S.; Kim, H.R.; Srinivasan, P.; Gao, J.; Chakravarty, D.; Devlin, S.M.; et al. Mutational landscape of metastatic cancer revealed from prospective clinical sequencing of 10,000 patients. Nat. Med. 2017, 23, 703–713. [Google Scholar] [CrossRef]
  20. Jain, P.; Fierst, T.M.; Han, H.J.; Smith, T.E.; Vakil, A.; Storm, P.B.; Resnick, A.C.; Waanders, A.J. CRAF gene fusions in pediatric low-grade gliomas define a distinct drug response based on dimerization profiles. Oncogene 2017, 36, 6348–6358. [Google Scholar] [CrossRef]
  21. Sievert, A.J.; Lang, S.S.; Boucher, K.L.; Madsen, P.J.; Slaunwhite, E.; Choudhari, N.; Kellet, M.; Storm, P.B.; Resnick, A.C. Paradoxical activation and RAF inhibitor resistance of BRAF protein kinase fusions characterizing pediatric astrocytomas. Proc. Natl. Acad. Sci. USA 2013, 110, 5957–5962. [Google Scholar] [CrossRef] [PubMed]
  22. Botton, T.; Talevich, E.; Mishra, V.K.; Zhang, T.; Shain, A.H.; Berquet, C.; Gagnon, A.; Judson, R.L.; Ballotti, R.; Ribas, A.; et al. Genetic Heterogeneity of BRAF Fusion Kinases in Melanoma Affects Drug Responses. Cell Rep. 2019, 29, 573–588.e577. [Google Scholar] [CrossRef] [PubMed]
  23. Sun, Y.; Alberta, J.A.; Pilarz, C.; Calligaris, D.; Chadwick, E.J.; Ramkissoon, S.H.; Ramkissoon, L.A.; Garcia, V.M.; Mazzola, E.; Goumnerova, L.; et al. A brain-penetrant RAF dimer antagonist for the noncanonical BRAF oncoprotein of pediatric low-grade astrocytomas. Neuro Oncol. 2017, 19, 774–785. [Google Scholar] [CrossRef] [PubMed]
  24. Yao, Z.; Gao, Y.; Su, W.; Yaeger, R.; Tao, J.; Na, N.; Zhang, Y.; Zhang, C.; Rymar, A.; Tao, A.; et al. RAF inhibitor PLX8394 selectively disrupts BRAF dimers and RAS-independent BRAF-mutant-driven signaling. Nat. Med. 2019, 25, 284–291. [Google Scholar] [CrossRef]
  25. Sanclemente, M.; Francoz, S.; Esteban-Burgos, L.; Bousquet-Mur, E.; Djurec, M.; Lopez-Casas, P.P.; Hidalgo, M.; Guerra, C.; Drosten, M.; Musteanu, M.; et al. c-RAF Ablation Induces Regression of Advanced Kras/Trp53 Mutant Lung Adenocarcinomas by a Mechanism Independent of MAPK Signaling. Cancer Cell 2018, 33, 217–228.e214. [Google Scholar] [CrossRef]
  26. Drosten, M.; Barbacid, M. Targeting KRAS mutant lung cancer: Light at the end of the tunnel. Mol. Oncol. 2022, 16, 1057–1071. [Google Scholar] [CrossRef]
  27. O’Neill, E.; Rushworth, L.; Baccarini, M.; Kolch, W. Role of the kinase MST2 in suppression of apoptosis by the proto-oncogene product Raf-1. Science 2004, 306, 2267–2270. [Google Scholar] [CrossRef]
Figure 1. Overview of the enrolled cancer patients and the proportions of RAF1 genetic variants. (A) Between October 2019 and June 2023, all patients with stage IV cancer at the Precision Oncology Clinic of Samsung Medical Center were screened for RAF1 aberrations through next-generation sequencing using a panel targeting 500+ genes (TruSight Oncology Next Seq). A pie chart indicating the percentages of each type of cancer in a total of 3895 patients. (B) A pie chart representing the proportion of patients with any RAF1 aberration (left), and a Venn diagram showing the number and percentage of patients with RAF1 CNVs (amplifications), SNVs, and fusions. (C) The proportion of patients with RAF1 aberrations according to each cancer type. (D) The TMB scores between tumors with RAF1 aberrations and wild-type tumors. (E) The PD-L1 scores between tumors with RAF1 aberrations and wild-type tumors. ‘ns’ (F) The percentage of patients with MSI-H tumors between tumors with RAF1 aberrations and wild-type tumors. Statistical significance was assessed by the U-test. p-values < 0.05 were considered significant; (***) p-value < 0.001; ns = not significant.
Biomedicines 11 03264 g001
Figure 2. (A) Pie chart showing the distribution of the percentage of tumor types with RAF1 amplifications (n = 25): bladder cancer (n = 11, 44%), GC (n = 6, 24%), and melanoma (n = 4, 16.0%) in order of the most frequently observed tumor types. (B) Chart showing the number of patient incidences by RAF1 copy number range. (C) The range of copy number for each cancer type. The square point represented the mean value of the copy number. (D) No correlations between the RAF1 copy number and the TMB score. (E) Landscape of the patient’s genomic profiles. The first top panel: copy number of the RAF1 gene. The second top panel: TMB score; middle: TMB, cancer type, sex, age, microsatellite instability, and PD-L1 status; and bottom: OncoPrint showing concurrent SNV genes in RAF1-amplified patients. Left: top gene list of the most frequently mutated genes and the percentage of the mutation in RAF1-amplified patients. CNV, copy number variation; GC, gastric cancer; CPS, combined positive score; IHC, immunohistochemistry; MSI, microsatellite instability; MSS, microsatellite stable; and TMB, tumor mutational burden.
Biomedicines 11 03264 g002aBiomedicines 11 03264 g002b
Figure 3. (A) Pie chart showing the cancer type of RAF1-SNV patients: CRC (n = 18, 40.9%), GC (n = 11, 25.0%), and bladder cancer (n = 4, 9.1%) in order of the most frequently observed tumor types. (B) Bar graph representing the proportion of each nucleotide change in various cancer types. (C) Lollipop plot showing the position and number of specific RAF1 aberrations that occurred in the RAF1 gene. The bar represents the structure of the RAF1 gene. The length of the lollipop is proportional to the number of mutations. (D) Landscape about several clinical factors and OncoPrint corresponding to SNV mutations in other genes in RAF1-SNV patients. Top panel: TMB, cancer type, sex, age, MSI, and PD-L1 status; bottom panel: OncoPrint showing the SNV of other genes; and left panel: the percentage of the mutation in the total sample (RAF1-SNV patients; n = 44). SNV, single-nucleotide variant; AOV, ampulla of Vater; CCC, cholangiocarcinoma; HCC, hepatocellular carcinoma; TMB, tumor mutational burden; CPS, combined positive score; MSI, microsatellite instability; and MSS, microsatellite stable.
Biomedicines 11 03264 g003
Figure 4. (A) Pie chart showing the distribution of cancer patient groups containing fused RAF1 genes: GC (n = 4, 40%), melanoma (n = 2, 20%), and pancreatic cancer (n = 2, 20%) in order of the most frequently occurring tumor types. (B) The fusion number in each type of fused RAF1 genes. Network diagram representing RAF1 and fusion partner genes in GCs (C) and other cancers (D). (E) Landscape of the RAF1-fused patient’s genomic profile comprising the TMB score, cancer type, MSI status, sex, age, and PD-L1 (top panel). OncoPrint showing SNV of other genes (bottom panel); left panel: the percentage of mutations in the total sample (RAF1-fusion patients; n = 10).
Biomedicines 11 03264 g004aBiomedicines 11 03264 g004b
Table 1. Detailed clinical information on patient-specific RAF1 gene fusions.
Tumor TypeFusion FrequencyFusion Gene
Gastric cancer (n = 4)1KRT8-RAF1
1RAF1-TMEM40
1RAF1-LSAMP
1TAMM41-RAF1
Gallbladder cancer (n = 1)3RAF1-VPRBP
Melanoma (n = 2)2RAF1-TDRD10
1IL6R-RAF1
1RAF1-SHE
1RAF1-SLC25A20
Pancreatic cancer (n = 2)1CACNA2D3-RAF1
1PFKFB4-RAF1
Sarcoma (n = 1)1APPL2-RAF1
Disclaimer/Publisher’s Note: The statements, opinions and data contained in all publications are solely those of the individual author(s) and contributor(s) and not of MDPI and/or the editor(s). MDPI and/or the editor(s) disclaim responsibility for any injury to people or property resulting from any ideas, methods, instructions or products referred to in the content.

