
Vagal Stimulation Ameliorates Non-Alcoholic Fatty Liver Disease in Rats
 , , , , and
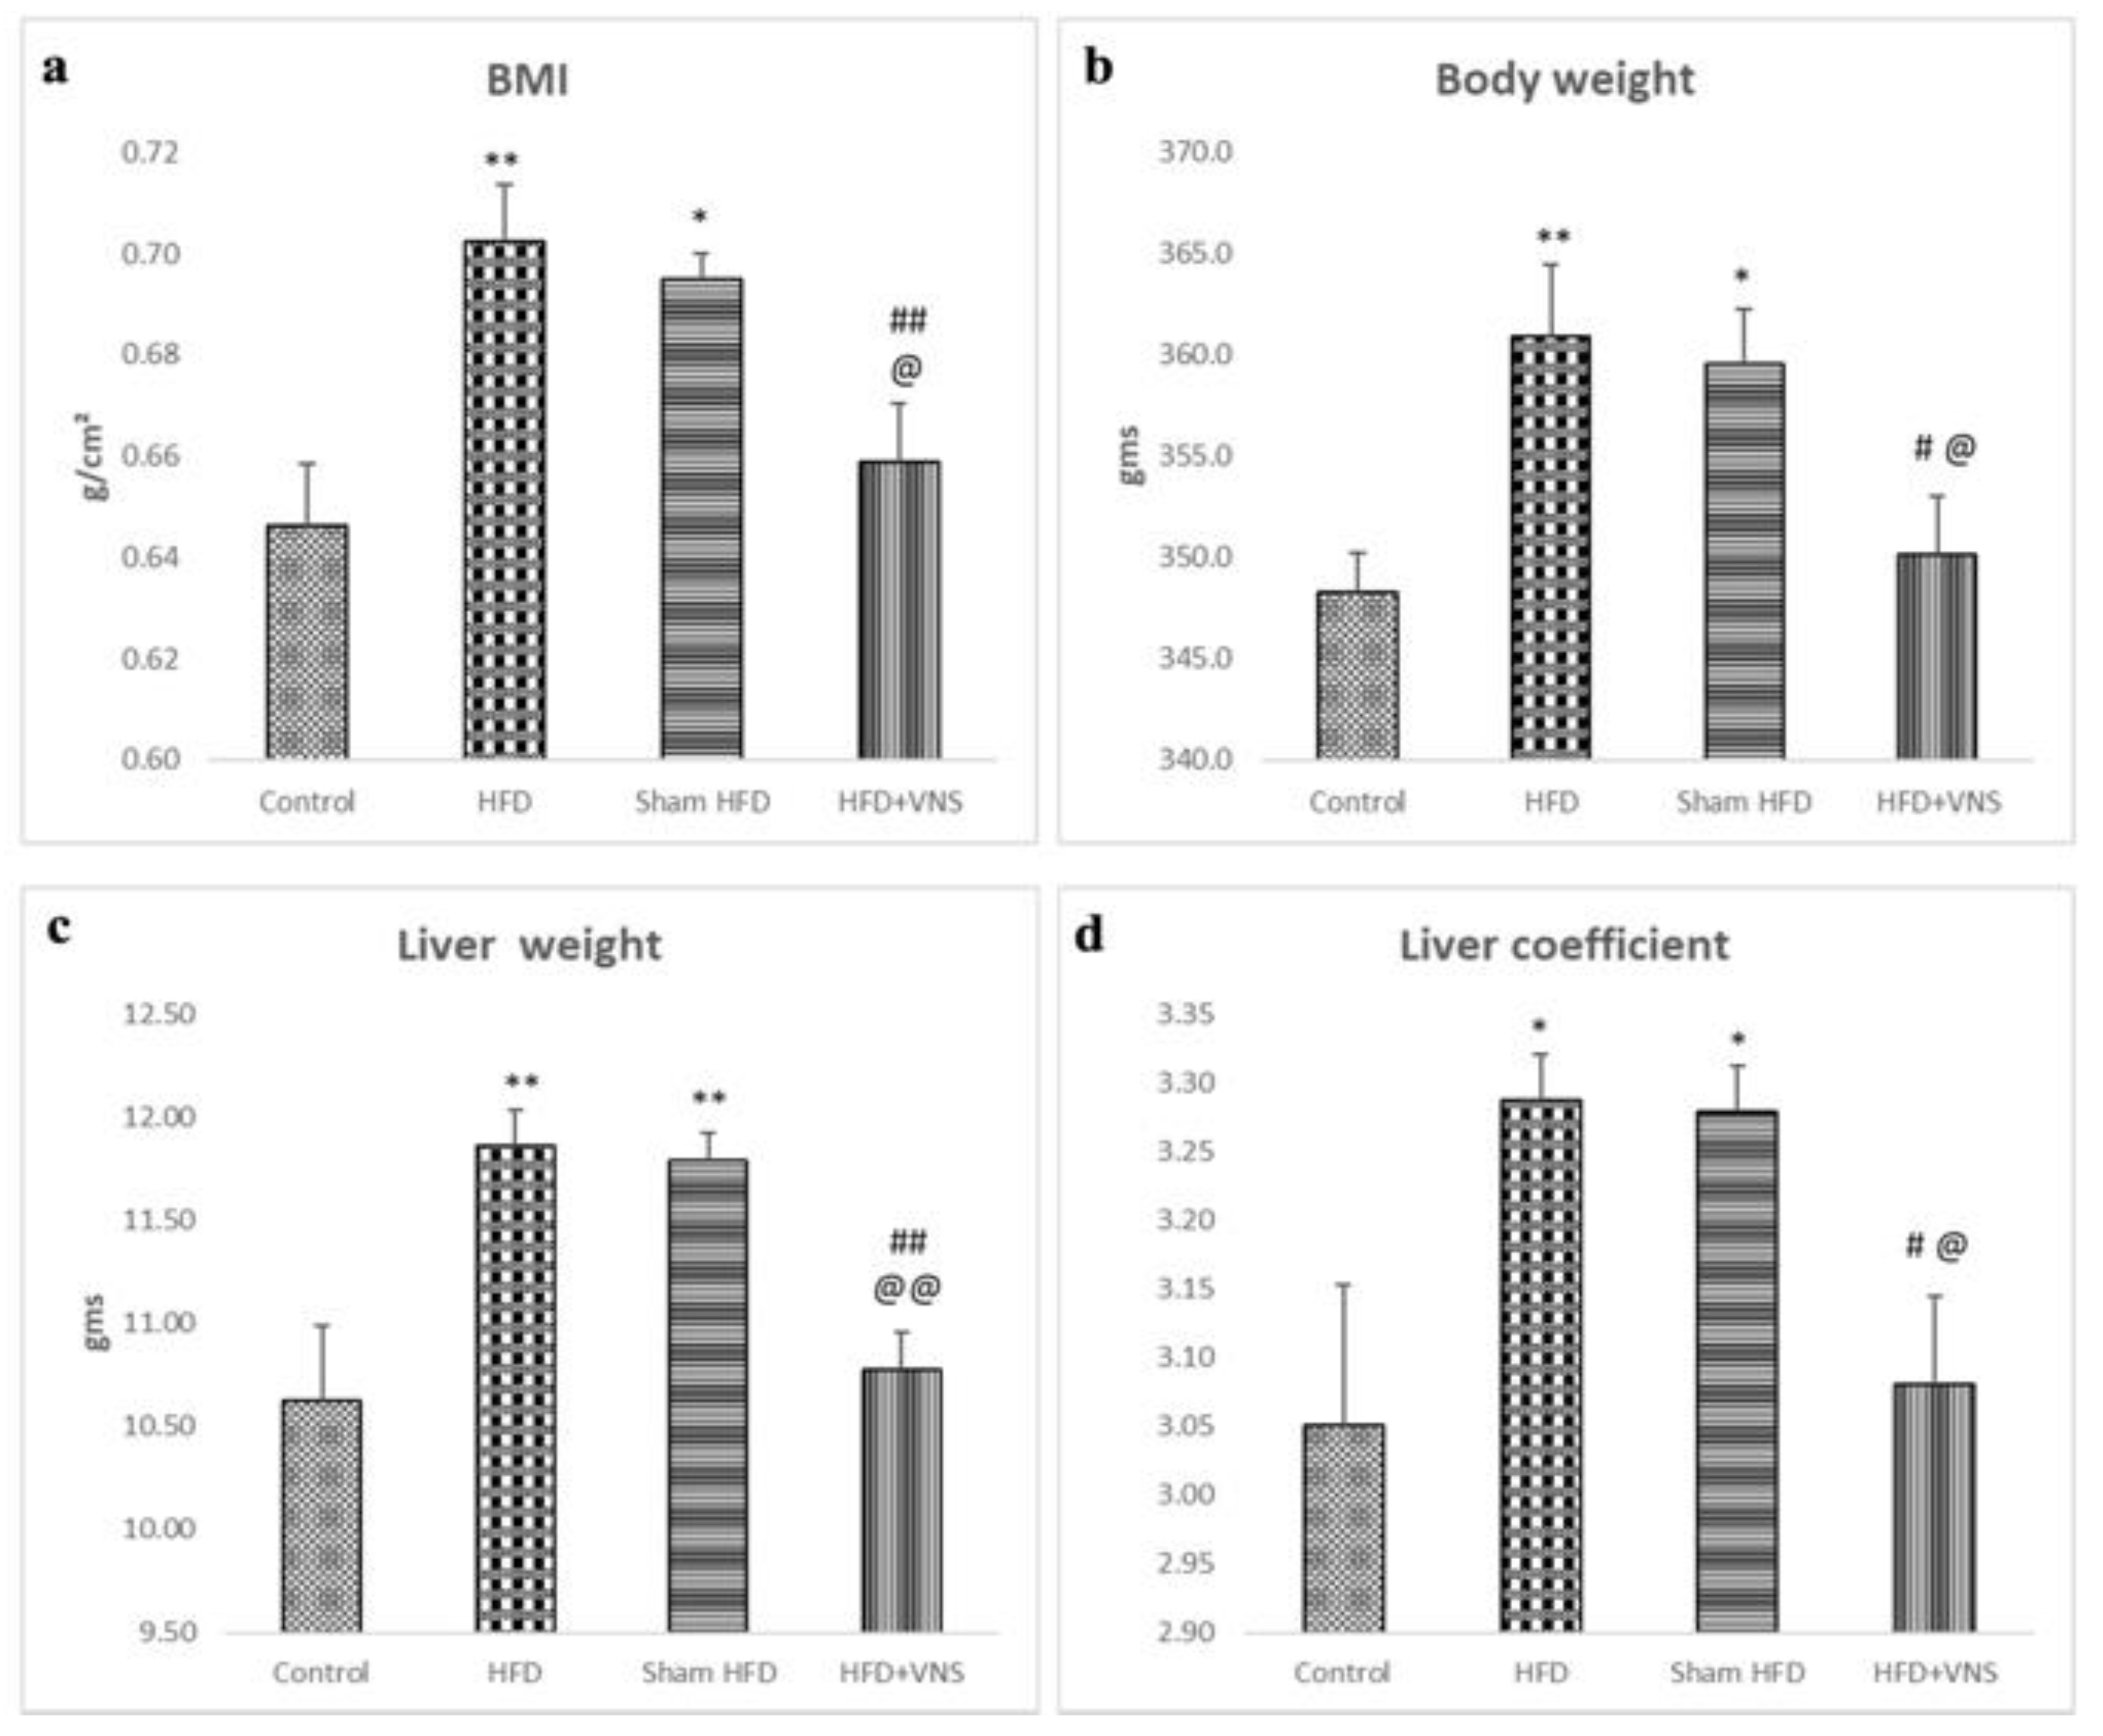
Abstract
:1. Introduction
2. Materials and Methods
2.1. Ethical Approval
2.2. Animal Grouping
2.3. Transcutaneous Vagus Nerve Stimulation (tVNS) Intervention
2.4. Analytical Evaluation of Body Mass Index (BMI) and Abdominal Circumference (AC)
2.5. Collection of Specimens
2.6. Evaluation of Insulin Resistance
2.7. Evaluation of Blood Lipid Profile
2.8. Biochemical Analysis of Liver Function
2.9. Measurement of Hepatic Triglyceride and Cholesterol Content
2.10. Evaluation of Liver Oxidative Stress Markers
2.11. Assessment of Hepatic Inflammatory Markers
2.12. Histopathological Evaluation of Liver Tissue
2.13. Immunohistochemical Analysis of Hepatic Tissue
2.14. Morphometrical Analysis
2.15. Transmission Electron Microscopic Study (TEM)
2.16. Statistical Analysis
3. Results
3.1. VNS Improved Weight Gain, Liver Weight, and Hepatic Coefficient Induced by HFD
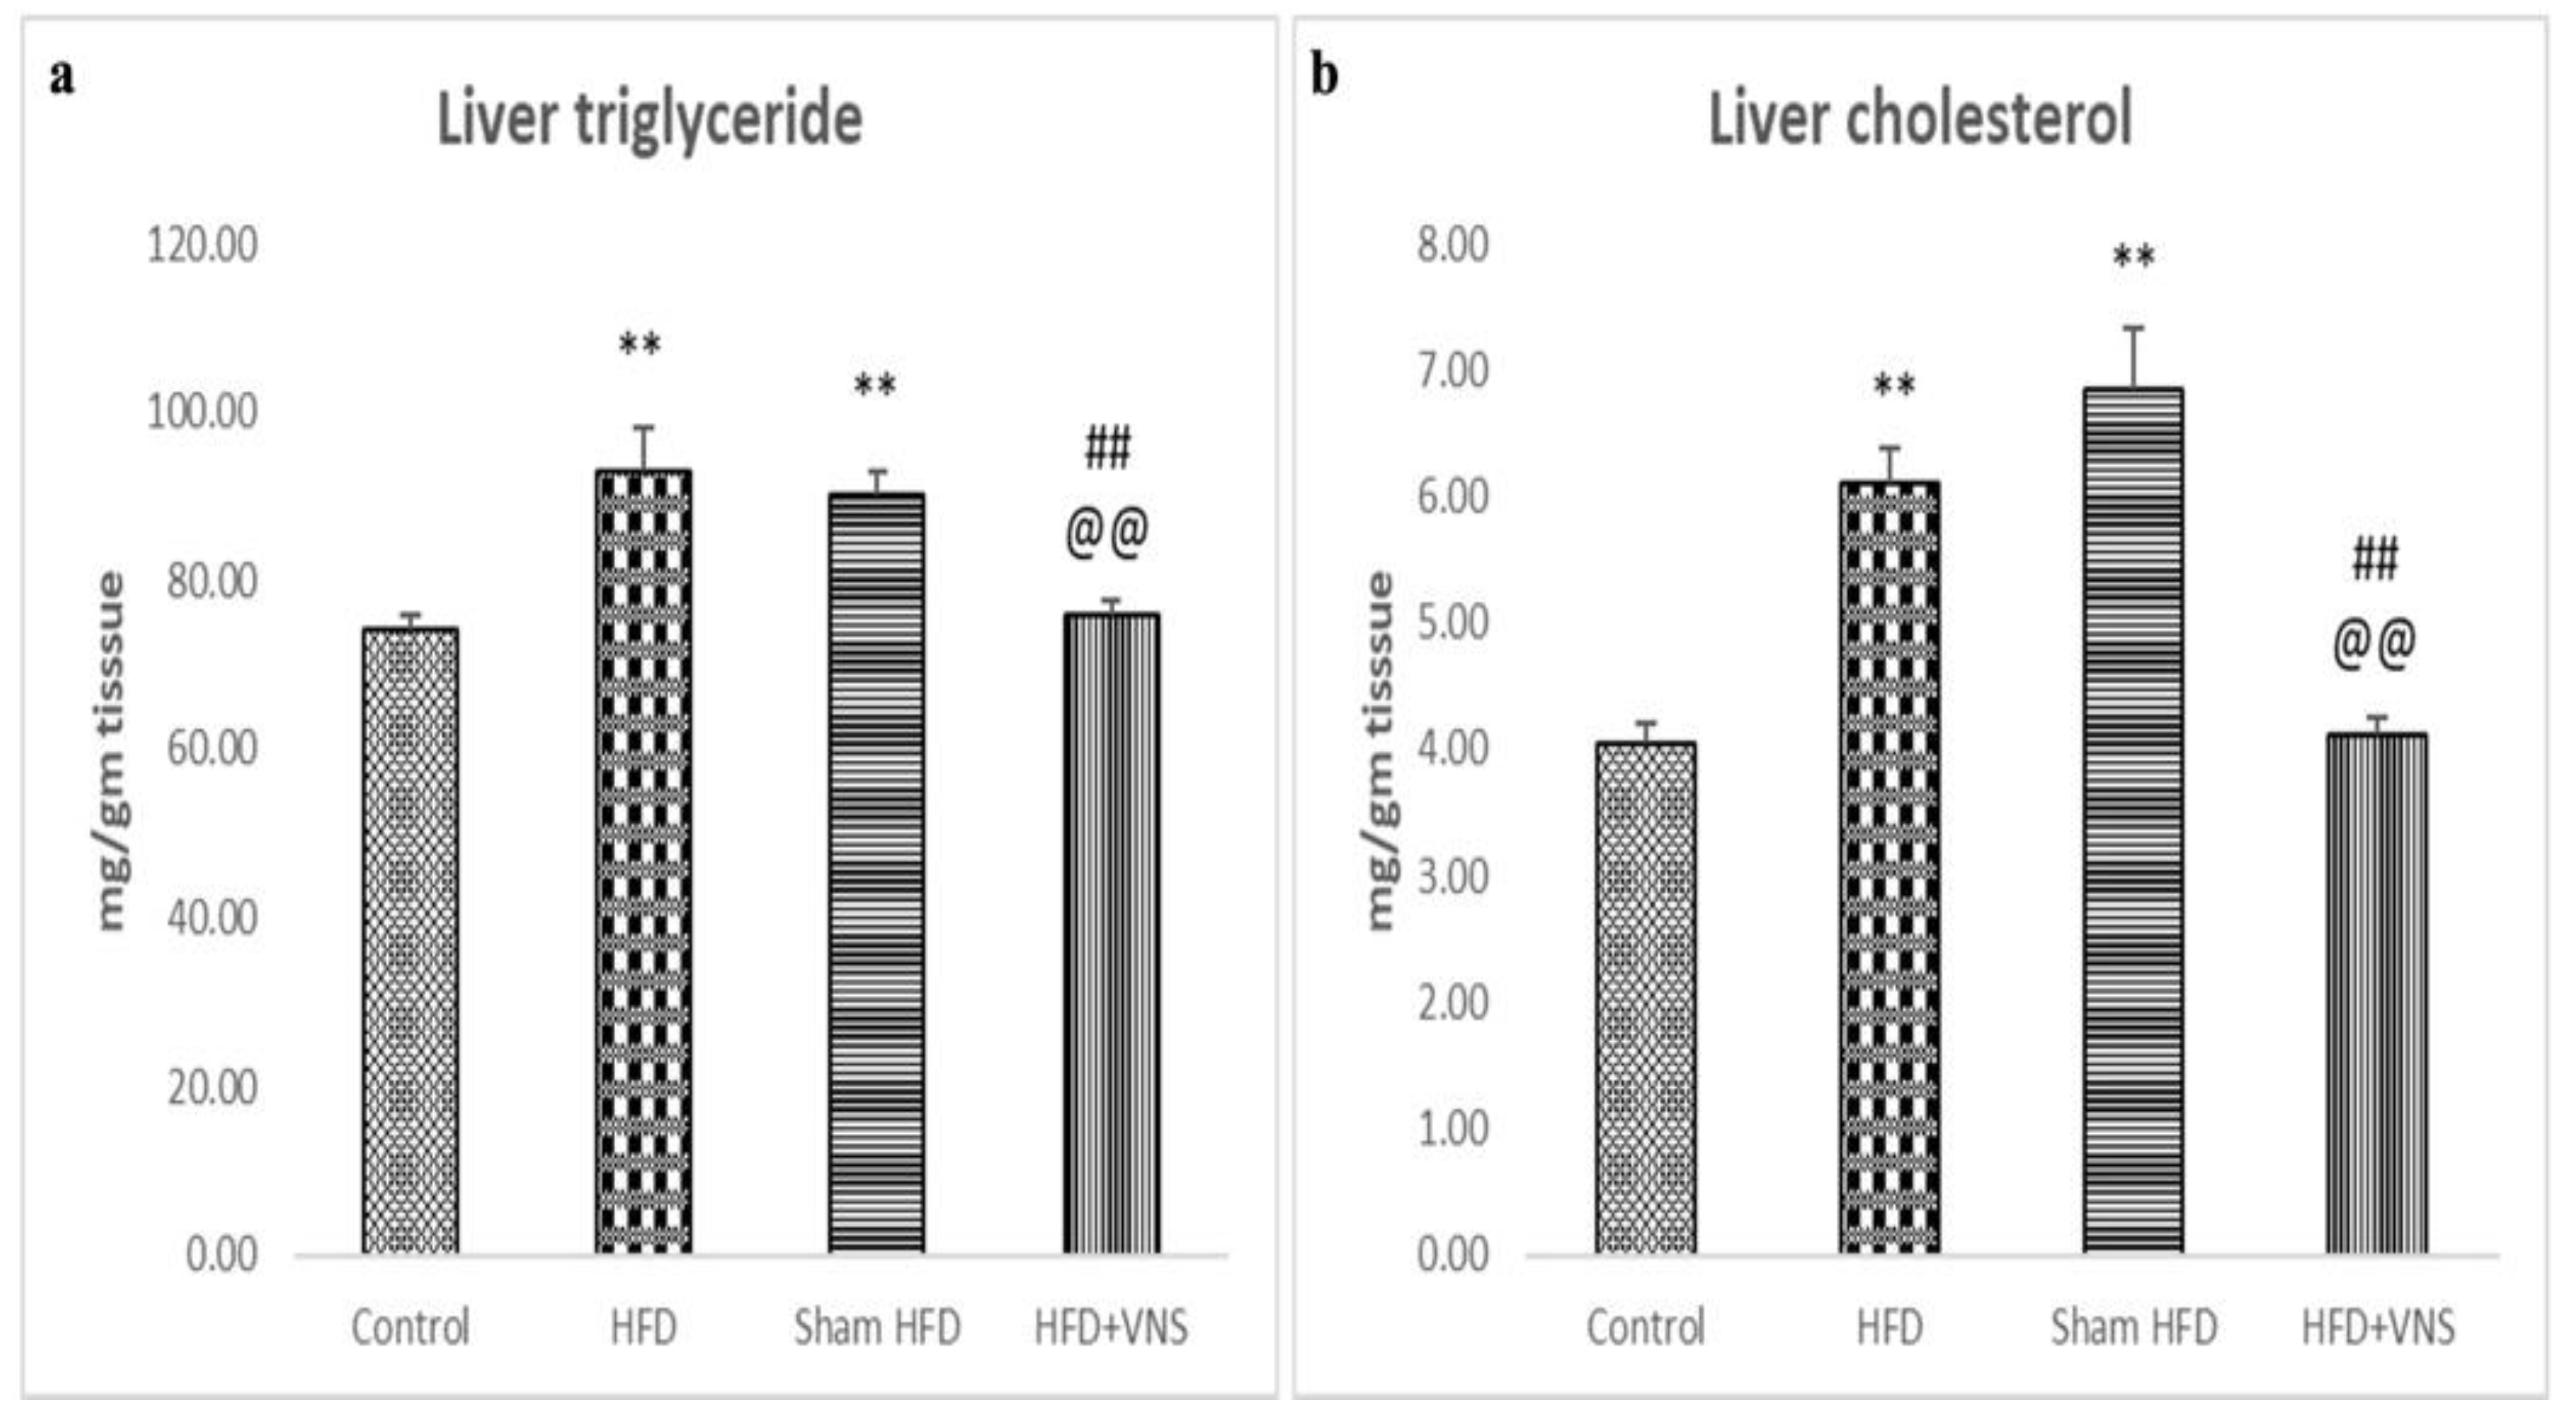
3.2. VNS Reduced HFD-Induced Accumulation of Hepatic Triglyceride and Cholesterol
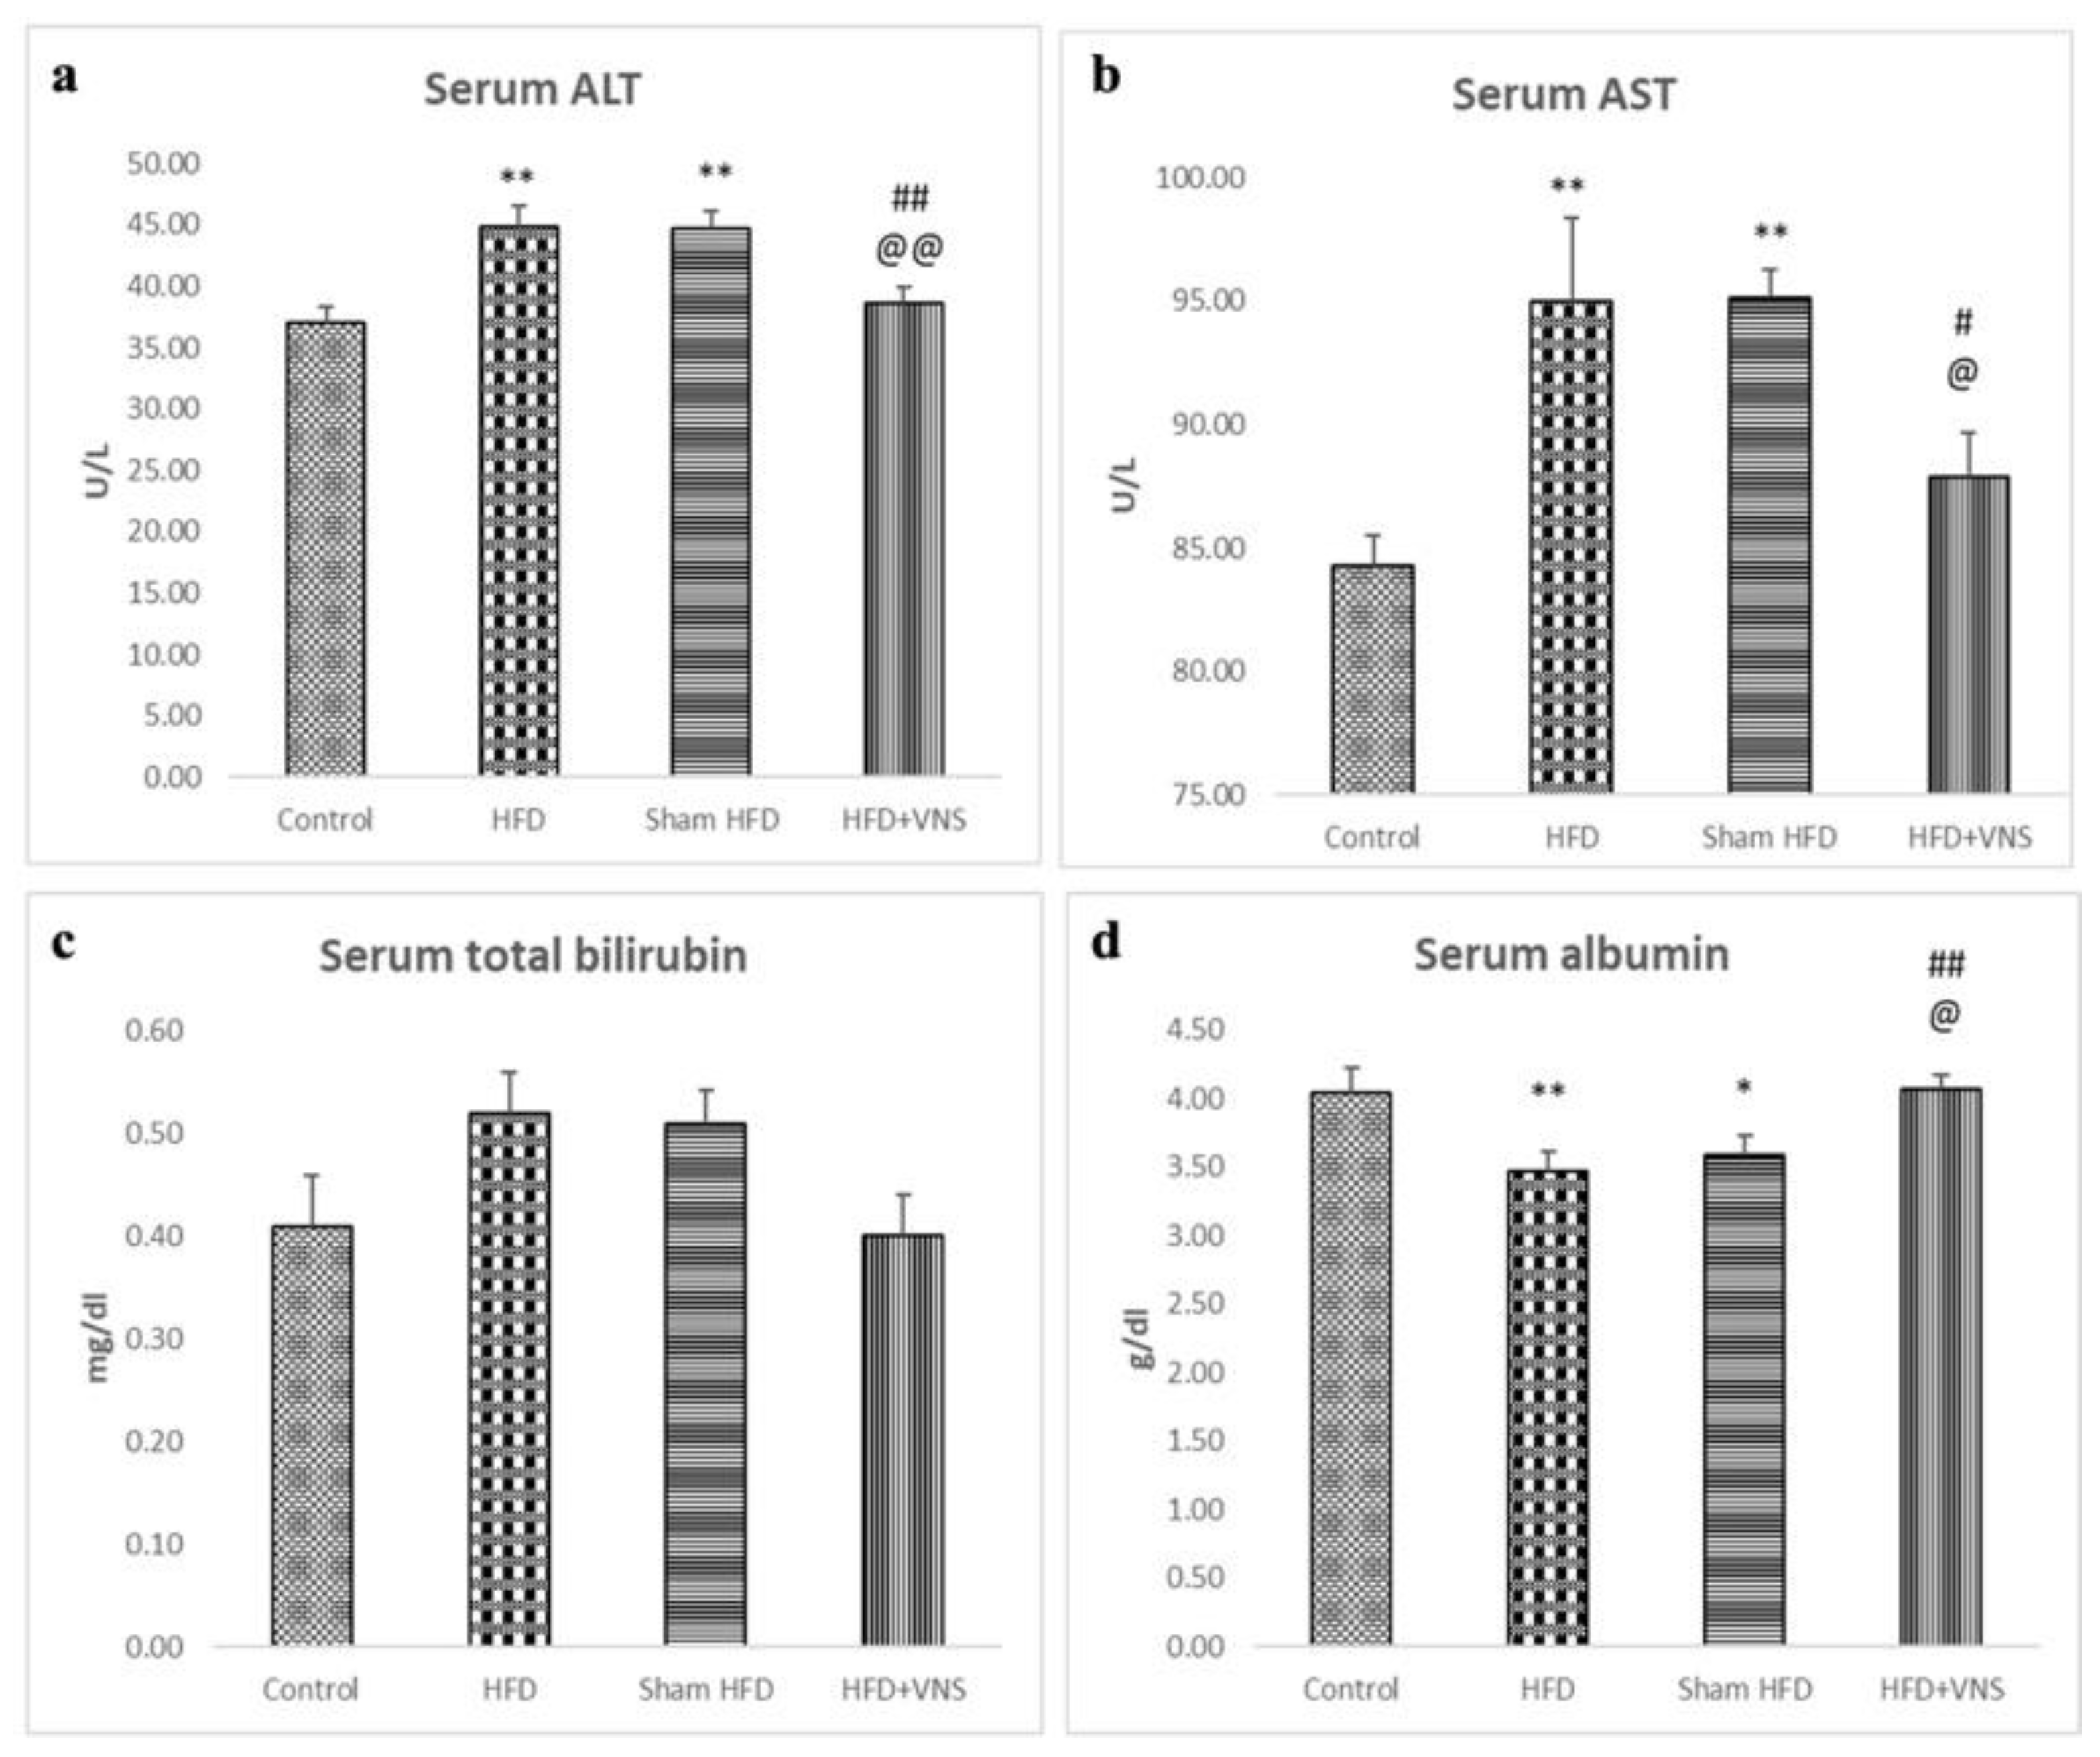
3.3. VNS Mitigated HFD-Induced Alterations in Lipid Profiles and Hepatic Functions
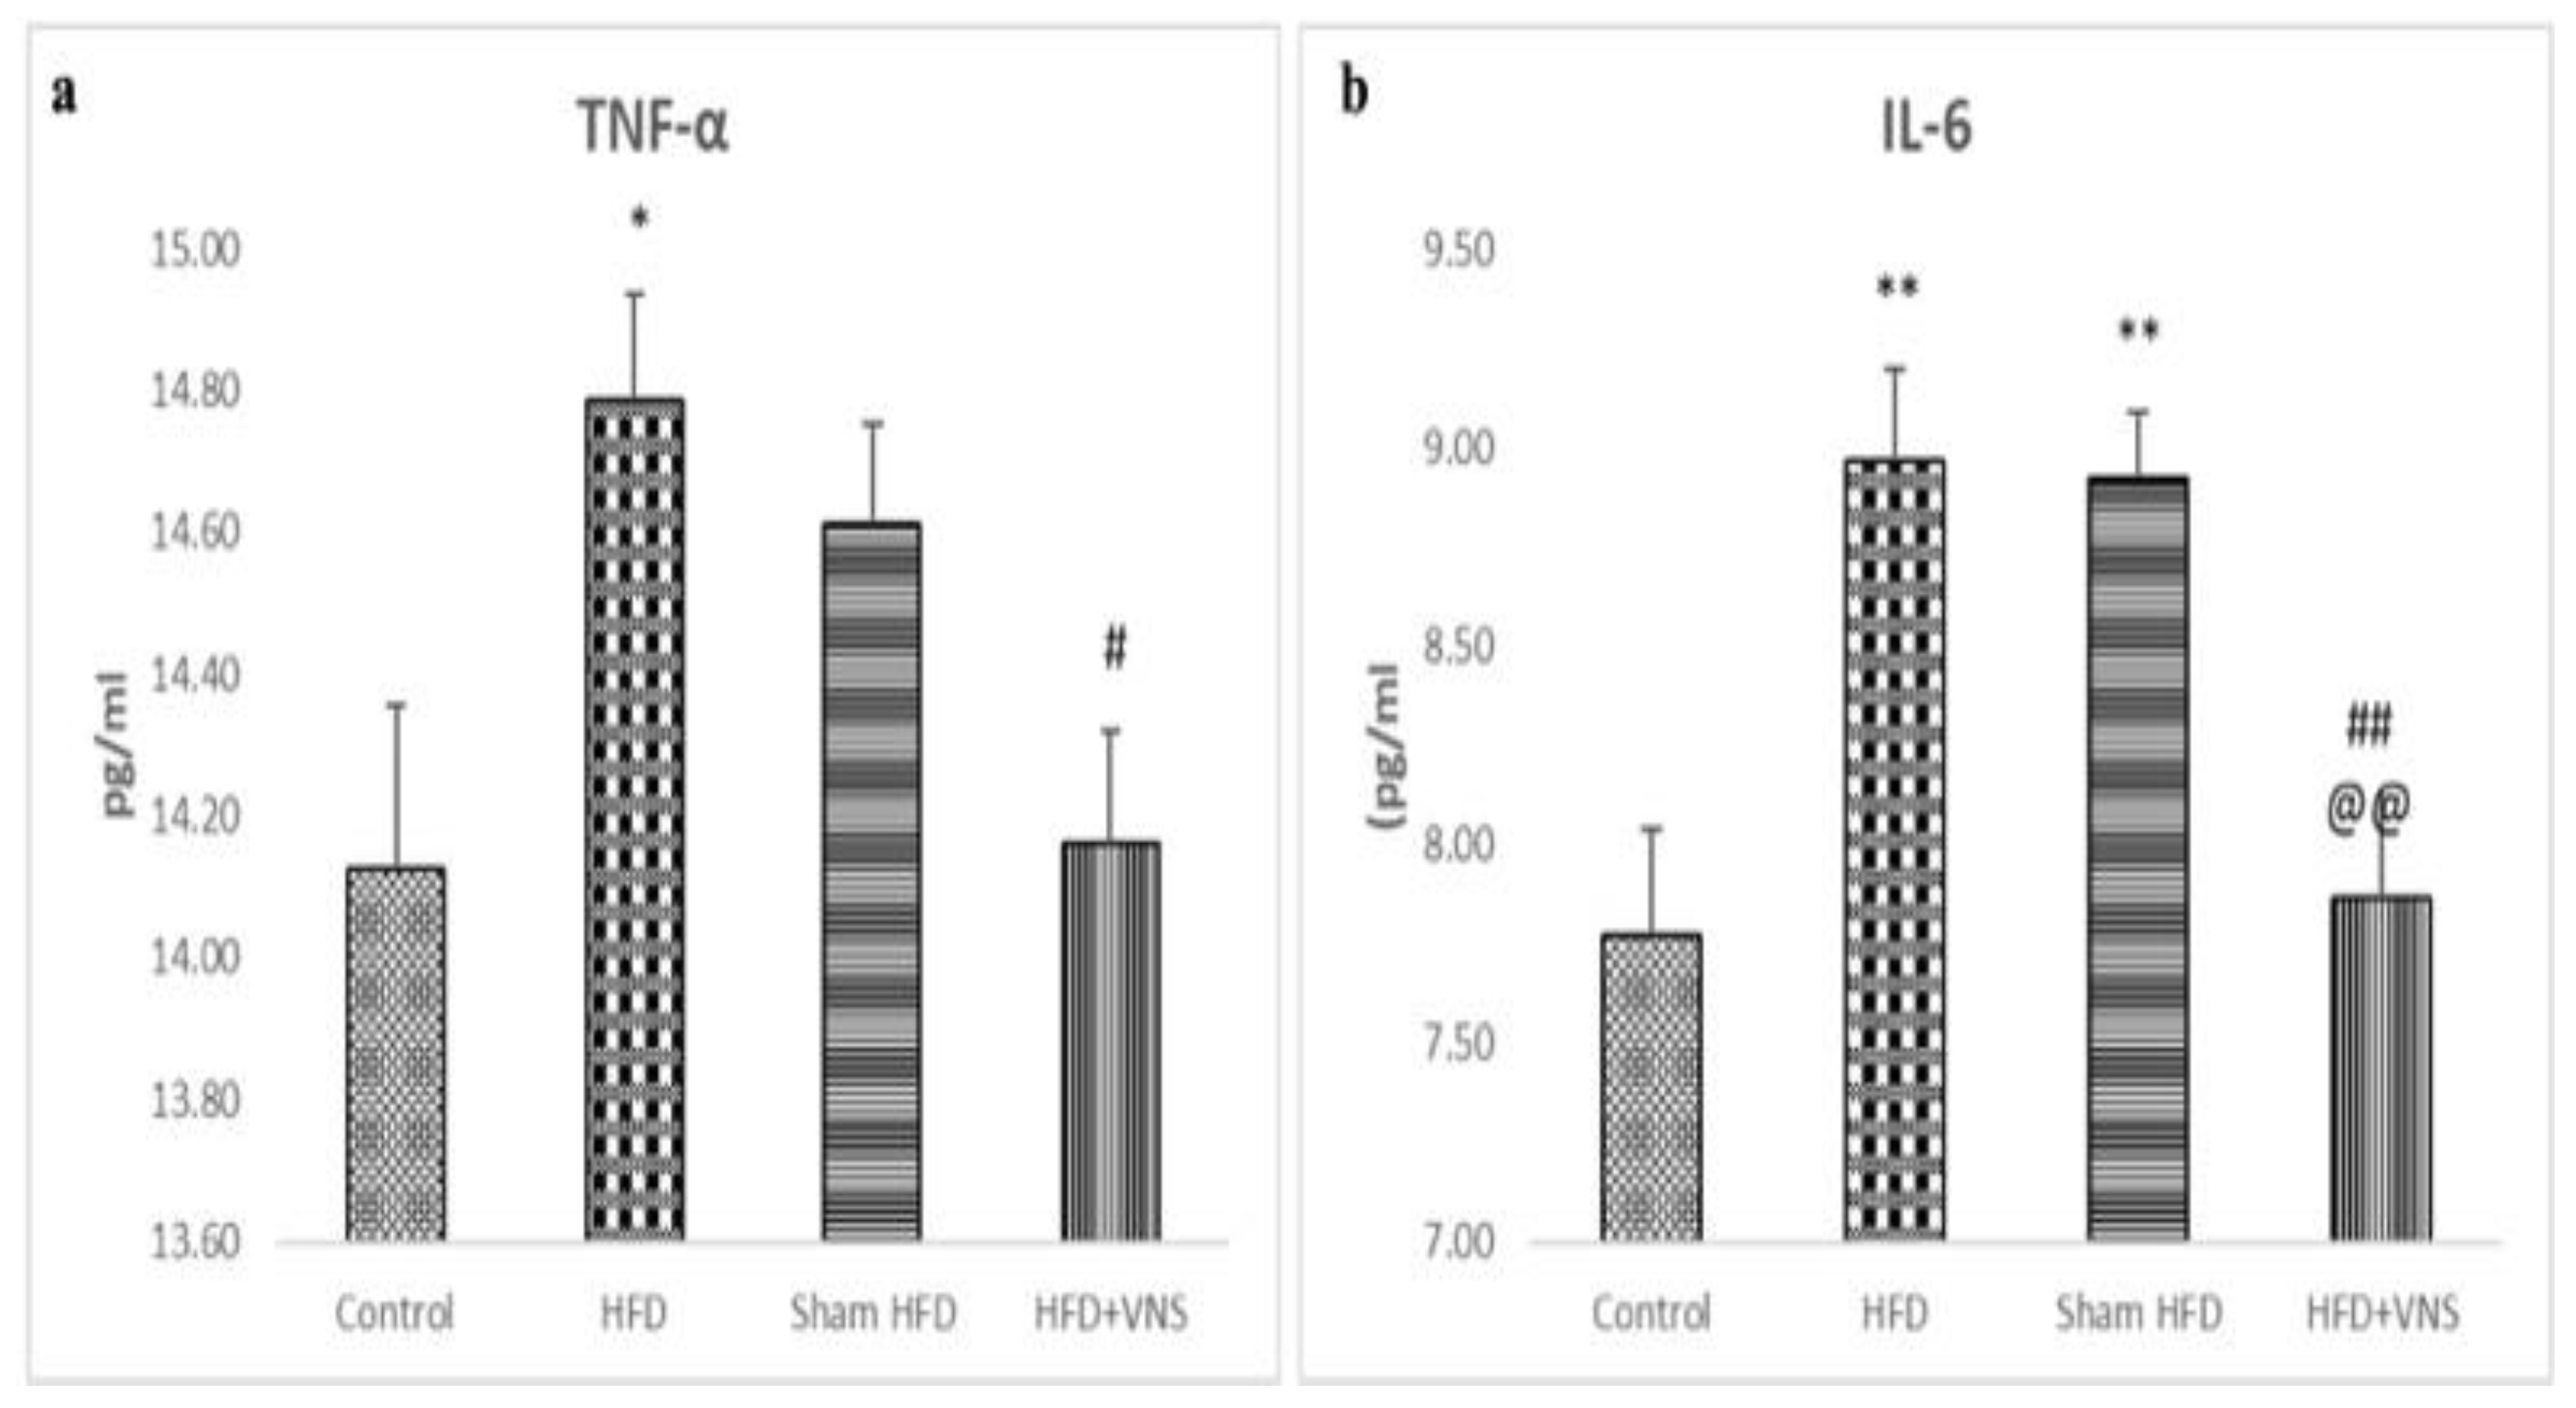
3.4. VNS Alleviated the Hepatic Inflammatory Indicators Induced by HFD
3.5. VNS Improved the Disrupted Hepatic Oxidative Stress Induced by HFD
3.6. VNS Mitigated Histological Changes Induced by HFD in Hepatic Tissue
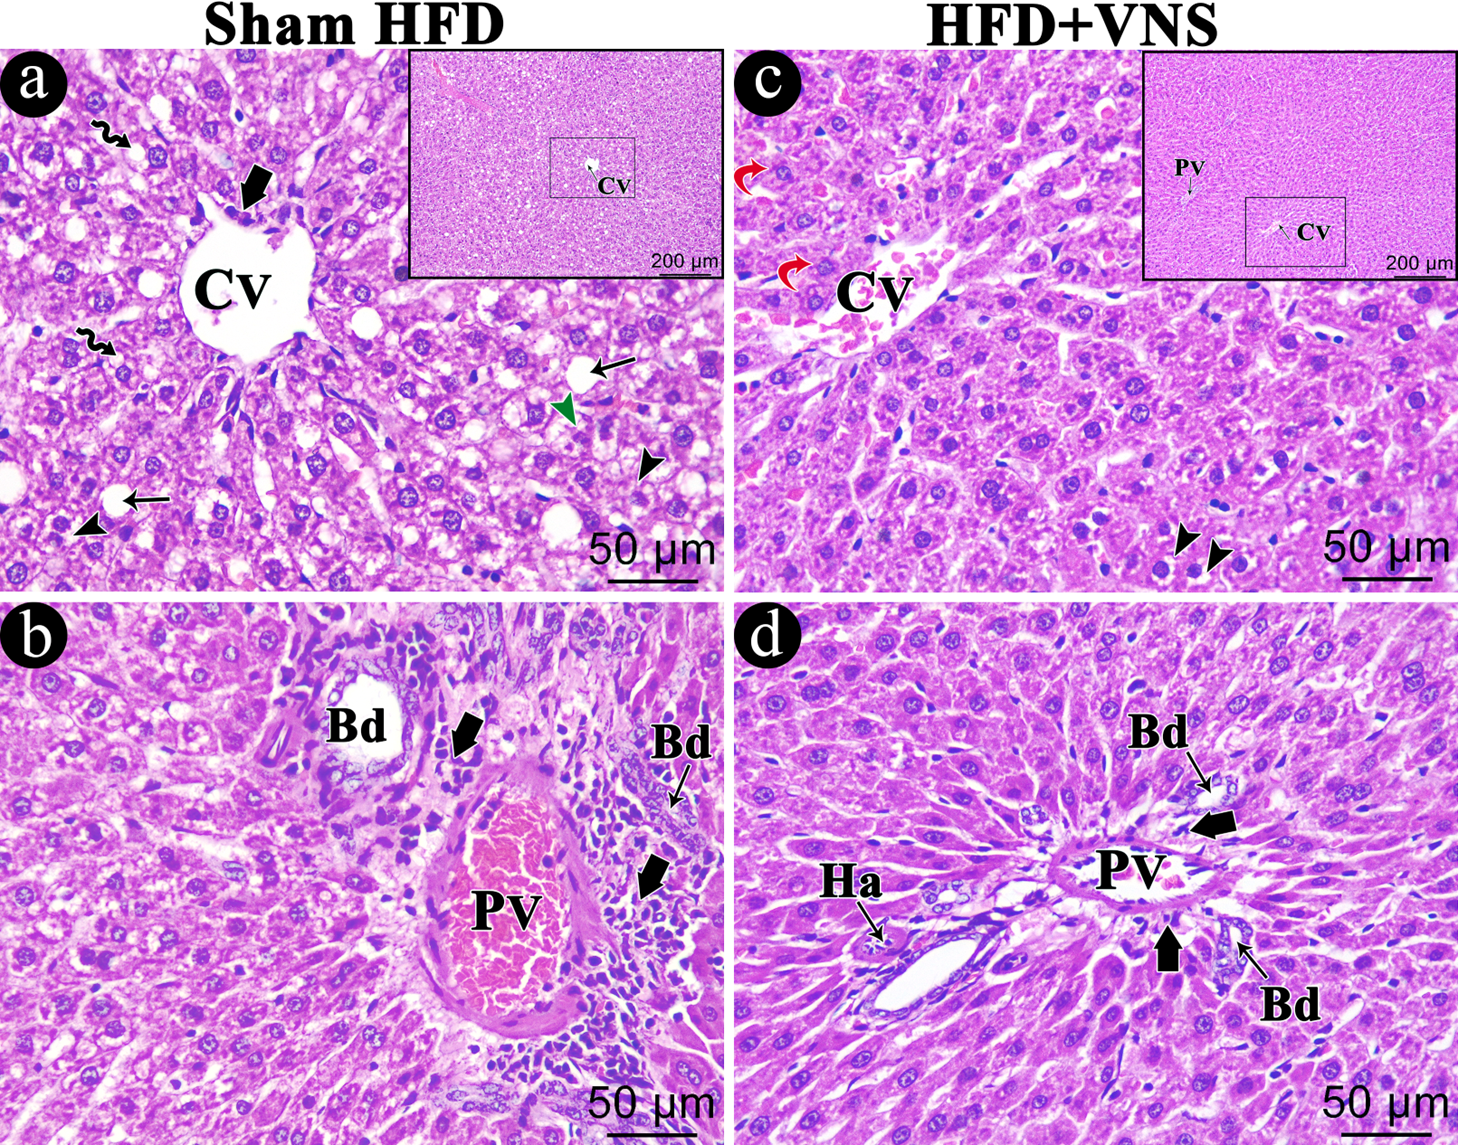
3.6.1. H & E
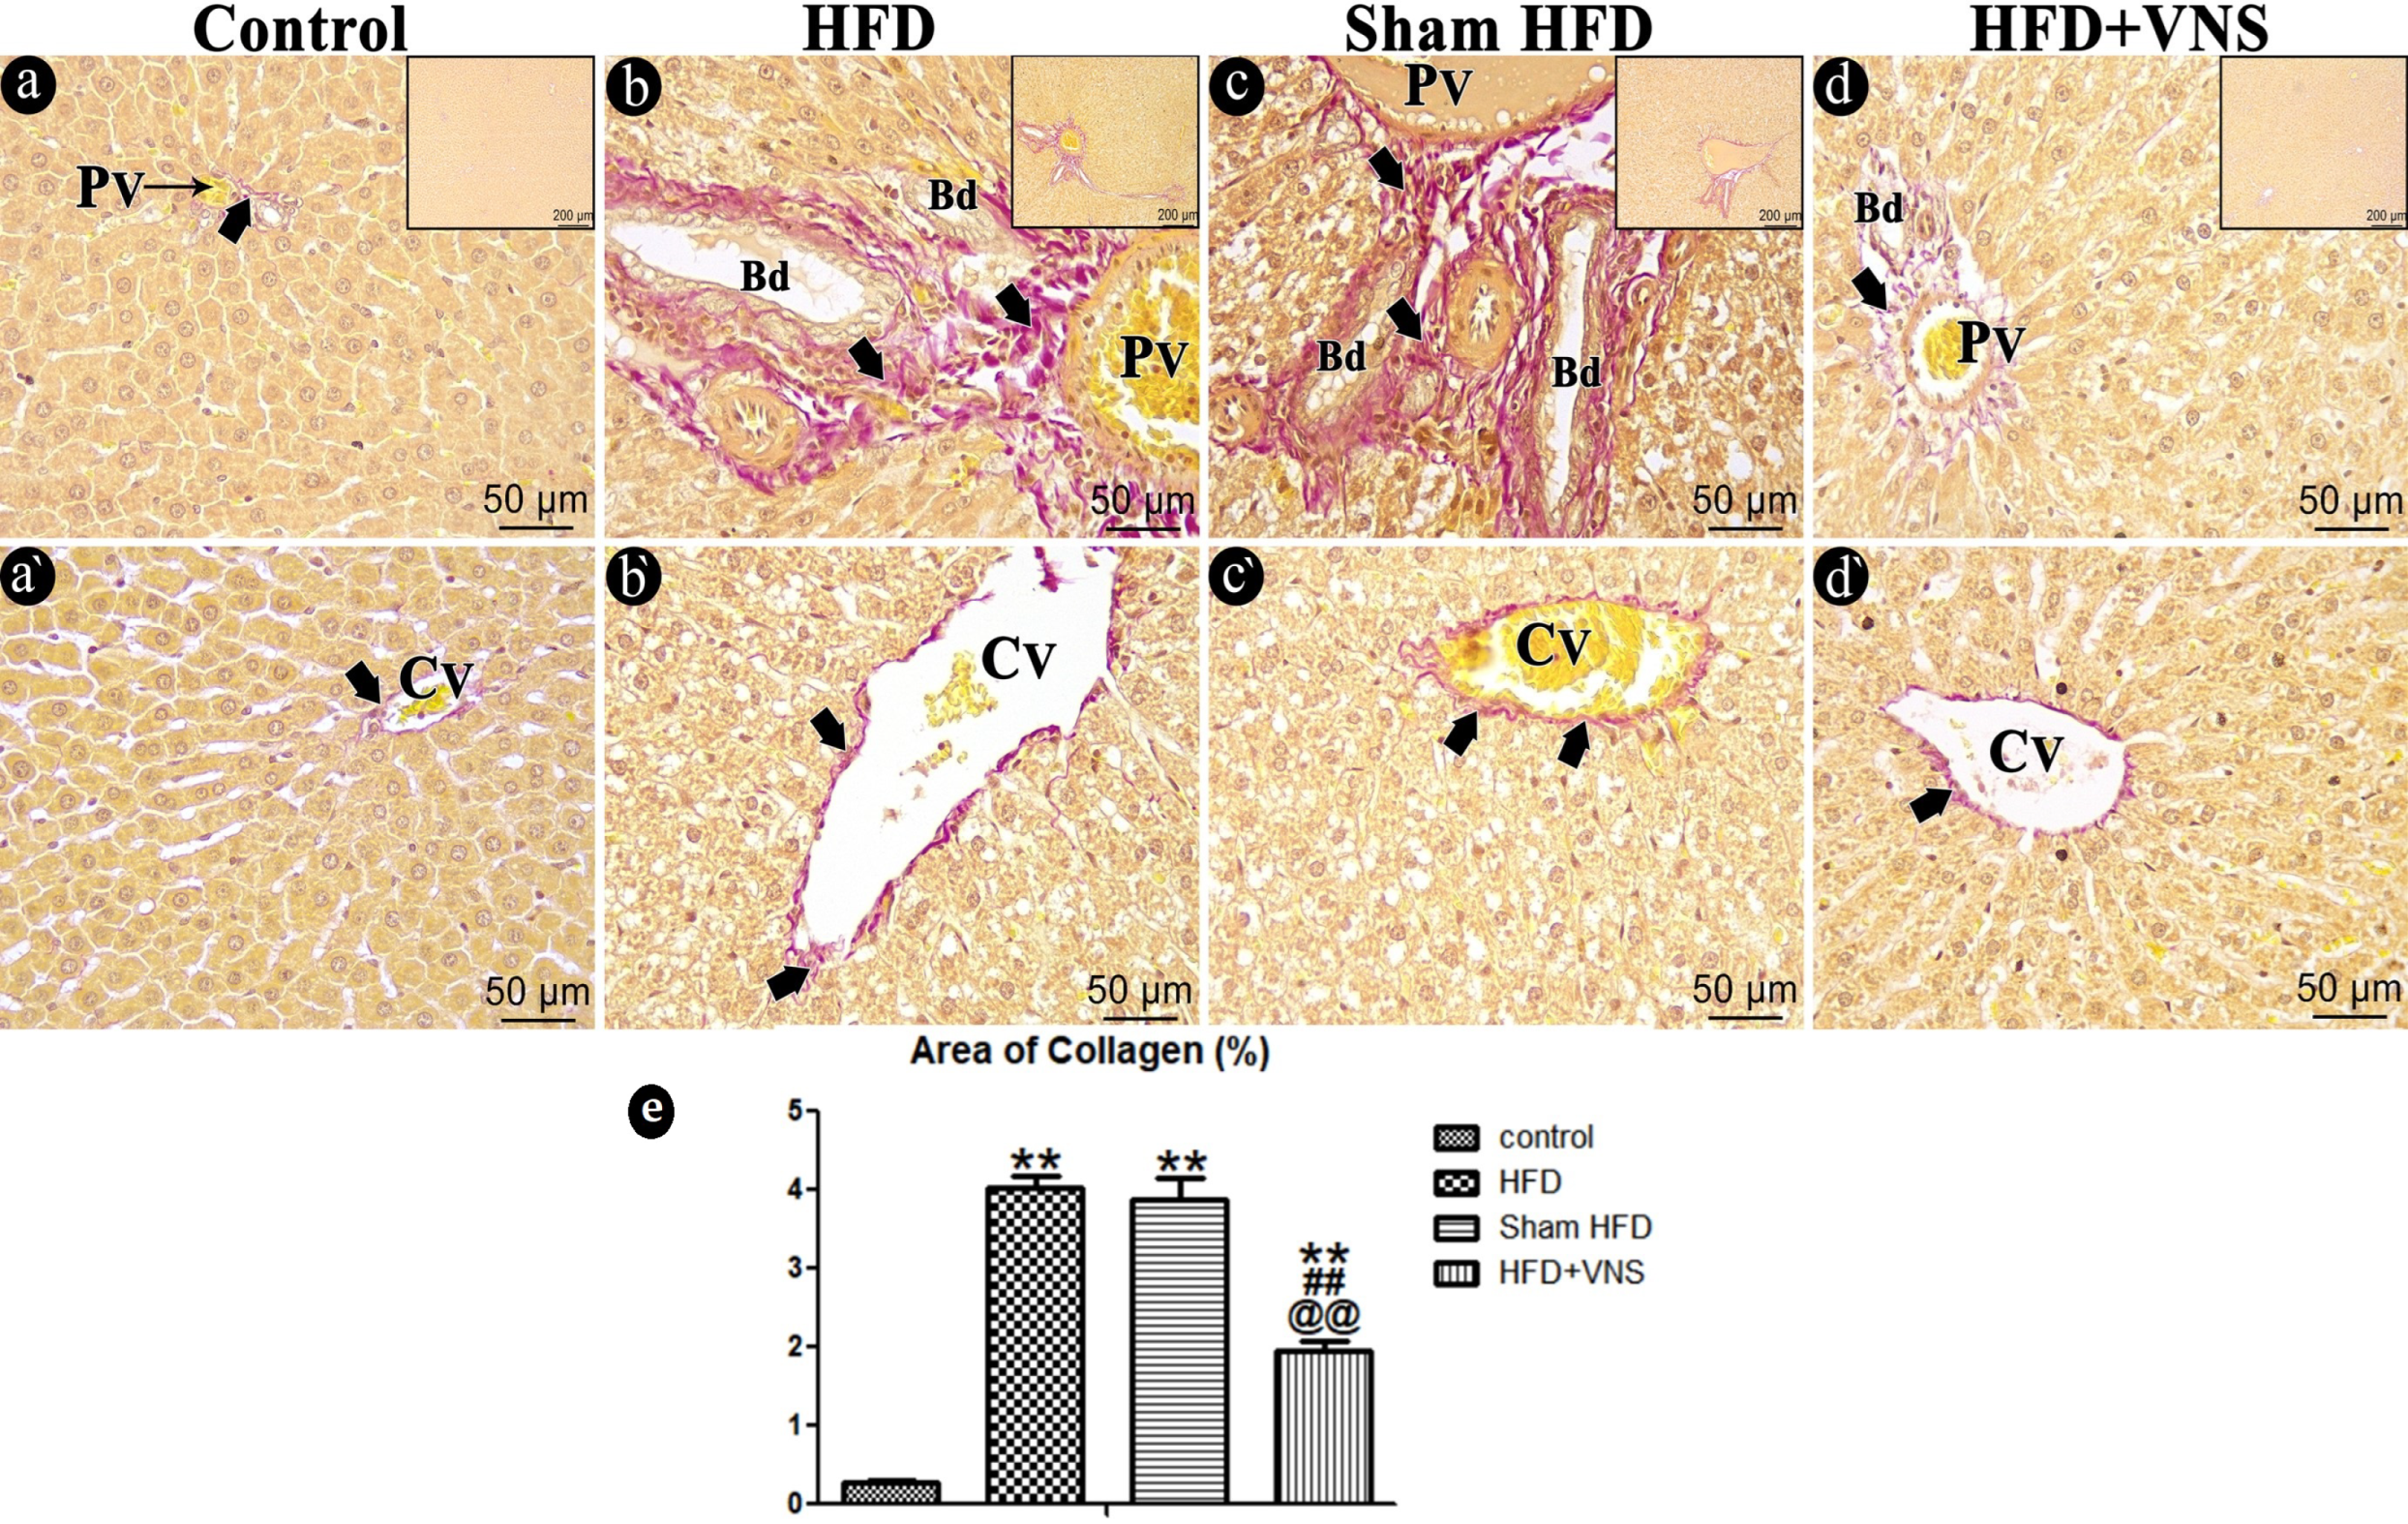
3.6.2. Sirius Red Staining
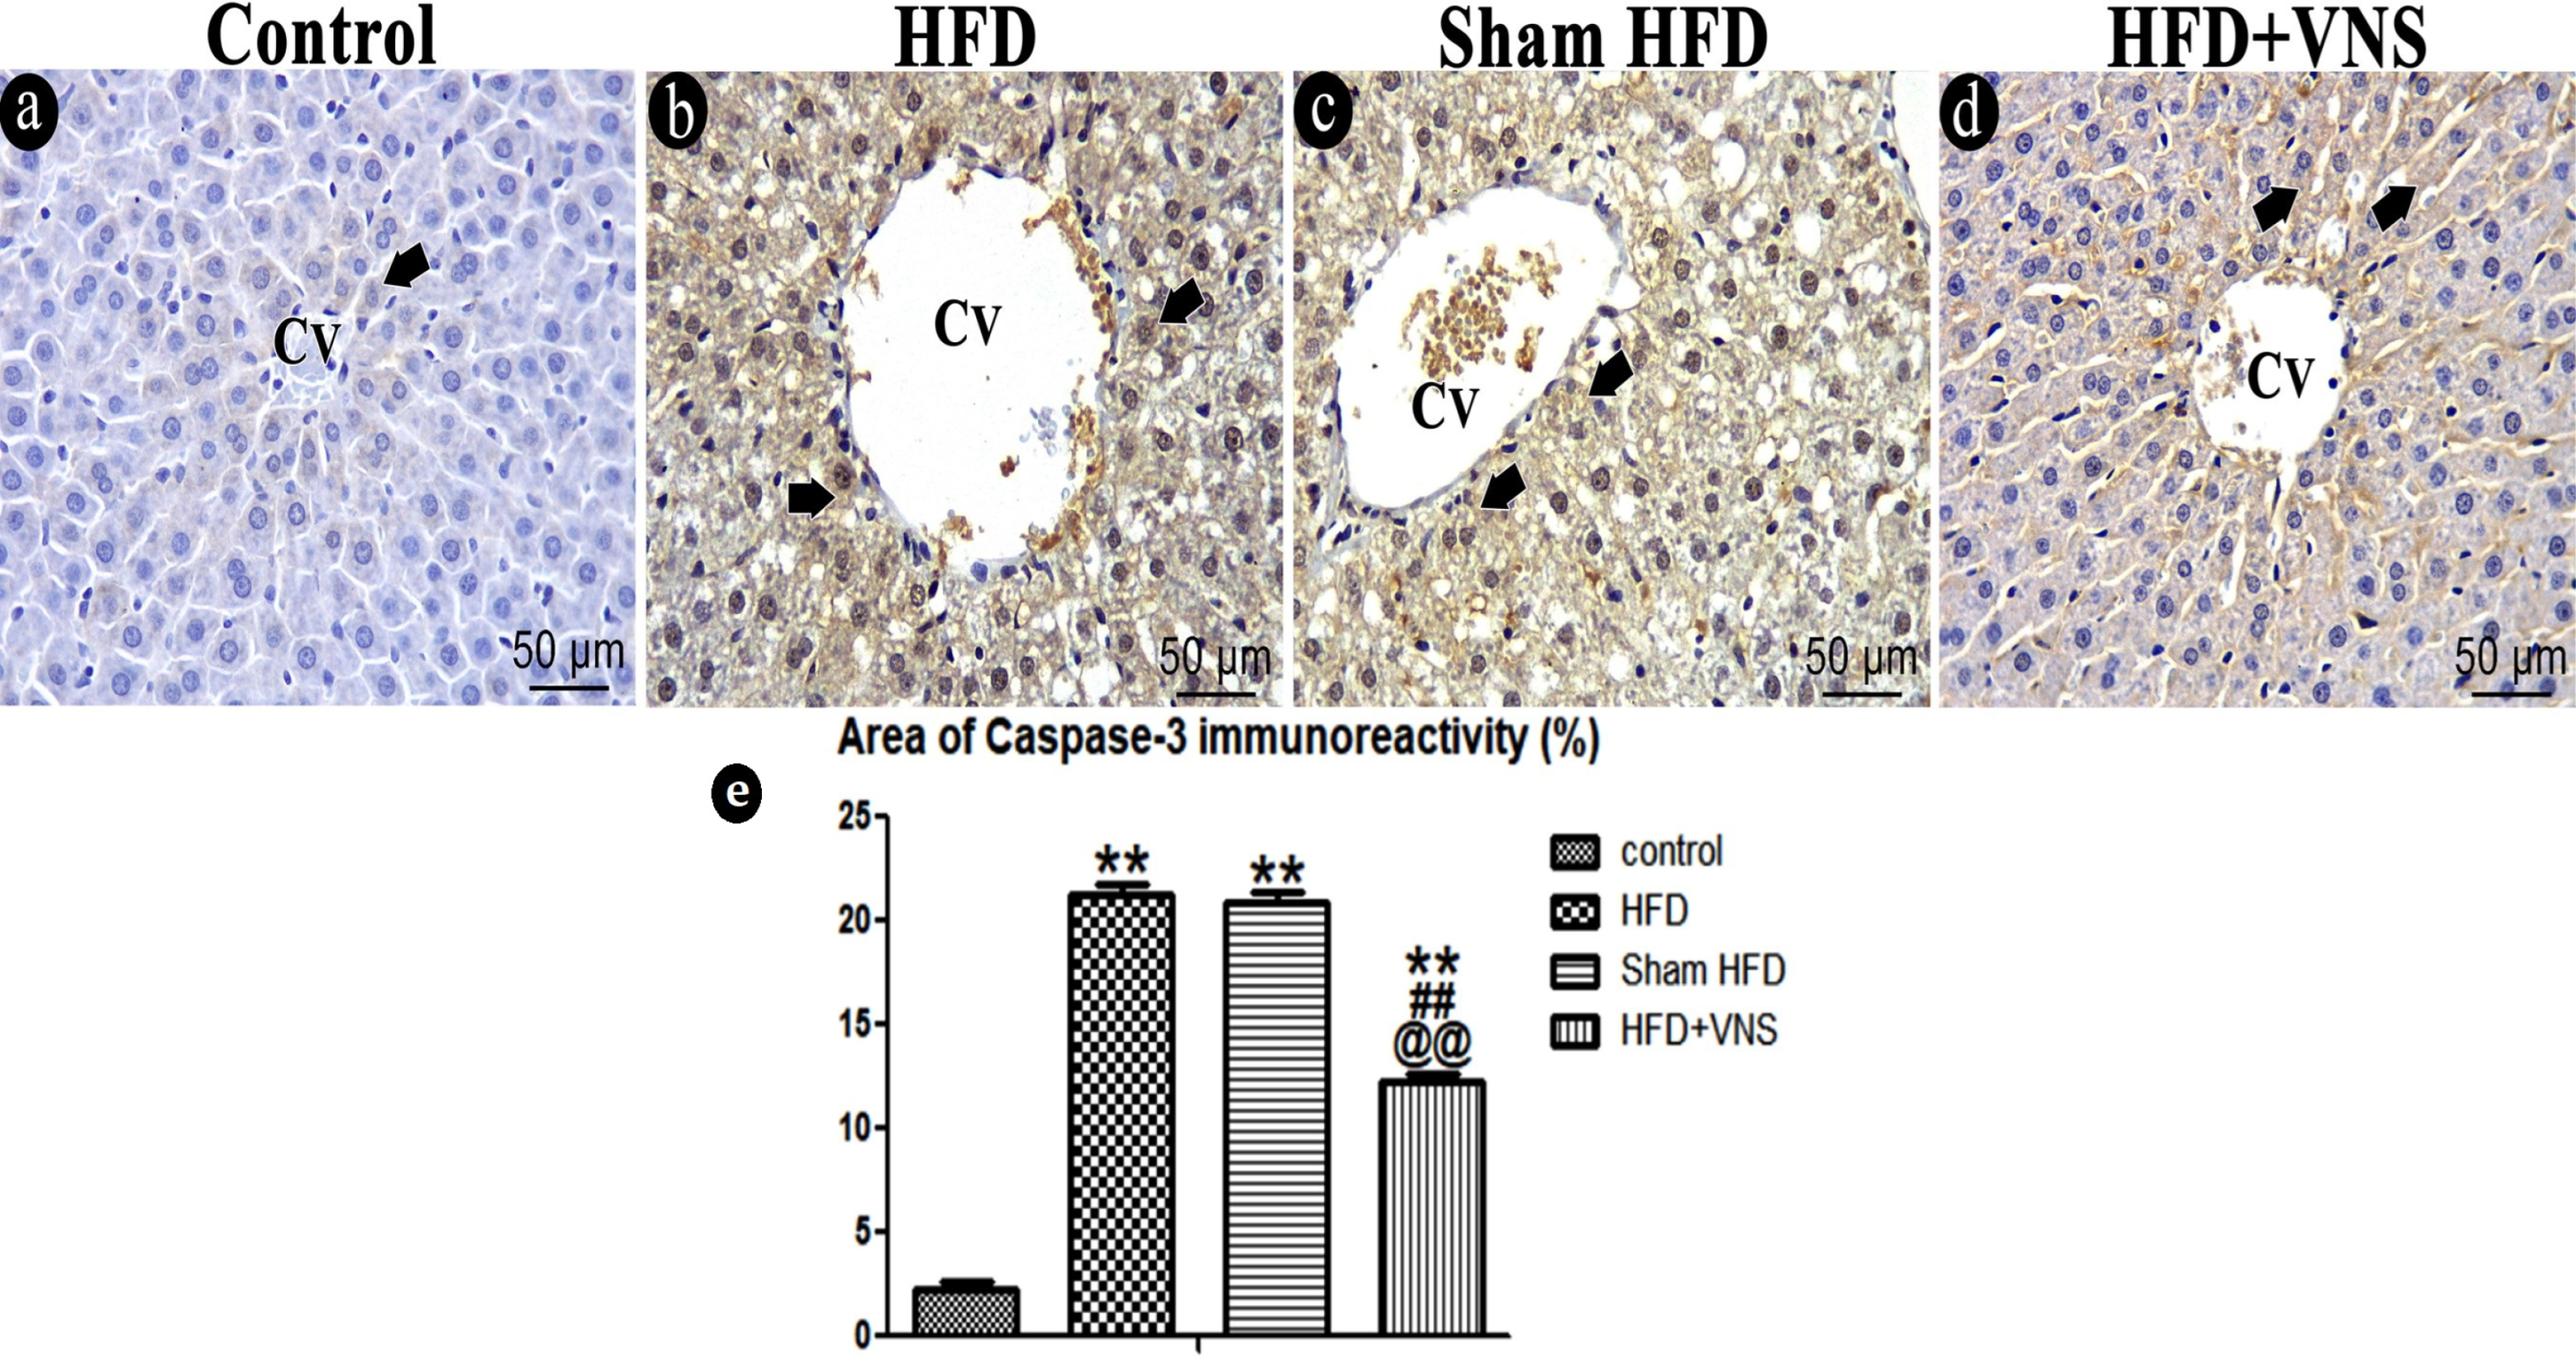
3.6.3. Immunostaining
3.7. VNS Mitigated Ultrastructural Changes Induced by HFD in Hepatic Tissue
4. Discussion
5. Limitations of the Study
6. Conclusions
Author Contributions
Funding
Institutional Review Board Statement
Informed Consent Statement
Data Availability Statement
Acknowledgments
Conflicts of Interest
References
- Pouwels, S.; Sakran, N.; Graham, Y.; Leal, A.; Pintar, T.; Yang, W.; Ramnarain, D. Non-alcoholic fatty liver disease (NAFLD): A review of pathophysiology, clinical management and effects of weight loss. BMC Endocr. Disord. 2022, 63, 1–9. [Google Scholar] [CrossRef] [PubMed]
- Ahmed, A.; Wong, R.J.; Harrison, S.A. Nonalcoholic fatty liver disease review: Diagnosis, treatment, and outcomes. Clin. Gastroenterol. Hepatol. 2015, 13, 2062–2070. [Google Scholar] [CrossRef]
- Machado, M.V.; Diehl, A.M. Pathogenesis of nonalcoholic steatohepatitis. Gastroenterology 2016, 150, 1769–1777. [Google Scholar] [CrossRef] [PubMed]
- Browning, J.D.; Szczepaniak, L.S.; Dobbins, R.; Nuremberg, P.; Horton, J.D.; Cohen, J.C.; Hobbs, H.H. Prevalence of hepatic steatosis in an urban population in the United States: Impact of ethnicity. Hepatology 2004, 40, 1387–1395. [Google Scholar] [CrossRef]
- Lozano, I.; Van der Werf, R.; Bietiger, W.; Seyfritz, E.; Peronet, C.; Pinget, M.; Dal, S. High-fructose and high-fat diet-induced disorders in rats: Impact on diabetes risk, hepatic and vascular complications. Nutr. Metab. 2016, 13, 1–13. [Google Scholar] [CrossRef] [PubMed]
- Jiang, Y.; Li, L.; Liu, B.; Zhang, Y.; Chen, Q.; Li, C. PPARγ upregulation induced by vagus nerve stimulation exerts an anti-inflammatory effect in cerebral ischemia/reperfusion rats. Med. Sci. Monit. Int. Med. J. Exp. Clin. Res. 2015, 21, 268. [Google Scholar]
- Liu, C.; Bookout, A.L.; Lee, S.; Sun, K.; Jia, L.; Lee, C.; Elmquist, J.K. PPARγ in vagal neurons regulates high-fat diet-induced thermogenesis. Cell Metab. 2014, 19, 722–730. [Google Scholar] [CrossRef]
- Loper, H.; Leinen, M.; Bassoff, L.; Sample, J.; Romero-Ortega, M.; Gustafson, K.J.; Schiefer, M.A. Both high fat and high carbohydrate diets impair vagus nerve signaling of satiety. Sci. Rep. 2021, 11, 10394. [Google Scholar] [CrossRef]
- George, M.S.; Sackeim, H.A.; Rush, A.J.; Marangell, L.B.; Nahas, Z.; Husain, M.M.; Ballenger, J.C. Vagus nerve stimulation: A new tool for brain research and therapy∗. Biol. Psychiatry 2000, 47, 287–295. [Google Scholar] [CrossRef]
- Bonaz, B.; Sinniger, V.; Pellissier, S. Therapeutic potential of vagus nerve stimulation for inflammatory bowel diseases. Front. Neurosci. 2021, 15, 650971. [Google Scholar] [CrossRef]
- De Lartigue, G. Role of the vagus nerve in the development and treatment of diet-induced obesity. J. Physiol. 2016, 594, 5791–5815. [Google Scholar] [CrossRef] [PubMed]
- Reichelt, A.; Westbrook, R.; Morris, M. Integration of reward signalling and appetite regulating peptide systems in the control of food-cue responses. Br. J. Pharmacol. 2015, 172, 5225–5238. [Google Scholar] [CrossRef] [PubMed]
- Murray, A.R.; Atkinson, L.; Mahadi, M.K.; Deuchars, S.A.; Deuchars, J. The strange case of the ear and the heart: The auricular vagus nerve and its influence on cardiac control. Auton. Neurosci. 2016, 199, 48–53. [Google Scholar] [CrossRef] [PubMed]
- Antonino, D.; Teixeira, A.L.; Maia-Lopes, P.M.; Souza, M.C.; Sabino-Carvalho, J.L.; Murray, A.R.; Vianna, L.C. Non-invasive vagus nerve stimulation acutely improves spontaneous cardiac baroreflex sensitivity in healthy young men: A randomized placebo-controlled trial. Brain Stimul. 2017, 10, 875–881. [Google Scholar] [CrossRef] [PubMed]
- Clancy, J.A.; Mary, D.A.; Witte, K.K.; Greenwood, J.P.; Deuchars, S.A.; Deuchars, J. Non-invasive vagus nerve stimulation in healthy humans reduces sympathetic nerve activity. Brain Stimul. 2014, 7, 871–877. [Google Scholar] [CrossRef]
- Carnethon, M.R.; Jacobs, D.R., Jr.; Sidney, S.; Liu, K. Influence of autonomic nervous system dysfunction on the development of type 2 diabetes: The CARDIA study. Diabetes Care 2003, 26, 3035–3041. [Google Scholar] [CrossRef]
- Lumeng, C.N.; Saltiel, A.R. Inflammatory links between obesity and metabolic disease. J. Clin. Investig. 2011, 121, 2111–2117. [Google Scholar] [CrossRef]
- Saltiel, A.R.; Olefsky, J.M. Inflammatory mechanisms linking obesity and metabolic disease. J. Clin. Investig. 2017, 127, 1–4. [Google Scholar] [CrossRef]
- Wang, S.; Zhai, X.; Li, S.; McCabe, M.F.; Wang, X.; Rong, P. Transcutaneous vagus nerve stimulation induces tidal melatonin secretion and has an antidiabetic effect in Zucker fatty rats. PLoS ONE 2015, 10, e0124195. [Google Scholar] [CrossRef]
- Stavrakis, S.; Humphrey, M.B.; Scherlag, B.J.; Hu, Y.; Jackman, W.M.; Nakagawa, H.; Po, S.S. Low-level transcutaneous electrical vagus nerve stimulation suppresses atrial fibrillation. J. Am. Coll. Cardiol. 2015, 65, 867–875. [Google Scholar] [CrossRef]
- Ay, I.; Nasser, R.; Simon, B.; Ay, H. Transcutaneous cervical vagus nerve stimulation ameliorates acute ischemic injury in rats. Brain Stimul. 2016, 9, 166–173. [Google Scholar] [CrossRef] [PubMed]
- Nascimento, A.F.; Sugizaki, M.M.; Leopoldo, A.S.; Lima-Leopoldo, A.P.; Nogueira, C.R.; Novelli, E.L.; Cicogna, A.C. Misclassification probability as obese or lean in hypercaloric and normocaloric diet. Biol. Res. 2008, 41, 253–259. [Google Scholar] [CrossRef] [PubMed]
- Novelli, E.; Diniz, Y.; Galhardi, C.; Ebaid, G.; Rodrigues, H.; Mani, F.; Novelli Filho, J.L.V.B. Anthropometrical parameters and markers of obesity in rats. Lab. Anim. 2007, 41, 111–119. [Google Scholar] [CrossRef] [PubMed]
- Li, H.; Zhang, J.-B.; Xu, C.; Tang, Q.-Q.; Shen, W.-X.; Zhou, J.-Z.; Wang, Y.P. Effects and mechanisms of auricular vagus nerve stimulation on high-fat-diet—Induced obese rats. Nutrition 2015, 31, 1416–1422. [Google Scholar] [CrossRef]
- Bonora, E.; Targher, G.; Alberiche, M.; Bonadonna, R.C.; Saggiani, F.; Zenere, M.B.; Muggeo, M. Homeostasis model assessment closely mirrors the glucose clamp technique in the assessment of insulin sensitivity: Studies in subjects with various degrees of glucose tolerance and insulin sensitivity. Diabetes Care 2000, 23, 57–63. [Google Scholar] [CrossRef]
- Friedewald, W.T.; Levy, R.I.; Fredrickson, D.S. Estimation of the concentration of low-density lipoprotein cholesterol in plasma, without use of the preparative ultracentrifuge. Clin. Chem. 1972, 18, 499–502. [Google Scholar] [CrossRef]
- Folch, J.; Lees, M.; Sloane Stanley, G.H. A simple method for the isolation and purification of total lipids from animal tissues. J. Biol. Chem. 1957, 226, 497–509. [Google Scholar] [CrossRef]
- Foster, L.B.; Dunn, R.T. Stable reagents for determination of serum triglycerides by a colorimetric Hantzsch condensation method. Clin. Chem. 1973, 19, 338–340. [Google Scholar] [CrossRef]
- Varshney, R.; Kale, R. Modulation of radiation induced lipid peroxidation by phospholipase A2 and calmodulin antagonists: Relevance to detoxification. Radiat. Phys. Chem. 1995, 45, 671–675. [Google Scholar] [CrossRef]
- Misra, H.P.; Fridovich, I. The role of superoxide anion in the autoxidation of epinephrine and a simple assay for superoxide dismutase. J. Biol. Chem. 1972, 247, 3170–3175. [Google Scholar] [CrossRef]
- Rajurkar, R.B.; Khan, Z.H.; Gujar, G.T. Studies on levels of glutathione S-transferase, its isolation and purification from Helicoverpa armigera. Curr. Sci. 2003, 85, 1355–1360. [Google Scholar]
- Paglia, D.E.; Valentine, W.N. Studies on the quantitative and qualitative characterization of erythrocyte glutathione peroxidase. J. Lab. Clin. Med. 1967, 70, 158–169. [Google Scholar] [PubMed]
- Layton, C.; Bancroft, J.D. Carbohydrates. In Bancroft’s Theory and Practice of Histological Techniques; Suvarna, K.S., Layton, C., Bancroft, J.D., Eds.; Elsevier Health Sciences: Amsterdam, The Netherlands, 2018; pp. 97–176. [Google Scholar]
- Kleiner, D.E.; Brunt, E.M.; Van Natta, M.; Behling, C.; Contos, M.J.; Cummings, O.W.; Ferrell, L.D. Design and validation of a histological scoring system for nonalcoholic fatty liver disease. Hepatology 2005, 41, 1313–1321. [Google Scholar] [CrossRef] [PubMed]
- Kiernan, J. Histological and Histochemical Methods, Theory and Practice; Scion Publishing Ltd.: Banbury, UK, 2015; pp. 184–205&455–490. [Google Scholar]
- Pavlov, V.A. The evolving obesity challenge: Targeting the vagus nerve and the inflammatory reflex in the response. Pharmacol. Ther. 2021, 222, 107794. [Google Scholar] [CrossRef] [PubMed]
- Vetrano, E.; Rinaldi, L.; Mormone, A.; Giorgione, C.; Galiero, R.; Caturano, A.; Sasso, F.C. Non-alcoholic fatty liver disease (NAFLD), type 2 diabetes, and non-viral hepatocarcinoma: Pathophysiological mechanisms and new therapeutic strategies. Biomedicines 2023, 11, 468. [Google Scholar] [CrossRef] [PubMed]
- Malbert, C.-H.; Picq, C.; Divoux, J.-L.; Henry, C.; Horowitz, M. Obesity-associated alterations in glucose metabolism are reversed by chronic bilateral stimulation of the abdominal vagus nerve. Diabetes 2017, 66, 848–857. [Google Scholar] [CrossRef] [PubMed]
- Samniang, B.; Shinlapawittayatorn, K.; Chunchai, T.; Pongkan, W.; Kumfu, S.; Chattipakorn, S.C.; Chattipakorn, N. Vagus nerve stimulation improves cardiac function by preventing mitochondrial dysfunction in obese-insulin resistant rats. Sci. Rep. 2016, 6, 19749. [Google Scholar] [CrossRef] [PubMed]
- Xu, L.; Kitade, H.; Ni, Y.; Ota, T. Roles of chemokines and chemokine receptors in obesity-associated insulin resistance and nonalcoholic fatty liver disease. Biomolecules 2015, 5, 1563–1579. [Google Scholar] [CrossRef]
- Elks, C.M.; Francis, J. Central adiposity, systemic inflammation, and the metabolic syndrome. Curr. Hypertens. Rep. 2010, 12, 99–104. [Google Scholar] [CrossRef]
- Wang., Z.; Yu, L.; Wang, S.; Huang, B.; Liao, K.; Saren, G.; Tan, T.; Jiang, H. Chronic intermittent low-level transcutaneous electrical stimulation of auricular branch of vagus nerve improves left ventricular remodeling in conscious dogs with healed myocardial infarction. Circ. Heart Fail. 2014, 7, 1014–1021. [Google Scholar] [CrossRef]
- Sanyal, A.J. Past, present and future perspectives in nonalcoholic fatty liver disease. Nat. Rev. Gastroenterol. Hepatol. 2019, 16, 377–386. [Google Scholar] [CrossRef] [PubMed]
- Caturano, A.; D’Angelo, M.; Mormone, A.; Russo, V.; Mollica, M.P.; Salvatore, T.; Sasso, F.C. Oxidative stress in type 2 diabetes: Impacts from pathogenesis to lifestyle modifications. Curr. Issues Mol. Biol. 2023, 45, 6651–6666. [Google Scholar] [CrossRef] [PubMed]
- Elkattawy, H.A.; Elsherbini, D.M.A.; Ebrahim, H.A.; Abdullah, D.M.; Al-Zahaby, S.A.; Nosery, Y.; Ahmed, E.L. Rho-Kinase Inhibition Ameliorates Non-Alcoholic Fatty Liver Disease In Type 2 Diabetic Rats. Physiol. Res. 2022, 71, 615. [Google Scholar] [CrossRef] [PubMed]
- Vijgen, G.H.; Bouvy, N.D.; Leenen, L.; Rijkers, K.; Cornips, E.; Majoie, M.; van Marken Lichtenbelt, W.D. Vagus nerve stimulation increases energy expenditure: Relation to brown adipose tissue activity. PLoS ONE 2013, 8, e77221. [Google Scholar] [CrossRef]
- Chae, J.-H.; Nahas, Z.; Lomarev, M.; Denslow, S.; Lorberbaum, J.P.; Bohning, D.E.; George, M.S. A review of functional neuroimaging studies of vagus nerve stimulation (VNS). J. Psychiatr. Res. 2003, 37, 443–455. [Google Scholar] [CrossRef] [PubMed]
- Val-Laillet, D.; Biraben, A.; Randuineau, G.; Malbert, C.-H. Chronic vagus nerve stimulation decreased weight gain, food consumption and sweet craving in adult obese minipigs. Appetite 2010, 55, 245–252. [Google Scholar] [CrossRef]
- Luo, B.; Wu, Y.; Liu, S.L.; Li, X.Y.; Zhu, H.R.; Zhang, L.; Tang, J.M. Vagus nerve stimulation optimized cardiomyocyte phenotype, sarcomere organization and energy metabolism in infarcted heart through FoxO3A-VEGF signaling. Cell Death Dis. 2020, 11, 971. [Google Scholar] [CrossRef]
- Gil, K.; Bugajski, A.; Kurnik-Łucka, M.; Thor, P. Electrical chronic vagus nerve stimulation activates the hypothalamic-pituitaryadrenal axis in rats fed high-fat diet. Neuro-Endocrinol. Lett. 2013, 34, 4. [Google Scholar]
- Cohen, M.L.; Georgievskaya, Z. Histopathology of the stimulated vagus nerve: Primum non nocere. Heart Fail. Rev. 2011, 16, 163–169. [Google Scholar] [CrossRef]


Disclaimer/Publisher’s Note: The statements, opinions and data contained in all publications are solely those of the individual author(s) and contributor(s) and not of MDPI and/or the editor(s). MDPI and/or the editor(s) disclaim responsibility for any injury to people or property resulting from any ideas, methods, instructions or products referred to in the content. |
© 2023 by the authors. Licensee MDPI, Basel, Switzerland. This article is an open access article distributed under the terms and conditions of the Creative Commons Attribution (CC BY) license (https://creativecommons.org/licenses/by/4.0/).
Share and Cite
Elkattawy, H.A.; Mahmoud, S.M.; Hassan, A.E.-S.; Behiry, A.; Ebrahim, H.A.; Ibrahim, A.M.; Zaghamir, D.E.F.; El-Sherbiny, M.; El-Sayed, S.F. Vagal Stimulation Ameliorates Non-Alcoholic Fatty Liver Disease in Rats. Biomedicines 2023, 11, 3255. https://doi.org/10.3390/biomedicines11123255
Elkattawy HA, Mahmoud SM, Hassan AE-S, Behiry A, Ebrahim HA, Ibrahim AM, Zaghamir DEF, El-Sherbiny M, El-Sayed SF. Vagal Stimulation Ameliorates Non-Alcoholic Fatty Liver Disease in Rats. Biomedicines. 2023; 11(12):3255. https://doi.org/10.3390/biomedicines11123255
Chicago/Turabian StyleElkattawy, Hany A., Samar Mortada Mahmoud, Ahmed El-Sayed Hassan, Ahmed Behiry, Hasnaa Ali Ebrahim, Ateya Megahed Ibrahim, Donia Elsaid Fathi Zaghamir, Mohamed El-Sherbiny, and Sherein F. El-Sayed. 2023. "Vagal Stimulation Ameliorates Non-Alcoholic Fatty Liver Disease in Rats" Biomedicines 11, no. 12: 3255. https://doi.org/10.3390/biomedicines11123255
APA StyleElkattawy, H. A., Mahmoud, S. M., Hassan, A. E.-S., Behiry, A., Ebrahim, H. A., Ibrahim, A. M., Zaghamir, D. E. F., El-Sherbiny, M., & El-Sayed, S. F. (2023). Vagal Stimulation Ameliorates Non-Alcoholic Fatty Liver Disease in Rats. Biomedicines, 11(12), 3255. https://doi.org/10.3390/biomedicines11123255