Review

Peak Bone Mass Formation: Modern View of the Problem

1
Internal Medicine Department, Bashkir State Medical University, 450008 Ufa, Russia
2
Medical Genetics Department, Bashkir State Medical University, 450008 Ufa, Russia
3
Endocrinology Research Centre, Dmitriya Ulianova Street, 11, 117036 Moscow, Russia
*
Author to whom correspondence should be addressed.
Biomedicines 2023, 11(11), 2982; https://doi.org/10.3390/biomedicines11112982
Submission received: 21 September 2023 / Revised: 26 October 2023 / Accepted: 2 November 2023 / Published: 6 November 2023
(This article belongs to the Special Issue Advanced Research on Muscle and Bone Diseases)

Abstract

:
Peak bone mass is the amount of bone tissue that is formed when a stable skeletal state is achieved at a young age. To date, there are no established peak bone mass standards nor clear data on the age at which peak bone mass occurs. At the same time, the level of peak bone mass at a young age is an important predictor of the onset of primary osteoporosis. The purpose of this review is to analyze the results of studies of levels of peak bone mass in general, the age of its onset, as well as factors influencing its formation. Factors such as hormonal levels, body composition, physical activity, nutrition, heredity, smoking, lifestyle, prenatal predictors, intestinal microbiota, and vitamin and micronutrient status were considered, and a comprehensive scheme of the influence of these factors on the level of peak bone mass was created. Determining the standards and timing of the formation of peak bone mass, and the factors affecting it, will help in the development of measures to prevent its shortage and the consequent prevention of osteoporosis and concomitant diseases.

1. Introduction

Peak bone mass (PBM) is the amount of bone tissue that is formed when a stable skeletal state is achieved at a young age [1]. The concept of PBM in a broader sense encompasses peak bone strength. Peak bone strength is characterized not only by mass, but also by density, microarchitecture, microrepair mechanisms, and geometric properties that provide structural strength. Moreover, there is an opinion that the term “peak bone mass” applies only to the individuals, and not to the population.
The peak rate of bone mineral growth occurs at 12.5–33 years in males of European origin [2]. More than 95% of the adult human skeleton is formed by the end of adolescence [3]. In most parts of the skeleton, the total bone mineral mass does not significantly increase from 30 to 50 years, and even several cross-sectional studies have shown that the areal bone mineral density (aBMD) of the proximal femur begins to decrease at the beginning of the third decade [4].
A study of bone metabolism using computer simulations has shown that at a population level, shifts in PBM have a more significant effect on delaying the onset of osteoporosis than delaying the onset of menopause, and the amount of bone mass acquired at the end of the growth period appears to be more important than the rate of its loss [5,6]. An increase in PBM by 10% can delay the onset of osteoporosis by 13 years for most of the population [7], and, consequently, the risk of osteoporotic fractures in the future. Therefore, the analysis of PBM values, its set, and predictors of shortage in order to prevent early osteoporosis seems promising.
The purpose of this review is to analyze the results of studies of PBM levels, as well as the factors involved in its formation.

2. Structural Properties of Bone

Bone integrity is maintained by continuous balanced processes of bone resorption and formation; imbalance leads to bone loss, osteopenia, and osteoporosis [8]. Bone strength is partly determined by bone mineral mass and density. The structural properties of bone also contribute to its strength. Characteristics such as thickness, density, and porosity of the cortical bone, as well as trabecular micro architectonics (thickness of trabeculae, number, and distance) together determine the structural strength of the bone. At the same time, the question remains whether the peak of bone strength occurs simultaneously with the peak of bone mass [9].
The mechanical strength of the bone is determined by a number of factors: the size of the bone, the amount of bone tissue in the periosteal membrane, and its spatial distribution, i.e., micro- and macro architectonics, or geometry, as well as the degree of mineralization and structural organization of the organic matrix. During the entire growth period, including puberty, the development of bone mineral mass occurs mainly due to an increase in bone size, that is, the volumetric bone mineral density (vBMD) remains almost constant from birth to the end of the growth period. Similarly, as soon as puberty is reached, sex differences in bone mass arise mainly due to the larger size of bones in men [10]. In girls, bone mineral mass increases more due to endosteal than periosteal accumulation, while in boys, reverse changes were observed with a greater increase in periosteal than endosteal deposition, which leads to an increase in both the outer and inner perimeter of the cortical layer. The thickness of the cortical layer of bone in the vertebral bodies in men is greater than in women. Sexual structural dimorphism is mainly expressed in the frontal axis, which is 10–15% larger in men than in women. These morphological differences and the distribution of the mineral mass of both axial and peripheral bones give the male skeleton greater resistance to mechanical stress [11].
The mechanisms of bone tissue modeling and remodeling are complex and are supported by a balance of bone resorption and bone formation by osteoblasts and osteoclasts. The progenitor of osteoblasts is the mesenchymal stem cell. The ways of its differentiation are controlled by a number of factors. For example, an increase in LRP5/6 (a protein associated with the lipo-77 protein receptor), mediated by canonical Wnt signaling, leads to an increase in bone mass [12]. Osteocytes regulate osteoblast differentiation and anabolic activity, as well as osteoclast activity, through direct contact with dendrites or by secreting important regulatory factors such as sclerostin, an inhibitor of Wnt/β-catenin signaling, and an activator of the cytokine receptor ligand NF-κB (RANKL), the main regulator of osteoclastogenesis [12]. On the other hand, in bones, DKK1 (Dickkopf-related protein 1) and osteocyte-produced sclerostin (SOST) bind the LRP5/6 complex and inhibit Wnt signaling in osteoblasts, limiting osteoblastogenesis and promoting bone resorption. RUNX2 (runt-related transcription factor 2) is the main transcription factor regulating skeletogenesis and is necessary for directing the differentiation of mesenchymal progenitor cells into osteoblasts. The expression of RUNX2 increases during differentiation of chondrocytes into osteoblasts, but later decreases in mature osteoblasts at the terminal stage [13].

3. Peak Bone Mass and Its Absolute Values

In the literature, data about PBM are fragmentary, and as an alternative to the concept of “peak bone mass”, values of bone mineral content (BMC), areal bone mineral density (aBMD—g/cm2), and volume bone mineral density (vBMD—g/cm3) are used. The gold standard of estimation the accumulation of “bone mass” in numerical terms is aBMD, which accounts for 65–75% of differences in bone strength [14]. aBMD is determined by dual-energy X-ray absorptiometry and is calculated by dividing the amount of bone minerals (bone mineral content (BMC in grams)) by the area scanned bone (cm2) [15]. vBMD is also used, which is defined as BMC/V (bone volume) and the V value is calculated based on the projection area of the bone [16]. At the population level, the PBM is reached when age-related changes in bone metabolism cease to be positive and reach a maximum value. However, PBM is regarded as one of the most important predictors of bone strength. There are few studies describing the significance of aBMD in young adults. In addition, the age of reaching the peak of bone mass and the absolute values of aBMD differ in different sources, because the comparison groups are heterogeneous, namely, different age groups, sex, and different examination methods (systems, skeletal areas) are described. This creates a problem in interpreting the values of aBMD in young people, despite the presence of the Z-criterion. The main literature references of aBMD in young adults are presented in Appendix A. Appendix A presents the results obtained by X-ray absorptiometry with determination of aBMD for the lumbar spine and/or femoral neck for young people aged 11 to 43.19 years. Two small studies in Russia measured aBMD in young adults. Zakharov I.S. et al. (2014) described aBMD of the lumbar spine among women aged 16 to 80 years and older, in which the highest aBMD was achieved at the age of 20–29 years (1.219 g/cm2) [17]. Paskova et al. also analyzed aBMD of the lumbar spine, but for men aged 20 to 78 years, while the PBM was at the age of 21–25 years (1.20 ± 0.15 g/cm2) [18]. Anne Looker et al. (1997) summarized the results of a large population-based study NHANES III (USA). They described the achievement of PBM for both men and women, according to dual-energy absorptiometry of the femoral neck, at the age of 20–29 years. They formed reference values from these indicators values for assessing osteopenia in the older age group. The maximum value of aBMD for women was 0.86 ± 0.12 g/cm2 (N = 382), and for men, it was 0.93 ± 0.137 g/cm2 (N = 409), which is slightly less than the values obtained in the population of the Russian Federation [19]. In a small UK study, Henry et al. (2004) evaluated aBMD, volumetric mineral density, and BMC. The subjects were divided into two groups: 11–19 and 20–50 years old, respectively. The PBM of the lumbar spine was achieved for women at the age of 29 years and amounted to 0.970 g/cm2 (N = 69), and for men at the age of 22 years—1.05 g/cm2 (N = 63), which, in general, correlates with the results of NHANES III [20]. Three studies in Sweden analyzed aBMD among young men. Karlsson (2001) et al. evaluated the effect of sports on aBMD in young men, healthy volunteers were examined as controls, whose PBM was at the age of 24.4 ± 0.6 (N = 24) and lambar spine aBMD was LS 1.27 ± 0.03 g/cm2 [21]. Further Lorentzon et al. (2005), according to the results of the Gothenburg Study of Determinants of Osteoporosis and Obesity (GOOD), determined that among young men aged 18.9 ± 0.6 year, the average aBMD for L2-L4 was 1.24 ± 0.15 g/cm2 [22], which correlates with the results of Karlsson, but the age of PBM was not reached. Tveit et al. (2014) described in a study among men aged 18–85 years the effect of such a sport as football on bone tissue. The highest values of aBMD were achieved at the age of 23.96 ± 3.85 years (N = 135) and amounted to 1.36 g/cm2 [23]. Bakker et al. (2003) analyzed lifestyle, physical activity, and aBMD L2-L4 in men and women in three age groups: 27, 32, and 36 years, with the maximum values of aBMD occurring at 27 years (N = 83): 1.170 ± 0.159 g/cm2 [24]. Two studies in Australia have evaluated aBMD of the lumbar spine for men and women. Liberato (2015) analyzed the influence of lifestyle, nutrition, and physical activity on aBMD, the mean age was 21.8 ± 2.18 years and limbar spine aBMD was (1.16 ± 0.15 g/cm2) [25]. For women, as found by Jones et al. (2000), at the age of 33.5 years, the values were 1.07 ± 0.12 g/cm2 [26]. Another study in Finland analyzed bone mineral density at the femoral neck in young men and women with and without a history of fractures. aBMD of the control group for men (26 ± 4 years) was 0.952 ± 0.127 g/cm2, and 0.900 ± 0.132 g/cm2 for women (22 ± 5 years), respectively [27].
In China, Ho et al. (1993) analyzed bone mineral density in women aged 21 to 40 years. The highest values of aBMD were described for the age of 29–32 years (N = 57) for the lumbar spine (1.03 ± 0.12 g/cm2) and for the femoral neck (0.86 ± 0.11 g/cm2) [28], which correlates with the data obtained in the Netherlands. Yanping Du et al. (2018) also evaluated aBMD of lumbar spine aBMD. For men and women, the highest values of aBMD were achieved at the age of 21–30 years and amounted to 0.986 ± 0.150 g/cm2 (N = 113) for men and 0.970 ± 0.100 g/cm2 (N = 128) for women, respectively [29]. In Japan, a large study by Orito S. et al. (2009) evaluated various clinical and instrumental characteristics of the musculoskeletal system, where aBMD L2-L4 in women was 0.961 ± 0.119 g/cm2 for the age group of 12–30 years (N = 1322) [30]. In general, lumbar spine aBMD scores in young adults in the Russian population are broadly consistent with results for similar parts of the skeleton in Swedish and Dutch populations in comparable age and gender groups, and are somewhat superior to those in Asian, UK, and Australian populations.
Studies of bone mineral density of the femur neck among young subjects are less common. However, absolute values of aBMD are higher in the Swedish population compared to the Asian population, but further studies with larger numbers of participants are required. The highest values of aBMD are achieved by Caucasians at the age of 20–29 years, and Asians 29–32 years, respectively. Thus, PBM ranged from 0.79 ± 0.12 to 1.18 ± 0.03 g/cm2 in women and from 0.93 ± 0.137 to 1.27 (0.14) g/cm2 in men at the femoral neck.

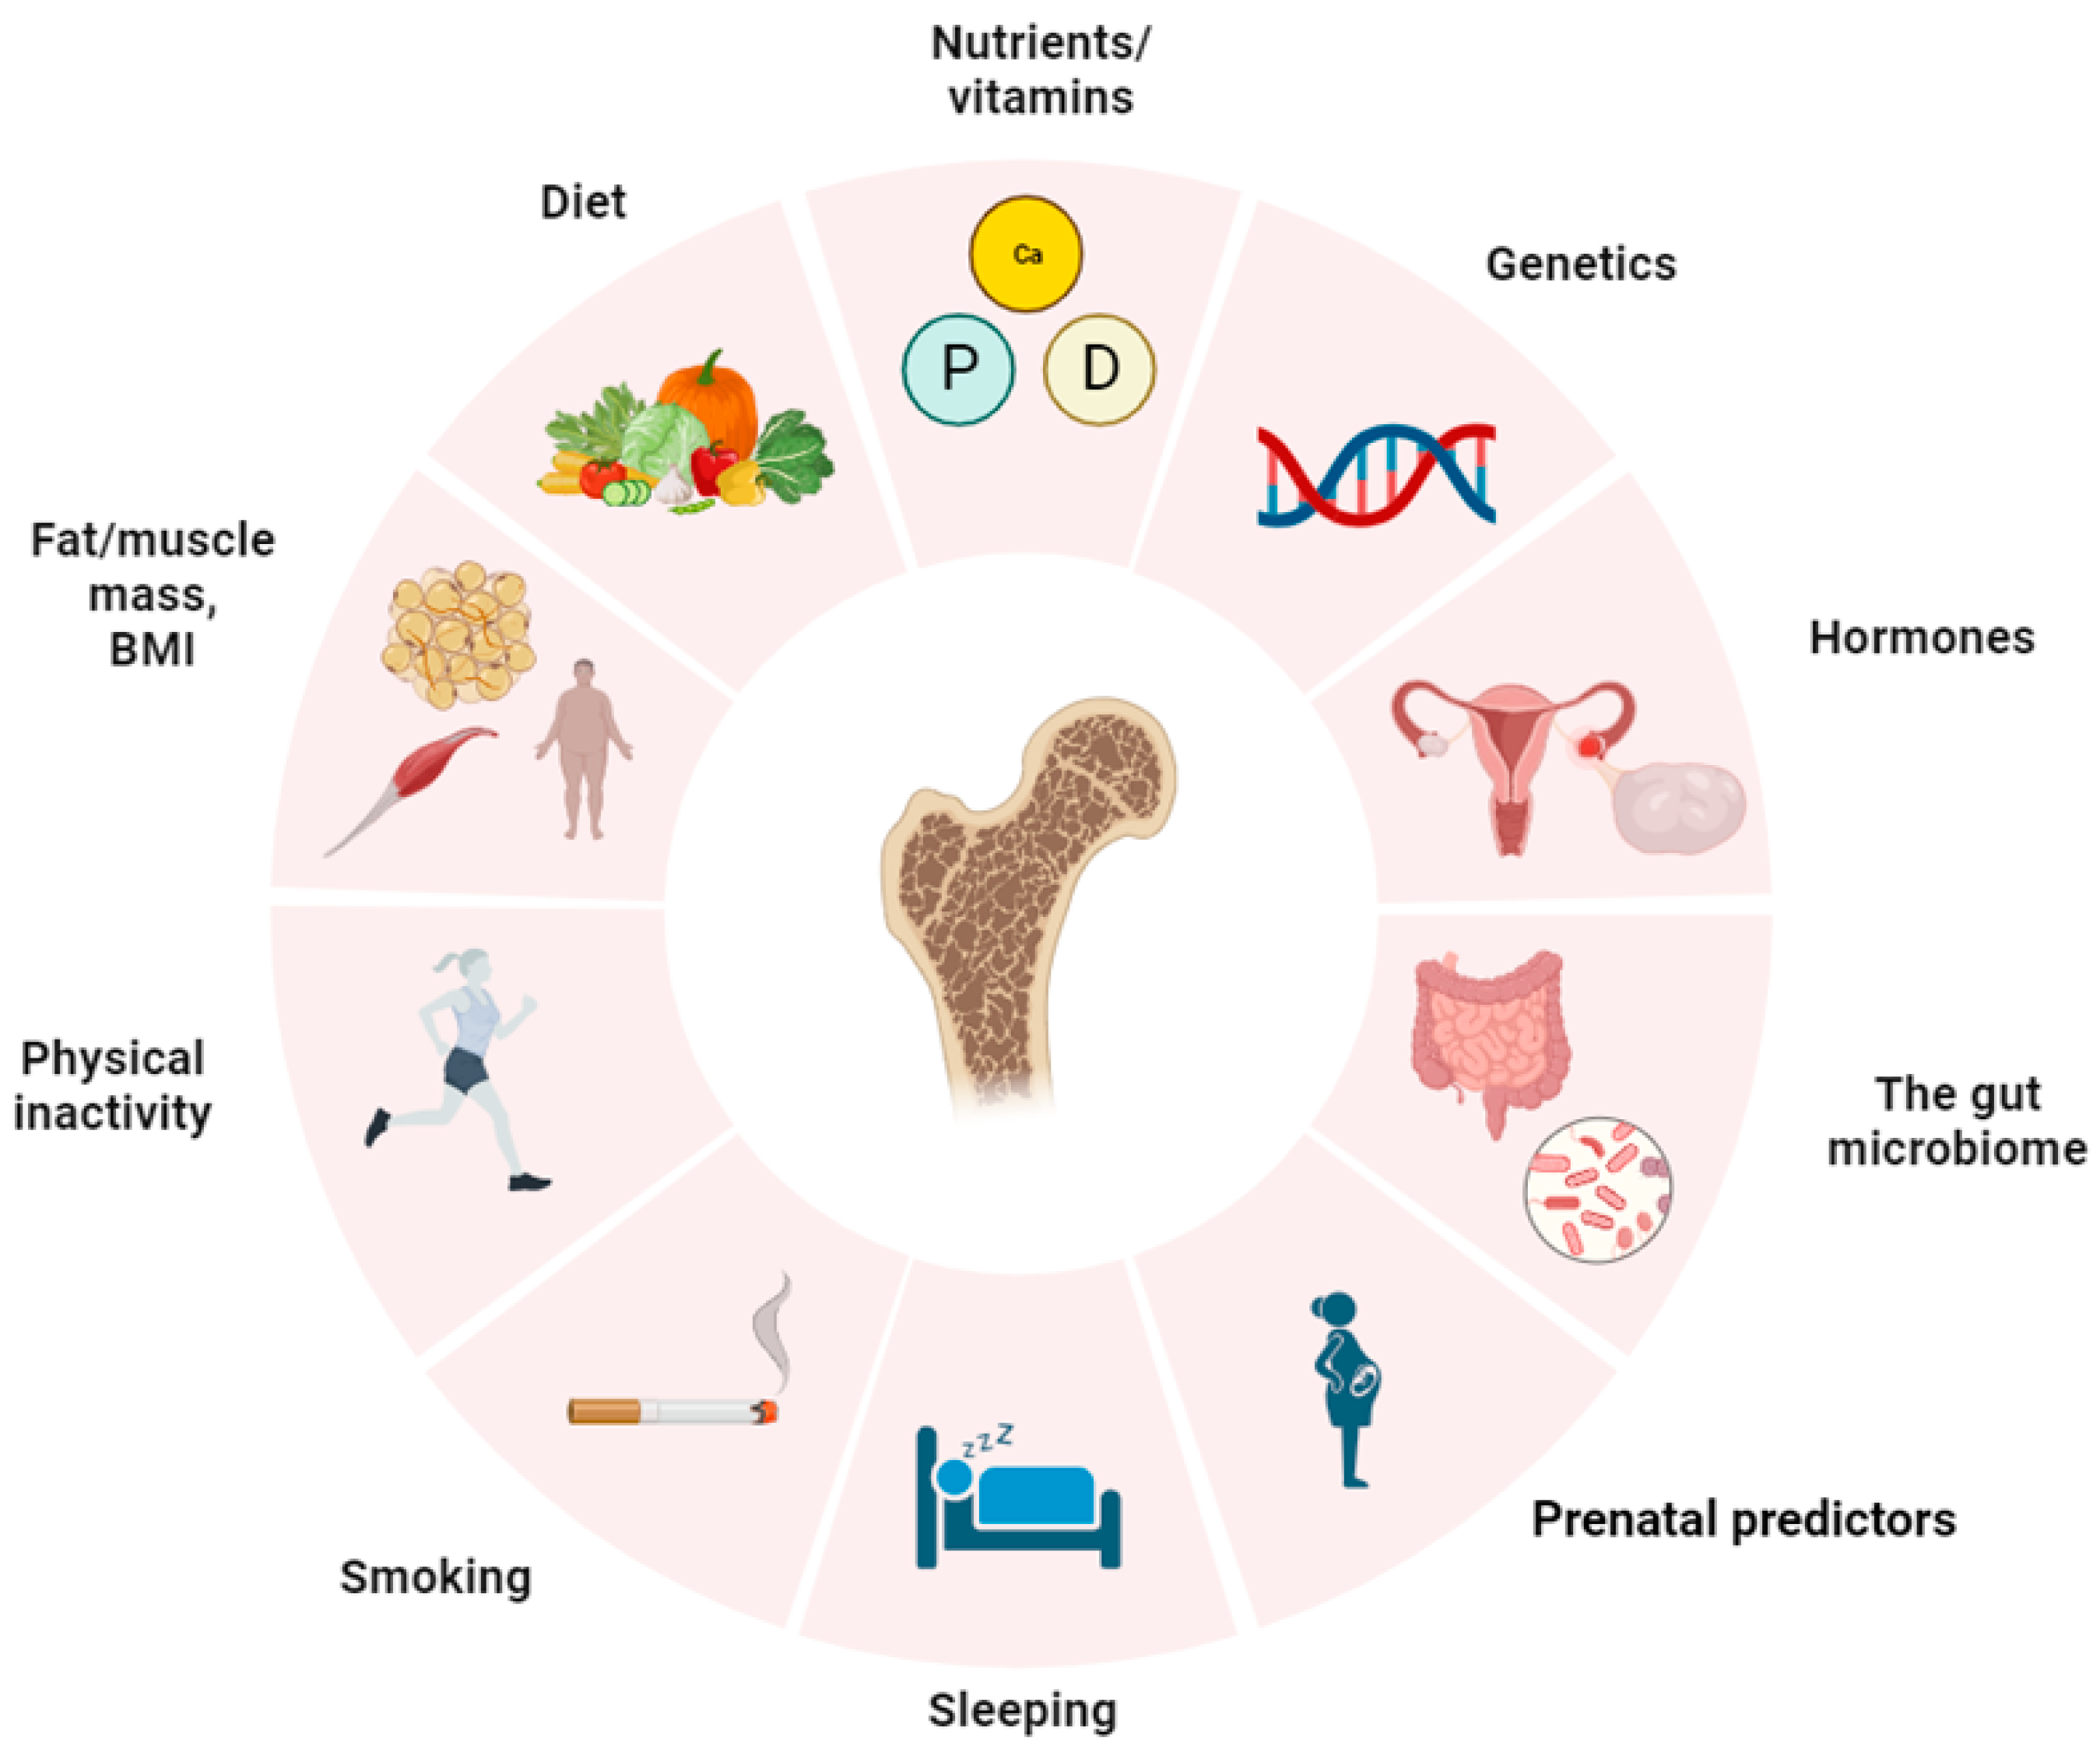
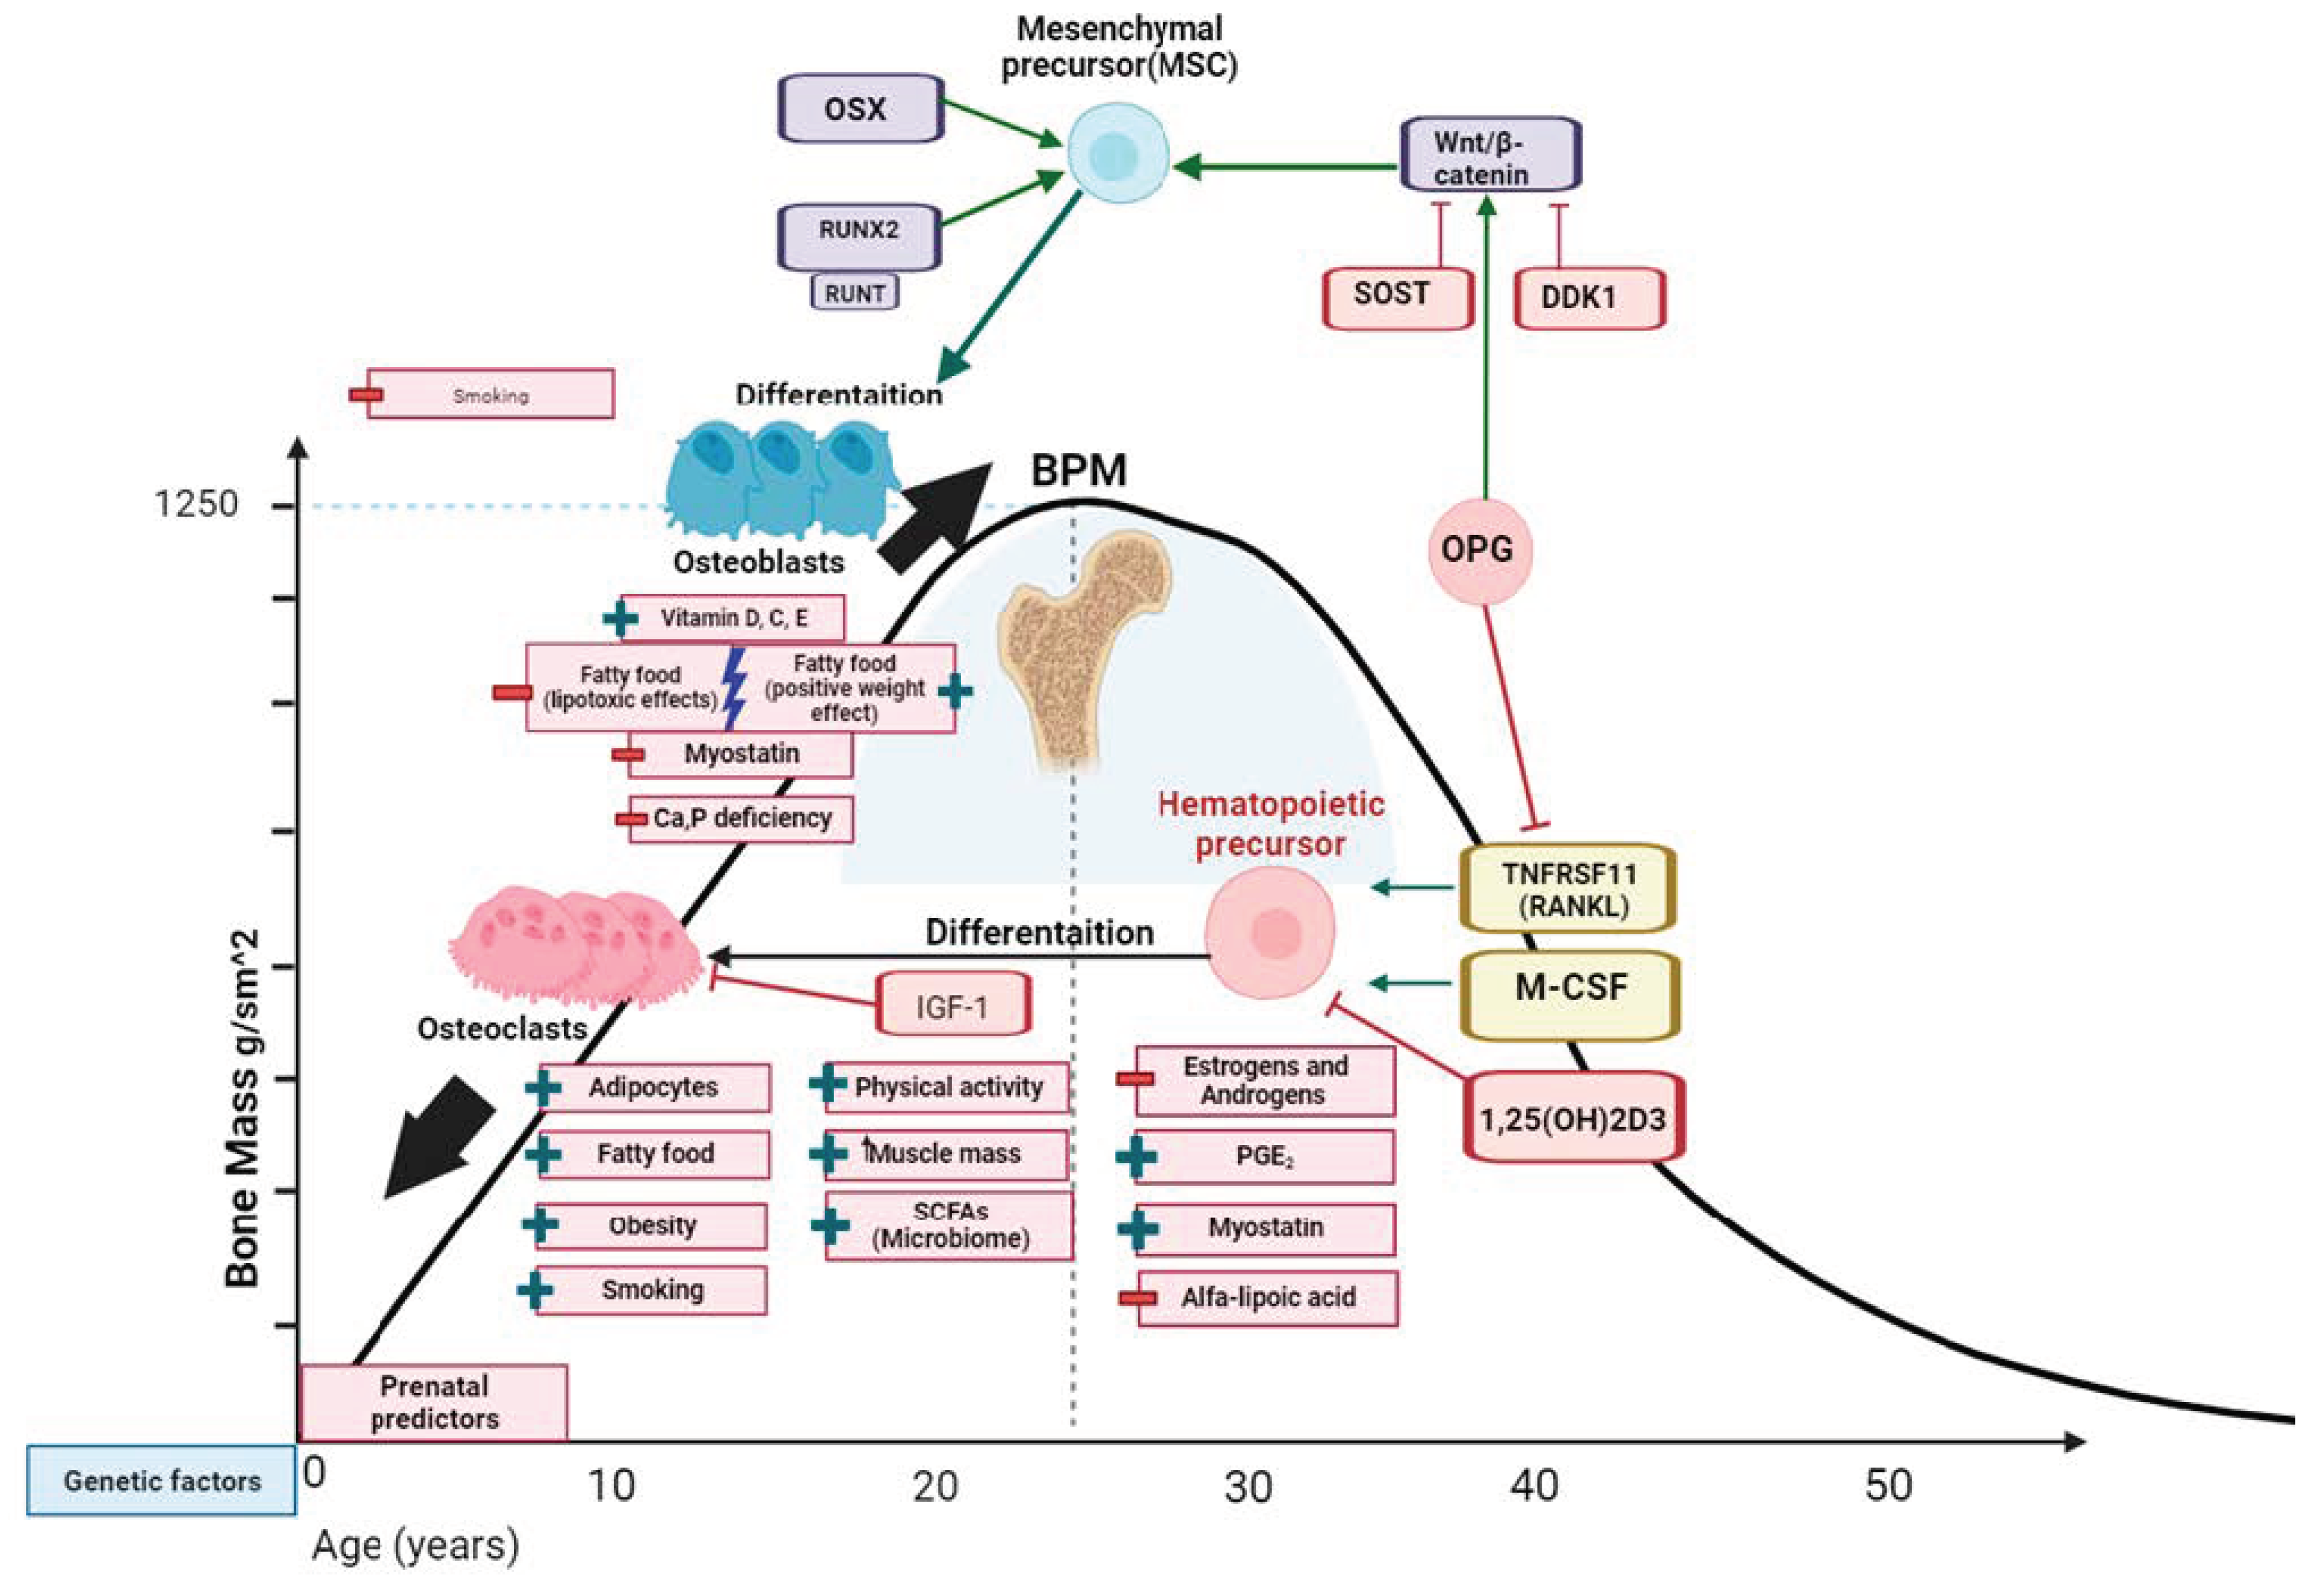
4. Factors Affecting PBM

According to the literature data, there are a number of factors affecting both the set of PBM and bone formation in general [31]. The main factors and possible pathogenetic mechanisms of their influence on bone metabolism are presented in Figure 1 and Figure 2.

4.1. Hormonal Background

One of the key roles in the regulation of bone metabolism is played by sex hormones. Thus, estrogens limit the production of osteoclastogenic cytokines produced by osteoblast cells and thus inhibit osteoclast formation and bone resorption [32]. Changes in the hormonal background in different age periods have a significant effect on bone metabolism. The effect of hormonal background was studied in mice in the most detail. For example, deletion of the androgen receptor (AR) in male mice causes high bone turnover, increased bone resorption, and reduced cortical and cancellous bone mass. Targeted deletion of AR in mature osteoblasts, however, reduces the mass of the bone spongy substance, but does not affect the cortical layer of bone [33]. Over the past 10 years, extensive data have indicated the involvement of oxidative stress in increased bone resorption associated with estrogen or androgen deficiency [34]. RANKL and MCS-F (macrophage colony-stimulating factor) are two cytokines that are necessary for the formation of osteoclasts [35]; they stimulate the intracellular accumulation of H2O2, which is necessary for osteoclast adaptation, differentiation, and survival [36]. This hypothesis has been proven empirically: in mice capable of synthesizing human catalase, an enzyme that utilizes H2O2 in mitochondria, there was an increase in cortical and spongy bone mass due to a decrease in the number of osteoclasts [33]. In adulthood, certain endocrine pathologies associated with estrogen, such as complete androgen insensitivity syndrome due to complete androgen resistance, premature ovarian failure, or Turner syndrome, can lead to a decrease in aBMD in women at the level of the lumbar spine and femoral neck [37].
On the other hand, it is interesting that gender-supportive hormone therapy in trans women (with estradiol and antiandrogens) and in trans men (with testosterone) resulted in an increase in bone metabolism in young trans men, while it decreased in trans women, demonstrating the crucial role of estrogen in the regulation of bone resorption [38].

4.2. Microbiome

Intestinal microbiota makes a certain contribution to the metabolism of connective tissue and bone tissue. Yan et al. (2017) reported that short-chain fatty acids (SCFAs) produced by the microbiota induced insulin-like growth factor 1 (IGF-1), which promotes bone growth [39]. Treatment of mice with microbiota metabolism products, including SCFAs, propionate, and butyrate, significantly increases bone mass and prevents postmenopausal and inflammation-induced bone loss, and propionate and butyrate induce metabolic reprogramming of osteoclasts, which leads to suppression of bone resorption activity by osteoclasts [40,41,42]. The consumption of indigestible food components is one of the ways in which it is possible to change the gut microbiota to improve the health of the host. Dietary components, such as prebiotic dietary fiber, are associated with positive shifts in the composition of the intestinal microbial community [43]. A study conducted among adolescents showed that the consumption of various prebiotics, such as galactooligosaccharides and soluble corn fiber, which can be fermented to SCFAs, led to increased absorption of calcium in the intestine and was associated with the relative content of Parabacteroides, Bifidobacterium, Bacteroides, Butyricicoccus, Oscillibacter, and Dialister species measured in feces, and the change in the intestinal microbiome towards enrichment with bacteria of the genera Dialister and Faecalibacterium, on the contrary, was associated with the presence of osteoporosis [44]. In addition, in clinical trials, it was reported that the consumption of SCFAs in women could improve bone metabolism with increased activity of bone-specific alkaline phosphatase [45]. Supplements with Bacillus subtilis, Lactobacilli, and multi-species probiotics have demonstrated a beneficial effect not only on the human gut microbiota [46], but also on markers of bone metabolism [47]. Strain-specific probiotics can reduce oxidative stress by producing several antioxidant molecules, e.g., glutathione, folic acid, and exopolysaccharide. In addition, short-chain fatty acids produced by some gut microbiota may also help reduce oxidative stress by promoting the production of antioxidant molecules [48].

4.3. Quality Body Composition

The understanding of the effect of adipose tissue on bone metabolism is still ambiguous, and often the results of studies contradict each other. It is worth considering the adipose tissue of the bone marrow and adipose tissue in general. Mesenchymal stromal cells (MSCs) are multipotent progenitors capable of differentiation into osteoblasts and can potentially serve as a source of cell therapy for bone regeneration. Many factors have been shown to regulate the differentiation of MSCs into the osteogenic lineage, such as the cyclooxygenase-2 (COX2)/prostaglandin E2 (PGE2) signaling pathway, which is critical for bone repair. PGE2 binds four different EP1-4 receptors (prostaglandin receptors) [49]. Thus, adipocytes themselves stimulate the differentiation of MSCs into adipocytes, and not into osteoblasts. In addition, adipocytes in the bone marrow microenvironment release a range of pro-inflammatory and immunomodulatory molecules that enhance osteoclast formation and activation, thereby contributing to bone fragility. In vivo analysis of the relative content of saturated and unsaturated fatty acids in the bone marrow indicates a locally dependent marrow fat composition and an association between an elevated unsaturation index and bone health. Most diseases with bone loss, in which an altered composition of the bone marrow develops, have aging and/or chronic inflammation as common factors. Both saturated and unsaturated fatty acids form lipid forms that are active mediators of the inflammatory process [50]. However, the intervention of alpha-lipoic acid (ALA) inhibited the RANKL-induced proliferation and differentiation of osteoclasts. ALA also inhibited bone resorption activity, suppressed RANKL-induced transcription factors c-Fos, c-Jun, and NFATC1 (nuclear factor of activated T cells) in combination with markers of osteoclasts such as TRAP (prediction of affinity for transcription factor), OSCAR (receptor associated with osteoclasts), cathepsin K, and β3-integrin [51]. On the other hand, excessive accumulation of adipose tissue performs the role of a mechanical vertical load contributing to the build-up of bone tissue. In this case, bone quality and structure are the result of a balance of inflammatory and mechanical incentive stimuli [52].
Data on the influence of sex on body mass index (BMI) and aBMD are also contradictory. There is a point of view that aBMD values increase with an increase in BMI only in men [53]. Nevertheless, a number of authors have noted that increasing BMI to the values of the “metabolic syndrome” leads to decreasing aBMD for both men and women [54]. In another study among young Hispanic and non-Hispanic girls, Megan Hetherington-Rauth et al. found a positive contribution of fat mass to bone strength in vBMD; however, negative associations were also found with the content and thickness of the cortical bone of the radius [55]. Also, Zeyu Xiao et al. in a sample of young Chinese adults found that both total lean body mass and fat mass were significantly positively associated with aBMD in both genders [56]. Nielsen et al. obtained results that individuals aged 15–19 years who lost weight during follow-up showed slower progression of aBMD gain compared to those who gained weight, but weight loss or BMI reduction over 2 years was not associated with a net loss of aBMD [57].
In a study on FAT-ATTAC transgenic mice, Lagerquist et al. induced adipocyte apoptosis and assessed bone metabolism by X-ray absorptiometry and found no effect of adipose tissue reduction on bone resorption [58].
Bones and muscles are two deeply interconnected organs with integrated growth and locomotion [59]. In a study involving 416 women and 334 men aged 20 to 30 years in Vietnam, the association of body composition and aBMD at the lumbar spine and femoral neck was assessed using dual-energy X-ray absorptiometry. Peak aBMD in men was higher than in women, and the difference was more pronounced in the femoral neck region than in the lumbar spine, and fat-free mass was the only predictor of aBMD for both men and women. Each kilogram of increase in muscle mass was associated with an increase in BMD by about 0.01 g/cm2 [60]. Winther et al. also found that higher levels of aBMD corresponded to higher levels of fat-free mass in both genders, but higher aBMD at higher levels of fat mass was found only in girls [61].
Muscle paralysis also contributes to bone mineral density. Paralysis caused by botulinum toxin causes bone loss in adult mice and slows down the healing of fractures [62].
Bones and muscles act as secretory endocrine organs that affect each other’s function. Biochemical crosstalk occurs through myokines such as myostatin, irisin, interleukin IL-6, IL-7, IL-15, insulin-like growth factor-1, fibroblast growth factor, and β-aminoisobutyric acid, as well as through factors of bone origin, including FGF23, prostaglandin E2, transforming factor growth of β, osteocalcin, and sclerostin [63]. Myostatin is member of the transforming growth factors-beta (TGF-beta) superfamily, which is highly expressed in skeletal muscles. Loss of myostatin function in mice led to an increase in muscle mass, increased bone formation, and an increase in bone cross-section in most anatomical areas, including limbs, spine, and jaw in mice [64]. Myostatin inhibitors such as ACVR2B/Fc, a soluble myostatin decoy receptor, have been shown to prevent loss of both muscle and bone tissue in models of muscular dystrophy [65]. In vitro studies on mice have also shown that myostatin enhances RANKL-induced osteoclastogenesis [66]. Myostatin is also expressed in the early stages of fracture healing, and myostatin deficiency leads to an increase in the size and strength of the callus during fracture. Taken together, these data suggest that myostatin may affect the proliferation and differentiation of osteogenesis progenitor cells and that myostatin antagonists and inhibitors may be therapeutically useful for increasing both muscle mass and bone. Myostatin directly affects osteocyte function by suppressing exosomal miR-218 microRNA and thus inhibits osteoblast differentiation [67].

4.4. Smoking

The negative impact of smoking on various systems and organs is multifaceted. Mattias Callréus et al. investigated the effects of smoking among women aged 25 years, but statistically significant differences were found only in the levels of aBMD of the femoral neck. Similarly, lower aBMD, in comparison with the control, persisted for up to 24 months after quitting smoking, becoming comparable to those who had never smoked after 24 months [68]. To further evaluate these outcomes, a meta-analysis of 14 prospective studies, information was conducted, which showed that, compared with those who have never smoked, cigarette smoking increased the risk of hip fracture in men, especially in current smokers [69]. Another study has also found an association between smoking and an increased risk of fractures [70]. Both active and passive smoking negatively affect bone mass; quitting smoking seems to reverse the effect of smoking and improve bone health [71]. In men, regardless of age, method, and site of bone density measurement, cross-sectional studies showed that smokers had significantly lower aBMD than non-smokers [72]. In bone studies, smoking was associated with lower aBMD, increased risk of fractures, periodontitis, loss of alveolar bone, and rejection of dental implants [73]. In a large NHANES III study involving 14,500 subjects, the bone mineral density of the femoral neck in smokers was numerically lower than in never-smokers, but the statistical significance of the difference was not reached [74,75]. The data on cannabis smoking are contradictory. Thus, bone mineral density (Z-criterion) was significantly lower in avid cannabis users compared to the control group in the lumbar spine, hip neck, and hip as a whole [76]; however, it was found that the cannabinoid receptors CB1 and CB2 were expressed in bones and regulate bone homeostasis in rodents and humans. Cannabis treatment has been shown to improve fracture healing in rats [77].

4.5. Nutritional Deficiencies (Calcium, Vitamin D, Phosphorus), Lipids, and Food Character

The contribution of calcium and vitamin D to the quality of bone tissue is beyond doubt; the use of sufficient amounts of calcium and vitamin D in childhood and adolescence is of the greatest importance. Vitamin D synthesized in the skin or absorbed with food undergoes a multi-step enzymatic transformation into its active form, 1,25-dihydroxyvitamin D, [1,25(OH) 2 D], followed by interaction with the vitamin D receptor (VDR) to modulate the expression of the target gene [78]. Vitamin D can support skeletal health and improve bone mineralization by increasing calcium absorption in the intestine, reducing secondary hyperparathyroidism, and reducing bone resorption [79]; moreover, increased calcium intake in combination with vitamin D reduces the rate of loss of minerals in the bones without harm to the intestinal microbiota. Guo-Hau Gou et al. described the positive effect of daily intake of vitamin D and magnesium on hip neck aBMD in female participants aged 8–11 years [80]. Zhou also proved that higher intake of calcium and vitamin D was associated with higher total hip and hip neck aBMD in young men (16–18 years old), and cumulatively high levels of calcium and vitamin D intake over time contributed to better maintenance of aBMD in the lumbar spine and femurs in adult women [81]. Neville et al. also described the positive effect of vitamin D on hip neck aBMD in adolescent girls, but not in the lumbar spine [82]. Krstic et al. described the positive effect of vitamin D intake and physical activity on young mice, explaining the mechanism by hypomethylation of the RXRA (Retinoid X Receptor Alpha) gene DNA, which together with the vitamin D receptor forms a mechanism that transmits the nuclear effects of vitamin D [83].
Hui Li et al. obtained results according to which vitamin C intake with food has a threshold effect on the bone mass increase in male adolescents, and vitamin E intake with food can be a positive predictor of bone mass increase in adolescent girls; however, the aBMD of the calcaneus was evaluated by ultrasound [84].
Elham Z. Movassagh et al. described a vegetarian diet rich in dark green vegetables, eggs, whole grains, 100% fruit juice, legumes, nuts, seeds, added fats, fruits, and nonfat milk during adolescence as being positively associated with whole body BMC [85].
The question of the effect of dietary lipids on bone tissue remains open. In a mouse study, a high-lipid diet (HLD) resulted in osteoclast activation, a decrease in trabecular bone volume, along with an increase in bone marrow deposition compared to a low-fat diet group [86]. In addition, HLD led to an increase in bone marrow adipose tissue and changes in the bone marrow microenvironment along with a pro-inflammatory environment, which could contribute to a negative effect on bone metabolism. At present, the effect of adipose tissue on bone metabolism is not fully understood [87].

4.6. Physical Activity, Lifestyle, Psychoemotional Status

There is a positive relationship between the incidence of fractures and the level of physical activity due to the increased risk of falls during physical activity. Thus, although physical activity is critical for bone modeling, children with higher levels of physical activity are more likely to have fractures [88]. Weekly physical activity has a positive effect on BMC and bone mineral density in both boys and girls during puberty when exercising 1–2 times a week [89]. Physical exercises at school in terms of time are effective for increasing aBMD and/or vBMD in children and adolescents, but should include high-intensity exercises, such as high-impact jumps [90]. Physical activity 3 times a week for 40 min in ball games or circular strength training throughout the school year improves bone mineralization and some aspects of muscle fitness of children aged 8–10 years, suggesting that well-organized intensive physical education classes can positively affect the development of the musculoskeletal system and health in children early age [91].
Sleep also affects bone mineralization. An unbalanced sleep pattern contributes to bone loss and an increased risk of osteoporosis. Thus, healthy sleep contributes to the prevention of osteoporosis [92].
Psychoemotional status, as well as associated pathological conditions, also affect bone health. So, depression was associated with lower aBMD, especially in the spine, in white men, and non-highly educated populations. Moreover, people with depression were more likely to suffer fractures and osteoporosis [93].

4.7. Early Antropometric Characteristics

Body length at birth and height under the age of 7 years were positively associated with mineral density of the femoral neck, and growth in all studied age periods was positively associated with the area of the spine. Growth under the age of 7 years was associated with the mineral density of the femoral neck [94]. Bone mineral density may also be affected by birth weight, among other things. In a meta-analysis by Baird et al. (14 studies involving men and women aged 18–80 years), a positive relationship was found between birth weight and aBMD of the lumbar spine in adulthood, and this relationship was stronger for women [95]. This hypothesis was also confirmed in the PEAK-25 study conducted in Sweden (1061 women aged 25 years) [96].

4.8. Heredity and Genetics

Data regarding the association of PBM with genes and polymorphic variants in humans are incomplete [97,98]. Wei-jia Yu and colleagues (2020) reported associations between polymorphic variants of the gene LGR4 (Leucine Rich Repeat Containing G Protein-Coupled Receptor 4) and bone metabolism. Their study involved 1296 participants from nuclear families (mother, father, son) and they found an association of polymorphic variants rs11029986 and total hip aBMD and rs12796247, rs2219783 with lumbar spine aBMD [99]. Another study by Zheng et al. (2016) described associations of six SNPs (rs6126098, rs6091103, rs238303, rs6067647, rs8126174, and rs4811144) in the CTNNBL1 gene (Beta-catenin-like protein 1) and peak bone mineral density of the lumbar spine, femoral neck, or the entire femur [100]. Zhao et al. (2017) conducted a study on 1296 Chinese men and found positive associations between rs9585961 METTL21C (Methyltransferase Like Protein 21C) and aBMD of the lumbar spine and femoral neck, as well as rs9518810 and aBMD of the femoral neck [101]. In a separate study, He et al. (2011) analyzed 401 Chinese nuclear families and described an intrafamily negative relationship between allele C rs16878759 and PBM of the lumbar spine. They also found that the CCC haplotype (containing rs12699800, rs16878759, and rs17619769) had a significant intrafamily association with PBM of the lumbar spine [102]. Chesi et al. (2019) conducted a study using a donor culture of primary MSC. ING3 (Inhibitor of Growth Family Member 3) and EPDR1 (Ependymin Related 1) knockdowns disrupted osteoblast differentiation and increased MSC adipogenic differentiation. ING3 knockdown increased adipogenesis by 8 times, and EPDR1 knockdown by 3.5 times [103]. Furthermore, this group of authors, in a repeated experiment with editing the EPDR1 gene by CRISPR-Cas 9 on an immortalized MSC hFOB1.19 cell culture, confirmed the important role of EPDR1 in osteoblast differentiation [104].
The search for genes involved in bone metabolism continues in mouse models. In modified mice with Wnt16−/− knockout, the thickness of the cortical layer of bone and bone strength were reduced [105]. An intronic variant rs2566752 was associated with aBMD of the spine. A less common allele C from this locus was associated with increased spinal aBMD. This allele was also found to be associated with a reduced risk of fracture in the TwinsUK cohort [106]. Fibroblast growth factor receptor 1 (FGFR1) is an important molecule for skeletal development and bone remodeling. Mice lacking FGFR1 in osteocytes showed an increase in trabecular bone mass at 2 and 6 months of age as a result of increased bone formation and reduced resorption [107].

5. Conclusions

This article discusses the formation of PBM and the factors that can affect it. PBM is reached at the age of 20–30 years in different populations, with bone mineral density values ranging from 0.79 ± 0.12 to 1.18 ± 0.03 g/cm2 in women and from 0.93 ± 0.137 to 1.27 (0.14) g/cm2 in men in the femoral neck. A generalized scheme for the formation of PBM is shown in Figure 2. The formation and resorption of bone tissue are continuous processes of bone metabolism. However, at a young age, before reaching PBM, accumulation prevails over resorption and determines the pool of bone tissue. The lower PBM leads to the early development of osteoporosis, disability, and a decrease in the duration and quality of life. In this regard, it is critically important to understand the main mechanisms and factors influencing the formation of PBM in order to develop methods to increase it, which can serve as a significant means of preventing osteoporosis and concomitant diseases.

Author Contributions

Conceptualization, writing—review and editing, A.T. and K.A.; methodology, R.K. and N.M.; data curation, formal analysis, I.M.; writing—original draft preparation, A.T and K.A. All authors have read and agreed to the published version of the manuscript.

Funding

This research was funded by the world-class Eurasian Science and Education Centre of the Republic of Bashkortostan (grant number NOC-GMU 2023-2024) and Ministry of Science and Higher Education of the Russian Federation (Grant Number: 075-15-2022-310).

Conflicts of Interest

The authors declare no conflict of interest.

Appendix A

Table A1. Absolute values of aBMD in young people.
#Authors SexMean Age (N)aBMDSystem Country
1.Paskova I.G. et al. (2015)
[18]
m20 (3)1.16 ± 0.09 (LS)LunarRussian Federation
21–25 (16)1.20 ± 0.15 (LS)
26–30 (10)1.16 ± 0.1 (LS)
31–35 (7)1.19 ± 0.13(LS)
36–40 (10)1.17 ± 0.18(LS)
2.Zakharov I.S. et al. (2014)
[19]
f16–19 (178)1.158 (LS)Lunar-DPX-NTRussian Federation
20–29 (178)1.219 (LS)
30–39 (244)1.205 (LS)
30–39 (244)1.068 (LS)
3.Looker A. C. et al. (1997)
[19]
f20–29 (382)0.86 ± 0.12 (FN)Hologic QDRUnited States
(NHANES III)
m20–29 (409)0.93± 0.137 (FN)
4.Henry M.Y. et al. (2004)
[20]
f11–19 (69)0.970 (FN)Hologic Acclaim 4500AGreat Britain
m11–19 (63)1.05 (FN)
5.Karlsson M.K. et al. (2001)
[21]
m24.4 ± 0.6 (24)1.27 ± 0.03 (LS)
1.18 ± 0.03 (FN)
Lunar DPX-LSweden
6.Bakker I. et al. (2003)
[24]
m27 (83)1.170 ± 0.159 (LS)Hologic QDR-2000Netherlands
f27 (97)1.143 ± 0.138 (LS)
m32 (195)1.147 ± 0.172 (LS)
f32 (207)1.116 ± 0.129 (LS)
m36 (170)1.110 ± 0.161 (LS)
f36 (181)1.094 ± 0.120 (LS)
7.Liberato S.C. (2015) [25]m21.8 ± 2.18 (35)1.16 ± 0.15 (LS)LunarAustralia
8.Tveit M. et al. (2014) [23]m23.96 ± 3.85 (135)1.36 (0.11) (LS)1.27 (0.14) (FN)Lunar DPX-LSweden
35.16 ± 3.17 (113)1.27 (0.14) (LS)1.02 (0.15) (FN)
43.19 ± 6.61 (149)1.20 (0.16) (LS)0.98 (0.13) (FN)
9.Lorentzon M. et al. (2005)
[22]
m18.9 ± 0.6 (1068)1.24 ± 0.15 (LS)
1.17 ± 0.16 (FN)
Lunar ProdigySweden
10.Jones G. et al. (2000)
[26]
f33.5 (278)1.07 (0.12) (LS)
0.84 (0.11) (FN)
Hologic QDR2000Australia
11.Leppa¨la J. (1999) et al.
[27]
f22 ± 5 (13)0.900 ± 0.132 (FN)Norland XR-26Finland
m26 ± 4 (28)0.952 ± 0.127 (FN)
12.Ho S.C. et al. (1993)
[28]
f21–24 (46)0.93 ± 0.10 (LS)0.79 ± 0.12 (FN)Norland XR-26China
25–28 (50)0.96 ± 0.11 (LS)0.82 ± 0.12 (FN)
29–32 (57)1.03 ± 0.12 (LS)0.86 ± 0.11 (FN)
33–36 (80)1.02 ± 0.11 (LS)0.83 ± 0.10 (FN)
37–40 (60)0.99 ± 0.14 (LS)0.82 ± 0.14 (FN)
13.Orito S. et al. (2009)
[30]
f12–30 (1322)0.961 ± 0.119 (LS)Hologic QDR4500Japan
14.Yanping D. et al. (2018)
[29]
m21–30 (113)0.986 ± 0.150 (LS)Hologic Delphi AChina
m31–40 (141)0.967 ± 0.113 (LS)
f21–30 (128)0.970 ± 0.100 (LS)
f31–40 (101)0.995 ± 0.104 (LS)
LS—lumbar spine L2–L4, FN—femur neck.

References

  1. Chew, C.K.; Clarke, B.L. Causes of Low Peak Bone Mass in Women. Maturitas 2018, 111, 61–68. [Google Scholar] [CrossRef]
  2. Xue, S.; Kemal, O.; Lu, M.; Lix, L.M.; Leslie, W.D.; Yang, S. Age at Attainment of Peak Bone Mineral Density and Its Associated Factors: The National Health and Nutrition Examination Survey 2005–2014. Bone 2020, 131, 115163. [Google Scholar] [CrossRef]
  3. Loftus, A.; Cappariello, A.; George, C.; Ucci, A.; Shefferd, K.; Green, A.; Paone, R.; Ponzetti, M.; Delle Monache, S.; Muraca, M.; et al. Extracellular Vesicles from Osteotropic Breast Cancer Cells Affect Bone Resident Cells. J. Bone Miner. Res. 2020, 35, 396–412. [Google Scholar] [CrossRef]
  4. Farr, J.N.; Khosla, S. Skeletal Changes through the Lifespan—From Growth to Senescence. Nat. Rev. Endocrinol. 2015, 11, 513–521. [Google Scholar] [CrossRef] [PubMed]
  5. Hadji, P.; Colli, E.; Regidor, P.A. Bone Health in Estrogen-Free Contraception. Osteoporos. Int. 2019, 30, 2391–2400. [Google Scholar] [CrossRef]
  6. Golden, N.H. Bones and Birth Control in Adolescent Girls. J. Pediatr. Adolesc. Gynecol. 2020, 33, 249–254. [Google Scholar] [CrossRef]
  7. Hernandez, C.J.; Carter, D.R.; Beaupré, G.S. A Theoretical Analysis of the Relative Influences of Peak BMD, Age-Related Bone Loss and Menopause on the Development of Osteoporosis. Osteoporos. Int. 2003, 14, 843–847. [Google Scholar] [CrossRef] [PubMed]
  8. Ensrud, K.E.; Crandall, C.J. Osteoporosis. Ann. Intern Med. 2017, 167, ITC17–ITC32. [Google Scholar] [CrossRef] [PubMed]
  9. Burt, L.A.; Hanley, D.A.; Boyd, S.K. Cross-Sectional Versus Longitudinal Change in a Prospective HR-PQCT Study. J. Bone Miner. Res. 2017, 32, 1505–1513. [Google Scholar] [CrossRef] [PubMed]
  10. Gilsanz, V.; Wren, T.A.L.; Ponrartana, S.; Mora, S.; Rosen, C.J. Sexual Dimorphism and the Origins of Human Spinal Health. Endocr. Rev. 2018, 39, 221–239. [Google Scholar] [CrossRef]
  11. Chevalley, T.; Rizzoli, R. Acquisition of Peak Bone Mass. Best Pract. Res. Clin. Endocrinol. Metab. 2022, 36, 101616. [Google Scholar] [CrossRef] [PubMed]
  12. Li, X.; Zhang, Y.; Kang, H.; Liu, W.; Liu, P.; Zhang, J.; Harris, S.E.; Wu, D. Sclerostin Binds to LRP5/6 and Antagonizes Canonical Wnt Signaling. J. Biol. Chem. 2005, 280, 19883–19887. [Google Scholar] [CrossRef]
  13. Merrick, D.; Mistry, K.; Wu, J.; Gresko, N.; Baggs, J.E.; Hogenesch, J.B.; Sun, Z.; Caplan, M.J. Polycystin-1 Regulates Bone Development through an Interaction with the Transcriptional Coactivator TAZ. Hum. Mol. Genet. 2019, 28, 16–30. [Google Scholar] [CrossRef] [PubMed]
  14. Santos, L.; Elliott-Sale, K.J.; Sale, C. Exercise and Bone Health across the Lifespan. Biogerontology 2017, 18, 931–946. [Google Scholar] [CrossRef] [PubMed]
  15. Lindgren, E.; Rosengren, B.E.; Karlsson, M.K. Does Peak Bone Mass Correlate with Peak Bone Strength? Cross-Sectional Normative Dual Energy X-ray Absorptiometry Data in 1052 Men Aged 18–28 Years. BMC Musculoskelet. Disord. 2019, 20, 404. [Google Scholar] [CrossRef]
  16. Kröger, H.; Vainio, P.; Nieminen, J.; Kotaniemi, A. Comparison of Different Models for Interpreting Bone Mineral Density Measurements Using DXA and MRI Technology. Bone 1995, 17, 157–159. [Google Scholar] [CrossRef]
  17. Zakharov, I.S.; Kolpinsky, G.I.; Ushakova, G.A. Referential indices of bone mineral density of lumbar vertebrae for women of kuzbass. Politravma 2014, 3, 3–14. [Google Scholar]
  18. Pashkova, I.G.; Gaivoronsky, I.V.; Gaivoronskaya, M.G. Age features of bone mineral density lumbar spine in adult males. Bull. Russ. Mil. Med. Acad. 2015, 1, 111–114. [Google Scholar]
  19. Looker, A.C.; Orwoll, E.S.; Johnston, C.C.; Lindsay, R.L.; Wahner, H.W.; Dunn, W.L.; Calvo, M.S.; Harris, T.B.; Heyse, S.P. Prevalence of Low Femoral Bone Density in Older U.S. Adults from NHANES III. J. Bone Miner. Res. 1997, 12, 1761–1768. [Google Scholar] [CrossRef]
  20. Henry, Y.M.; Fatayerji, D.; Eastell, R. Attainment of Peak Bone Mass at the Lumbar Spine, Femoral Neck and Radius in Men and Women: Relative Contributions of Bone Size and Volumetric Bone Mineral Density. Osteoporos. Int. 2004, 15, 263–273. [Google Scholar] [CrossRef]
  21. Karlsson, M.; Magnusson, H.; Karlsson, C.; Seeman, E. The Duration of Exercise as a Regulator of Bone Mass. Bone 2001, 28, 128–132. [Google Scholar] [CrossRef]
  22. Lorentzon, M.; Mellström, D.; Ohlsson, C. Age of Attainment of Peak Bone Mass Is Site Specific in Swedish Men—The GOOD Study. J. Bone Miner. Res. 2005, 20, 1223–1227. [Google Scholar] [CrossRef] [PubMed]
  23. Tveit, M.; Rosengren, B.E.; Nilsson, J.A.; Karlsson, M.K. Exercise in Youth: High Bone Mass, Large Bone Size, and Low Fracture Risk in Old Age. Scand. J. Med. Sci. Sports 2015, 25, 453–461. [Google Scholar] [CrossRef] [PubMed]
  24. Bakker, I.; Twisk, J.W.R.; Van Mechelen, W.; Roos, J.C.; Kemper, H.C.G. Ten-Year Longitudinal Relationship between Physical Activity and Lumbar Bone Mass in (Young) Adults. J. Bone Miner. Res. 2003, 18, 325–332. [Google Scholar] [CrossRef] [PubMed]
  25. Liberato, S.C.; Maple-Brown, L.; Bressan, J. Association between Bone Mineralization, Body Composition, and Cardiorespiratory Fitness Level in Young Australian Men. J. Clin. Densitom. 2015, 18, 187–191. [Google Scholar] [CrossRef]
  26. Jones, G.; Nguyen, T.V. Associations between Maternal Peak Bone Mass and Bone Mass in Prepubertal Male and Female Children. J. Bone Miner. Res. 2000, 15, 1998–2004. [Google Scholar] [CrossRef]
  27. Leppälä, J.; Kannus, P.; Niemi, S.; Sievänen, H.; Vuori, I.; Järvinen, M. An Early-Life Femoral Shaft Fracture and Bone Mineral Density at Adulthood. Osteoporos. Int. 1999, 10, 337–342. [Google Scholar] [CrossRef]
  28. Ho, S.C.; Hsu, S.Y.; Leung, P.C.; Chan, C.; Swaminathan, R.; Fan, Y.K.; Chan, S.S. A Longitudinal Study of the Determinants of Bone Mass in Chinese Women Aged 21 to 40 I. Baseline Association of Anthropometric Measurements with Bone Mineral Density. Ann. Epidemiol. 1993, 3, 256–263. [Google Scholar] [CrossRef]
  29. Du, Y.; Zhu, H.; Zheng, S.; Zhu, X.; Zhang, X.; Xue, S.; Li, H.; Hong, W.; Tang, W.; Chen, M.; et al. Age and Sex Effects on the Relationship between Body Composition and Hip Geometric Structure in Males and Females from East China. Arch. Osteoporos. 2018, 13, 79. [Google Scholar] [CrossRef]
  30. Orito, S.; Kuroda, T.; Onoe, Y.; Sato, Y.; Ohta, H. Age-Related Distribution of Bone and Skeletal Parameters in 1322 Japanese Young Women. J. Bone Miner. Metab. 2009, 27, 698–704. [Google Scholar] [CrossRef]
  31. Zhu, X.; Zheng, H. Factors Influencing Peak Bone Mass Gain. Front. Med. 2021, 15, 53–69. [Google Scholar] [CrossRef] [PubMed]
  32. Almeida, M.; Laurent, M.R.; Dubois, V.; Claessens, F.; O’Brien, C.A.; Bouillon, R.; Vanderschueren, D.; Manolagas, S.C. Estrogens and Androgens in Skeletal Physiology and Pathophysiology. Physiol. Rev. 2017, 97, 135–187. [Google Scholar] [CrossRef] [PubMed]
  33. Carson, J.A.; Manolagas, S.C. Effects of Sex Steroids on Bones and Muscles: Similarities, Parallels, and Putative Interactions in Health and Disease. Bone 2015, 80, 67–78. [Google Scholar] [CrossRef] [PubMed]
  34. Manolagas, S.C. From Estrogen-Centric to Aging and Oxidative Stress: A Revised Perspective of the Pathogenesis of Osteo-porosis. Endocr. Rev. 2010, 31, 266–300. [Google Scholar] [CrossRef]
  35. Park-Min, K.-H. Mechanisms Involved in Normal and Pathological Osteoclastogenesis. Cell. Mol. Life Sci. 2018, 75, 2519–2528. [Google Scholar] [CrossRef]
  36. Yasuda, H. Discovery of the RANKL/RANK/OPG System. J. Bone Miner. Metab. 2021, 39, 2–11. [Google Scholar] [CrossRef] [PubMed]
  37. Szeliga, A.; Maciejewska-Jeske, M.; Męczekalski, B. Bone Health and Evaluation of Bone Mineral Density in Patients with Premature Ovarian Insufficiency. Menopausal Rev. 2018, 17, 112–116. [Google Scholar] [CrossRef]
  38. Vlot, M.C.; Wiepjes, C.M.; de Jongh, R.T.; T’Sjoen, G.; Heijboer, A.C.; den Heijer, M. Gender-Affirming Hormone Treatment Decreases Bone Turnover in Transwomen and Older Transmen. J. Bone Miner. Res. 2019, 34, 1862–1872. [Google Scholar] [CrossRef]
  39. Yan, J.; Charles, J.F. Gut Microbiome and Bone: To Build, Destroy, or Both? Curr. Osteoporos. Rep. 2017, 15, 376–384. [Google Scholar] [CrossRef]
  40. Lucas, S.; Omata, Y.; Hofmann, J.; Böttcher, M.; Iljazovic, A.; Sarter, K.; Albrecht, O.; Schulz, O.; Krishnacoumar, B.; Krönke, G.; et al. Short-Chain Fatty Acids Regulate Systemic Bone Mass and Protect from Pathological Bone Loss. Nat. Commun. 2018, 9, 55. [Google Scholar] [CrossRef]
  41. Li, J.-Y.; Yu, M.; Pal, S.; Tyagi, A.M.; Dar, H.; Adams, J.; Neale Weitzmann, M.; Jones, R.M.; Pacifici, R. Parathyroid Hormone–Dependent Bone Formation Requires Butyrate Production by Intestinal Microbiota. J. Clin. Investig. 2020, 130, 1767–1781. [Google Scholar] [CrossRef]
  42. Jansson, P.-A.; Curiac, D.; Lazou Ahrén, I.; Hansson, F.; Martinsson Niskanen, T.; Sjögren, K.; Ohlsson, C. Probiotic Treatment Using a Mix of Three Lactobacillus Strains for Lumbar Spine Bone Loss in Postmenopausal Women: A Randomised, Double-Blind, Placebo-Controlled, Multicentre Trial. Lancet Rheumatol. 2019, 1, e154–e162. [Google Scholar] [CrossRef]
  43. Whisner, C.M.; Castillo, L.F. Prebiotics, Bone and Mineral Metabolism. Calcif. Tissue Int. 2018, 102, 443–479. [Google Scholar] [CrossRef] [PubMed]
  44. Xu, Z.; Xie, Z.; Sun, J.; Huang, S.; Chen, Y.; Li, C.; Sun, X.; Xia, B.; Tian, L.; Guo, C.; et al. Gut Microbiome Reveals Specific Dysbiosis in Primary Osteoporosis. Front. Cell. Infect. Microbiol. 2020, 10, 160. [Google Scholar] [CrossRef]
  45. Behera, J.; Ison, J.; Tyagi, S.C.; Tyagi, N. The Role of Gut Microbiota in Bone Homeostasis. Bone 2020, 135, 115317. [Google Scholar] [CrossRef] [PubMed]
  46. Nilsson, A.G.; Sundh, D.; Bäckhed, F.; Lorentzon, M. Lactobacillus reuteri Reduces Bone Loss in Older Women with Low Bone Mineral Density: A Randomized, Placebo-Controlled, Double-Blind, Clinical Trial. J. Intern. Med. 2018, 284, 307–317. [Google Scholar] [CrossRef]
  47. Jafarnejad, S.; Djafarian, K.; Fazeli, M.R.; Yekaninejad, M.S.; Rostamian, A.; Keshavarz, S.A. Effects of a Multispecies Probiotic Supplement on Bone Health in Osteopenic Postmenopausal Women: A Randomized, Double-Blind, Controlled Trial. J. Am. Coll. Nutr. 2017, 36, 497–506. [Google Scholar] [CrossRef] [PubMed]
  48. Wang, Y.; Wu, Y.; Wang, Y.; Xu, H.; Mei, X.; Yu, D.; Wang, Y.; Li, W. Antioxidant Properties of Probiotic Bacteria. Nutrients 2017, 9, 521. [Google Scholar] [CrossRef] [PubMed]
  49. Feigenson, M.; Eliseev, R.A.; Jonason, J.H.; Mills, B.N.; O’Keefe, R.J. PGE2 Receptor Subtype 1 (EP1) Regulates Mesenchymal Stromal Cell Osteogenic Differentiation by Modulating Cellular Energy Metabolism. J. Cell. Biochem. 2017, 118, 4383–4393. [Google Scholar] [CrossRef]
  50. Pino, A.M.; Rodríguez, J.P. Is Fatty Acid Composition of Human Bone Marrow Significant to Bone Health? Bone 2019, 118, 53–61. [Google Scholar] [CrossRef] [PubMed]
  51. Song, J.; Jing, Z.; Hu, W.; Yu, J.; Cui, X. α-Linolenic Acid Inhibits Receptor Activator of NF-κB Ligand Induced (RANKL-Induced) Osteoclastogenesis and Prevents Inflammatory Bone Loss via Downregulation of Nuclear Factor-KappaB-Inducible Nitric Oxide Synthases (NF-κB-iNOS) Signaling Pathways. Med. Sci. Monit. 2017, 23, 5056–5069. [Google Scholar] [CrossRef] [PubMed]
  52. Fintini, D.; Cianfarani, S.; Cofini, M.; Andreoletti, A.; Ubertini, G.M.; Cappa, M.; Manco, M. The Bones of Children with Obesity. Front. Endocrinol. 2020, 11, 200. [Google Scholar] [CrossRef] [PubMed]
  53. Loke, S.-S.; Chang, H.-W.; Li, W.-C. Association between Metabolic Syndrome and Bone Mineral Density in a Taiwanese Elderly Population. J. Bone Miner. Metab. 2018, 36, 200–208. [Google Scholar] [CrossRef]
  54. Palermo, A.; Tuccinardi, D.; De Feudis, G.; Watanabe, M.; D’Onofrio, L.; Lauria Pantano, A.; Napoli, N.; Pozzilli, P.; Manfrini, S. BMI and BMD: The Potential Interplay between Obesity and Bone Fragility. Int. J. Environ. Res. Public Health 2016, 13, 544. [Google Scholar] [CrossRef] [PubMed]
  55. Hetherington-Rauth, M.; Bea, J.W.; Blew, R.M.; Funk, J.L.; Hingle, M.D.; Lee, V.R.; Roe, D.J.; Wheeler, M.D.; Lohman, T.G.; Going, S.B. Relative Contributions of Lean and Fat Mass to Bone Strength in Young Hispanic and Non-Hispanic Girls. Bone 2018, 113, 144–150. [Google Scholar] [CrossRef]
  56. Xiao, Z.; Xu, H. Gender-Specific Body Composition Relationships between Adipose Tissue Distribution and Peak Bone Mineral Density in Young Chinese Adults. BioMed Res. Int. 2020, 2020, 6724749. [Google Scholar] [CrossRef]
  57. Nilsen, O.A.; Ahmed, L.A.; Winther, A.; Christoffersen, T.; Thrane, G.; Evensen, E.; Furberg, A.S.; Grimnes, G.; Dennison, E.; Emaus, N. Body Weight and Body Mass Index Influence Bone Mineral Density in Late Adolescence in a Two-Year Follow-Up Study. The Tromsø Study: Fit Futures. JBMR Plus 2019, 3, e10195. [Google Scholar] [CrossRef]
  58. Lagerquist, M.K.; Gustafsson, K.L.; Henning, P.; Farman, H.; Wu, J.; Sjögren, K.; Koskela, A.; Tuukkanen, J.; Ohlsson, C.; Wernstedt Asterholm, I.; et al. Acute Fat Loss Does not Affect Bone Mass. Sci. Rep. 2021, 11, 14177. [Google Scholar] [CrossRef]
  59. Laurent, M.R.; Dubois, V.; Claessens, F.; Verschueren, S.M.P.; Vanderschueren, D.; Gielen, E.; Jardí, F. Muscle-Bone Interactions: From Experimental Models to the Clinic? A Critical Update. Mol. Cell. Endocrinol. 2016, 432, 14–36. [Google Scholar] [CrossRef]
  60. Nguyen, H.G.; Pham, M.T.D.; Ho-Pham, L.T.; Nguyen, T.V. Lean Mass and Peak Bone Mineral Density. Osteoporos. Sarcopenia 2020, 6, 212–216. [Google Scholar] [CrossRef]
  61. Winther, A.; Jørgensen, L.; Ahmed, L.A.; Christoffersen, T.; Furberg, A.S.; Grimnes, G.; Jorde, R.; Nilsen, O.A.; Dennison, E.; Emaus, N. Bone Mineral Density at the Hip and its Relation to Fat Mass and Lean Mass in Adolescents: The Tromsø Study, Fit Futures. BMC Musculoskelet. Disord. 2018, 19, 21. [Google Scholar] [CrossRef] [PubMed]
  62. Hao, Y.; Ma, Y.; Wang, X.; Jin, F.; Ge, S. Short-Term Muscle Atrophy Caused by Botulinum Toxin-A Local Injection Impairs Fracture Healing in the Rat Femur. J. Orthop. Res. 2012, 30, 574–580. [Google Scholar] [CrossRef]
  63. Li, G.; Zhang, L.; Wang, D.; AI Qudsy, L.; Jiang, J.X.; Xu, H.; Shang, P. Muscle-Bone Crosstalk and Potential Therapies for Sarco-Osteoporosis. J. Cell. Biochem. 2019, 120, 14262–14273. [Google Scholar] [CrossRef]
  64. Bonewald, L. Use it or Lose it to Age: A Review of Bone and Muscle Communication. Bone 2019, 120, 212–218. [Google Scholar] [CrossRef]
  65. Puolakkainen, T.; Ma, H.; Kainulainen, H.; Pasternack, A.; Rantalainen, T.; Ritvos, O.; Heikinheimo, K.; Hulmi, J.J.; Kiviranta, R. Treatment with Soluble Activin Type IIB-Receptor Improves Bone Mass and Strength in a Mouse Model of Duchenne Muscular Dystrophy. BMC Musculoskelet. Disord. 2017, 18, 20. [Google Scholar] [CrossRef]
  66. Chen, Y.S.; Guo, Q.; Guo, L.J.; Liu, T.; Wu, X.P.; Lin, Z.Y.; He, H.B.; Jiang, T.J. GDF8 Inhibits Bone Formation and Promotes Bone Resorption in Mice. Clin. Exp. Pharmacol. Physiol. 2017, 44, 500–508. [Google Scholar] [CrossRef] [PubMed]
  67. Qin, Y.; Peng, Y.; Zhao, W.; Pan, J.; Ksiezak-Reding, H.; Cardozo, C.; Wu, Y.; Pajevic, P.D.; Bonewald, L.F.; Bauman, W.A.; et al. Myostatin Inhibits Osteoblastic Differentiation by Suppressing Osteocyte-Derived Exosomal microRNA-218: A Novel Mechanism in Muscle-Bone Communication. J. Biol. Chem. 2017, 292, 11021–11033. [Google Scholar] [CrossRef]
  68. Callréus, M.; McGuigan, F.; Åkesson, K. Adverse Effects of Smoking on Peak Bone Mass May Be Attenuated by Higher Body Mass Index in Young Female Smokers. Calcif. Tissue Int. 2013, 93, 517–525. [Google Scholar] [CrossRef]
  69. Wu, Z.J.; Zhao, P.; Liu, B.; Yuan, Z.C. Effect of Cigarette Smoking on Risk of Hip Fracture in Men: A Meta-Analysis of 14 Prospective Cohort Studies. PLoS ONE 2016, 11, e0168990. [Google Scholar] [CrossRef]
  70. Yuan, S.; Michaëlsson, K.; Wan, Z.; Larsson, S.C. Associations of Smoking and Alcohol and Coffee Intake with Fracture and Bone Mineral Density: A Mendelian Randomization Study. Calcif. Tissue Int. 2019, 105, 582–588. [Google Scholar] [CrossRef] [PubMed]
  71. Al-Bashaireh, A.M.; Haddad, L.G.; Weaver, M.; Chengguo, X.; Kelly, D.L.; Yoon, S. The Effect of Tobacco Smoking on Bone Mass: An Overview of Pathophysiologic Mechanisms. J. Osteoporos. 2018, 2018, 1206235. [Google Scholar] [CrossRef] [PubMed]
  72. Pompe, E.; Bartstra, J.; Verhaar, H.J.; de Koning, H.J.; van der Aalst, C.M.; Oudkerk, M.; Vliegenthart, R.; Lammers, J.-W.; de Jong, P.; Hoesein, F.M. Bone Density Loss on Computed Tomography at 3-Year Follow-up in Current Compared to Former Male Smokers. Eur. J. Radiol. 2017, 89, 177–181. [Google Scholar] [CrossRef] [PubMed]
  73. Al-Bashaireh, A.M.; Haddad, L.G.; Weaver, M.; Kelly, D.L.; Chengguo, X.; Yoon, S. The Effect of Tobacco Smoking on Mus-Culoskeletal Health: A Systematic Review. J. Environ. Public Health 2018, 2018, 4184190. [Google Scholar] [CrossRef] [PubMed]
  74. Strozyk, D.; Gress, T.M.; Breitling, L.P. Smoking and Bone Mineral Density: Comprehensive Analyses of the Third NATIONAL Health and Nutrition Examination Survey (NHANES III). Arch. Osteoporos. 2018, 13, 16. [Google Scholar] [CrossRef] [PubMed]
  75. Yang, C.Y.; Lai, J.C.Y.; Huang, W.L.; Hsu, C.L.; Chen, S.J. Effects of Sex, Tobacco Smoking, and Alcohol Consumption Osteoporosis Development: Evidence from Taiwan Biobank Participants. Tob. Induc. Dis. 2021, 19, 8210532. [Google Scholar] [CrossRef]
  76. Sophocleous, A.; Robertson, R.; Ferreira, N.B.; McKenzie, J.; Fraser, W.D.; Ralston, S.H. Heavy Cannabis Use Is Associated with Low Bone Mineral Density and an Increased Risk of Fractures. Am. J. Med. 2017, 130, 214–221. [Google Scholar] [CrossRef]
  77. Raphael-Mizrahi, B.; Gabet, Y. The Cannabinoids Effect on Bone Formation and Bone Healing. Curr. Osteoporos. Rep. 2020, 18, 433–438. [Google Scholar] [CrossRef] [PubMed]
  78. Goltzman, D. Functions of Vitamin D in Bone. Histochem. Cell Biol. 2018, 149, 305–312. [Google Scholar] [CrossRef]
  79. LeBoff, M.S.; Chou, S.H.; Ratliff, K.A.; Cook, N.R.; Khurana, B.; Kim, E.; Cawthon, P.M.; Bauer, D.C.; Black, D.; Gallagher, J.C.; et al. Supplemental Vitamin D and Incident Fractures in Midlife and Older Adults. N. Engl. J. Med. 2022, 387, 299–309. [Google Scholar] [CrossRef]
  80. Gou, G.H.; Tseng, F.J.; Wang, S.H.; Chen, P.J.; Shyu, J.F.; Pan, R.Y. Nutritional Factors Associated with Femoral Neck Bone Mineral Density in Children and Adolescents. BMC Musculoskelet. Disord. 2019, 20, 520. [Google Scholar] [CrossRef]
  81. Zhou, W.; Langsetmo, L.; Berger, C.; Poliquin, S.; Kreiger, N.; Barr, S.I.; Kaiser, S.M.; Josse, R.G.; Prior, J.C.; Towheed, T.E.; et al. Longitudinal Changes in Calcium and Vitamin D Intakes and Relationship to Bone Mineral Density in a Prospective Population-Based Study: The Canadian Multicentre Osteoporosis Study (CaMos). J. Musculoskelet. Neuronal Interact. 2013, 13, 470. [Google Scholar] [PubMed]
  82. Neville, C.E.; Robson, P.J.; Murray, L.J.; Strain, J.J.; Twisk, J.; Gallagher, A.M.; McGuinness, M.; Cran, G.W.; Ralston, S.H.; Boreham, C.A.G. The Effect of Nutrient Intake on Bone Mineral Status in Young Adults: The Northern Ireland Young Hearts Project. Calcif. Tissue Int. 2002, 70, 89–98. [Google Scholar] [CrossRef] [PubMed]
  83. Krstic, N.; Bishop, N.; Curtis, B.; Cooper, C.; Harvey, N.; Lilycrop, K.; Murray, R.; Owen, R.; Reilly, G.; Skerry, T.; et al. Early Life Vitamin D Depletion and Mechanical Loading Determine Methylation Changes in the RUNX2, RXRA, and Osterix Promoters in Mice. Genes Nutr. 2022, 17, 7. [Google Scholar] [CrossRef]
  84. Li, H.; Hou, J.-L.; Yang, W.-Y.; Zhang, Q.; Feng, H.; Wang, X.-B.; Deng, K.-L.; Mao, X.-L.; Xiao, S.-M. Associations between Dietary Antioxidant Vitamin Intake and the Changes in Bone Mass in Chinese Adolescents: A 2.5-Year Longitudinal Study. Nutrients 2022, 14, 4187. [Google Scholar] [CrossRef]
  85. Movassagh, E.Z.; Baxter-Jones, A.D.G.; Kontulainen, S.; Whiting, S.; Szafron, M.; Vatanparast, H. Vegetarian-Style Dietary Pattern during Adolescence Has Long-Term Positive Impact on Bone from Adolescence to Young Adulthood: A Longitudinal Study. Nutr. J. 2018, 17, 36. [Google Scholar] [CrossRef] [PubMed]
  86. Scheller, E.L.; Khoury, B.; Moller, K.L.; Wee, N.K.Y.; Khandaker, S.; Kozloff, K.M.; Abrishami, S.H.; Zamarron, B.F.; Singer, K. Changes in Skeletal Integrity and Marrow Adiposity during High-Fat Diet and after Weight Loss. Front. Endocrinol. 2016, 7, 102. [Google Scholar] [CrossRef] [PubMed]
  87. Tian, L.; Yu, X. Fat, Sugar, and Bone Health: A Complex Relationship. Nutrients 2017, 9, 506. [Google Scholar] [CrossRef] [PubMed]
  88. Weaver, C.M.; Gordon, C.M.; Janz, K.F.; Kalkwarf, H.J.; Lappe, J.M.; Lewis, R.; O’Karma, M.; Wallace, T.C.; Zemel, B.S. The National Osteoporosis Foundation’s Position Statement on Peak Bone Mass Development and Lifestyle Factors: A Systematic Review and Implementation Recommendations. Osteoporos. Int. 2016, 27, 1281–1386. [Google Scholar] [CrossRef]
  89. Karlsson, M.K.; Rosengren, B.E. Exercise and Peak Bone Mass. Curr. Osteoporos. Rep. 2020, 18, 285–290. [Google Scholar] [CrossRef]
  90. Nguyen, V.H. School-Based Exercise Interventions Effectively Increase Bone Mineralization in Children and Adolescents. Osteoporos. Sarcopenia 2018, 4, 39–46. [Google Scholar] [CrossRef]
  91. Larsen, M.N.; Nielsen, C.M.; Helge, E.W.; Madsen, M.; Manniche, V.; Hansen, L.; Hansen, P.R.; Bangsbo, J.; Krustrup, P. Positive Effects on Bone Mineralisation and Muscular Fitness after 10 Months of Intense School-Based Physical Training for Children Aged 8–10 Years: The Fit First Randomised Controlled Trial. Br. J. Sport. Med. 2018, 52, 254–260. [Google Scholar] [CrossRef]
  92. Tang, Y.; Wang, S.; Yi, Q.; Xia, Y.; Geng, B. Sleep Pattern and Bone Mineral Density: A Cross-Sectional Study of National Health and Nutrition Examination Survey (NHANES) 2017–2018. Arch. Osteoporos. 2021, 16, 157. [Google Scholar] [CrossRef] [PubMed]
  93. Ma, M.; Liu, X.; Jia, G.; Liu, Z.; Zhang, K.; He, L.; Geng, B.; Xia, Y. The Association between Depression and Bone Metabolism: A US Nationally Representative Cross-Sectional Study. Arch. Osteoporos. 2022, 17, 113. [Google Scholar] [CrossRef] [PubMed]
  94. Mikkola, T.M.; von Bonsdorff, M.B.; Osmond, C.; Salonen, M.K.; Kajantie, E.; Cooper, C.; Välimäki, M.J.; Eriksson, J.G. Childhood Growth Predicts Higher Bone Mass and Greater Bone Area in Early Old Age: Findings among a Subgroup of Women from the Helsinki Birth Cohort Study. Osteoporos. Int. 2017, 28, 2717–2722. [Google Scholar] [CrossRef]
  95. Baird, J.; Kurshid, M.A.; Kim, M.; Harvey, N.; Dennison, E.; Cooper, C. Does Birthweight Predict Bone Mass in Adulthood? A Systematic Review and Meta-Analysis. Osteoporos. Int. 2011, 22, 1323–1334. [Google Scholar] [CrossRef] [PubMed]
  96. Callréus, M.; McGuigan, F.; Åkesson, K. Birth Weight is More Important for Peak Bone Mineral Content than for Bone Density: The PEAK-25 Study of 1,061 Young Adult Women. Osteoporos. Int. 2013, 24, 1347–1355. [Google Scholar] [CrossRef]
  97. Akhiiarova, K.E.; Gantseva, K.K.; Khusainova, R.I.; Tyurin, A.V. Phenotypic Manifestations of Connective Tissue Dysplasia in Individuals with Joint Hypermobility. Med. Counc. 2022, 156–161. [Google Scholar] [CrossRef]
  98. Yalaev, B.; Tyurin, A.; Prokopenko, I.; Karunas, A.; Khusnutdinova, E.; Khusainova, R. Using a Polygenic Score to Predict the Risk of Developing Primary Osteoporosis. Int. J. Mol. Sci. 2022, 23, 10021. [Google Scholar] [CrossRef]
  99. Yu, W.J.; Zhang, Z.; Fu, W.Z.; He, J.W.; Wang, C.; Zhang, Z.L. Association between LGR4 Polymorphisms and Peak Bone Mineral Density and Body Composition. J. Bone Miner. Metab. 2020, 38, 658–669. [Google Scholar] [CrossRef]
  100. Zheng, Y.; Wang, C.; Zhang, H.; Shao, C.; Gao, L.H.; Li, S.S.; Yu, W.J.; He, J.W.; Fu, W.Z.; Hu, Y.Q.; et al. Polymorphisms in Wnt Signaling Pathway Genes Are Associated with Peak Bone Mineral Density, Lean Mass, and Fat Mass in Chinese Male Nuclear Families. Osteoporos. Int. 2016, 27, 1805–1815. [Google Scholar] [CrossRef]
  101. Zhao, F.; Gao, L.-H.; Li, S.-S.; Wei, Z.-Y.; Fu, W.-Z.; He, J.-W.; Liu, Y.-J.; Hu, Y.-Q.; Dong, J.; Zhang, Z.-L. Association between SNPs and Haplotypes in the METTL21C Gene and Peak Bone Mineral Density and Body Composition in Chinese Male Nuclear Families. J. Bone Miner. Metab. 2017, 35, 437–447. [Google Scholar] [CrossRef] [PubMed]
  102. He, J.W.; Yue, H.; Hu, W.W.; Hu, Y.Q.; Zhang, Z.L. Contribution of the Sclerostin Domain-Containing Protein 1 (SOSTDC1) Gene to Normal Variation of Peak Bone Mineral Density in Chinese Women and Men. J. Bone Miner. Metab. 2011, 29, 571–581. [Google Scholar] [CrossRef] [PubMed]
  103. Chesi, A.; Wagley, Y.; Johnson, M.E.; Manduchi, E.; Su, C.; Lu, S.; Leonard, M.E.; Hodge, K.M.; Pippin, J.A.; Hankenson, K.D.; et al. Genome-Scale Capture C Promoter Interactions Implicate Effector Genes at GWAS Loci for Bone Mineral Density. Nat. Commun. 2019, 10, 1260. [Google Scholar] [CrossRef] [PubMed]
  104. Pippin, J.A.; Chesi, A.; Wagley, Y.; Su, C.; Pahl, M.C.; Hodge, K.M.; Johnson, M.E.; Wells, A.D.; Hankenson, K.D.; Grant, S.F.A. CRISPR-Cas9–Mediated Genome Editing Confirms EPDR1 as an Effector Gene at the BMD GWAS-Implicated ‘STARD3NL’ Locus. JBMR Plus 2021, 5, e10531. [Google Scholar] [CrossRef] [PubMed]
  105. Zheng, H.F.; Tobias, J.H.; Duncan, E.; Evans, D.M.; Eriksson, J.; Paternoster, L.; Yerges-Armstrong, L.M.; Lehtimäki, T.; Bergström, U.; Kähönen, M.; et al. WNT16 Influences Bone Mineral Density, Cortical Bone Thickness, Bone Strength, and Osteoporotic Fracture Risk. PLoS Genet. 2012, 8, e1002745. [Google Scholar] [CrossRef] [PubMed]
  106. Mullin, B.H.; Walsh, J.P.; Zheng, H.F.; Brown, S.J.; Surdulescu, G.L.; Curtis, C.; Breen, G.; Dudbridge, F.; Richards, J.B.; Spector, T.D.; et al. Genome-Wide Association Study Using Family-Based Cohorts Identifies the WLS and CCDC170/ESR1 Loci as Associated with Bone Mineral Density. BMC Genom. 2016, 17, 136. [Google Scholar] [CrossRef] [PubMed]
  107. Luo, F.; Xie, Y.; Chen, H.; Huang, J.; Li, C.; Chen, L.; Yang, J.; Su, N. Fgfr1 Deficiency in Osteocytes Leads to Increased Bone Mass by Enhancing Wnt/β-Catenin Signaling. Bone 2023, 174, 116817. [Google Scholar] [CrossRef]
Figure 1. Endogenous and exogenous factors affecting PBM.
Biomedicines 11 02982 g001
Figure 2. Mechanisms of the influence of risk factors on the formation of peak bone mass. The figure shows a simplified version the molecular mechanisms of modeling and remodeling of bone tissue and possible factors of an endogenous and exogenous nature that can influence certain links of pathogenesis. MCSF—macrophage colony-stimulating factor; TNFRSF11 (RANKL)—tumor necrosis factor superfamily member 11 (tumor necrosis factor ligand superfamily member 1); PGE2—prostaglandin E2; SCFAs—short-chain fatty acids; OPG—osteoprotegerin; SOST—sclerostin gene; DDK1- Dickkopf WNT signaling pathway inhibitor 1; OSX1—osteoblast-specific transcription factor Osterix; RUNX2—runt-related transcription factor 2; + denotes positive influence; − negative influence.
Biomedicines 11 02982 g002
Disclaimer/Publisher’s Note: The statements, opinions and data contained in all publications are solely those of the individual author(s) and contributor(s) and not of MDPI and/or the editor(s). MDPI and/or the editor(s) disclaim responsibility for any injury to people or property resulting from any ideas, methods, instructions or products referred to in the content.

