
Exploring Circulating Long Non-Coding RNAs in Mild Cognitive Impairment Patients’ Blood
 ,
,  ,
,  ,
, 
Abstract
:1. Introduction
2. Materials and Methods
2.1. Recruitment of Patients
2.2. Blood Collection
2.3. RNA Extraction
2.4. lncRNA Microarray Profiling
2.5. Validation of lncRNA Gene Expression in Blood by Real-Time Quantitative PCR (RT-qPCR)
2.6. Statistical and Bioinformatics Analyses
3. Results
4. Discussion
5. Conclusions
Author Contributions
Funding
Institutional Review Board Statement
Informed Consent Statement
Data Availability Statement
Conflicts of Interest
References
- Giau, V.V.; Bagyinszky, E.; An, S.S.A. Potential Fluid Biomarkers for the Diagnosis of Mild Cognitive Impairment. Int. J. Mol. Sci. 2019, 20, 4149. [Google Scholar] [CrossRef]
- Shen, X.N.; Niu, L.D.; Wang, Y.J.; Cao, X.P.; Liu, Q.; Tan, L.; Zhang, C.; Yu, J.T. Inflammatory markers in Alzheimer’s disease and mild cognitive impairment: A meta-analysis and systematic review of 170 studies. J. Neurol. Neurosurg. Psychiatry 2019, 90, 590–598. [Google Scholar] [CrossRef]
- Mayo Clinic. (n.d.). Dementia: Symptoms and Causes. Available online: https://www.mayoclinic.org/diseases-conditions/dementia/symptoms-causes/syc-20352013 (accessed on 26 June 2023).
- Wang, J.; Zhu, S.; Meng, N.; He, Y.; Lu, R.; Yan, G.R. ncRNA-Encoded Peptides or Proteins and Cancer. Mol. Ther. 2019, 27, 1718–1725. [Google Scholar] [CrossRef]
- De Felice, B.; Montanino, C.; Oliva, M.; Bonavita, S.; Di Onofrio, V.; Coppola, C. MicroRNA Expression Signature in Mild Cognitive Impairment Due to Alzheimer’s Disease. Mol. Neurobiol. 2020, 57, 4408–4416. [Google Scholar] [CrossRef]
- Wei, Z.D.; Shetty, A.K. Can mild cognitive impairment and Alzheimer’s disease be diagnosed by monitoring a miRNA triad in the blood? Ageing Cell 2022, 21, e13627. [Google Scholar] [CrossRef]
- Zhan, F.; Yang, J.; Lin, S.; Chen, L. miRNA-Based Signature to Predict the Development of Alzheimer’s Disease. Comb. Chem. High. Throughput Screen. 2022, 25, 2103–2111. [Google Scholar] [CrossRef]
- Santoro, M.; Nociti, V.; Lucchini, M.; Loiodice, M.; Centofanti, F.; Botta, A.; Losavio, F.A.; De Fino, C.; Mirabella, M. A pilot study of lncRNAs expression profile in serum of progressive multiple sclerosis patients. Eur. Rev. Med. Pharmacol. Sci. 2020, 24, 3267–3273. [Google Scholar] [CrossRef]
- Zhu, J.; Fu, H.; Wu, Y.; Zheng, X. Function of lncRNAs and approaches to lncRNA-protein interactions. Sci. China Life Sci. 2013, 56, 876–885. [Google Scholar] [CrossRef]
- Wu, Y.Y.; Kuo, H.C. Functional roles and networks of non-coding RNAs in the pathogenesis of neurodegenerative diseases. J. Biomed. Sci. 2020, 27, 1–23. [Google Scholar] [CrossRef]
- Serebrovska, Z.O.; Serebrovska, T.V.; Kholin, V.A.; Tumanovska, L.V.; Shysh, A.M.; Pashevin, D.A.; Goncharov, S.V.; Stroy, D.; Grib, O.N.; Shatylo, V.B.; et al. Intermittent Hypoxia-Hyperoxia Training Improves Cognitive Function and Decreases Circulating Biomarkers of Alzheimer’s Disease in Patients with Mild Cognitive Impairment: A Pilot Study. Int. J. Mol. Sci. 2019, 20, 5405. [Google Scholar] [CrossRef]
- Harris, C.R.; Millman, K.J.; van der Walt, S.J.; Gommers, R.; Virtanen, P.; Cournapeau, D.; Wieser, E.; Taylor, J.; Berg, S.; Smith, N.J.; et al. Array programming with NumPy. Nature 2020, 585, 357–362. [Google Scholar] [CrossRef]
- Virtanen, P.; Gommers, R.; Oliphant, T.E.; Haberland, M.; Reddy, T.; Cournapeau, D.; Burovski, E.; Peterson, P.; Weckesser, W.; Bright, J.; et al. Contributors. SciPy 1.0: Fundamental algorithms for scientific computing in Python. Nat. Methods 2020, 17, 261–272. [Google Scholar] [CrossRef]
- McKinney, W. Data Structures for Statistical Computing in Python. In Proceedings of the 9th Python in Science Conference, Austin, TX, USA, 28 June–3 July 2010; pp. 51–56. [Google Scholar] [CrossRef]
- Hunter, J.D. Matplotlib: A 2D graphics environment. Comput. Sci. Eng. 2007, 9, 90–95. [Google Scholar] [CrossRef]
- Waskom, M. Seaborn: Statistical Data Visualization. J. Open Source Softw. 2021, 6, 3021. [Google Scholar] [CrossRef]
- Kang, J.; Tang, Q.; He, J.; Li, L.; Yang, N.; Yu, S.; Wang, M.; Zhang, Y.; Lin, J.; Cui, T.; et al. RNAInter v4.0: RNA interactome repository with redefined confidence scoring system and improved accessibility. Nucleic Acids Res. 2022, 50, D326–D332. [Google Scholar]
- Lin, Y.; Liu, T.; Cui, T.; Wang, Z.; Zhang, Y.; Tan, P.; Huang, Y.; Yu, J.; Wang, D. RNAInter in 2020: RNA interactome repository with increased coverage and annotation. Nucleic Acids Res. 2022, 48, D189–D197. [Google Scholar] [CrossRef]
- Python Software Foundation. ‘Glob—Unix Style Pathname Pattern Expansion.’ Python Documentation. 2020. Available online: https://docs.python.org/3/library/glob.html. (accessed on 14 June 2023).
- Raudvere, U.; Kolberg, L.; Kuzmin, I.; Arak, T.; Adler, P.; Peterson, H.; Vilo, J. G:Profiler: A web server for functional enrichment analysis and conversions of gene lists (2019 update). Nucleic Acids Res. 2019, 47, W191–W198. [Google Scholar]
- Shannon, P.; Markiel, A.; Ozier, O.; Baliga, N.S.; Wang, J.T.; Ramage, D.; Amin, N.; Schwikowski, B.; Ideker, T. Cytoscape: A Software Environment for Integrated Models. Genome Res. 1971, 13, 426. [Google Scholar]
- Merico, D.; Isserlin, R.; Stueker, O.; Emili, A.; Bader, G.D. Enrichment map: A network-based method for gene-set enrichment visualization and interpretation. PLoS ONE 2010, 5, e13984. [Google Scholar] [CrossRef]
- Chin, C.H.; Chen, S.-H.; Wu, H.-H.; Ho, C.-W.; Ko, M.-T.; Lin, C.-Y. cytoHubba: Identifying hub objects and sub-networks from complex interactome. BMC Syst. Biol. 2014, 8, S11. [Google Scholar] [CrossRef]
- Shobeiri, P.; Alilou, S.; Jaberinezhad, M.; Zare, F.; Karimi, N.; Maleki, S.; Teixeira, A.L.; Perry, G.; Rezaei, N. Circulating long non-coding RNAs as novel diagnostic biomarkers for Alzheimer’s disease (AD): A systematic review and meta-analysis. PLoS ONE 2023, 18, 1–17. [Google Scholar] [CrossRef] [PubMed]
- Dong, L.X.; Zhang, Y.-Y.; Bao, H.-L.; Liu, Y.; Zhang, G.-W.; An, F.-M. LncRNA NEAT1 promotes Alzheimer’s disease by down regulating micro-27a-3p. Am. J. Transl. Res. 2021, 13, 8885–8896. [Google Scholar] [PubMed]
- Irwin, A.B.; Martina, V.; Jago, S.C.S.; Bahabry, R.; Schreiber, A.M.; Lubin, F.D. The lncRNA Neat1 is associated with astrocyte reactivity and memory deficits in a mouse model of Alzheimer’s disease. Preprint. bioRxiv. 2023. [Google Scholar] [CrossRef]
- Wu, Y.; Li, P.; Liu, L.; Goodwin, A.J.; Halushka, P.V.; Hirose, T.; Nakagawa, S.; Zhou, J.; Liu, M.; Fan, H. lncRNA Neat1 regulates neuronal dysfunction post-sepsis via stabilization of hemoglobin subunit beta. Mol. Ther. 2022, 30, 2618–2632. [Google Scholar] [CrossRef]
- Khodayi, M.; Khalaj-Kondori, M.; Feizi, M.A.H.; Bonyadi, M.J.; Talebi, M. Plasma Lncrna Profiling Identified Bc200 and Neat1 Lncrnas as Potential Blood-Based Biomarkers for Late-Onset Alzheimer’S Disease. EXCLI J. 2022, 21, 772–785. [Google Scholar]
- Breton, A.; Casey, D.; Arnaoutoglou, N.A. Cognitive tests for the detection of mild cognitive impairment (MCI), the prodromal stage of dementia: Meta-analysis of diagnostic accuracy studies. Int. J. Geriatr. Psychiatry. 2019, 34, 233–242. [Google Scholar] [CrossRef]
- Anderson, N.D. State of the science on mild cognitive impairment (MCI). CNS Spectr. 2019, 24, 78–87. [Google Scholar] [CrossRef]
- Jalaiei, A.; Asadi, M.R.; Sabaie, H.; Dehghani, H.; Gharesouran, J.; Hussen, B.M.; Taheri, M.; Ghafouri-Fard, S.; Rezazadeh, M. Long Non-Coding RNAs, Novel Offenders or Guardians in Multiple Sclerosis: A Scoping Review. Front. Immunol. 2021, 12, 774002. [Google Scholar] [CrossRef]
- Wang, L.; Liu, W.; Zhang, Y.; Hu, Z.; Guo, H.; Lv, J.; Du, H. Dexmedetomidine had neuroprotective effects on hippocampal neuronal cells via targeting lncRNA SHNG16 mediated microRNA-10b-5p/BDNF axis. Mol. Cell. Biochem. 2020, 469, 41–51. [Google Scholar] [CrossRef]
- Pang, X.; Su, Z.; Sun, Y.; Zhang, W.; Wang, H. Long noncoding RNA SNHG16 reduced ketamine-induced neurotoxicity in human embryonic stem cell-derived neurons. J. Chem. Neuroanat. 2018, 94, 39–45. [Google Scholar] [CrossRef]
- Teng, H.; Li, M.; Qian, L.; Yang, H.; Pang, M. Long non-coding RNA SNHG16 inhibits the oxygen-glucose deprivation and reoxygenation-induced apoptosis in human brain microvascular endothelial cells by regulating miR-15a-5p/bcl-2. Mol. Med. Rep. 2020, 22, 2685–2694. [Google Scholar] [CrossRef] [PubMed]
- Li, H.; Tang, C.; Wang, D. LncRNA H19 promotes inflammatory response induced by cerebral ischemia-reperfusion injury through regulating miR-138-5p/p65 Running title: H19/miR-138-5p/p65 axis in cerebral ischemia-reperfusion injury. Biochem. Cell Biol. 2020, 98, 525–536. [Google Scholar] [CrossRef] [PubMed]
- Guo, S.; Wang, H.; Yin, Y. Microglia Polarization from M1 to M2 in Neurodegenerative Diseases. Front. Aging Neurosci. 2022, 14, 815347. [Google Scholar] [CrossRef] [PubMed]
- Zhong, L.; Liu, P.; Fan, J.; Luo, Y. Long non-coding RNA H19: Physiological functions and involvements in central nervous system disorders. Neurochem. Int. 2021, 148, 105072. [Google Scholar] [CrossRef]
- Zhang, Y.Y.; Bao, H.-L.; Dong, L.-X.; Liu, Y.; Zhang, G.-W.; An, F.-M. Silenced lncRNA H19 and up-regulated microRNA-129 accelerates viability and restrains apoptosis of PC12 cells induced by Aβ25-35 in a cellular model of Alzheimer’s disease. Cell Cycle 2021, 20, 112–125. [Google Scholar] [CrossRef]
- Pereira, R.L.; Oliveira, D.; Pêgo, A.P.; Santos, S.D.; Moreira, F.T.C. Electrochemical miRNA-34a-based biosensor for the diagnosis of Alzheimer’s disease. Bioelectrochemistry 2023, 154, 108553. [Google Scholar] [CrossRef]
- Dickson, J.R.; Kruse, C.; Montagna, D.R.; Finsen, B.; Wolfe, M.S. Alternative polyadenylation and miR-34 family members regulate tau expression. J. Neurochem. 2013, 127, 739–749. [Google Scholar] [CrossRef]
- Naseer, S.; Abelleira-Hervas, L.; Savani, D.; de Burgh, R.; Aleksynas, R.; Donat, C.K.; Syed, N.; Sastre, M. Traumatic Brain Injury Leads to Alterations in Contusional Cortical miRNAs Involved in Dementia. Biomolecules 2022, 12, 1457. [Google Scholar] [CrossRef]
- Zhao, M.; Zhou, A.; Xu, L.; Zhang, X. The role of TLR4-mediated PTEN/PI3K/AKT/NF-κB signaling pathway in neuroinflammation in hippocampal neurons. Neuroscience 2014, 269, 93–101. [Google Scholar] [CrossRef]
- Matsuda, S.; Nakagawa, Y.; Tsuji, A.; Kitagishi, Y.; Nakanishi, A.; Murai, T. Implications of PI3K/AKT/PTEN Signaling on Superoxide Dismutases Expression and in the Pathogenesis of Alzheimer’s Disease. Diseases 2018, 6, 28. [Google Scholar] [CrossRef]
- Lu, W.; Wen, J.; Chen, Z. Distinct Roles of ROCK1 and ROCK2 on the Cerebral Ischemia Injury and Subsequently Neurodegenerative Changes. Pharmacology 2020, 105, 3–8. [Google Scholar] [CrossRef] [PubMed]
- Moreira, N.C.d.S.; Tamarozzi, E.R.; Lima, J.E.B.d.F.; Piassi, L.d.O.; Carvalho, I.; Passos, G.A.; Sakamoto-Hojo, E.T. Novel Dual AChE and ROCK2 Inhibitor Induces Neurogenesis via PTEN/AKT Pathway in Alzheimer’s Disease Model. Int. J. Mol. Sci. 2022, 23, 14788. [Google Scholar] [CrossRef] [PubMed]
- Liu, R.; Jiang, C.; Li, J.; Li, X.; Zhao, L.; Yun, H.; Xu, W.; Fan, W.; Liu, Q.; Dong, H. Serum-derived exosomes containing NEAT1 promote the occurrence of rheumatoid arthritis through regulation of miR-144-3p/ROCK2 axis. Ther. Adv. Chronic Dis. 2021, 12, 2040622321991705. [Google Scholar] [CrossRef] [PubMed]
- Madsen, L.S.; Parbo, P.; Ismail, R.; Gottrup, H.; Østergaard, L.; Brooks, D.J.; Eskildsen, S.F. Capillary dysfunction correlates with cortical amyloid load in early Alzheimer’s disease. Neurobiol. Aging 2023, 123, 1–9. [Google Scholar] [CrossRef] [PubMed]
- Katsel, P.; Fam, P.; Tan, W.; Khan, S.; Gama-Sosa, M.; De Gasperi, R.; Roussos, P.; Robinson, A.; Cooper, I.; Schnaider-Beeri, M.; et al. Engagement of vascular early response genes typifies mild cognitive impairment. Alzheimer’s Dement. J. Alzheimer’s Assoc. 2022, 18, 1357–1369. [Google Scholar] [CrossRef]
- Cordon, J.; Duggan, M.R.; Gomez, G.T.; Pucha, K.A.; Peng, Z.; Dark, H.E.; Davatzikos, C.; Erus, G.; Lewis, A.; Moghekar, A.; et al. Identification of Clinically Relevant Brain Endothelial Cell Biomarkers in Plasma. Stroke 2023, 54, 2853–2863. [Google Scholar] [CrossRef]


| Clinical Characteristics | Value | MCI Patients | Healthy Controls |
|---|---|---|---|
| Age at our observation (years) | Mean ± STD | 59.07 ± 18.76 | 62.25 ± 11.26 |
| Range | 49–65 | 52–66 | |
| Age at symptom onset (years) | Mean ± STD | 55.17 ± 10.35 | - |
| Range | 54–63 | - | |
| Sex | Male | 4 | 5 |
| Female | 6 | 5 | |
| Mini-Mental State Examination (MMSE) score | - | 22.48 (±2.06) | 28.47 (±1.93) |
| Other cerebrovascular pathology | - | None | None |
| Metabolic/endocrine disease | - | None | None |
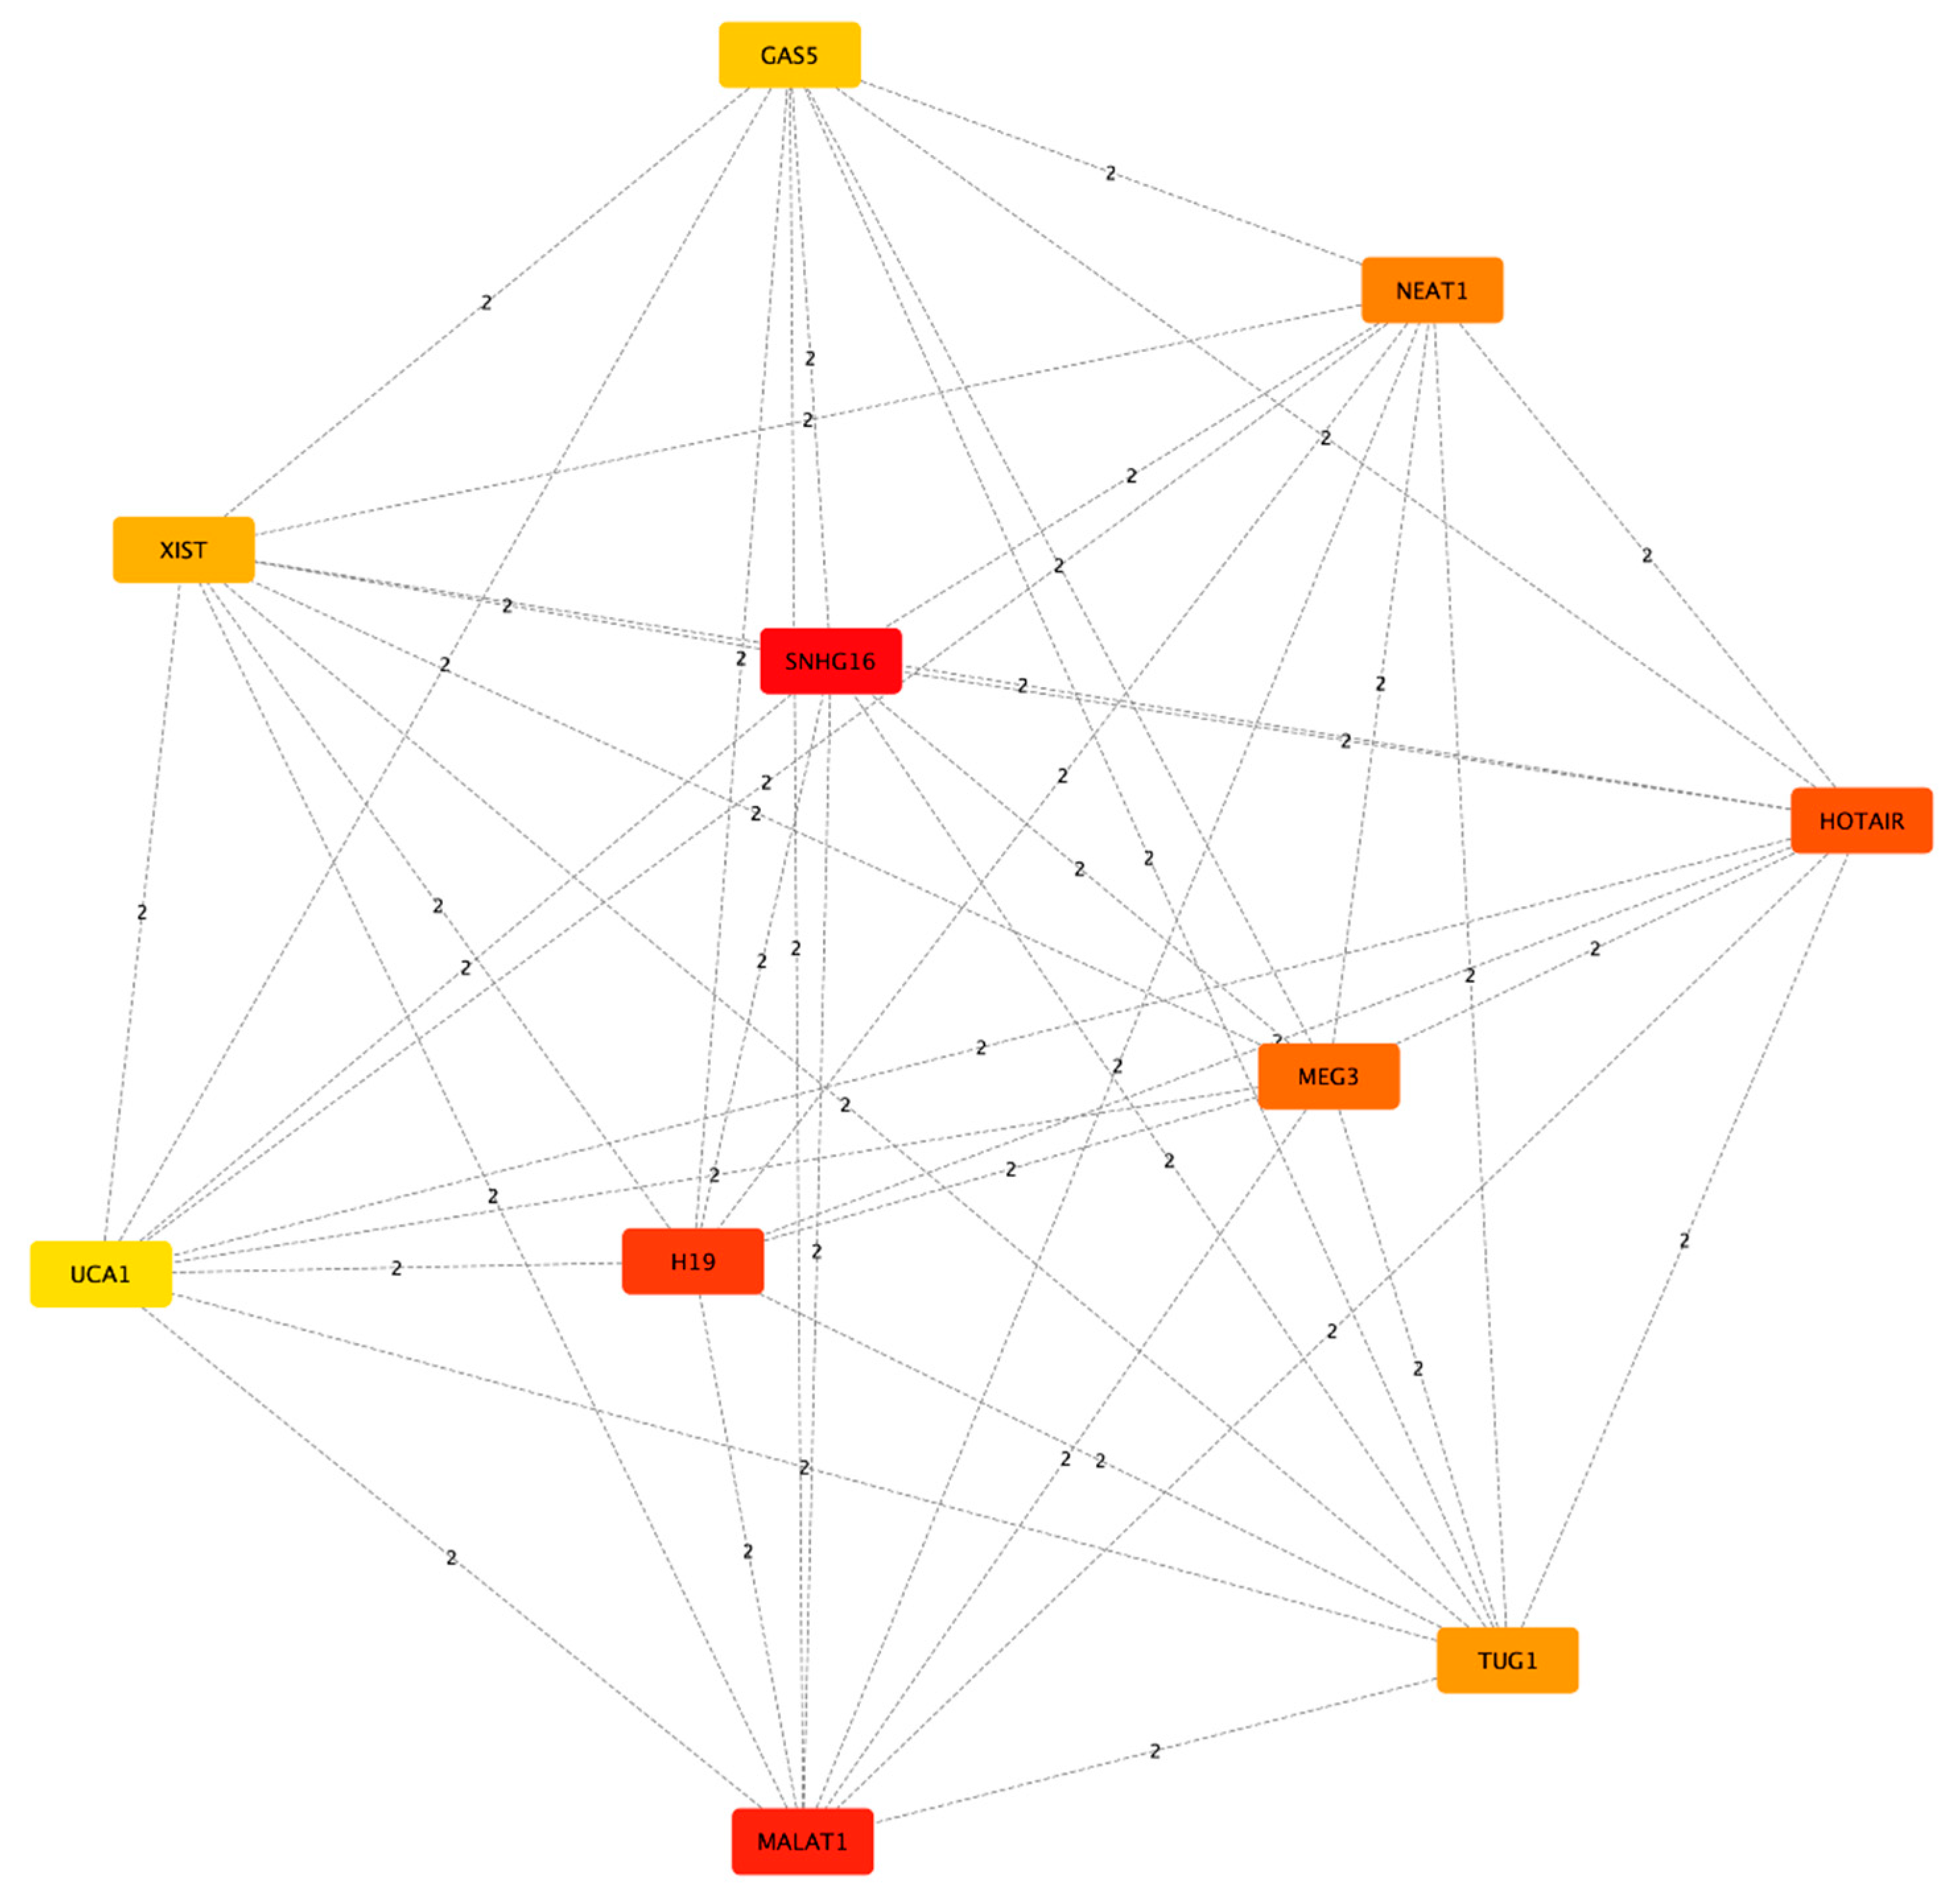
| Rank | Name | Score |
|---|---|---|
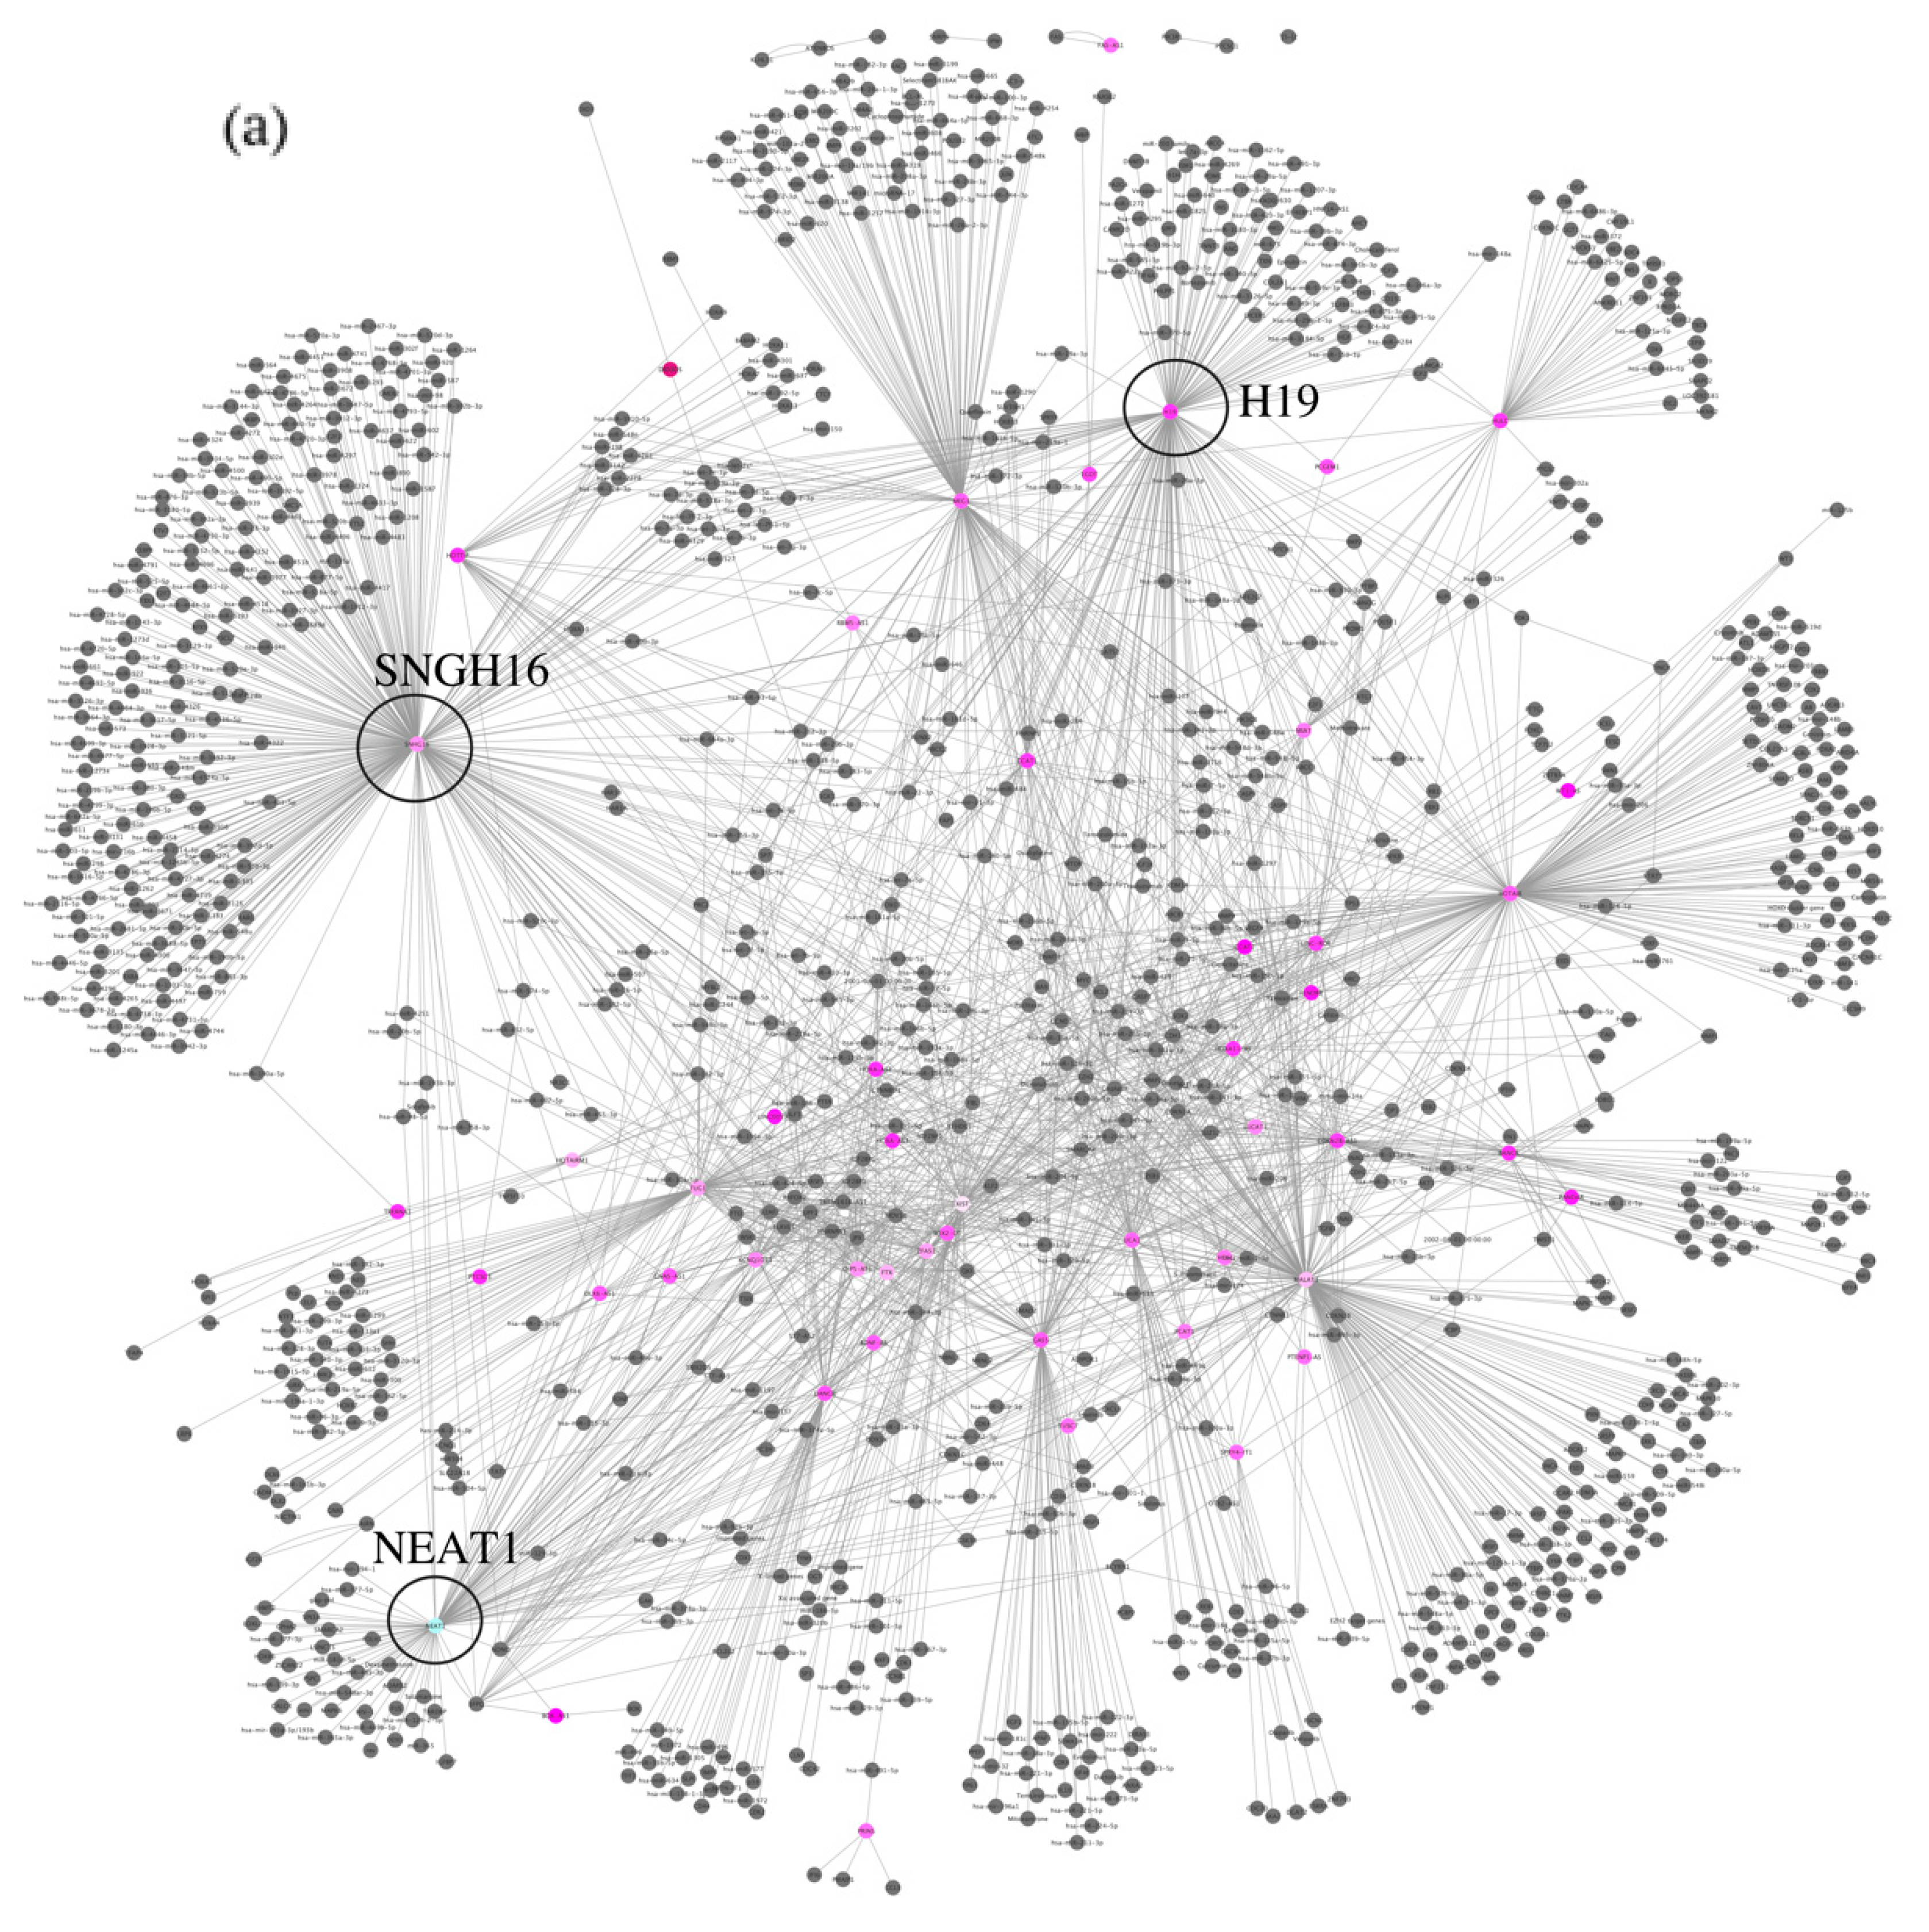
| 1 | SNHG16 | 281.0 |
| 2 | MALAT1 | 202.0 |
| 3 | H19 | 174.0 |
| 4 | HOTAIR | 153.0 |
| 5 | MEG3 | 135.0 |
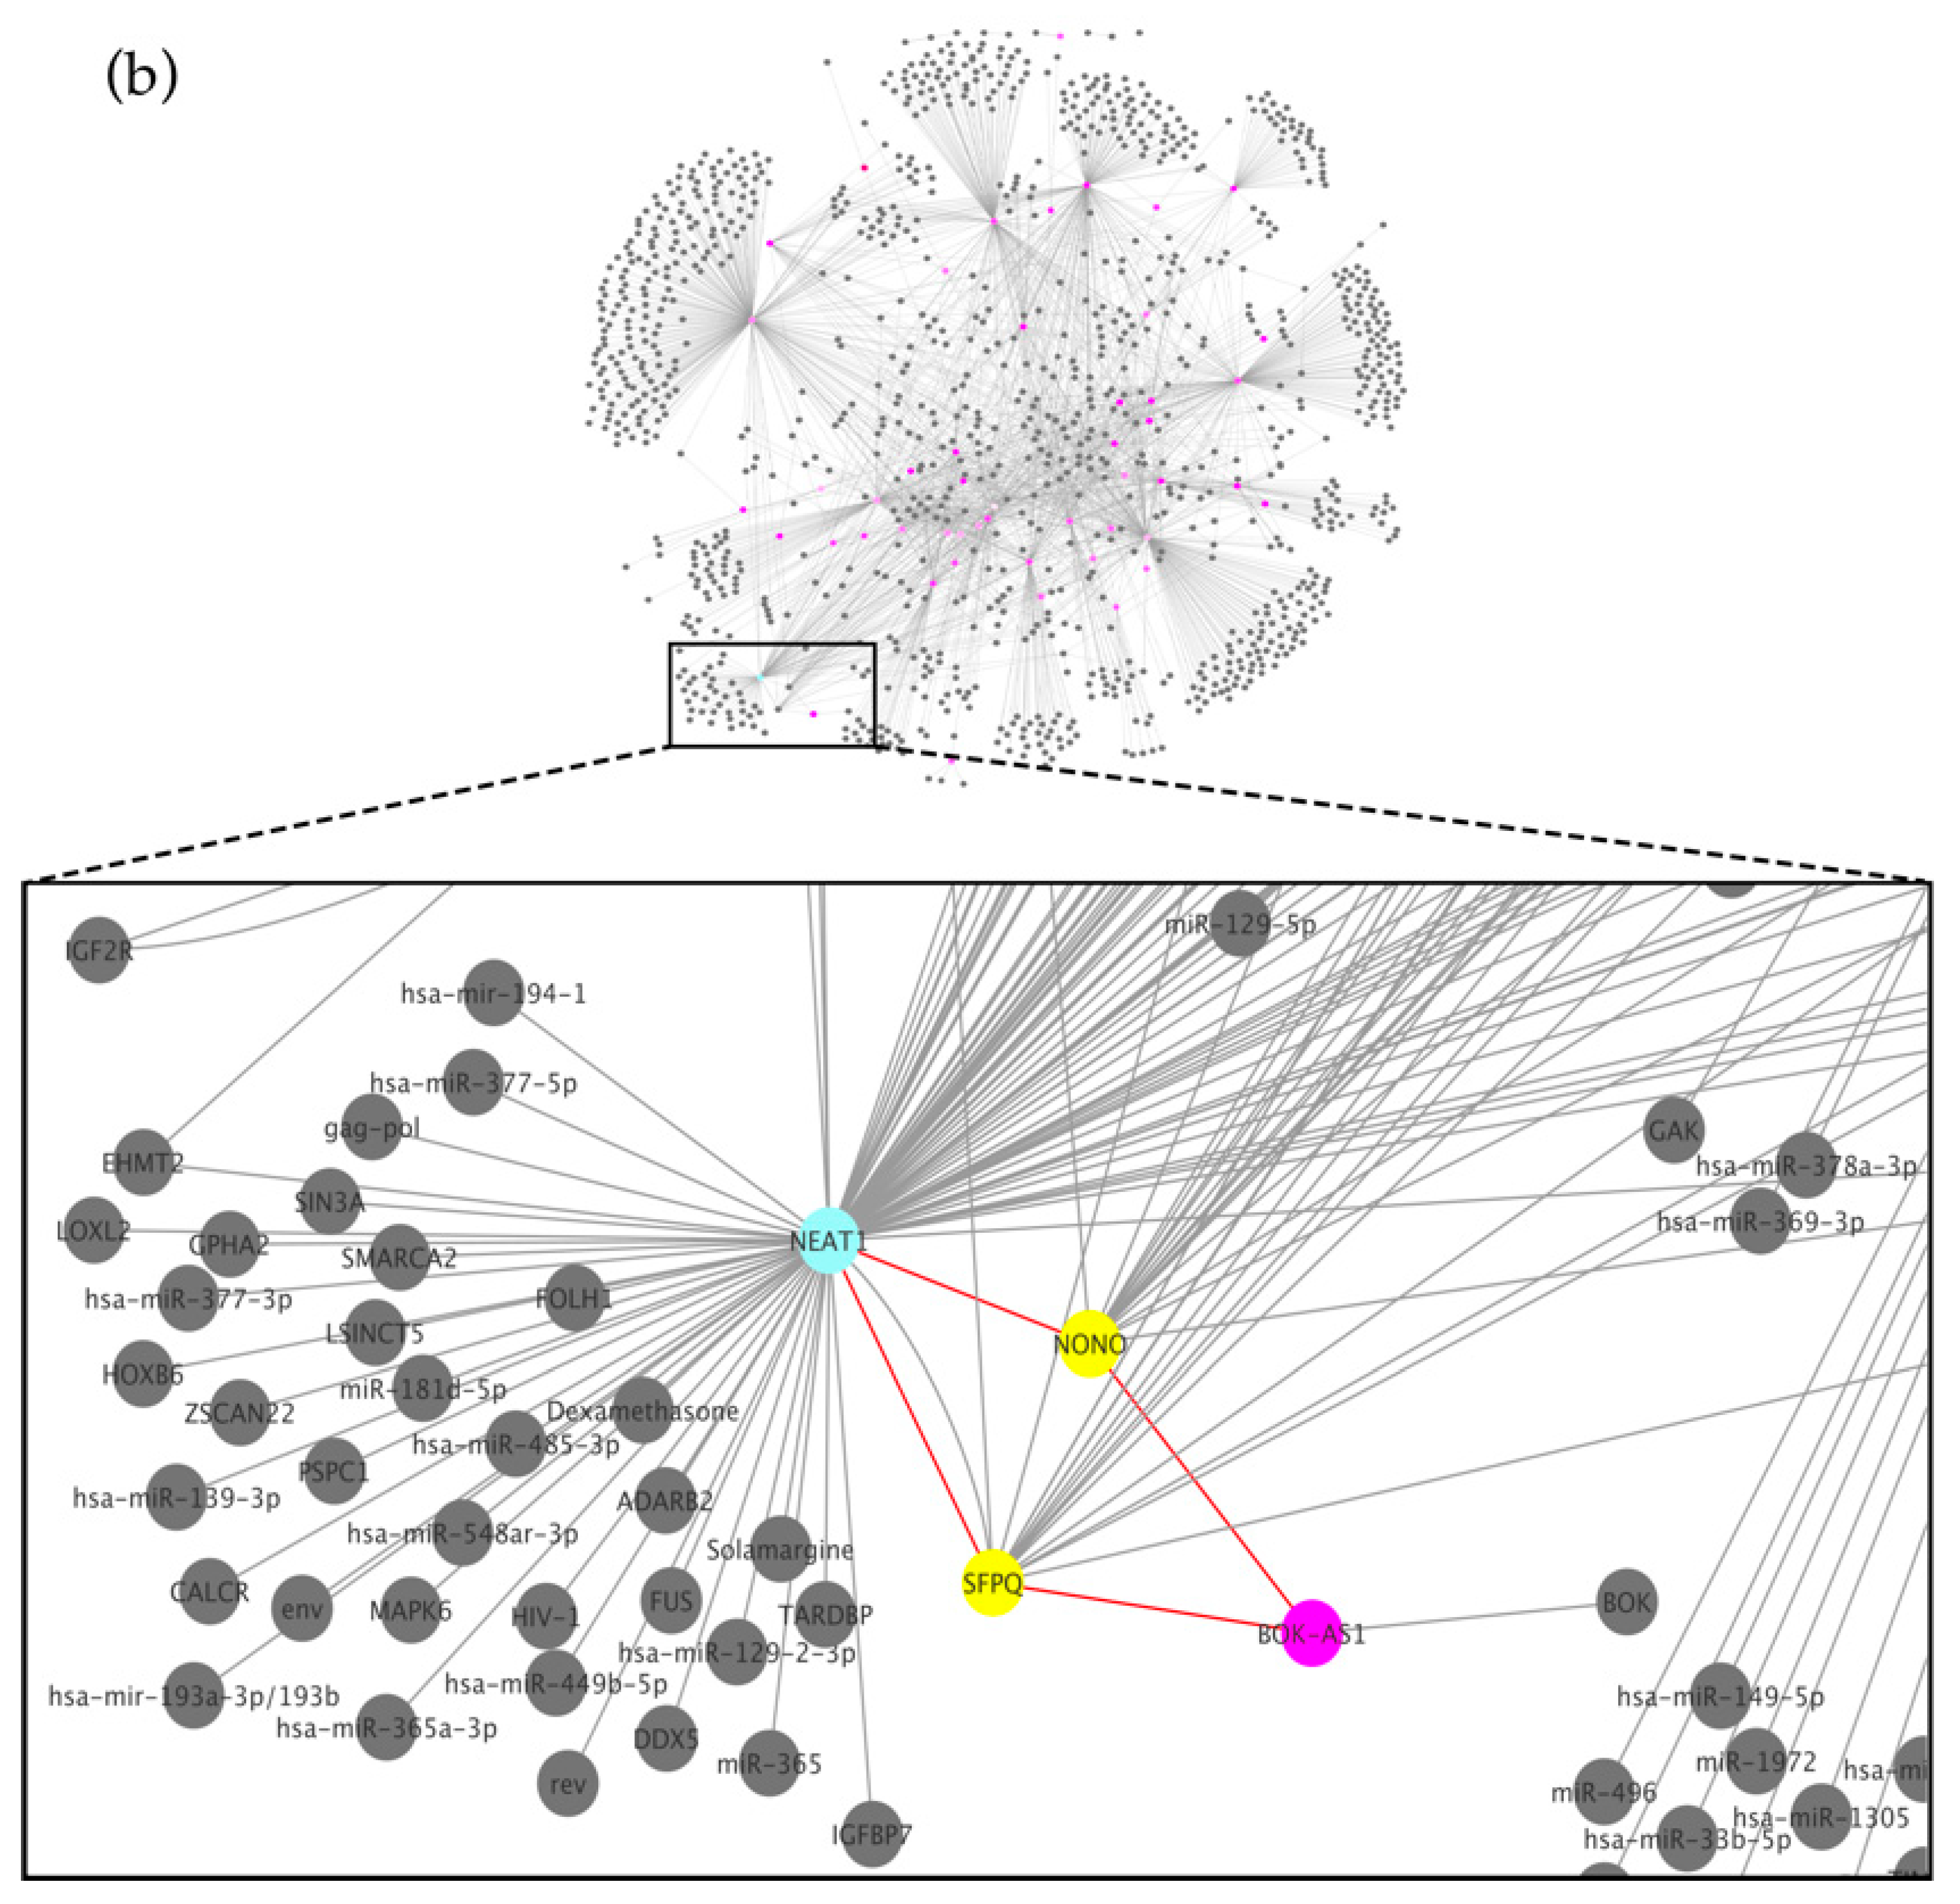
| 6 | NEAT1 | 102.0 |
| 7 | TUG1 | 95.0 |
| 8 | XIST | 84.0 |
| 9 | GAS5 | 78.0 |
| 10 | UCA1 | 63.0 |
| Description | Shared Name |
|---|---|
| post-transcriptional regulation of gene expression | GO:0010608 |
| positive regulation of cell population proliferation | GO:0008284 |
| regulation of epithelial cell proliferation | GO:0050678 |
| epithelial cell proliferation | GO:0050673 |
Disclaimer/Publisher’s Note: The statements, opinions and data contained in all publications are solely those of the individual author(s) and contributor(s) and not of MDPI and/or the editor(s). MDPI and/or the editor(s) disclaim responsibility for any injury to people or property resulting from any ideas, methods, instructions or products referred to in the content. |
© 2023 by the authors. Licensee MDPI, Basel, Switzerland. This article is an open access article distributed under the terms and conditions of the Creative Commons Attribution (CC BY) license (https://creativecommons.org/licenses/by/4.0/).
Share and Cite
De Felice, B.; Coppola, C.; Bonavita, S.; Signoriello, E.; Montanino, C.; Farinella, F. Exploring Circulating Long Non-Coding RNAs in Mild Cognitive Impairment Patients’ Blood. Biomedicines 2023, 11, 2963. https://doi.org/10.3390/biomedicines11112963
De Felice B, Coppola C, Bonavita S, Signoriello E, Montanino C, Farinella F. Exploring Circulating Long Non-Coding RNAs in Mild Cognitive Impairment Patients’ Blood. Biomedicines. 2023; 11(11):2963. https://doi.org/10.3390/biomedicines11112963
Chicago/Turabian StyleDe Felice, Bruna, Cinzia Coppola, Simona Bonavita, Elisabetta Signoriello, Concetta Montanino, and Federica Farinella. 2023. "Exploring Circulating Long Non-Coding RNAs in Mild Cognitive Impairment Patients’ Blood" Biomedicines 11, no. 11: 2963. https://doi.org/10.3390/biomedicines11112963
APA StyleDe Felice, B., Coppola, C., Bonavita, S., Signoriello, E., Montanino, C., & Farinella, F. (2023). Exploring Circulating Long Non-Coding RNAs in Mild Cognitive Impairment Patients’ Blood. Biomedicines, 11(11), 2963. https://doi.org/10.3390/biomedicines11112963