
Predictive Modeling and Integrated Risk Assessment of Postoperative Mortality and Pneumonia in Traumatic Brain Injury Patients through Clustering and Machine Learning: Retrospective Study

 ,
,
Abstract
:1. Introduction
2. Materials and Methods
2.1. Study Design
Ethical Approval/Informed Consent
2.2. Primary Outcomes
2.3. Data Sources and Extraction
2.4. Participants
2.5. Primary Predictors and Other Features
2.6. Data Preprocessing and Machine Learning
2.6.1. Data Preprocessing
2.6.2. Machine Learning
2.6.3. Feature Importance
2.7. Clustering
2.8. Statistics
3. Results
3.1. Prediction of POM and PPN
3.1.1. Performance of POM and PPN Predictions
3.1.2. Feature Importance
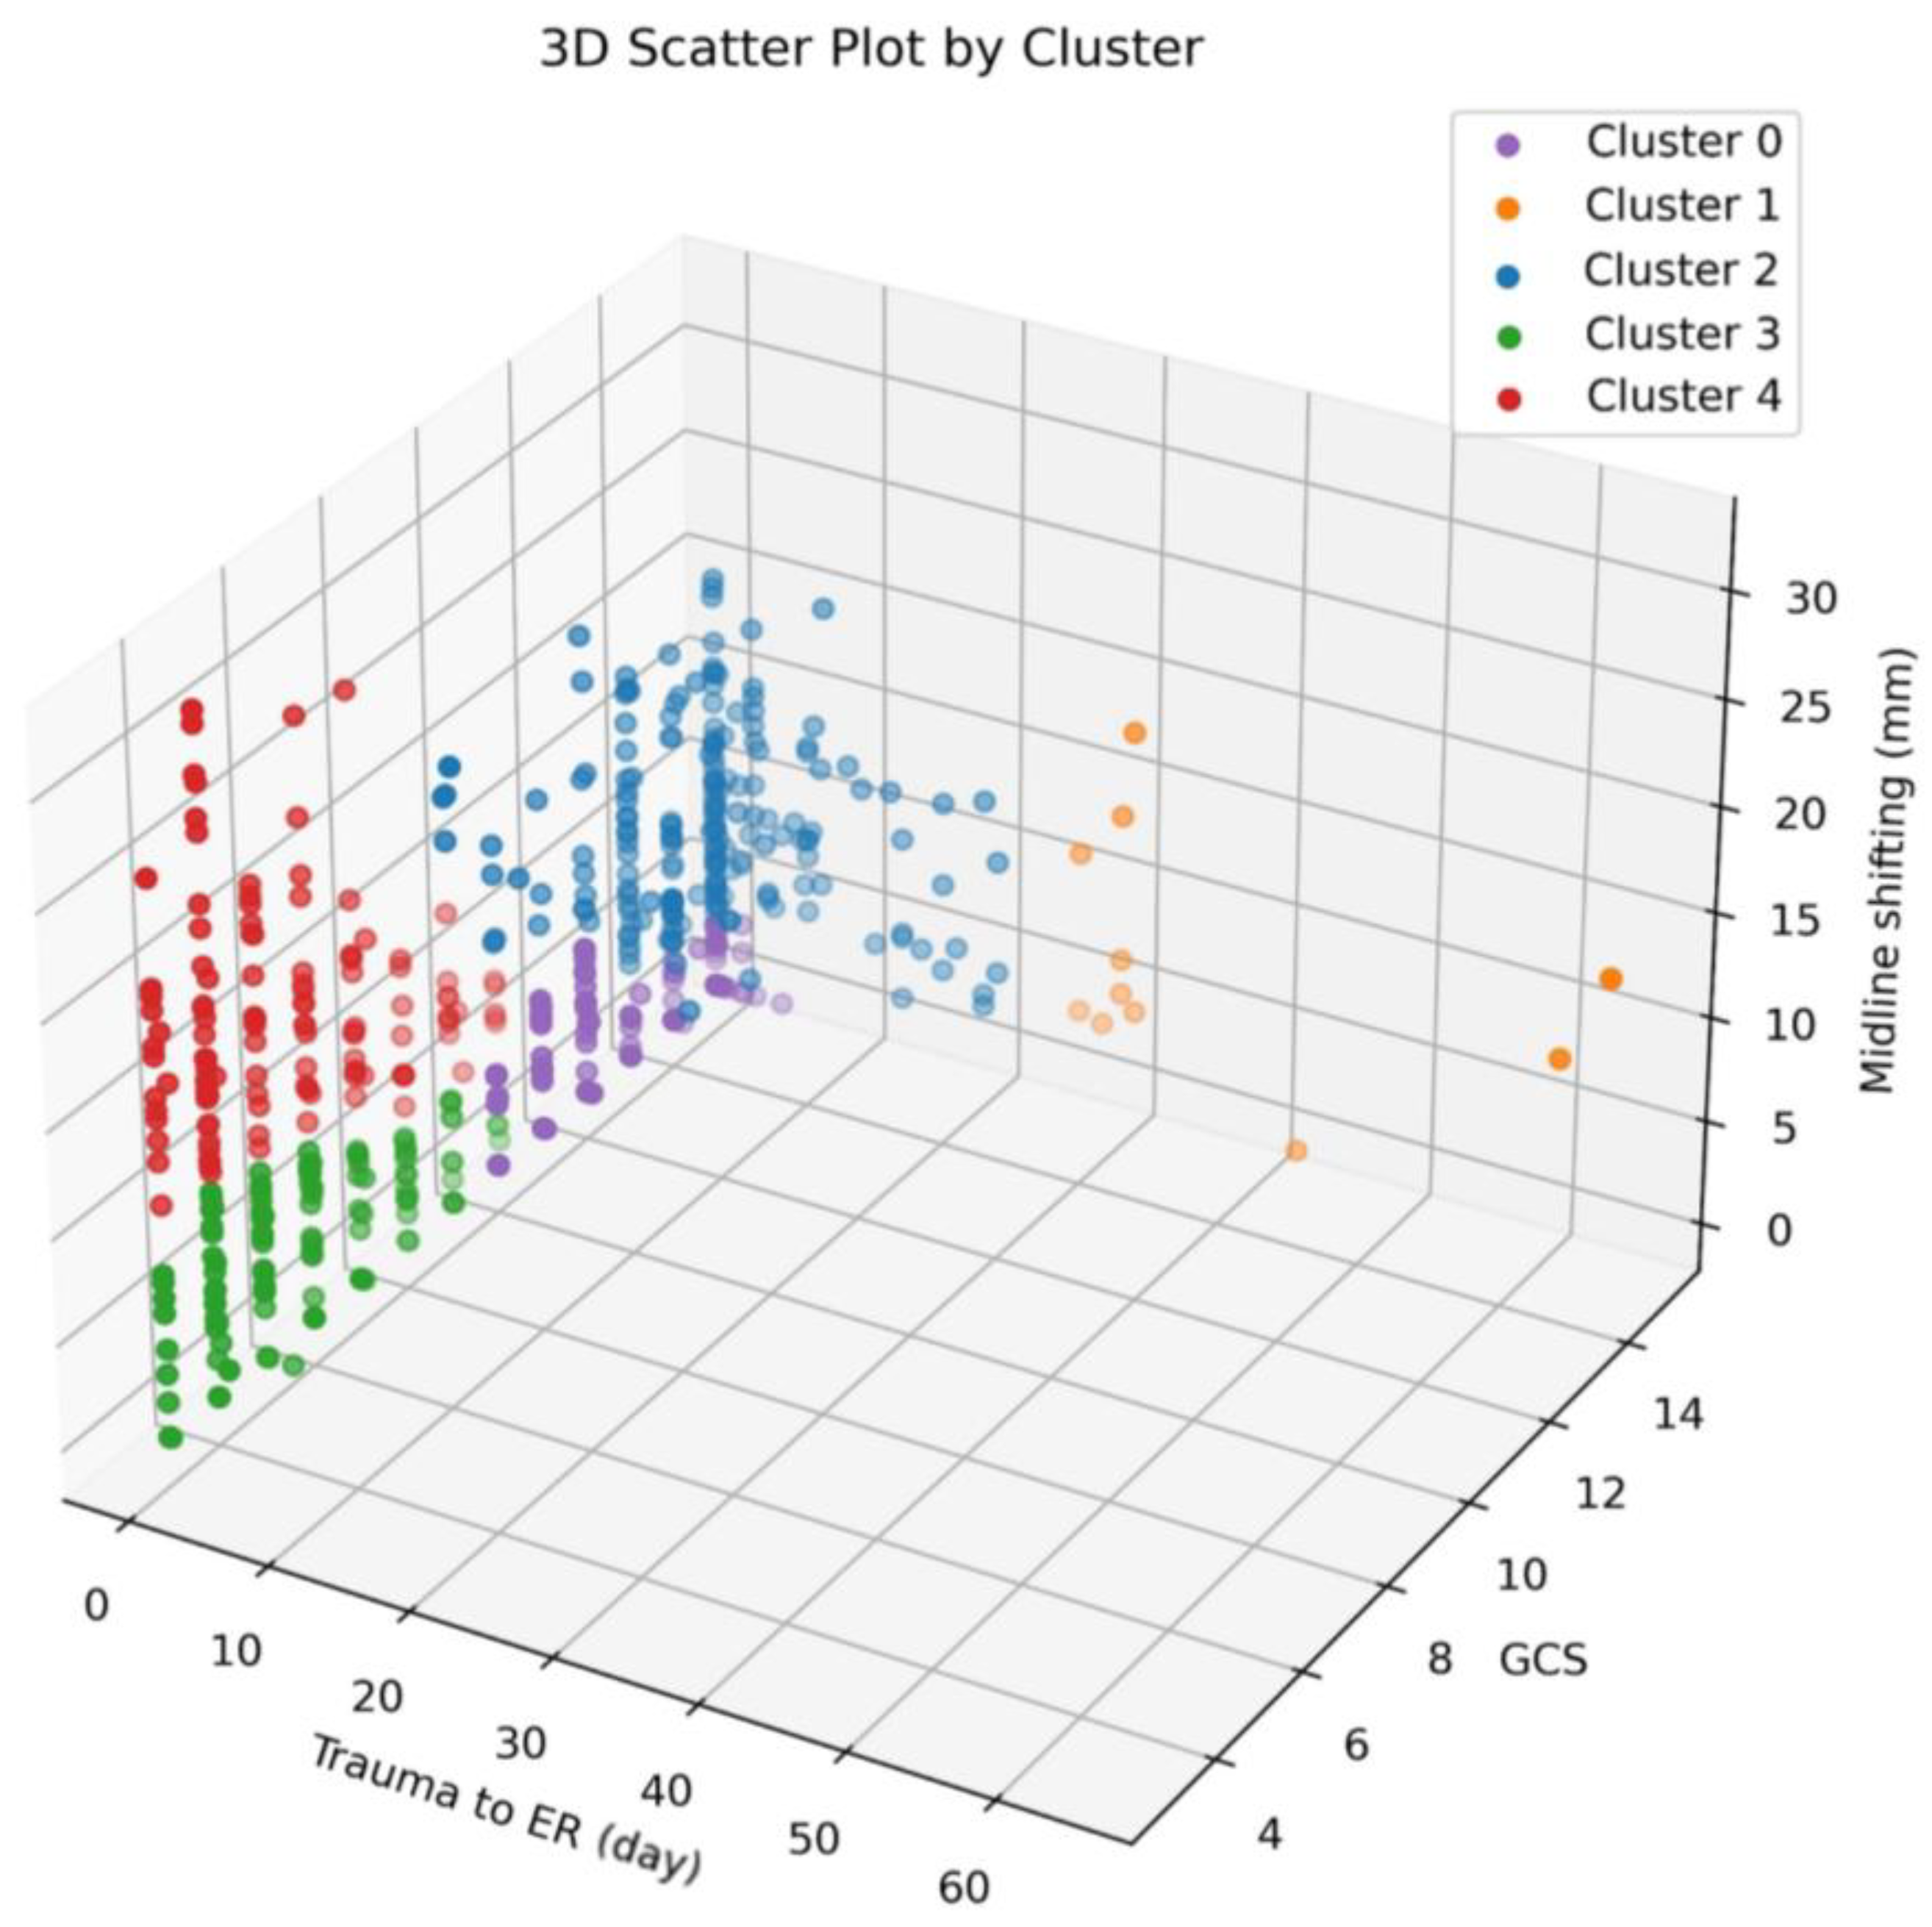
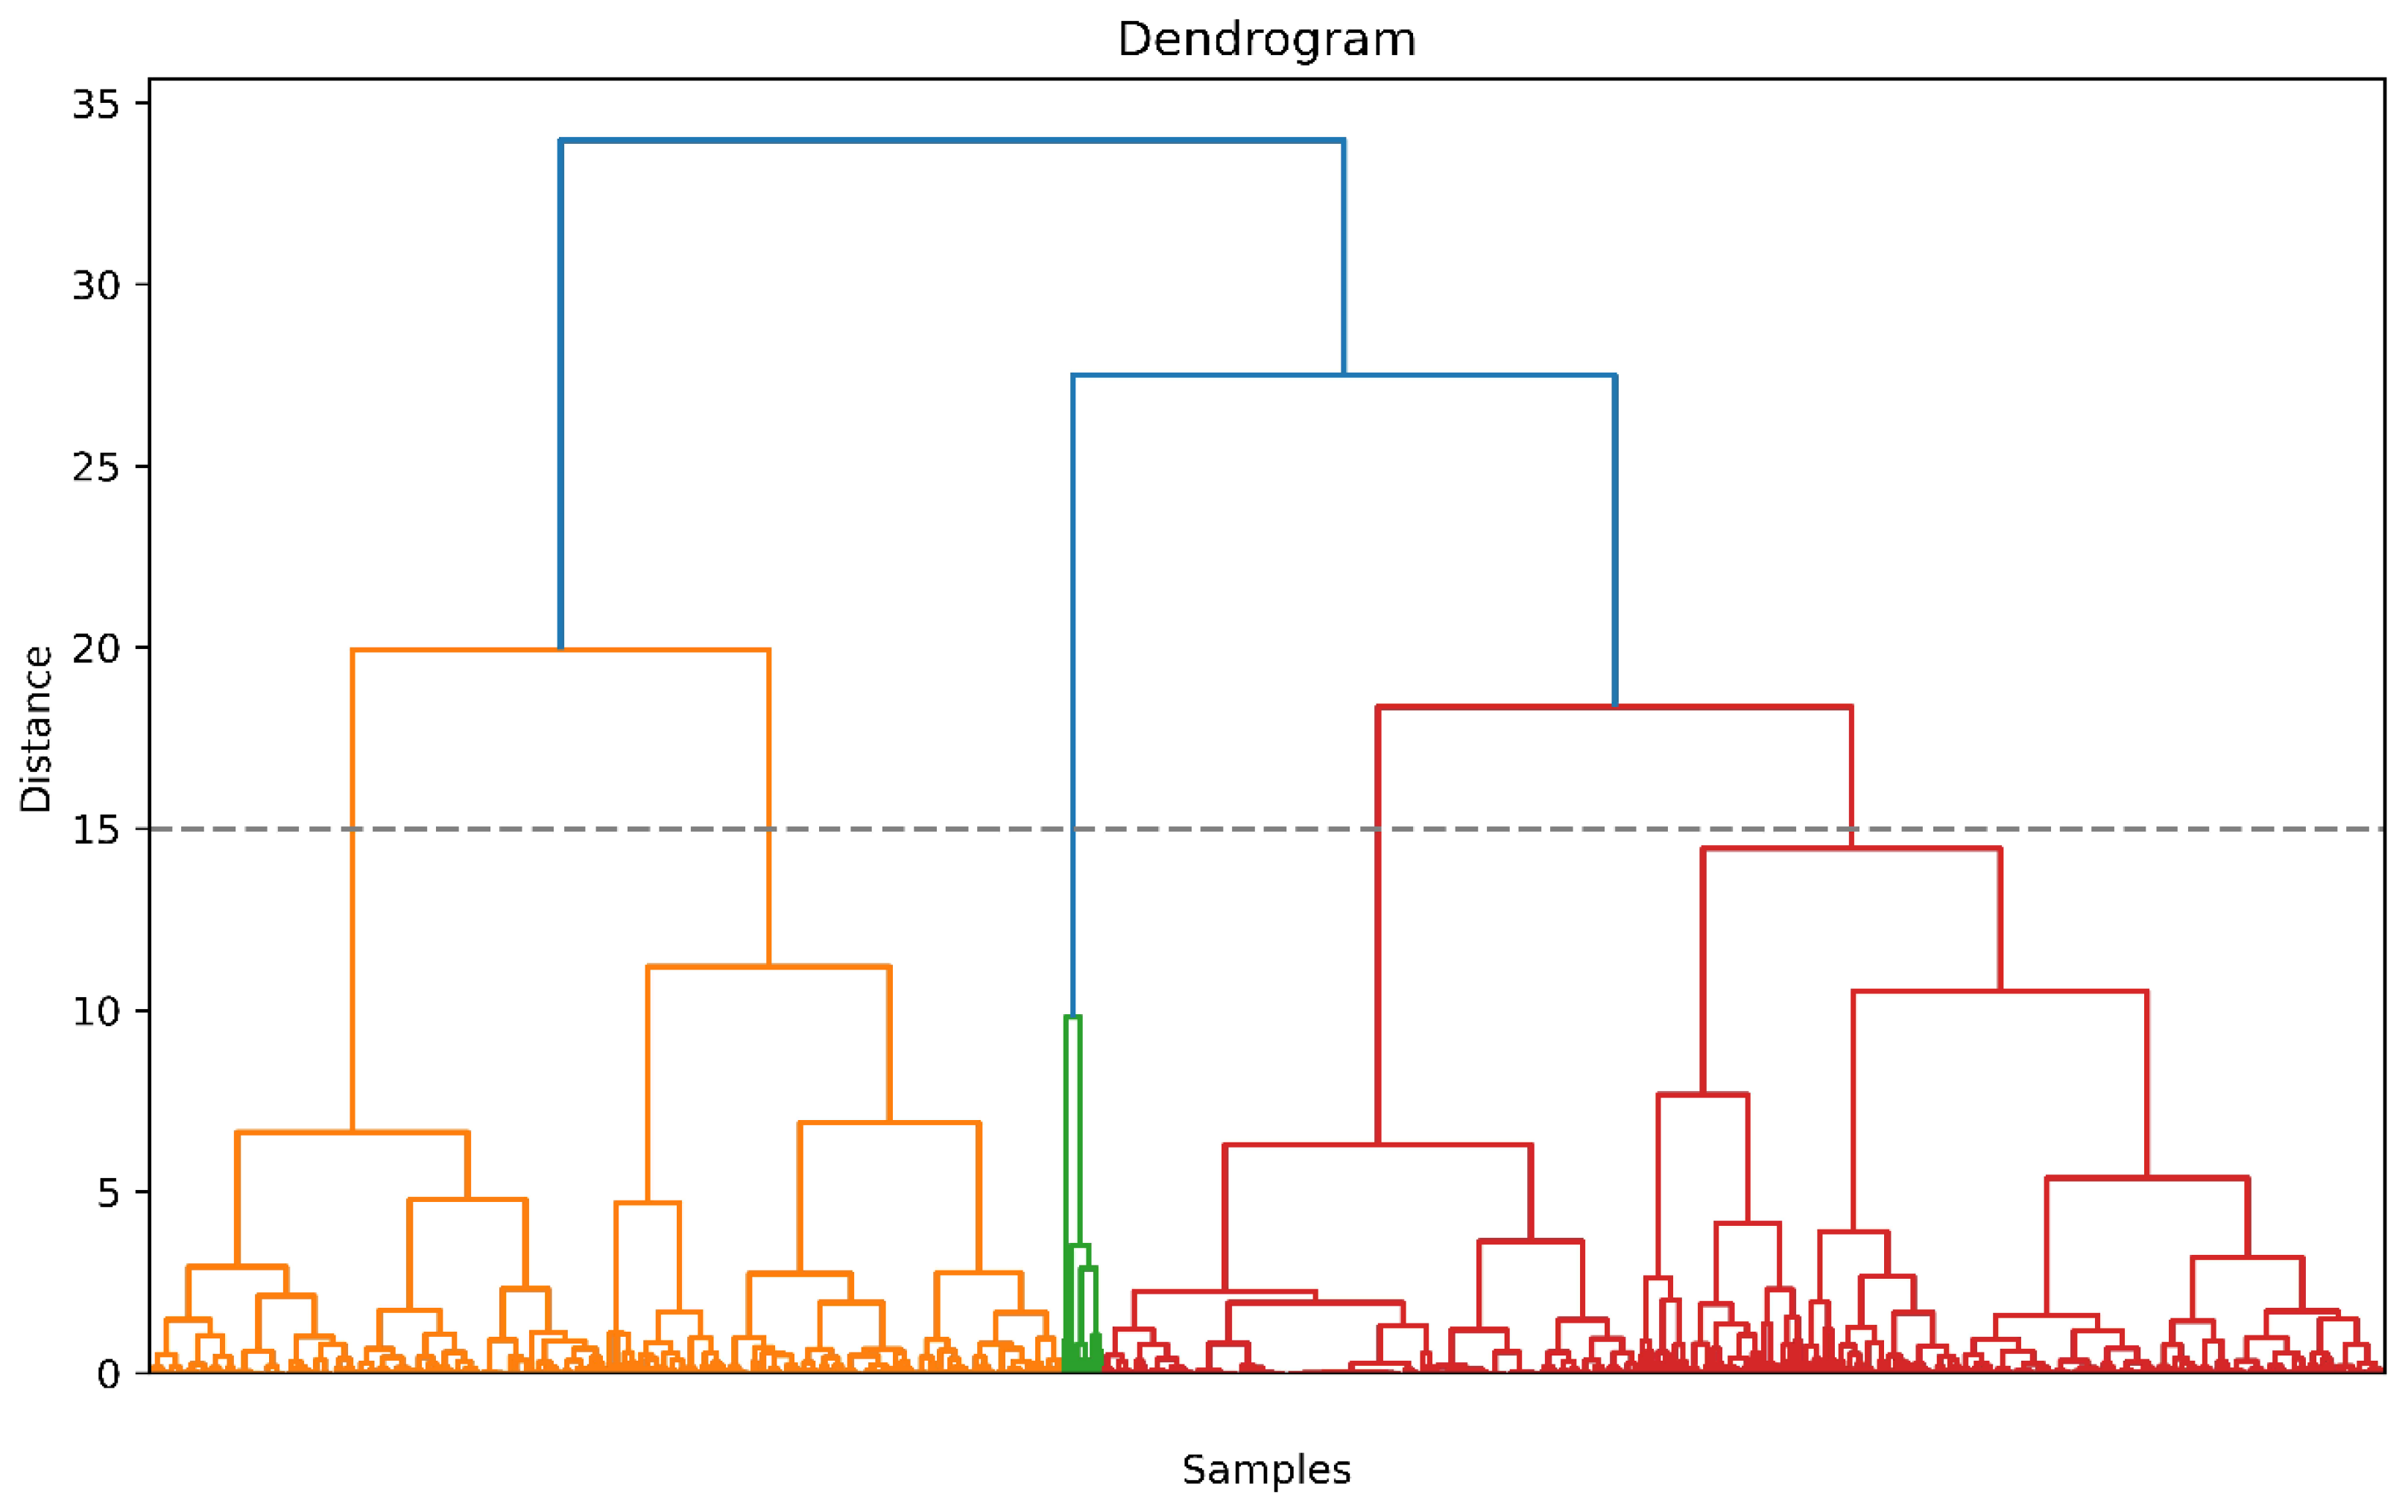
3.2. Clustering
- Cluster 0 predominantly comprises individuals with high GCS scores ranging from 10 to 15, accompanied by low MSB values spanning from 0 to 7.1 and minimal TIE ranging from 0 to 5.
- Cluster 1 is characterized by elevated GCS scores, ranging from 8 to 15, yet exhibits variability in both MSB (ranging from 0 to 18.1) and TIE (ranging from 27 to 64).
- Cluster 2 generally consists of individuals with high GCS scores, ranging from 8 to 15, paired with low TIE values ranging from 0 to 21. However, the MSB values in this cluster vary between 2.0 and 23.3.
- Cluster 3 is distinguished by low GCS scores spanning from 3 to 10, coupled with low MSB values ranging from 0 to 9.7 and minimal TIE ranging from 0 to 5.
- Cluster 4 features individuals with low GCS scores (ranging from 3 to 10), minimal TIE values (ranging from 0 to 1), and notably high MSB values, which fall within the range of 6.5 to 31.9.
3.3. Prediction of POM and PPN with Clustering Feature Added
3.3.1. Performance of POM and PPN Predictions
3.3.2. Feature Importance
3.4. Odds Ratio of Cluster Variable for POM and PPN
4. Discussion
5. Conclusions
Author Contributions
Funding
Institutional Review Board Statement
Informed Consent Statement
Data Availability Statement
Conflicts of Interest
Appendix A

| Word | |
|---|---|
| Slip Down | Slip down |
| Fall Down | Fall down, Falling, Fall off |
| Pedestrian Traffic Accidents | Pedestrian, out car |
| Motorcycle Accidents | Motorcycle |
| Bump | Collision, Crash, Bump |
| Bicycle Accidents | Bicycle, Cycle |
| Car Accidents | In car, Car, Bus, Truck, Driving, Vehicle |
Appendix B
| Postoperative Mortality | Postoperative Pneumonia | |||||||||||
|---|---|---|---|---|---|---|---|---|---|---|---|---|
| LR | RF | LGBM | MLP | SVC | BRF | LR | RF | LGBM | MLP | SVC | BRF | |
| Age | 0 | 0.053 | 0.086 | 0 | 0.113 | 0 | 0.149 | 0.065 | 0.1 | 0 | 0.033 | 0.059 |
| Male | 0 | 0.09 | 0.48 | 0.849 | 0 | 0.376 | 0.258 | 0.175 | 0.012 | 0.39 | 0.138 | 0.139 |
| Duration of surgery | 0.004 | 0.09 | 0.097 | 0 | 0.216 | 0.142 | 0.086 | 0.339 | 0 | 0.112 | 0.047 | 0.26 |
| TIE | 0.068 | 0.182 | 0.126 | 0.143 | 0.162 | 0.272 | 0.049 | 0.165 | 0.086 | 0.103 | 0.077 | 0.19 |
| Cooperative surgery | 0.772 | 1.006 | 0.704 | 0.854 | 0.107 | 0.492 | 0.139 | 0.378 | 0.383 | 0.957 | 0.244 | 0.134 |
| Obesity | 0 | 0 | 0 | 0.014 | 0.131 | 0 | 0.036 | 0.063 | 0 | 0 | 0 | 0.039 |
| Alcohol | 0.014 | 0.084 | 0.19 | 0.086 | 0 | 0.005 | 0 | 0.19 | 0.046 | 0 | 0.008 | 0 |
| Smoking | 0 | 0.056 | 0 | 0 | 0.124 | 0.015 | 0.092 | 0.02 | 0 | 0.017 | 0 | 0.072 |
| Midline shift | 0.131 | 0 | 0.009 | 0.038 | 0 | 0.1 | 0 | 0.026 | 0.069 | 0 | 0.002 | 0 |
| Skull fracture | 0.189 | 0.086 | 0 | 0.147 | 0.155 | 0.118 | 0 | 0.033 | 0 | 0 | 0.045 | 0.086 |
| Intracerebral hemorrhage | 0.061 | 0.086 | 0 | 0.05 | 0.007 | 0.122 | 0 | 0.07 | 0 | 0 | 0.001 | 0.092 |
| Subdural hemorrhage | 0.613 | 0.854 | 0.495 | 0.709 | 0.071 | 0.303 | 0.197 | 0.42 | 0.286 | 0.43 | 0.101 | 0.431 |
| Epidural hemorrhage | 0.201 | 0.209 | 0.072 | 0.034 | 0.163 | 0.203 | 0 | 0 | 0 | 0 | 0.088 | 0.068 |
| Intraventricular hemorrhage | 0 | 0.122 | 0 | 0.025 | 0.01 | 0 | 0.056 | 0.024 | 0.082 | 0 | 0 | 0.018 |
| Subarachnoid hemorrhage | 0 | 0.072 | 0 | 0.014 | 0.018 | 0.005 | 0 | 0.132 | 0.074 | 0.073 | 0.083 | 0 |
| ASA PS | 0.308 | 0.418 | 0.375 | 0.342 | 0.008 | 0.207 | 0.109 | 0.201 | 0.284 | 0.313 | 0.128 | 0.004 |
| Administered blood | 0.137 | 0.241 | 0.067 | 0.11 | 0.516 | 0.455 | 0.108 | 0.275 | 0.172 | 0.033 | 0.178 | 0.432 |
| Administered fluid | 0.064 | 0.201 | 0.031 | 0 | 0.128 | 0.399 | 0.15 | 0.217 | 0.164 | 0.056 | 0.188 | 0.275 |
| Urine output | 0 | 0.077 | 0.092 | 0.03 | 0.222 | 0.227 | 0.094 | 0.183 | 0.004 | 0.035 | 0.093 | 0.191 |
| Estimated blood loss | 0.29 | 0.286 | 0.049 | 0.109 | 0.329 | 0.378 | 0.245 | 0.222 | 0.113 | 0.076 | 0.134 | 0.305 |
| Intraoperative PRCs | 0.131 | 0.296 | 0.1 | 0.216 | 0.304 | 0.566 | 0.109 | 0.356 | 0.12 | 0.023 | 0.133 | 0.462 |
| Intraoperative FFP | 0.35 | 0.406 | 0.207 | 0.16 | 0.116 | 0.292 | 0.111 | 0.261 | 0.11 | 0.116 | 0.299 | 0.395 |
| Intraoperative PC | 0.776 | 0.618 | 0.615 | 0.966 | 0.174 | 0.346 | 0.289 | 0.279 | 0.518 | 0.954 | 0 | 0.312 |
| Blood urea nitrogen | 0 | 0.042 | 0 | 0 | 0 | 0 | 0.016 | 0.03 | 0 | 0 | 0.078 | 0.129 |
| Creatinine | 0 | 0.056 | 0.017 | 0 | 0.034 | 0 | 0 | 0 | 0 | 0.01 | 0.043 | 0 |
| Albumin | 0 | 0 | 0 | 0 | 0 | 0 | 0 | 0.007 | 0 | 0.071 | 0 | 0.141 |
| Sodium | 0.013 | 0.19 | 0 | 0 | 0 | 0.139 | 0.134 | 0 | 0.072 | 0 | 0 | 0 |
| Potassium | 0.053 | 0 | 0.042 | 0.035 | 0.058 | 0.092 | 0 | 0.03 | 0.015 | 0 | 0 | 0.119 |
| GCS score | 0.201 | 0.229 | 0.123 | 0.204 | 0.21 | 0.289 | 0.191 | 0.275 | 0.012 | 0.031 | 0.07 | 0.504 |
| Total duration of ventilator care | 0.227 | 0.452 | 0.297 | 0.178 | 0.297 | 0.486 | 0.593 | 0.645 | 0.55 | 0.323 | 0.421 | 1.021 |
| O2/FiO2 <300 | 0 | 0.019 | 0.07 | 0.052 | 0.108 | 0.125 | 0.061 | 0.107 | 0.054 | 0.048 | 0.121 | 0 |
| Burr hole | 0.125 | 0.08 | 0.067 | 0.019 | 0.256 | 0.182 | 0.102 | 0.215 | 0.031 | 0.021 | 0.038 | 0.087 |
| Craniectomy | 0.577 | 0.713 | 0.235 | 0.144 | 0.325 | 0.464 | 0.121 | 0.407 | 0.076 | 0.277 | 0.04 | 0.215 |
| Craniotomy | 0.048 | 0.228 | 0.073 | 0.063 | 0.209 | 0.177 | 0 | 0.097 | 0.001 | 0.102 | 0.016 | 0 |
| Cranioplasty | 0 | 0 | 0 | 0.02 | 0 | 0.005 | 0.026 | 0 | 0.083 | 0.005 | 0 | 0 |
| Coiling | 0.08 | 0.027 | 0.087 | 0.138 | 0.091 | 0 | 0 | 0 | 0.062 | 0.034 | 0.012 | 0.068 |
Appendix C
| Postoperative Mortality | Postoperative Pneumonia | |||||||||||
|---|---|---|---|---|---|---|---|---|---|---|---|---|
| LR | RF | LGBM | MLP | SVC | BRF | LR | RF | LGBM | MLP | SVC | BRF | |
| Age | 0 | 0 | 0.01 | 0 | 0.055 | 0 | 0.071 | 0.003 | 0 | 0 | 0.014 | 0 |
| Male | 0.23 | 0.298 | 0.508 | 0.573 | 0.259 | 0.21 | 0.122 | 0 | 0.2 | 0.443 | 0.032 | 0.031 |
| Duration of surgery | 0.014 | 0.116 | 0.026 | 0 | 0.295 | 0.226 | 0.076 | 0.165 | 0.071 | 0.101 | 0.069 | 0.4 |
| TIE | 0.116 | 0.147 | 0.058 | 0.087 | 0.054 | 0.229 | 0.085 | 0.262 | 0.129 | 0.109 | 0.058 | 0.191 |
| Cooperative surgery | 0.845 | 0.239 | 0.564 | 0.66 | 0.328 | 0.421 | 0.452 | 0.04 | 1.033 | 0.838 | 0.423 | 0.146 |
| Obesity | 0 | 0 | 0 | 0.003 | 0 | 0.004 | 0.012 | 0 | 0 | 0.075 | 0.014 | 0 |
| Alcohol | 0.155 | 0.013 | 0.056 | 0 | 0.163 | 0.133 | 0.14 | 0.01 | 0.179 | 0.27 | 0 | 0.002 |
| Smoking | 0.036 | 0.004 | 0.025 | 0 | 0 | 0 | 0.063 | 0.022 | 0.004 | 0 | 0 | 0.159 |
| Midline shift | 0.151 | 0.113 | 0 | 0.015 | 0.059 | 0.024 | 0.037 | 0 | 0.164 | 0 | 0 | 0.062 |
| Skull fracture | 0.3 | 0.19 | 0.033 | 0 | 0.213 | 0.226 | 0.176 | 0.051 | 0 | 0 | 0.086 | 0.011 |
| Intracerebral hemorrhage | 0.049 | 0.03 | 0 | 0.07 | 0.083 | 0.047 | 0.024 | 0 | 0 | 0 | 0.064 | 0 |
| Subdural hemorrhage | 1.004 | 0.487 | 0.554 | 0.454 | 0.412 | 0.405 | 0.272 | 0.148 | 0.901 | 0.562 | 0.455 | 0.191 |
| Epidural hemorrhage | 0.034 | 0.16 | 0.231 | 0 | 0.069 | 0.179 | 0.09 | 0.035 | 0 | 0.005 | 0.027 | 0.013 |
| Intraventricular hemorrhage | 0 | 0.009 | 0.031 | 0.048 | 0 | 0.098 | 0.005 | 0 | 0 | 0 | 0.054 | 0 |
| Subarachnoid hemorrhage | 0 | 0.094 | 0 | 0 | 0 | 0.014 | 0 | 0.085 | 0.04 | 0.127 | 0.022 | 0.078 |
| ASA PS | 0.203 | 0.164 | 0.314 | 0.275 | 0.28 | 0.22 | 0.297 | 0.088 | 0.346 | 0.248 | 0.323 | 0.064 |
| Administered blood | 0.13 | 0.337 | 0.14 | 0.09 | 0.344 | 0.408 | 0.264 | 0.283 | 0.185 | 0.017 | 0.103 | 0.295 |
| Administered fluid | 0.094 | 0.137 | 0.07 | 0.119 | 0.144 | 0.32 | 0.219 | 0.171 | 0.08 | 0.082 | 0.209 | 0.276 |
| Urine output | 0.064 | 0.056 | 0 | 0 | 0.16 | 0.1 | 0.074 | 0.161 | 0.053 | 0 | 0.064 | 0.115 |
| Estimated blood loss | 0.127 | 0.221 | 0.082 | 0.135 | 0.279 | 0.467 | 0.147 | 0.155 | 0.138 | 0 | 0.258 | 0.234 |
| Intraoperative PRCs | 0.133 | 0.176 | 0.123 | 0.156 | 0.152 | 0.422 | 0.218 | 0.278 | 0.162 | 0.023 | 0.112 | 0.307 |
| Intraoperative FFP | 0.19 | 0.193 | 0.247 | 0.129 | 0.244 | 0.543 | 0.127 | 0.165 | 0.191 | 0 | 0.355 | 0.087 |
| Intraoperative PC | 0.645 | 0.254 | 0.338 | 0.653 | 0.43 | 0.499 | 0.714 | 0 | 0.925 | 0.86 | 0.336 | 0.203 |
| Blood urea nitrogen | 0 | 0 | 0 | 0 | 0 | 0.07 | 0.136 | 0.021 | 0.018 | 0.012 | 0.076 | 0 |
| Creatinine | 0 | 0.021 | 0 | 0.025 | 0 | 0 | 0 | 0 | 0 | 0 | 0.057 | 0 |
| Albumin | 0 | 0 | 0 | 0.024 | 0 | 0.077 | 0 | 0.146 | 0 | 0 | 0.019 | 0.168 |
| Sodium | 0.02 | 0.044 | 0.139 | 0.079 | 0.014 | 0.004 | 0.129 | 0.006 | 0 | 0.013 | 0 | 0.067 |
| Potassium | 0.095 | 0.015 | 0 | 0.018 | 0.043 | 0.039 | 0 | 0.045 | 0 | 0 | 0 | 0 |
| GCS score | 0.19 | 0.261 | 0.109 | 0.173 | 0.273 | 0.315 | 0.192 | 0.206 | 0.07 | 0.013 | 0.18 | 0.172 |
| Total duration of ventilator care | 0.226 | 0.39 | 0.255 | 0.162 | 0.352 | 0.582 | 0.63 | 0.737 | 0.442 | 0.289 | 0.46 | 0.733 |
| O2/FiO2 <300 | 0.16 | 0.052 | 0 | 0 | 0.036 | 0.027 | 0 | 0.05 | 0.397 | 0.121 | 0.065 | 0.114 |
| Burr hole | 0.098 | 0.148 | 0.013 | 0.055 | 0.23 | 0.227 | 0.129 | 0.162 | 0.035 | 0 | 0.067 | 0.161 |
| Craniectomy | 0.646 | 0.798 | 0.235 | 0.085 | 0.291 | 0.303 | 0.38 | 0.138 | 0.202 | 0.414 | 0.259 | 0.134 |
| Craniotomy | 0.034 | 0.206 | 0.259 | 0.053 | 0.172 | 0.266 | 0.09 | 0.025 | 0 | 0 | 0.083 | 0.017 |
| Cranioplasty | 0.063 | 0.007 | 0.091 | 0 | 0 | 0.024 | 0.064 | 0 | 0.048 | 0 | 0 | 0.072 |
| Coiling | 0.028 | 0 | 0 | 0 | 0.017 | 0.043 | 0.004 | 0.03 | 0 | 0.001 | 0.029 | 0 |
| 0.216 | 0.156 | 0.013 | 0.276 | 0.336 | 0.17 | 0 | 0.1 | 0.004 | 0.017 | 0.032 | 0.149 | |
References
- Demlie, T.A.; Alemu, M.T.; Messelu, M.A.; Wagnew, F.; Mekonen, E.G. Incidence and predictors of mortality among traumatic brain injury patients admitted to Amhara region Comprehensive Specialized Hospitals, northwest Ethiopia, 2022. BMC Emerg. Med. 2023, 23, 55. [Google Scholar] [CrossRef] [PubMed]
- James, S.L.; Theadom, A.; Ellenbogen, R.G.; Bannick, M.S.; Montjoy-Venning, W.; Lucchesi, L.R.; Abbasi, N.; Abdulkader, R.; Abraha, H.N.; Adsuar, J.C. Global, regional, and national burden of traumatic brain injury and spinal cord injury, 1990–2016: A systematic analysis for the Global Burden of Disease Study 2016. Lancet Neurol. 2019, 18, 56–87. [Google Scholar] [CrossRef] [PubMed]
- Kamal, V.K.; Agrawal, D.; Pandey, R.M. Epidemiology, clinical characteristics and outcomes of traumatic brain injury: Evidences from integrated level 1 trauma center in India. J. Neurosci. Rural. Pract. 2016, 7, 515–525. [Google Scholar] [CrossRef] [PubMed]
- Cryan, J.F.; Dinan, T.G. Mind-altering microorganisms: The impact of the gut microbiota on brain and behaviour. Nat. Rev. Neurosci. 2012, 13, 701–712. [Google Scholar] [CrossRef]
- Needham, B.D.; Kaddurah-Daouk, R.; Mazmanian, S.K. Gut microbial molecules in behavioural and neurodegenerative conditions. Nat. Rev. Neurosci. 2020, 21, 717–731. [Google Scholar] [CrossRef]
- Bajinka, O.; Simbilyabo, L.; Tan, Y.; Jabang, J.; Saleem, S.A. Lung-brain axis. Crit. Rev. Microbiol. 2022, 48, 257–269. [Google Scholar] [CrossRef]
- Li, C.; Chen, W.; Lin, F.; Li, W.; Wang, P.; Liao, G.; Zhang, L. Functional Two-Way Crosstalk Between Brain and Lung: The Brain–Lung Axis. Cell. Mol. Neurobiol. 2022, 43, 991–1003. [Google Scholar] [CrossRef]
- Ziaka, M.; Exadaktylos, A. Brain–lung interactions and mechanical ventilation in patients with isolated brain injury. Crit. Care 2021, 25, 358. [Google Scholar] [CrossRef]
- Mascia, L.; Zavala, E.; Bosma, K.; Pasero, D.; Decaroli, D.; Andrews, P.; Isnardi, D.; Davi, A.; Arguis, M.J.; Berardino, M. High tidal volume is associated with the development of acute lung injury after severe brain injury: An international observational study. Crit. Care Med. 2007, 35, 1815–1820. [Google Scholar] [CrossRef]
- Zafrullah Arifin, M.; Gunawan, W. Analysis of presurgery time as a prognostic factor in traumatic acute subdural hematoma. J. Neurosurg. Sci. 2013, 57, 277–280. [Google Scholar]
- Alagoz, F.; Yildirim, A.; Sahinoglu, M.; Korkmaz, M.; Secer, M.; Celik, H.; Yel, C.; Guvenc, Y.; Uckun, O.; Narin, F. Traumatic acute subdural hematomas: Analysis of outcomes and predictive factors at a single center. Turk. Neurosurg. 2017, 27, 187–191. [Google Scholar] [CrossRef] [PubMed]
- Xue, L.Y.; Gaowa, S.; Wang, W.; Zhao, F.; Zhu, H.C.; Yu, X.Y.; Gong, Y. Ventilator-associated pneumonia in patients with cerebral hemorrhage: Impact on mortality and microbiological characterization. Med. Clínica 2020, 154, 400–405. [Google Scholar] [CrossRef] [PubMed]
- Lee, K.; Rincon, F. Pulmonary Complications in Patients with Severe Brain Injury. Crit. Care Res. Pract. 2012, 2012, 207247. [Google Scholar] [CrossRef] [PubMed]
- Kazaure, H.S.; Martin, M.; Yoon, J.K.; Wren, S.M. Long-term results of a postoperative pneumonia prevention program for the inpatient surgical ward. JAMA Surg. 2014, 149, 914–918. [Google Scholar] [CrossRef]
- Chastre, J.; Fagon, J.-Y. Ventilator-associated pneumonia. Am. J. Respir. Crit. Care Med. 2002, 165, 867–903. [Google Scholar] [CrossRef]
- Rello, J.; Ollendorf, D.A.; Oster, G.; Vera-Llonch, M.; Bellm, L.; Redman, R.; Kollef, M.H. Epidemiology and outcomes of ventilator-associated pneumonia in a large US database. Chest 2002, 122, 2115–2121. [Google Scholar] [CrossRef]
- Warren, D.K.; Shukla, S.J.; Olsen, M.A.; Kollef, M.H.; Hollenbeak, C.S.; Cox, M.J.; Cohen, M.M.; Fraser, V.J. Outcome and attributable cost of ventilator-associated pneumonia among intensive care unit patients in a suburban medical center. Crit. Care Med. 2003, 31, 1312–1317. [Google Scholar] [CrossRef]
- Javaid, M.; Haleem, A.; Pratap Singh, R.; Suman, R.; Rab, S. Significance of machine learning in healthcare: Features, pillars and applications. Int. J. Intell. Netw. 2022, 3, 58–73. [Google Scholar] [CrossRef]
- Kim, J.H.; Kim, Y.; Yoo, K.; Kim, M.; Kang, S.S.; Kwon, Y.-S.; Lee, J.J. Prediction of Postoperative Pulmonary Edema Risk Using Machine Learning. J. Clin. Med. 2023, 12, 1804. [Google Scholar] [CrossRef]
- Peng, X.; Zhu, T.; Chen, G.; Wang, Y.; Hao, X. A multicenter prospective study on postoperative pulmonary complications prediction in geriatric patients with deep neural network model. Front. Surg. 2022, 9, 976536. [Google Scholar] [CrossRef]
- Xue, B.; Li, D.; Lu, C.; King, C.R.; Wildes, T.; Avidan, M.S.; Kannampallil, T.; Abraham, J. Use of machine learning to develop and evaluate models using preoperative and intraoperative data to identify risks of postoperative complications. JAMA Netw. Open 2021, 4, e212240. [Google Scholar] [CrossRef]
- Xue, Q.; Wen, D.; Ji, M.-H.; Tong, J.; Yang, J.-J.; Zhou, C.-M. Developing machine learning algorithms to predict pulmonary complications after emergency gastrointestinal surgery. Front. Med. 2021, 8, 655686. [Google Scholar] [CrossRef] [PubMed]
- Baek, M.S.; Kim, J.H.; Kwon, Y.S. Cluster analysis integrating age and body temperature for mortality in patients with sepsis: A multicenter retrospective study. Sci. Rep. 2022, 12, 1090. [Google Scholar] [CrossRef] [PubMed]
- Madhulatha, T.S. An overview on clustering methods. arXiv 2012, arXiv:1205.1117. [Google Scholar] [CrossRef]
- Kim, J.H.; Kim, N.; Lee, S.K.; Kwon, Y.S. Effect of Pregnancy on Postoperative Nausea and Vomiting in Female Patients Who Underwent Nondelivery Surgery: Multicenter Retrospective Cohort Study. Int. J. Environ. Res. Public. Health 2022, 19, 5132. [Google Scholar] [CrossRef]
- Kim, J.H.; Lim, M.S.; Choi, J.W.; Kim, H.; Kwon, Y.S.; Lee, J.J. Comparison of the Effects of Sugammadex, Neostigmine, and Pyridostigmine on Postoperative Nausea and Vomiting: A Propensity Matched Study of Five Hospitals. J. Clin. Med. 2020, 9, 3477. [Google Scholar] [CrossRef]
- Kim, J.H.; Lim, M.S.; Lee, S.H.; Kwon, Y.S.; Lee, J.J.; Sohn, J.H. Consideration of Migraines Among Risk Factors for Postoperative Nausea and Vomiting. J. Clin. Med. 2020, 9, 3154. [Google Scholar] [CrossRef] [PubMed]
- Kwon, Y.S.; Baek, M.S. Development and Validation of a Quick Sepsis-Related Organ Failure Assessment-Based Machine-Learning Model for Mortality Prediction in Patients with Suspected Infection in the Emergency Department. J. Clin. Med. 2020, 9, 875. [Google Scholar] [CrossRef]
- Kwon, Y.S.; Choi, J.W.; Lee, H.S.; Kim, J.H.; Kim, Y.; Lee, J.J. Effect of a Preoperative Proton Pump Inhibitor and Gastroesophageal Reflux Disease on Postoperative Nausea and Vomiting. J. Clin. Med. 2020, 9, 825. [Google Scholar] [CrossRef]
- Kwon, Y.S.; Kim, J.H.; Hwang, S.M.; Choi, J.W.; Kang, S.S. Comparison of the Effect of Sugammadex and Pyridostigmine on Postoperative Catheter-Related Bladder Discomfort: A Retrospective Matched Cohort Analysis. Medicina 2022, 58, 590. [Google Scholar] [CrossRef]
- sklearn.preprocessing.StandardScaler. Available online: https://scikit-learn.org/stable/modules/generated/sklearn.preprocessing.StandardScaler.html (accessed on 30 January 2023).
- Tyagi, S.; Mittal, S. Sampling approaches for imbalanced data classification problem in machine learning. In Proceedings of the ICRIC 2019: Recent Innovations in Computing, Jammu-Kashmir, India, 8–9 March 2019; Springer: Cham, Switzerland, 2020; pp. 209–221. [Google Scholar]
- Chawla, N.V.; Bowyer, K.W.; Hall, L.O.; Kegelmeyer, W.P. SMOTE: Synthetic minority over-sampling technique. J. Artif. Intell. Res. 2002, 16, 321–357. [Google Scholar] [CrossRef]
- LightGBM. Available online: https://lightgbm.readthedocs.io/en/v3.3.2/ (accessed on 30 January 2023).
- sklearn.neural_network.MLPClassifier. Available online: https://scikit-learn.org/stable/modules/generated/sklearn.neural_network.MLPClassifier.html (accessed on 30 January 2023).
- sklearn.linear_model.LogisticRegression. Available online: https://scikit-learn.org/stable/modules/generated/sklearn.linear_model.LogisticRegression.html (accessed on 30 January 2023).
- Breiman, L. Random forests. Mach. Learn. 2001, 45, 5–32. [Google Scholar] [CrossRef]
- Evgeniou, T.; Pontil, M. Support vector machines: Theory and applications. In Advanced Course on Artificial Intelligence; Springer: Berlin/Heidelberg, Germany, 1999; pp. 249–257. [Google Scholar]
- BalancedRandomForestClassifier. Available online: https://imbalanced-learn.org/stable/references/generated/imblearn.ensemble.BalancedRandomForestClassifier.html (accessed on 30 January 2023).
- Fang, L.; Zhao, H.; Wang, P.; Yu, M.; Yan, J.; Cheng, W.; Chen, P. Feature selection method based on mutual information and class separability for dimension reduction in multidimensional time series for clinical data. Biomed. Signal Process. Control 2015, 21, 82–89. [Google Scholar] [CrossRef]
- Liang, J.; Hou, L.; Luan, Z.; Huang, W. Feature Selection with Conditional Mutual Information Considering Feature Interaction. Symmetry 2019, 11, 858. [Google Scholar] [CrossRef]
- Zhao, F.; Zhao, J.; Niu, X.; Luo, S.; Xin, Y. A Filter Feature Selection Algorithm Based on Mutual Information for Intrusion Detection. Appl. Sci. 2018, 8, 1535. [Google Scholar] [CrossRef]
- Gajowniczek, K.; Wu, J.; Gupta, S.; Bajaj, C. HOFS: Higher order mutual information approximation for feature selection in R. SoftwareX 2022, 19, 101148. [Google Scholar] [CrossRef]
- Sasirekha, K.; Baby, P. Agglomerative hierarchical clustering algorithm—A review. Int. J. Sci. Res. Publ. 2013, 83, 83. [Google Scholar]
- Abujaber, A.; Fadlalla, A.; Gammoh, D.; Abdelrahman, H.; Mollazehi, M.; El-Menyar, A. Prediction of in-hospital mortality in patients with post traumatic brain injury using National Trauma Registry and Machine Learning Approach. Scand. J. Trauma Resusc. Emerg. Med. 2020, 28, 44. [Google Scholar] [CrossRef]
- Hsu, S.-D.; Chao, E.; Chen, S.-J.; Hueng, D.-Y.; Lan, H.-Y.; Chiang, H.-H. Machine Learning Algorithms to Predict In-Hospital Mortality in Patients with Traumatic Brain Injury. J. Pers. Med. 2021, 11, 1144. [Google Scholar] [CrossRef]
- Song, X.; Li, H.; Chen, Q.; Zhang, T.; Huang, G.; Zou, L.; Du, D. Predicting pneumonia during hospitalization in flail chest patients using machine learning approaches. Front. Surg. 2022, 9, 1060691. [Google Scholar] [CrossRef]
- Song, Y.; Liu, J.; Lei, M.; Wang, Y.; Fu, Q.; Wang, B.; Guo, Y.; Mi, W.; Tong, L. An External-Validated Algorithm to Predict Postoperative Pneumonia Among Elderly Patients with Lung Cancer After Video-Assisted Thoracoscopic Surgery. Front. Oncol. 2021, 11, 777564. [Google Scholar] [CrossRef] [PubMed]
- Xiang, G.; Dong, X.; Xu, T.; Feng, Y.; He, Z.; Ke, C.; Xiao, J.; Weng, Y.-M. A nomogram for prediction of postoperative pneumonia risk in elderly hip fracture patients. Risk Manag. Healthc. Policy 2020, 13, 1603–1611. [Google Scholar] [CrossRef] [PubMed]
- Marino, M.A.; Siddiqi, I.; Maniakhina, L.; Burton, P.M.; Reier, L.; Duong, J.; Miulli, D.E. Neurosurgical Outcomes in Severe Traumatic Brain Injuries Between Service Lines: Review of a Single Institution Database. Cureus 2023, 15, e37445. [Google Scholar] [CrossRef]
- Okidi, R.; Ogwang, D.M.; Okello, T.R.; Ezati, D.; Kyegombe, W.; Nyeko, D.; Scolding, N.J. Factors affecting mortality after traumatic brain injury in a resource-poor setting. BJS Open 2019, 4, 320–325. [Google Scholar] [CrossRef] [PubMed]
- Pastor, I.S.; Dumbravă, L.P.; Siserman, C.; Stan, H.; Para, I.; Florian, I. Predictive factors of 30-day mortality in patients with traumatic subdural hematoma. Exp. Ther. Med. 2021, 22, 757. [Google Scholar] [CrossRef]
- Lee, S.H.; Lee, C.H.; Hwang, S.H.; Kang, D.H. A Machine Learning–Based Prognostic Model for the Prediction of Early Death After Traumatic Brain Injury: Comparison with the Corticosteroid Randomization After Significant Head Injury (CRASH) Model. World Neurosurg. 2022, 166, e125–e134. [Google Scholar] [CrossRef]
- Kauffmann, J.; Esders, M.; Ruff, L.; Montavon, G.; Samek, W.; Müller, K.-R. From clustering to cluster explanations via neural networks. IEEE Trans. Neural Netw. Learn. Syst. 2022, 1–15. [Google Scholar] [CrossRef]
- Balaji, K. Machine learning algorithm for feature space clustering of mixed data with missing information based on molecule similarity. J. Biomed. Inform. 2022, 125, 103954. [Google Scholar] [CrossRef]
- Abujaber, A.; Fadlalla, A.; Gammoh, D.; Al-Thani, H.; El-Menyar, A. Machine Learning Model to Predict Ventilator Associated Pneumonia in patients with Traumatic Brain Injury: The C.5 Decision Tree Approach. Brain Inj 2021, 35, 1095–1102. [Google Scholar] [CrossRef]


| Postoperative Survival | Postoperative Death | ASD | |
|---|---|---|---|
| Age, years | 49 (60–73) | 50.5 (61–75) | 0.1 |
| Male | 345 (72.5) | 111 (78.7) | 0.1 |
| Duration of surgery, hours | 64 (100–150) | 79 (110–149) | 0.1 |
| TIE | 0 (0–4.8) | 0 (0–2.4) | 0.6 |
| Cooperative surgery | 10 (2.1) | 1 (0.7) | 0.1 |
| Obesity | 10 (2.1) | 4 (2.8) | 0 |
| Alcohol | 222 (46.6) | 57 (40.4) | 0.1 |
| Smoking | 149 (31.3) | 42 (29.8) | 0 |
| Midline shift, mm | 2 (5.9–10.5) | 3.5 (8.8–15.2) | 0.4 |
| Skull fracture | 180 (37.8) | 60 (42.6) | 0.1 |
| Intracerebral hemorrhage | 89 (18.7) | 25 (17.7) | 0 |
| Subdural hemorrhage | 317 (66.6) | 123 (87.2) | 0.5 |
| Epidural hemorrhage | 168 (35.3) | 23 (16.3) | 0.4 |
| Intraventricular hemorrhage | 14 (2.9) | 13 (9.2) | 0.3 |
| Subarachnoid hemorrhage | 89 (18.7) | 50 (35.5) | 0.4 |
| ASA PS | 3 (3–4) | 3 (3–4) | 0.1 |
| Administered blood | 0 (200–862.5) | 500 (1100–1880) | 0.8 |
| Administered fluid | 800 (1800–2800) | 2100 (3100–4300) | 0.8 |
| Urine output | 100 (300–600) | 175 (360–675) | 0.2 |
| Estimated blood loss | 200 (600–1500) | 1000 (2000–3000) | 0.8 |
| Intraoperative PRCs | 0 (1–3) | 2 (4–6) | 0.8 |
| Intraoperative FFP | 0 (0–2) | 0 (2–3) | 0.7 |
| Intraoperative PC | 0 (0–0) | 0 (0–0) | 0.2 |
| Blood urea nitrogen, mg/dL | 11.5 (14.5–17.8) | 12.5 (14.6–19.7) | 0.2 |
| Creatinine, mg/dL | 0.7 (0.8–1) | 0.7 (0.9–1.1) | 0.3 |
| Albumin, g/dL | 3.9 (4.2–4.4) | 3.8 (4.1–4.4) | 0.2 |
| Sodium, mmol/L | 137 (139–141) | 135 (138–141) | 0.1 |
| Potassium, mmol/L | 3.4 (3.7–4) | 3.1 (3.5–3.8) | 0.3 |
| GCS score | 8 (13–15) | 4 (6–10) | 1.1 |
| Total duration of ventilator care | 0 (2–10) | 3 (6–11) | 0.2 |
| O2/FiO2 < 300 | 92 (19.3) | 67 (47.5) | 0.6 |
| Burr hole | 103 (21.6) | 3 (2.1) | 0.7 |
| Craniectomy | 155 (32.6) | 103 (73) | 0.9 |
| Craniotomy | 203 (42.6) | 28 (19.9) | 0.5 |
| Cranioplasty | 5 (1.1) | 1 (0.7) | 0 |
| Coiling | 6 (1.3) | 5 (3.5) | 0.2 |
| Model | AUROC (95% CI) | Precision (95% CI) | Recall (95% CI) | Accuracy (95% CI) | F1 Score (95% CI) | |
|---|---|---|---|---|---|---|
| POM | Logistic Regression | 0.71 (0.61–0.81) | 0.46 (0.31–0.63) | 0.64 (0.45–0.81) | 0.75 (0.68–0.83) | 0.54 (0.36–0.67) |
| Random Forest | 0.63 (0.53–0.73) | 0.41 (0.24–0.61) | 0.43 (0.25–0.61) | 0.73 (0.66–0.81) | 0.42 (0.26–0.57) | |
| Light GBM | 0.65 (0.55–0.75) | 0.45 (0.26–0.64) | 0.46 (0.29–0.65) | 0.75 (0.67–0.82) | 0.46 (0.29–0.61) | |
| Multilayer Perceptron | 0.69 (0.59–0.79) | 0.47 (0.29–0.65) | 0.57 (0.39–0.75) | 0.76 (0.68–0.83) | 0.52 (0.35–0.65) | |
| SVM | 0.64 (0.54–0.74) | 0.38 (0.24–0.54) | 0.54 (0.36–0.72) | 0.7 (0.62–0.78) | 0.45 (0.29–0.59) | |
| Balanced Random Forest | 0.72 (0.63–0.81) | 0.39 (0.27–0.52) | 0.82 (0.68–0.96) | 0.67 (0.58–0.74) | 0.53 (0.4–0.65) | |
| PPN | Logistic Regression | 0.78 (0.7–0.86) | 0.68 (0.53–0.83) | 0.7 (0.55–0.84) | 0.81 (0.74–0.88) | 0.69 (0.56–0.8) |
| Random Forest | 0.74 (0.65–0.82) | 0.62 (0.46–0.78) | 0.65 (0.5–0.8) | 0.77 (0.71–0.85) | 0.63 (0.5–0.75) | |
| Light GBM | 0.73 (0.64–0.82) | 0.57 (0.42–0.72) | 0.68 (0.52–0.82) | 0.75 (0.67–0.82) | 0.62 (0.48–0.74) | |
| Multilayer Perceptron | 0.69 (0.6–0.78) | 0.57 (0.4–0.73) | 0.57 (0.41–0.72) | 0.74 (0.67–0.81) | 0.57 (0.42–0.7) | |
| SVM | 0.68 (0.59–0.77) | 0.56 (0.39–0.72) | 0.54 (0.37–0.7) | 0.73 (0.65–0.81) | 0.55 (0.41–0.67) | |
| Balanced Random Forest | 0.72 (0.64–0.8) | 0.5 (0.37–0.64) | 0.76 (0.61–0.89) | 0.7 (0.62–0.77) | 0.6 (0.48–0.71) |
| Variable | Logistic Regression | Random Forest | Light GBM | Multilayer Perceptron | SVM | Balanced Random Forest | |
|---|---|---|---|---|---|---|---|
| GCS | 0.201 (10) | 0.229 (11) | 0.123 (11) | 0.204 (7) | 0.21 (9) | 0.289 (12) | |
| POM | TIE | 0.068 (17) | 0.182 (16) | 0.126 (10) | 0.143 (12) | 0.162 (13) | 0.272 (13) |
| MSB | 0.131 (13) | 0 (33) | 0.009 (26) | 0.038 (20) | 0 (32) | 0.1 (24) | |
| GCS | 0.191 (6) | 0.275 (9) | 0.012 (25) | 0.031 (20) | 0.07 (17) | 0.504 (2) | |
| PPN | TIE | 0.049 (22) | 0.165 (18) | 0.086 (12) | 0.103 (10) | 0.077 (16) | 0.19 (13) |
| MSB | 0 (27) | 0.026 (28) | 0.069 (18) | 0 (29) | 0.002 (27) | 0 (30) |
| Model | AUROC (95% CI) | Precision (95% CI) | Recall (95% CI) | Accuracy (95% CI) | F1 Score (95% CI) | |
|---|---|---|---|---|---|---|
| POM | Logistic Regression | 0.72 (0.62–0.82) | 0.64 (0.54–0.75) | 0.67 (0.57–0.77) | 0.66 (0.55–0.76) | 0.6 (0.49–0.7) |
| Random Forest | 0.46 (0.31–0.62) | 0.42 (0.25–0.59) | 0.47 (0.29–0.66) | 0.42 (0.26–0.58) | 0.33 (0.19–0.48) | |
| Light GBM | 0.68 (0.5–0.86) | 0.46 (0.29–0.65) | 0.5 (0.32–0.68) | 0.54 (0.35–0.73) | 0.46 (0.28–0.64) | |
| Multilayer Perceptron | 0.75 (0.68–0.82) | 0.73 (0.65–0.81) | 0.76 (0.68–0.83) | 0.73 (0.65–0.8) | 0.67 (0.59–0.75) | |
| SVM | 0.55 (0.4–0.68) | 0.44 (0.27–0.58) | 0.48 (0.3–0.62) | 0.47 (0.31–0.61) | 0.39 (0.23–0.52) | |
| Balanced Random Forest | 0.72 (0.62–0.82) | 0.64 (0.54–0.75) | 0.67 (0.57–0.77) | 0.66 (0.55–0.76) | 0.6 (0.49–0.7) | |
| PPN | Logistic Regression | 0.77 (0.69–0.85) | 0.77 (0.69–0.86) | 0.72 (0.64–0.82) | 0.69 (0.6–0.78) | 0.67 (0.57–0.76) |
| Random Forest | 0.65 (0.5–0.8) | 0.68 (0.51–0.81) | 0.61 (0.46–0.76) | 0.55 (0.39–0.7) | 0.53 (0.37–0.69) | |
| Light GBM | 0.7 (0.55–0.84) | 0.68 (0.53–0.81) | 0.62 (0.46–0.78) | 0.57 (0.4–0.73) | 0.54 (0.37–0.71) | |
| Multilayer Perceptron | 0.8 (0.73–0.86) | 0.81 (0.73–0.88) | 0.77 (0.69–0.84) | 0.73 (0.65–0.81) | 0.72 (0.63–0.79) | |
| SVM | 0.68 (0.52–0.79) | 0.68 (0.54–0.78) | 0.61 (0.46–0.73) | 0.56 (0.43–0.68) | 0.53 (0.38–0.66) | |
| Balanced Random Forest | 0.77 (0.69–0.85) | 0.77 (0.69–0.86) | 0.72 (0.64–0.82) | 0.69 (0.6–0.78) | 0.67 (0.57–0.76) |
| Postoperative Mortality | Postoperative Pneumonia | |||||||
|---|---|---|---|---|---|---|---|---|
| Unadjusted OR | p | Adjusted OR | p | Unadjusted OR | p | Adjusted OR | p | |
| Cluster 0 | reference | reference | reference | reference | ||||
| Cluster 1 | 0 (0–0) | >0.999 | 0 (0–0) | >0.999 | 0 (0–0) | >0.999 | 0 (0–0) | >0.999 |
| Cluster 2 | 0.73 (0.37–1.42) | 0.355 | 0.82 (0.36–1.88) | 0.641 | 0.42 (0.26–0.7) | 0.001 | 0.52 (0.28–0.97) | 0.040 |
| Cluster 3 | 4.32 (2.37–7.87) | <0.001 | 3.2 (1.54–6.64) | 0.002 | 1.28 (0.78–2.11) | 0.336 | 0.72 (0.39–1.33) | 0.290 |
| Cluster 4 | 4.93 (2.71–8.96) | <0.001 | 2.32 (1.09–4.92) | 0.029 | 1.78 (1.08–2.91) | 0.022 | 1.07 (0.58–1.97) | 0.820 |
Disclaimer/Publisher’s Note: The statements, opinions and data contained in all publications are solely those of the individual author(s) and contributor(s) and not of MDPI and/or the editor(s). MDPI and/or the editor(s) disclaim responsibility for any injury to people or property resulting from any ideas, methods, instructions or products referred to in the content. |
© 2023 by the authors. Licensee MDPI, Basel, Switzerland. This article is an open access article distributed under the terms and conditions of the Creative Commons Attribution (CC BY) license (https://creativecommons.org/licenses/by/4.0/).
Share and Cite
Kim, J.-H.; Chung, K.-M.; Lee, J.-J.; Choi, H.-J.; Kwon, Y.-S. Predictive Modeling and Integrated Risk Assessment of Postoperative Mortality and Pneumonia in Traumatic Brain Injury Patients through Clustering and Machine Learning: Retrospective Study. Biomedicines 2023, 11, 2880. https://doi.org/10.3390/biomedicines11112880
Kim J-H, Chung K-M, Lee J-J, Choi H-J, Kwon Y-S. Predictive Modeling and Integrated Risk Assessment of Postoperative Mortality and Pneumonia in Traumatic Brain Injury Patients through Clustering and Machine Learning: Retrospective Study. Biomedicines. 2023; 11(11):2880. https://doi.org/10.3390/biomedicines11112880
Chicago/Turabian StyleKim, Jong-Ho, Kyung-Min Chung, Jae-Jun Lee, Hyuk-Jai Choi, and Young-Suk Kwon. 2023. "Predictive Modeling and Integrated Risk Assessment of Postoperative Mortality and Pneumonia in Traumatic Brain Injury Patients through Clustering and Machine Learning: Retrospective Study" Biomedicines 11, no. 11: 2880. https://doi.org/10.3390/biomedicines11112880
APA StyleKim, J.-H., Chung, K.-M., Lee, J.-J., Choi, H.-J., & Kwon, Y.-S. (2023). Predictive Modeling and Integrated Risk Assessment of Postoperative Mortality and Pneumonia in Traumatic Brain Injury Patients through Clustering and Machine Learning: Retrospective Study. Biomedicines, 11(11), 2880. https://doi.org/10.3390/biomedicines11112880