

Empowering Renal Cancer Management with AI and Digital Pathology: Pathology, Diagnostics and Prognosis

 ,
,  ,
,
Abstract
:1. Introduction
2. Machine Learning in the Diagnostics of Kidney Tumors
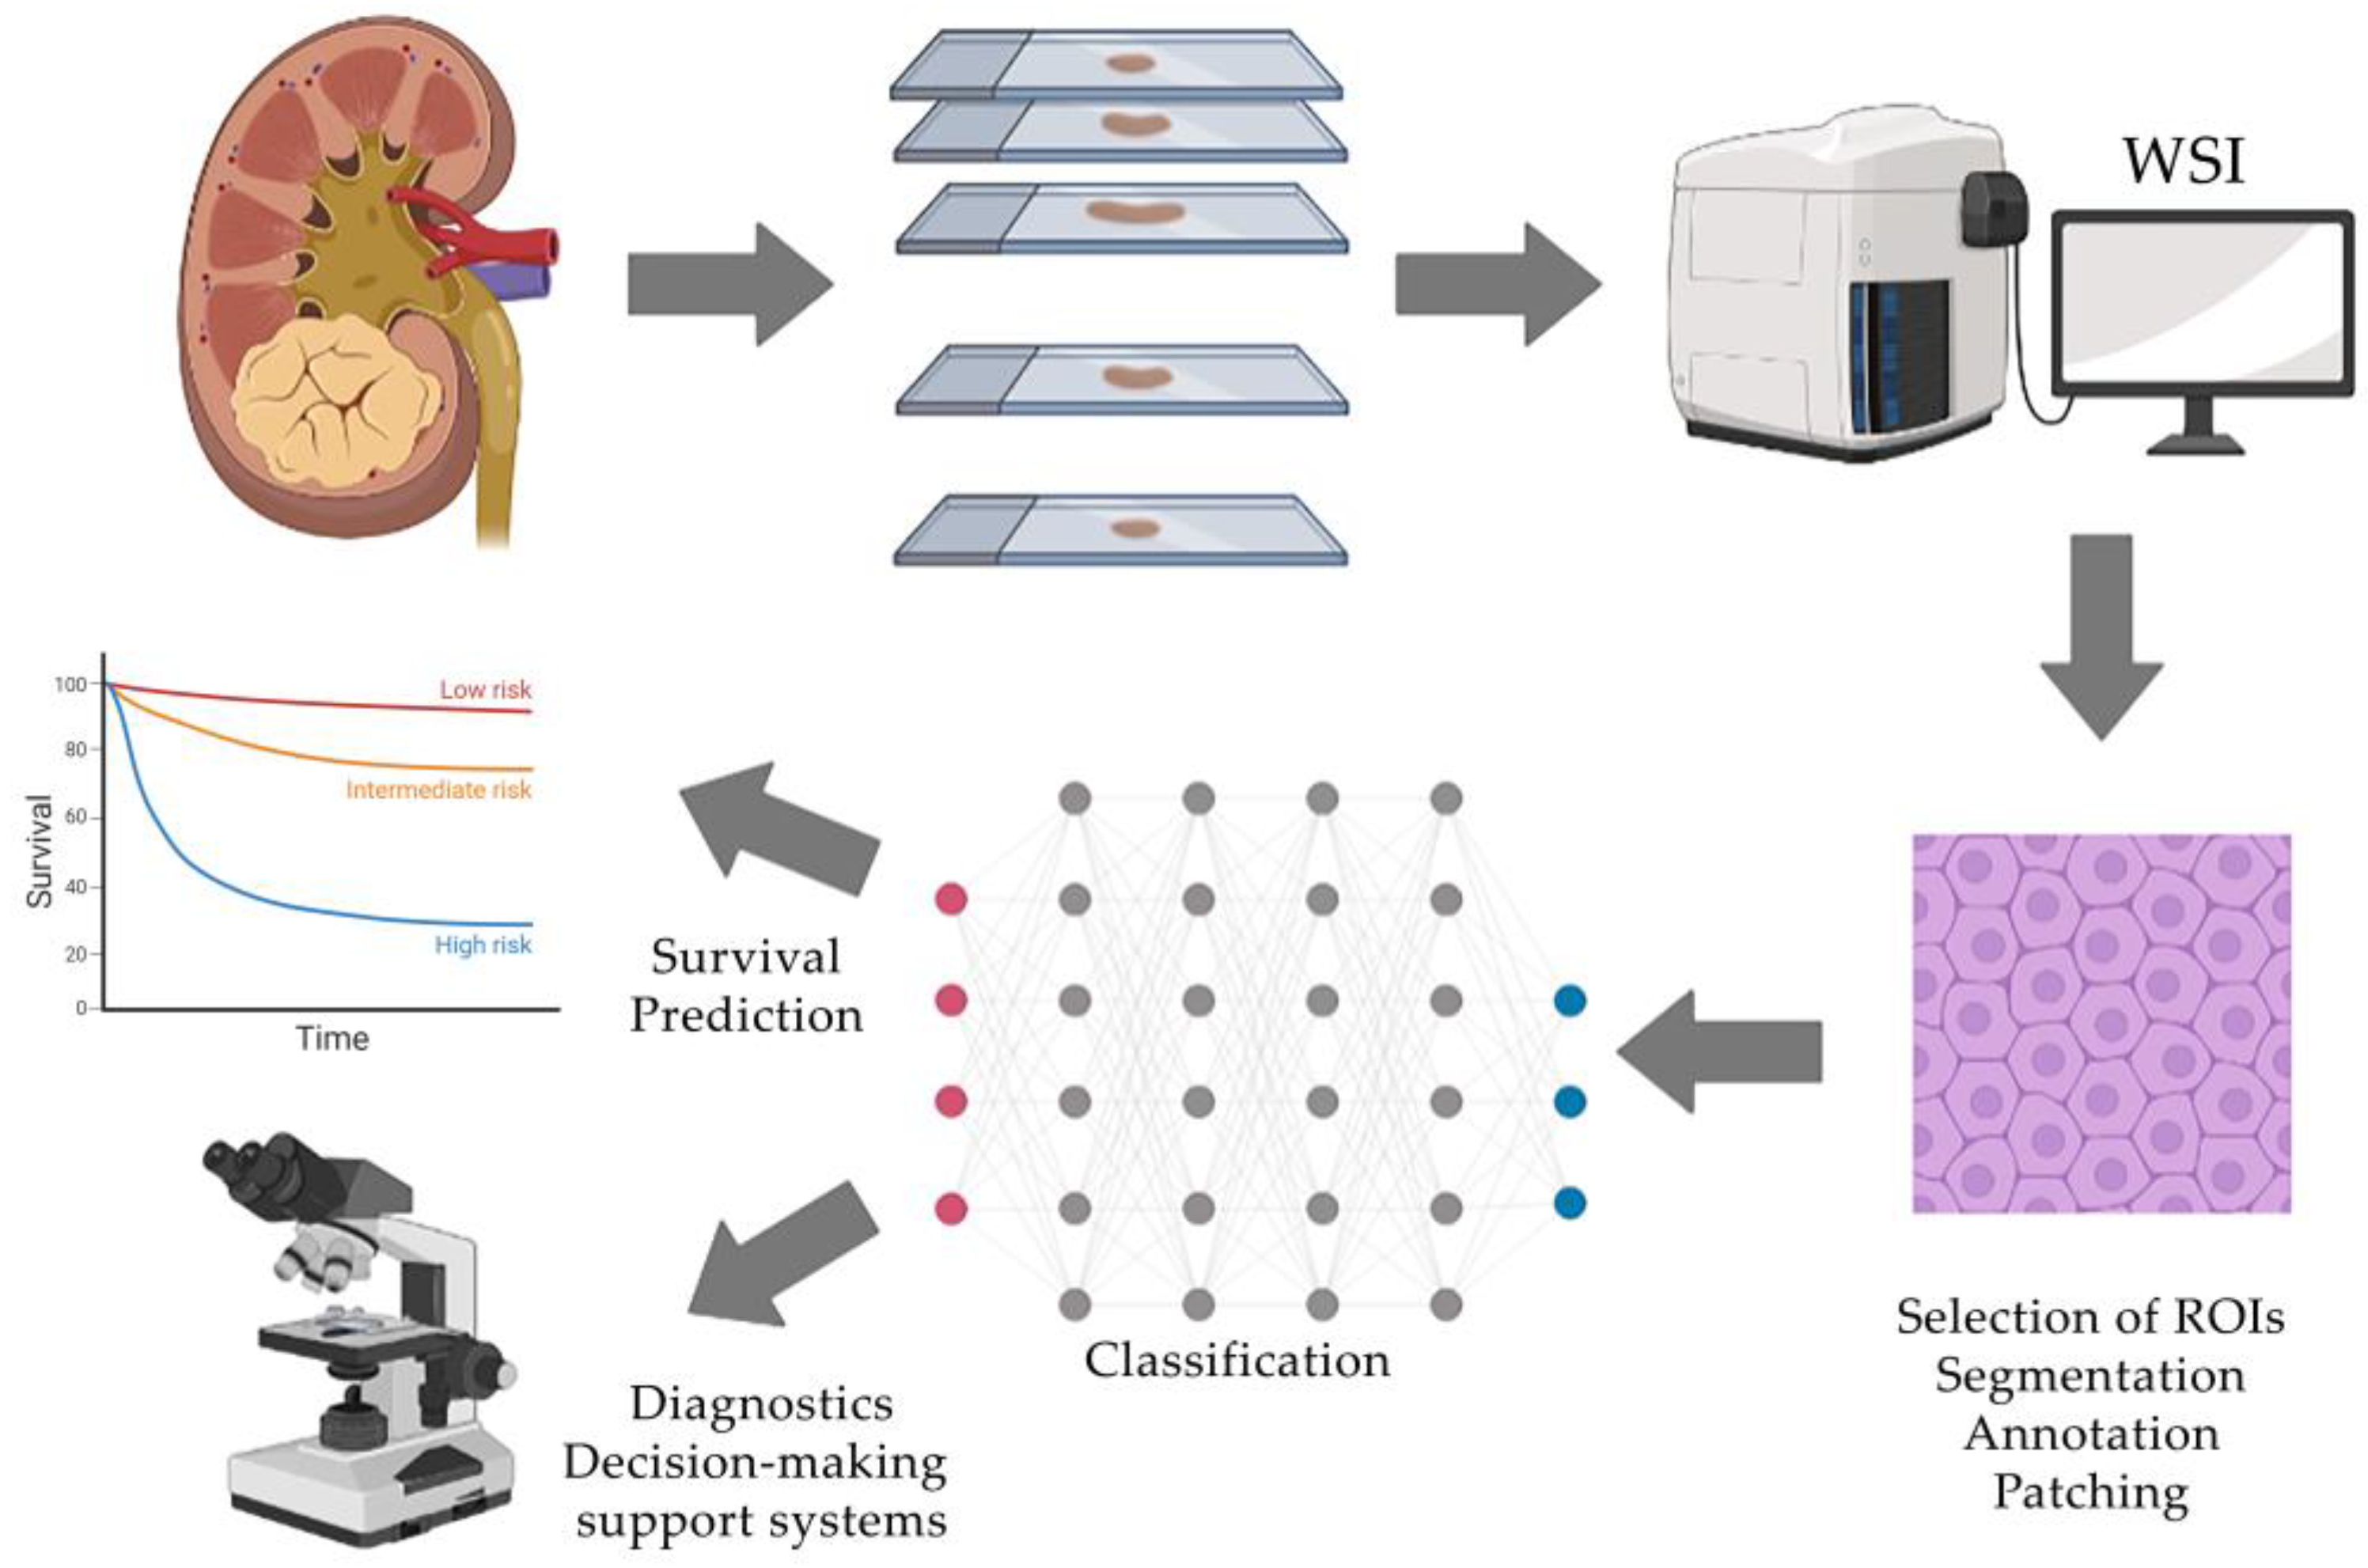
2.1. Neural Network Architecture for Histological Image Analysis
2.2. Processing of Histological Images
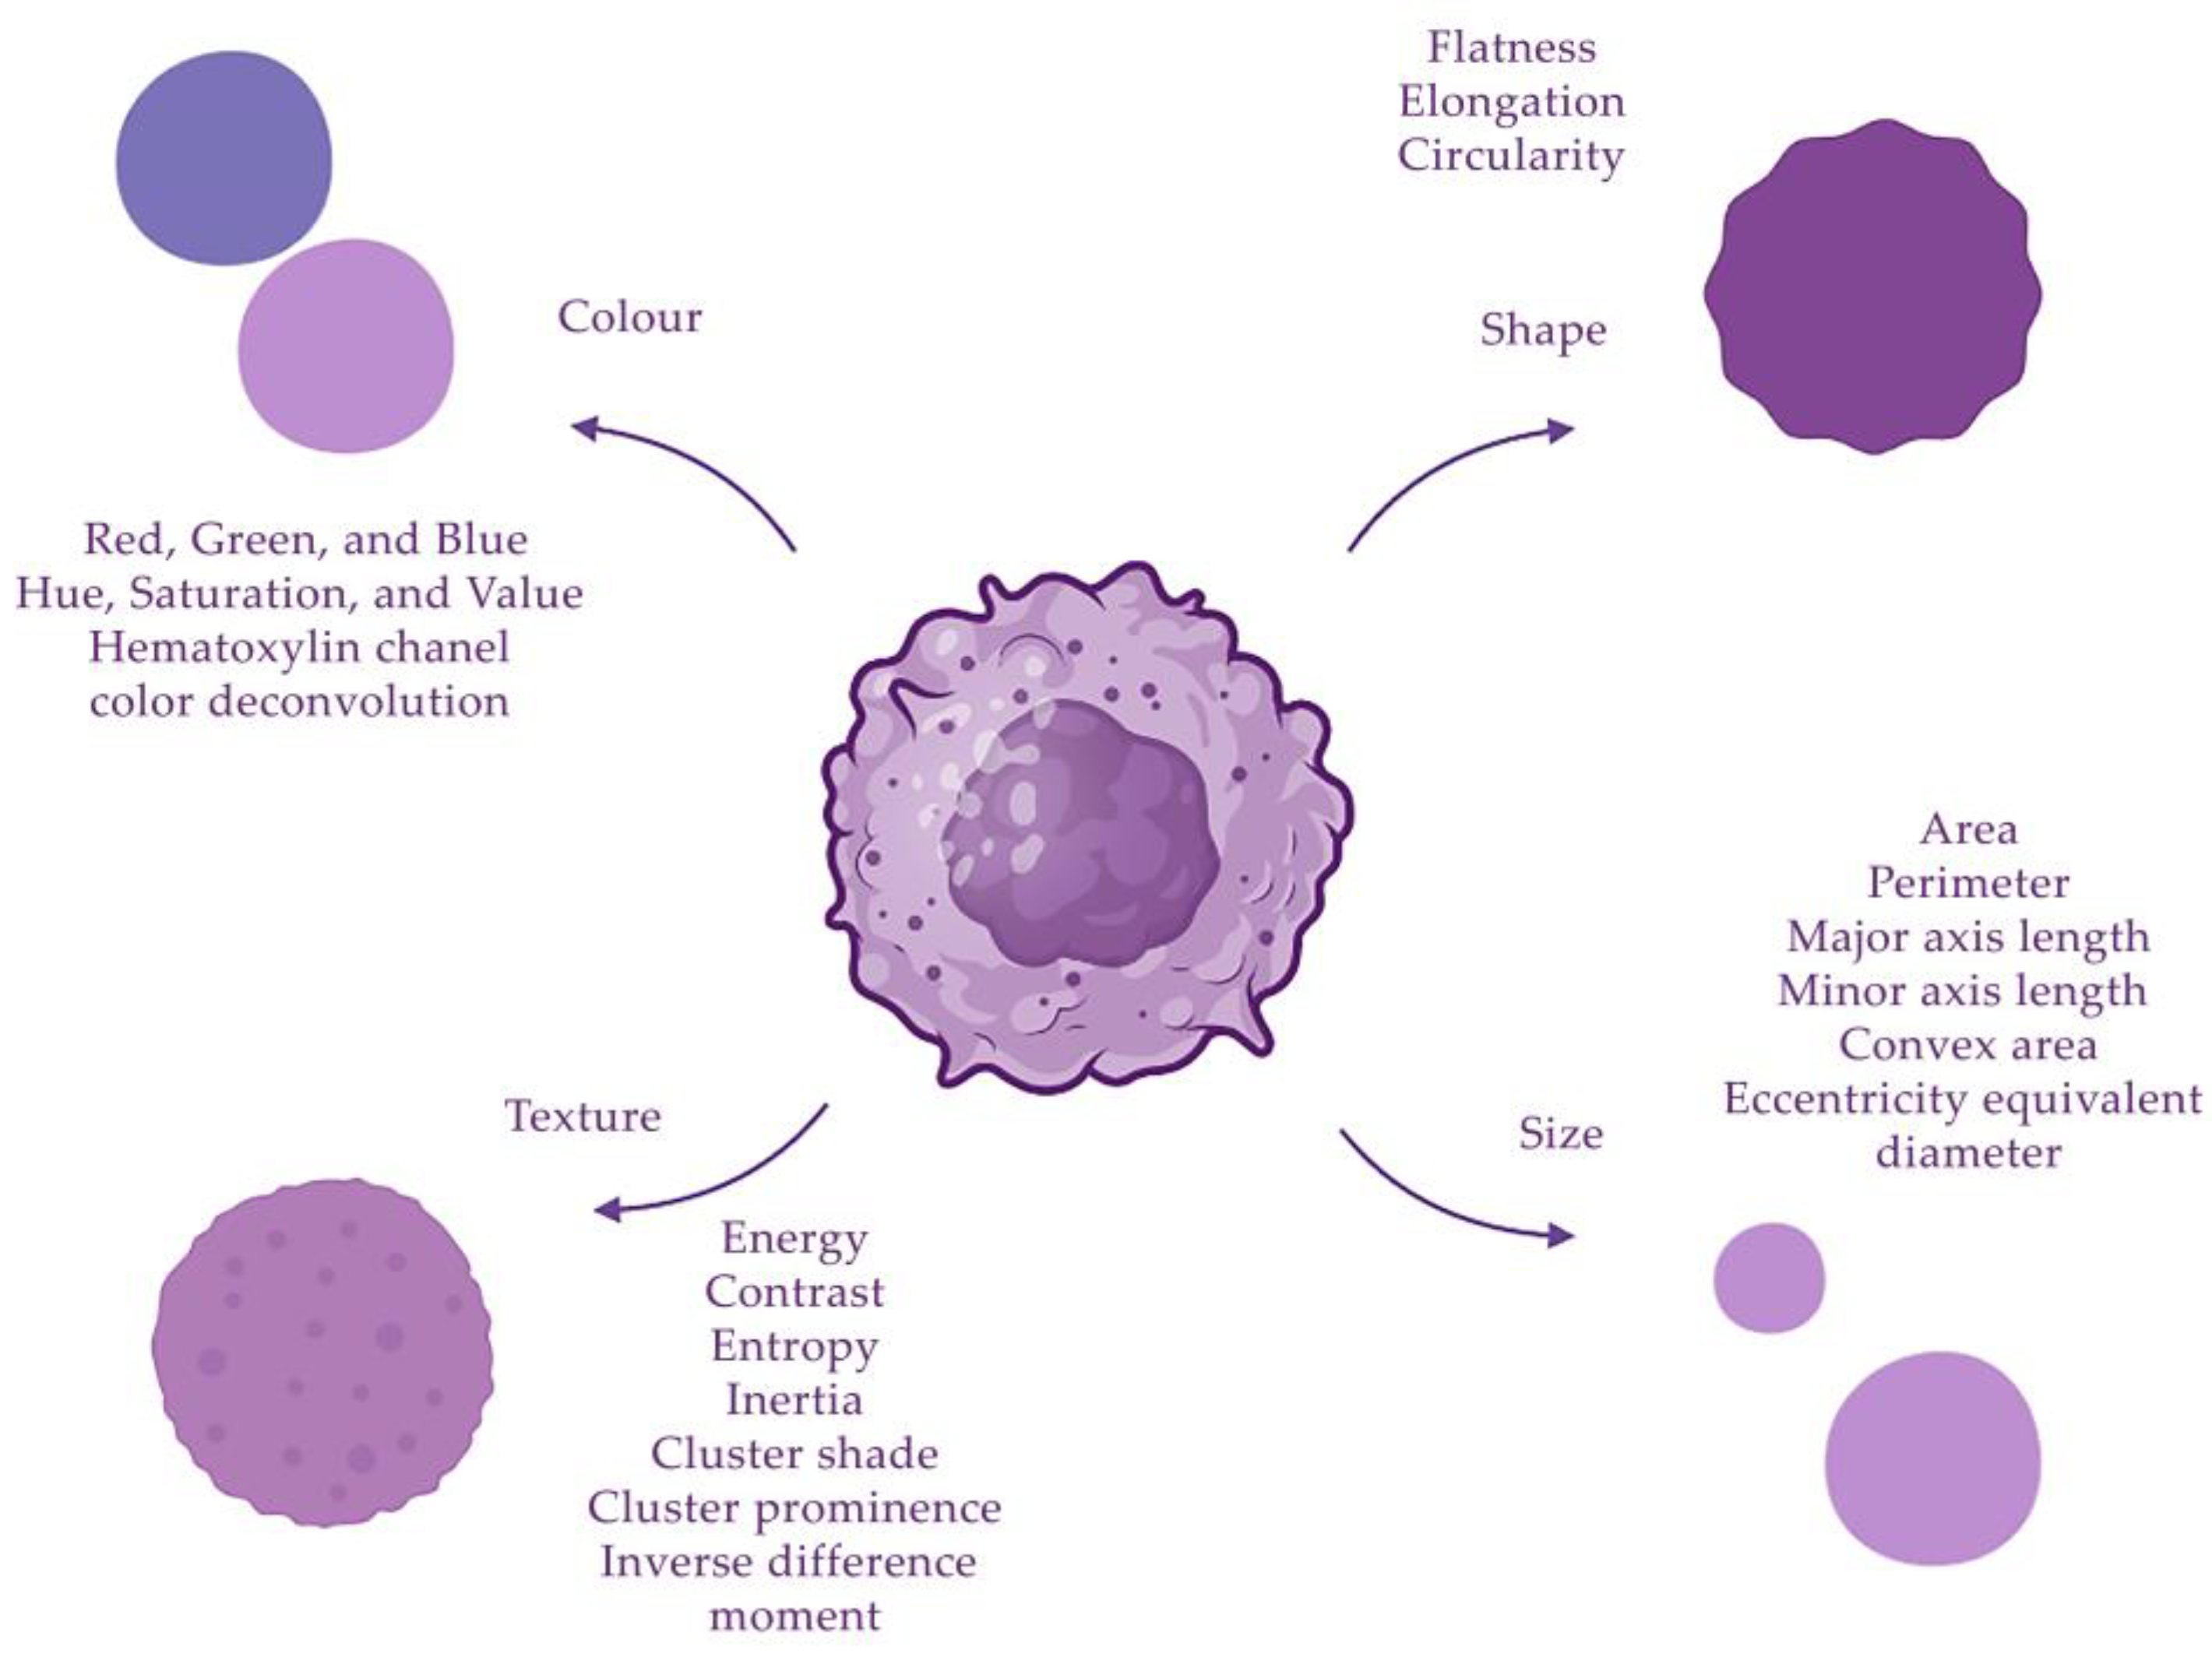
2.3. Selection of Cell and Tissue Morphological Features
2.4. Training Models for Histological Image Analysis
2.5. Automated Detection of Morphological Features
2.6. Directions for Practical Application of Histological AI Models
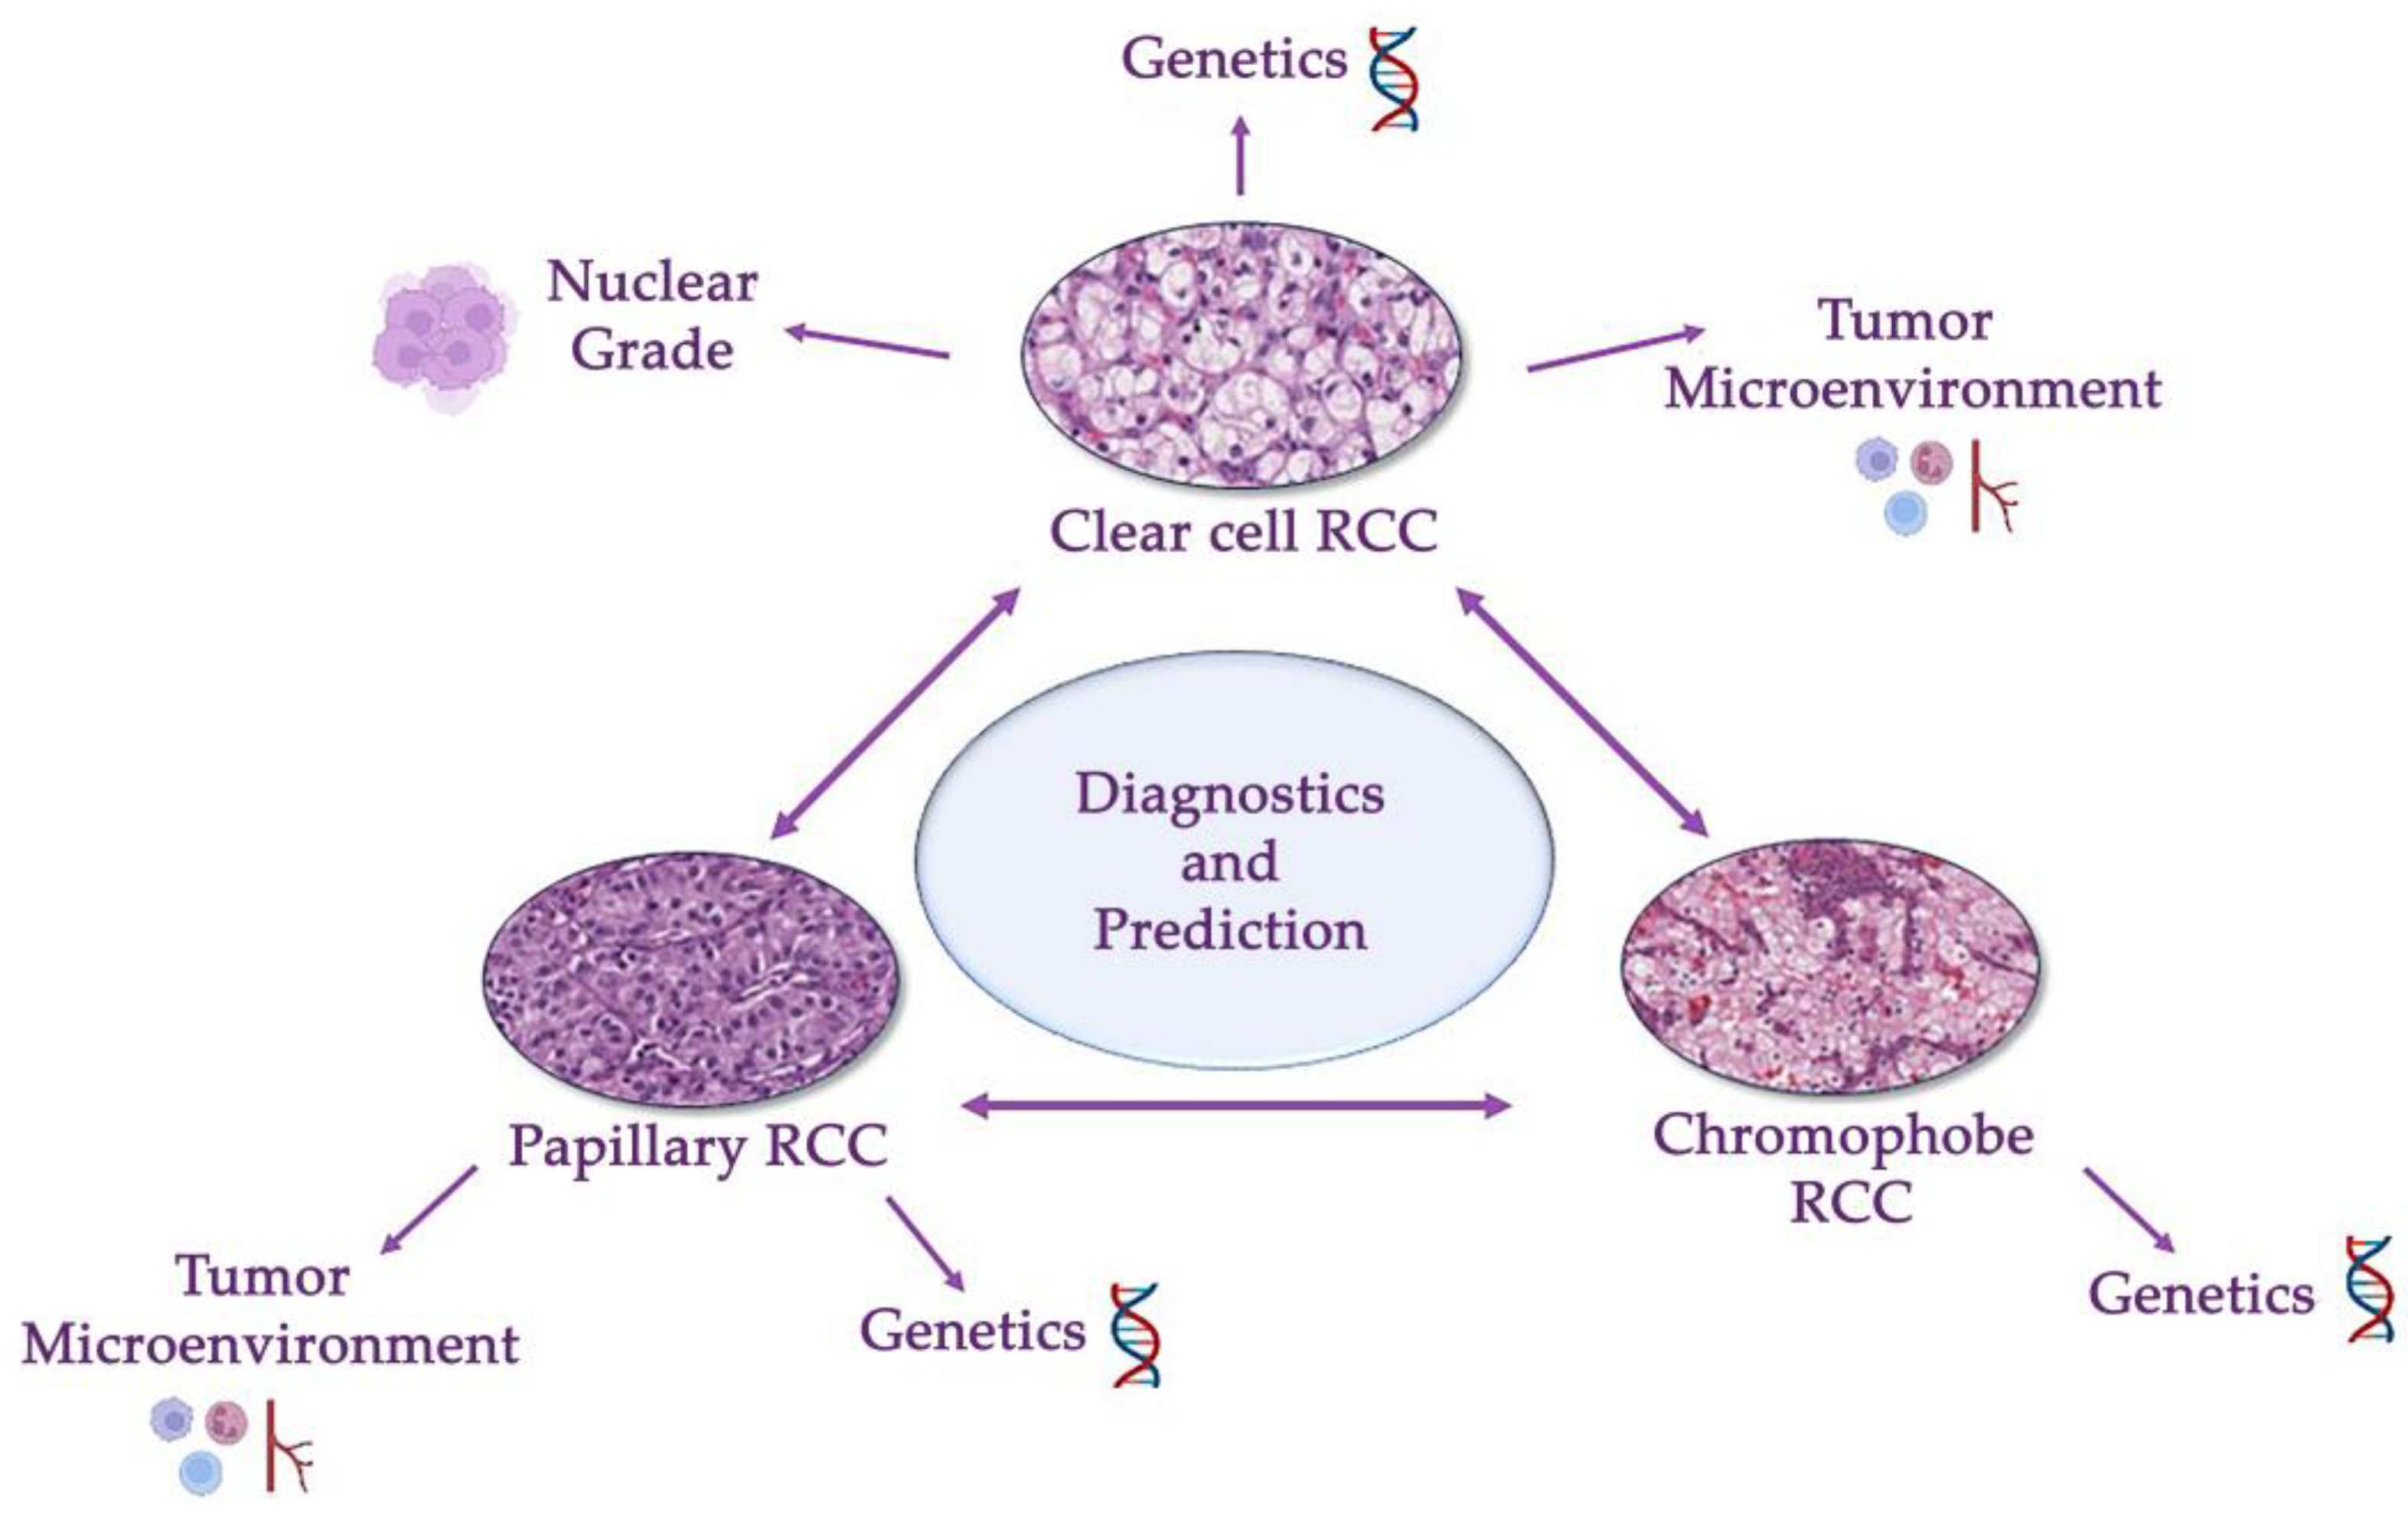
3. Differential Diagnosis of RCC
4. Clear Cell RCC
5. Papillary RCC
6. Chromophobe RCC
7. Conclusions
Author Contributions
Funding
Institutional Review Board Statement
Informed Consent Statement
Data Availability Statement
Acknowledgments
Conflicts of Interest
References
- Key Statistics About Kidney Cancer, American Cancer Society. Available online: https://www.cancer.org/cancer/types/kidney-cancer/about/key-statistics.html (accessed on 12 January 2023).
- Znaor, A.; Lortet-Tieulent, J.; Laversanne, M.; Jemal, A.; Bray, F. International variations and trends in renal cell carcinoma incidence and mortality. Eur. Urol. 2015, 67, 519–530. [Google Scholar] [CrossRef]
- WHO Classification of Tumours Editorial Board. Urinary and Male Genital Tumours; International Agency for Recearch on Cancer: Lyon, France, 2022; pp. 31–56. [Google Scholar]
- Kidney Cancer Early Detection, Diagnosis, and Staging, American Cancer Society. Available online: https://www.cancer.org/cancer/types/kidney-cancer/detection-diagnosis-staging.html (accessed on 12 January 2023).
- Brierley, J.D.; Gospodarowicz, M.K.; Wittekind, C.; International Union against Cancer (UICC). TNM Classification of Malignant Tumours, 8th ed.; Wiley: Oxford, UK, 2017; pp. 194–196. [Google Scholar]
- Treatment of Kidney Cancer by Stage, American Cancer Society. Available online: https://www.cancer.org/cancer/types/kidney-cancer/treating/by-stage.html (accessed on 12 January 2023).
- Fuhrman, S.A.; Lasky, L.C.; Limas, C. Prognostic significance of morphologic parameters in renal cell carcinoma. Am. J. Surg. Pathol. 1982, 6, 655–664. [Google Scholar] [CrossRef]
- Dagher, J.; Delahunt, B.; Rioux-Leclercq, N.; Egevad, L.; Srigley, J.R.; Coughlin, G.; Dunglinson, N.; Gianduzzo, T.; Kua, B.; Malone, G.; et al. Clear cell renal cell carcinoma: Validation of World Health Organization/International Society of Urological Pathology grading. Histopathology 2017, 71, 918–925. [Google Scholar] [CrossRef]
- Warren, A.Y.; Harrison, D. WHO/ISUP classification, grading and pathological staging of renal cell carcinoma: Standards and controversies. World J. Urol. 2018, 36, 1913–1926. [Google Scholar] [CrossRef]
- Rahman, M.; Usman, O.L.; Muniyandi, R.C.; Sahran, S.; Mohamed, S.; Razak, R.A. A Review of Machine Learning Methods of Feature Selection and Classification for Autism Spectrum Disorder. Brain Sci. 2020, 10, 949. [Google Scholar] [CrossRef]
- Ferro, M.; Musi, G.; Marchioni, M.; Maggi, M.; Veccia, A.; Del Giudice, F.; Barone, B.; Crocetto, F.; Lasorsa, F.; Antonelli, A.; et al. Radiogenomics in Renal Cancer Management—Current Evidence and Future Prospects. Int. J. Mol. Sci. 2023, 24, 4615. [Google Scholar] [CrossRef] [PubMed]
- Ferro, M.; Crocetto, F.; Barone, B.; del Giudice, F.; Maggi, M.; Lucarelli, G.; Busetto, G.M.; Autorino, R.; Marchioni, M.; Cantiello, F.; et al. Artificial intelligence and radiomics in evaluation of kidney lesions: A comprehensive literature review. Ther. Adv. Urol. 2023, 15, 17562872231164803. [Google Scholar] [CrossRef] [PubMed]
- Naghavi-Behzad, B.M.; Petersen, C.B.; Vogsen, M.; Braad, P.-E.; Hildebrandt, M.G.; Gerke, O. The Role of Artificial Intelligence in the Diagnosis and Prognosis of Renal Cell Tumors. Diagnostics 2021, 11, 206. [Google Scholar] [CrossRef]
- Tian, K.; Rubadue, C.A.; Lin, D.I.; Veta, M.; Pyle, M.E.; Irshad, H.; Heng, Y.J. Automated clear cell renal carcinoma grade classification with prognostic significance. PLoS ONE 2019, 14, e0222641. [Google Scholar] [CrossRef]
- Yeh, F.-C.; Parwani, A.V.; Pantanowitz, L.; Ho, C. Automated grading of renal cell carcinoma using whole slide imaging. J. Pathol. Inform. 2014, 5, 23. [Google Scholar] [CrossRef] [PubMed]
- Kruk, M.; Kurek, J.; Osowski, S.; Koktysz, R.; Swiderski, B.; Markiewicz, T. Ensemble of classifiers and wavelet transformation for improved recognition of Fuhrman grading in clear-cell renal carcinoma. Biocybern. Biomed. Eng. 2017, 37, 357–364. [Google Scholar] [CrossRef]
- Cheng, J.; Mo, X.; Wang, X.; Parwani, A.; Feng, Q.; Huang, K. Identification of topological features in renal tumor microenvironment associated with patient survival. Bioinformatics 2018, 34, 1024–1030. [Google Scholar] [CrossRef] [PubMed]
- Champion, A.; Lu, G.; Walker, M.; Kothari, S.; Osunkoya, A.O.; Wang, M.D. Semantic interpretation of robust imaging features for Fuhrman grading of renal carcinoma. In Proceedings of the 36th Annual International Conference of the IEEE Engineering in Medicine and Biology Society, Chicago, IL, USA, 26–30 August 2014; pp. 6446–6449. [Google Scholar] [CrossRef]
- Azuaje, F.; Kim, S.-Y.; Hernandez, D.P.; Dittmar, G. Connecting Histopathology Imaging and Proteomics in Kidney Cancer through Machine Learning. J. Clin. Med. 2019, 8, 1535. [Google Scholar] [CrossRef] [PubMed]
- Fenstermaker, M.; Tomlins, S.A.; Singh, K.; Wiens, J.; Morgan, T.M. Development and Validation of a Deep-learning Model to Assist with Renal Cell Carcinoma Histopathologic Interpretation. Urology 2020, 144, 152–157. [Google Scholar] [CrossRef] [PubMed]
- Faust, K.; Roohi, A.; Leon, A.J.; Leroux, E.; Dent, A.; Evans, A.J.; Pugh, T.J.; Kalimuthu, S.N.; Djuric, U.; Diamandis, P. Unsupervised Resolution of Histomorphologic Heterogeneity in Renal Cell Carcinoma Using a Brain Tumor-Educated Neural Network. JCO Clin. Cancer Inform. 2020, 4, 811–821. [Google Scholar] [CrossRef]
- Lasorsa, F.; Rutigliano, M.; Milella, M.; Ferro, M.; Pandolfo, S.D.; Crocetto, F.; Tataru, O.S.; Autorino, R.; Battaglia, M.; Ditonno, P.; et al. Cellular and Molecular Players in the Tumor Microenvironment of Renal Cell Carcinoma. J. Clin. Med. 2023, 12, 3888. [Google Scholar] [CrossRef]
- Ing, N.; Huang, F.; Conley, A.; You, S.; Ma, Z.; Klimov, S.; Ohe, C.; Yuan, X.; Amin, M.B.; Figlin, R.; et al. A novel machine learning approach reveals latent vascular phenotypes predictive of renal cancer outcome. Sci. Rep. 2017, 7, 13190. [Google Scholar] [CrossRef]
- Marien, K.M.; Croons, V.; Waumans, Y.; Sluydts, E.; De Schepper, S.; Andries, L.; Waelput, W.; Fransen, E.; Vermeulen, P.B.; Kockx, M.M.; et al. Development and Validation of a Histological Method to Measure Microvessel Density in Whole-Slide Images of Cancer Tissue. PLoS ONE 2016, 11, e0161496. [Google Scholar] [CrossRef]
- Synnott, N.C.; Poeta, M.L.; Costantini, M.; Pfeiffer, R.M.; Li, M.; Golubeva, Y.; Lawrence, S.; Mutreja, K.; Amoreo, C.; Dabrowska, M.; et al. Characterizing the tumor microenvironment in rare renal cancer histological types. J. Pathol. Clin. Res. 2022, 8, 88–98. [Google Scholar] [CrossRef]
- Tabibu, S.; Vinod, P.K.; Jawahar, C.V. Pan-Renal Cell Carcinoma classification and survival prediction from histopathology images using deep learning. Sci. Rep. 2019, 9, 10509. [Google Scholar] [CrossRef]
- Aveta, A.; Cilio, S.; Contieri, R.; Spena, G.; Napolitano, L.; Manfredi, C.; Franco, A.; Crocerossa, F.; Cerrato, C.; Ferro, M.; et al. Urinary MicroRNAs as Biomarkers of Urological Cancers: A Systematic Review. Int. J. Mol. Sci. 2023, 24, 10846. [Google Scholar] [CrossRef]
- Uhlig, J.; Leha, A.; Delonge, L.M.; Haack, A.-M.; Shuch, B.; Kim, H.S.; Bremmer, F.; Trojan, L.; Lotz, J.; Uhlig, A. Radiomic Features and Machine Learning for the Discrimination of Renal Tumor Histological Subtypes: A Pragmatic Study Using Clinical-Routine Computed Tomography. Cancers 2020, 12, 3010. [Google Scholar] [CrossRef]
- Shehata, M.; Alksas, A.; Abouelkheir, R.T.; Elmahdy, A.; Shaffie, A.; Soliman, A.; Ghazal, M.; Abu Khalifeh, H.; Salim, R.; Razek, A.A.K.A.; et al. A Comprehensive Computer-Assisted Diagnosis System for Early Assessment of Renal Cancer Tumors. Sensors 2021, 21, 4928. [Google Scholar] [CrossRef]
- Schulz, S.; Woerl, A.-C.; Jungmann, F.; Glasner, C.; Stenzel, P.; Strobl, S.; Fernandez, A.; Wagner, D.-C.; Haferkamp, A.; Mildenberger, P.; et al. Multimodal Deep Learning for Prognosis Prediction in Renal Cancer. Front. Oncol. 2021, 11, 788740. [Google Scholar] [CrossRef] [PubMed]
- Xv, Y.; Lv, F.; Guo, H.; Zhou, X.; Tan, H.; Xiao, M.; Zheng, Y. Machine learning-based CT radiomics approach for predicting WHO/ISUP nuclear grade of clear cell renal cell carcinoma: An exploratory and comparative study. Insights Imaging 2021, 12, 17. [Google Scholar] [CrossRef] [PubMed]
- Chaudry, Q.; Raza, S.H.; Young, A.N.; Wang, M.D. Automated Renal Cell Carcinoma Subtype Classification Using Morphological, Textural and Wavelets Based Features. J. Signal Process. Syst. 2009, 55, 15–23. [Google Scholar] [CrossRef] [PubMed]
- Raza, S.H.; Parry, R.M.; Sharma, Y.; Chaudry, Q.; Moffitt, R.A.; Young, A.N.; Wang, M.D. Automated classification of renal cell carcinoma subtypes using bag-of-features. In Proceedings of the 2010 Annual International Conference of the IEEE Engineering in Medicine and Biology, Buenos Aires, Argentina, 31 August–4 September 2010; pp. 6749–6752. [Google Scholar] [CrossRef]
- Zhu, M.; Ren, B.; Richards, R.; Suriawinata, M.; Tomita, N.; Hassanpour, S. Development and evaluation of a deep neural network for histologic classification of renal cell carcinoma on biopsy and surgical resection slides. Sci. Rep. 2021, 11, 7080. [Google Scholar] [CrossRef]
- Gondim, D.D.; Al-Obaidy, K.I.; Idrees, M.T.; Eble, J.N.; Cheng, L. Artificial intelligence-based multi-class histopathologic classification of kidney neoplasms. J. Pathol. Inform. 2023, 14, 100299. [Google Scholar] [CrossRef] [PubMed]
- Abdeltawab, H.; Khalifa, F.; Ghazal, M.; Cheng, L.; Gondim, D.; El-Baz, A. A pyramidal deep learning pipeline for kidney whole-slide histology images classification. Sci. Rep. 2021, 11, 20189. [Google Scholar] [CrossRef]
- Paner, G.P.; Amin, M.B.; Alvarado-Cabrero, I.; Young, A.N.; Stricker, H.J.; Moch, H.; Lyles, R.H. A Novel Tumor Grading Scheme for Chromophobe Renal Cell Carcinoma: Prognostic Utility and Comparison with Fuhrman Nuclear Grade. Am. J. Surg. Pathol. 2010, 34, 1233–1240. [Google Scholar] [CrossRef]
- Cheville, J.C.; Lohse, C.M.; Sukov, W.R.; Thompson, R.H.; Leibovich, B.C. Chromophobe Renal Cell Carcinoma: The Impact of Tumor Grade on Outcome. Am. J. Surg. Pathol. 2012, 36, 851–856. [Google Scholar] [CrossRef] [PubMed]
- Holdbrook, D.A.; Singh, M.; Choudhury, Y.; Kalaw, E.M.; Koh, V.; Tan, H.S.; Kanesvaran, R.; Tan, P.H.; Peng, J.Y.S.; Tan, M.-H.; et al. Automated Renal Cancer Grading Using Nuclear Pleomorphic Patterns. JCO Clin. Cancer Inform. 2018, 2, 1–12. [Google Scholar] [CrossRef] [PubMed]
- Chen, S.; Jiang, L.; Gao, F.; Zhang, E.; Wang, T.; Zhang, N.; Wang, X.; Zheng, J. Machine learning-based pathomics signature could act as a novel prognostic marker for patients with clear cell renal cell carcinoma. Br. J. Cancer 2022, 126, 771–777. [Google Scholar] [CrossRef] [PubMed]
- Stenzel, P.J.; Schindeldecker, M.; Tagscherer, K.E.; Foersch, S.; Herpel, E.; Hohenfellner, M.; Hatiboglu, G.; Alt, J.; Thomas, C.; Haferkamp, A.; et al. Prognostic and Predictive Value of Tumor-infiltrating Leukocytes and of Immune Checkpoint Molecules PD1 and PDL1 in Clear Cell Renal Cell Carcinoma. Transl. Oncol. 2020, 13, 336–345. [Google Scholar] [CrossRef] [PubMed]
- De Filippis, R.; Wölflein, G.; Um, I.H.; Caie, P.D.; Warren, S.; White, A.; Suen, E.; To, E.; Arandjelović, O.; Harrison, D.J. Use of High-Plex Data Reveals Novel Insights into the Tumour Microenvironment of Clear Cell Renal Cell Carcinoma. Cancers 2022, 14, 5387. [Google Scholar] [CrossRef] [PubMed]
- Cheng, J.; Han, Z.; Mehra, R.; Shao, W.; Cheng, M.; Feng, Q.; Ni, D.; Huang, K.; Cheng, L.; Zhang, J. Computational analysis of pathological images enables a better diagnosis of TFE3 Xp11.2 translocation renal cell carcinoma. Nat. Commun. 2020, 11, 1778. [Google Scholar] [CrossRef]
- Wei, B.; Yu, M.; Yao, J.; Jiang, M.; An, J.; Yang, J.; Lin, J.; Zhao, Y.; Zhu, Y. Multidimensional Analyses of Tumor Immune Microenvironment Reveal the Possible Rationality of Immunotherapy and Identify High Immunotherapy Response Subtypes for Renal Papillary Cell Carcinoma. Front. Immunol. 2021, 12, 657951. [Google Scholar] [CrossRef]
- Li, L.; Liu, X.; Wen, Y.; Liu, P.; Sun, T. Identification of Prognostic Markers of DNA Damage and Oxidative Stress in Diagnosing Papillary Renal Cell Carcinoma Based on High-Throughput Bioinformatics Screening. J. Oncol. 2023, 4, 4640563. [Google Scholar] [CrossRef]
- Ohashi, R.; Schraml, P.; Angori, S.; Batavia, A.A.; Rupp, N.J.; Ohe, C.; Otsuki, Y.; Kawasaki, T.; Kobayashi, H.; Kobayashi, K.; et al. Classic Chromophobe Renal Cell Carcinoma Incur a Larger Number of Chromosomal Losses Than Seen in the Eosinophilic Subtype. Cancers 2019, 11, 1492. [Google Scholar] [CrossRef]
- Alhussaini, A.J.; Steele, J.D.; Nabi, G. Comparative Analysis for the Distinction of Chromophobe Renal Cell Carcinoma from Renal Oncocytoma in Computed Tomography Imaging Using Machine Learning Radiomics Analysis. Cancers 2022, 14, 3609. [Google Scholar] [CrossRef]
- Baghdadi, A.; Aldhaam, N.A.; Elsayed, A.S.; Hussein, A.A.; Cavuoto, L.A.; Kauffman, E.; Guru, K.A. Automated differentiation of benign renal oncocytoma and chromophobe renal cell carcinoma on computed tomography using deep learning. BJU Int. 2020, 125, 553–560. [Google Scholar] [CrossRef] [PubMed]
- Li, Y.; Huang, X.; Xia, Y.; Long, L. Value of radiomics in differential diagnosis of chromophobe renal cell carcinoma and renal oncocytoma. Abdom. Radiol. 2020, 45, 3193–3201. [Google Scholar] [CrossRef] [PubMed]
- Brennan, K.; Metzner, T.J.; Kao, C.-S.; Massie, C.E.; Stewart, G.D.; Haile, R.W.; Brooks, J.D.; Hitchins, M.P.; Leppert, J.T.; Gevaert, O. Development of a DNA Methylation-Based Diagnostic Signature to Distinguish Benign Oncocytoma from Renal Cell Carcinoma. JCO Precis. Oncol. 2020, 28, 1141–1151. [Google Scholar] [CrossRef] [PubMed]


| Characteristics | Data | Technique | Results | Prognosis | Reference |
|---|---|---|---|---|---|
| Different types of RCC | A set of 48 images uniformly distributed in 12 samples from each subclass | Segmentation, classification (multiclass Bayes classifier assuming multivariate Gaussian distributions) | Approximately 90% accuracy | - | [32] |
| Different types of RCC | 48 images, 12 for each subtype: CC, CH, ON and PA | The Harris corner detection method, Bayesian classifier | 83% accuracy | - | [33] |
| Different types of RCC | 79 RCC biopsy slides from 2015 to 2017 from DHMC, 917 whole-slide images of kidney cancer from TCGA | Annotation, creation of a deep neural network, patch extraction, classification | AUC of the classifier on the internal resection slides, internal biopsy slides and external TCGA slides were 0.98 (95% confidence interval (CI): 0.97–1.00), 0.98 (95% CI: 0.96–1.00) and 0.97 (95% CI: 0.96–0.98), respectively | - | [34] |
| Different types of RCC | TCGA slide images of RCC and normal tissues | Creation of CNN, patch extraction, classification (SVM), LASSO regression | Classification accuracy for clear cell and chromophobe RCC vs. normal tissue was 93.39% and 87.34%, respectively; 94.07% accuracy to identify the type of RCC | 13 tumor shape features and 6 nuclei shape features were signifcantly associated with patient survival | [26] |
| Different types of RCC | TCGA slide images of RCC (g 396 KIRC and 154 KIRP tumors) | Clusterization, CNN | Segmentation of tumor regions and other relevant histopathologic patterns (e.g., adenosquamous and poorly differentiated regions) Extraction of features generated subgroups enriched for clinically relevant subtypes and outcomes | Correlation was identified with survival outcomes and Fuhrman grading | [21] |
| Different types of RCC | 252 WSI of clear cell renal cell carcinoma (ccRCC), papillary renal cell carcinoma (pRCC), chromophobe renal cell carcinoma (chRCC), clear cell papillary renal cell carcinoma (ccpRCC), oncocytoma and metanephric adenoma | AI-based patch classifier | 85% accurate classification | - | [35] |
| Different types of RCC | Cases of clear cell RCC (27) and clear cell papillary RCC (14) from University of Louisville, Louisville, KY, USA | An ensemble pyramidal deep learning model that utilizes a hierarchy of three CNNs | Framework succeeded in classifying the four classes (pixel accuracy: 0.92) | - | [36] |
| The tumor microenvironment in different types of RCC | 83 primary renal tumors and matched metastatic or recurrence tissue samples (n = 15): papillary renal cell carcinoma (pRCC) types 1 (n = 20) and 2 (n = 49), collecting duct carcinomas (CDC; n = 14) and high-grade urothelial carcinomas (HGUC; n = 5) | The HALO random forest classifier | Number of CD3+ T cells was statistically significantly higher in CDC than in pRCC. CD68+ macrophages predominated in pRCC. | - | [25] |
| 4 grades of RCC (clear cell, papillary, chromophobe) based on Fuhrman classification | 160 RGB images of H&E-stained renal carcinoma tissue samples, 1316 color, shape, texture and topology features | Segmentation, classification (radial-basis kernel support vector machines) | 90.4% accuracy for Fuhrman grading | - | [19] |
| 4 grades of RCC (clear cell, papillary, chromophobe) based on Fuhrman classification | Normal (3000 samples) or RCC (12,168 samples) tissue samples from 42 patients from TCGA | Creation of CNN, patch extraction | 99.1% accurate identification of RCC tisue 97.5% accurate identification of RCC type 98.4% accurate Fuhrman grading | - | [20] |
| Characteristics | Data | Technique | Results | Prognosis | Reference |
|---|---|---|---|---|---|
| 4 grades of RCC (clear cell, papillary, chromophobe) based on Fuhrman classification | 160 RGB images of H&E-stained renal carcinoma tissue samples; 1316 color, shape, texture and topology features | Segmentation, classification (radial-basis kernel support vector machines) | 90.4% accuracy for Fuhrman grading | - | [18] |
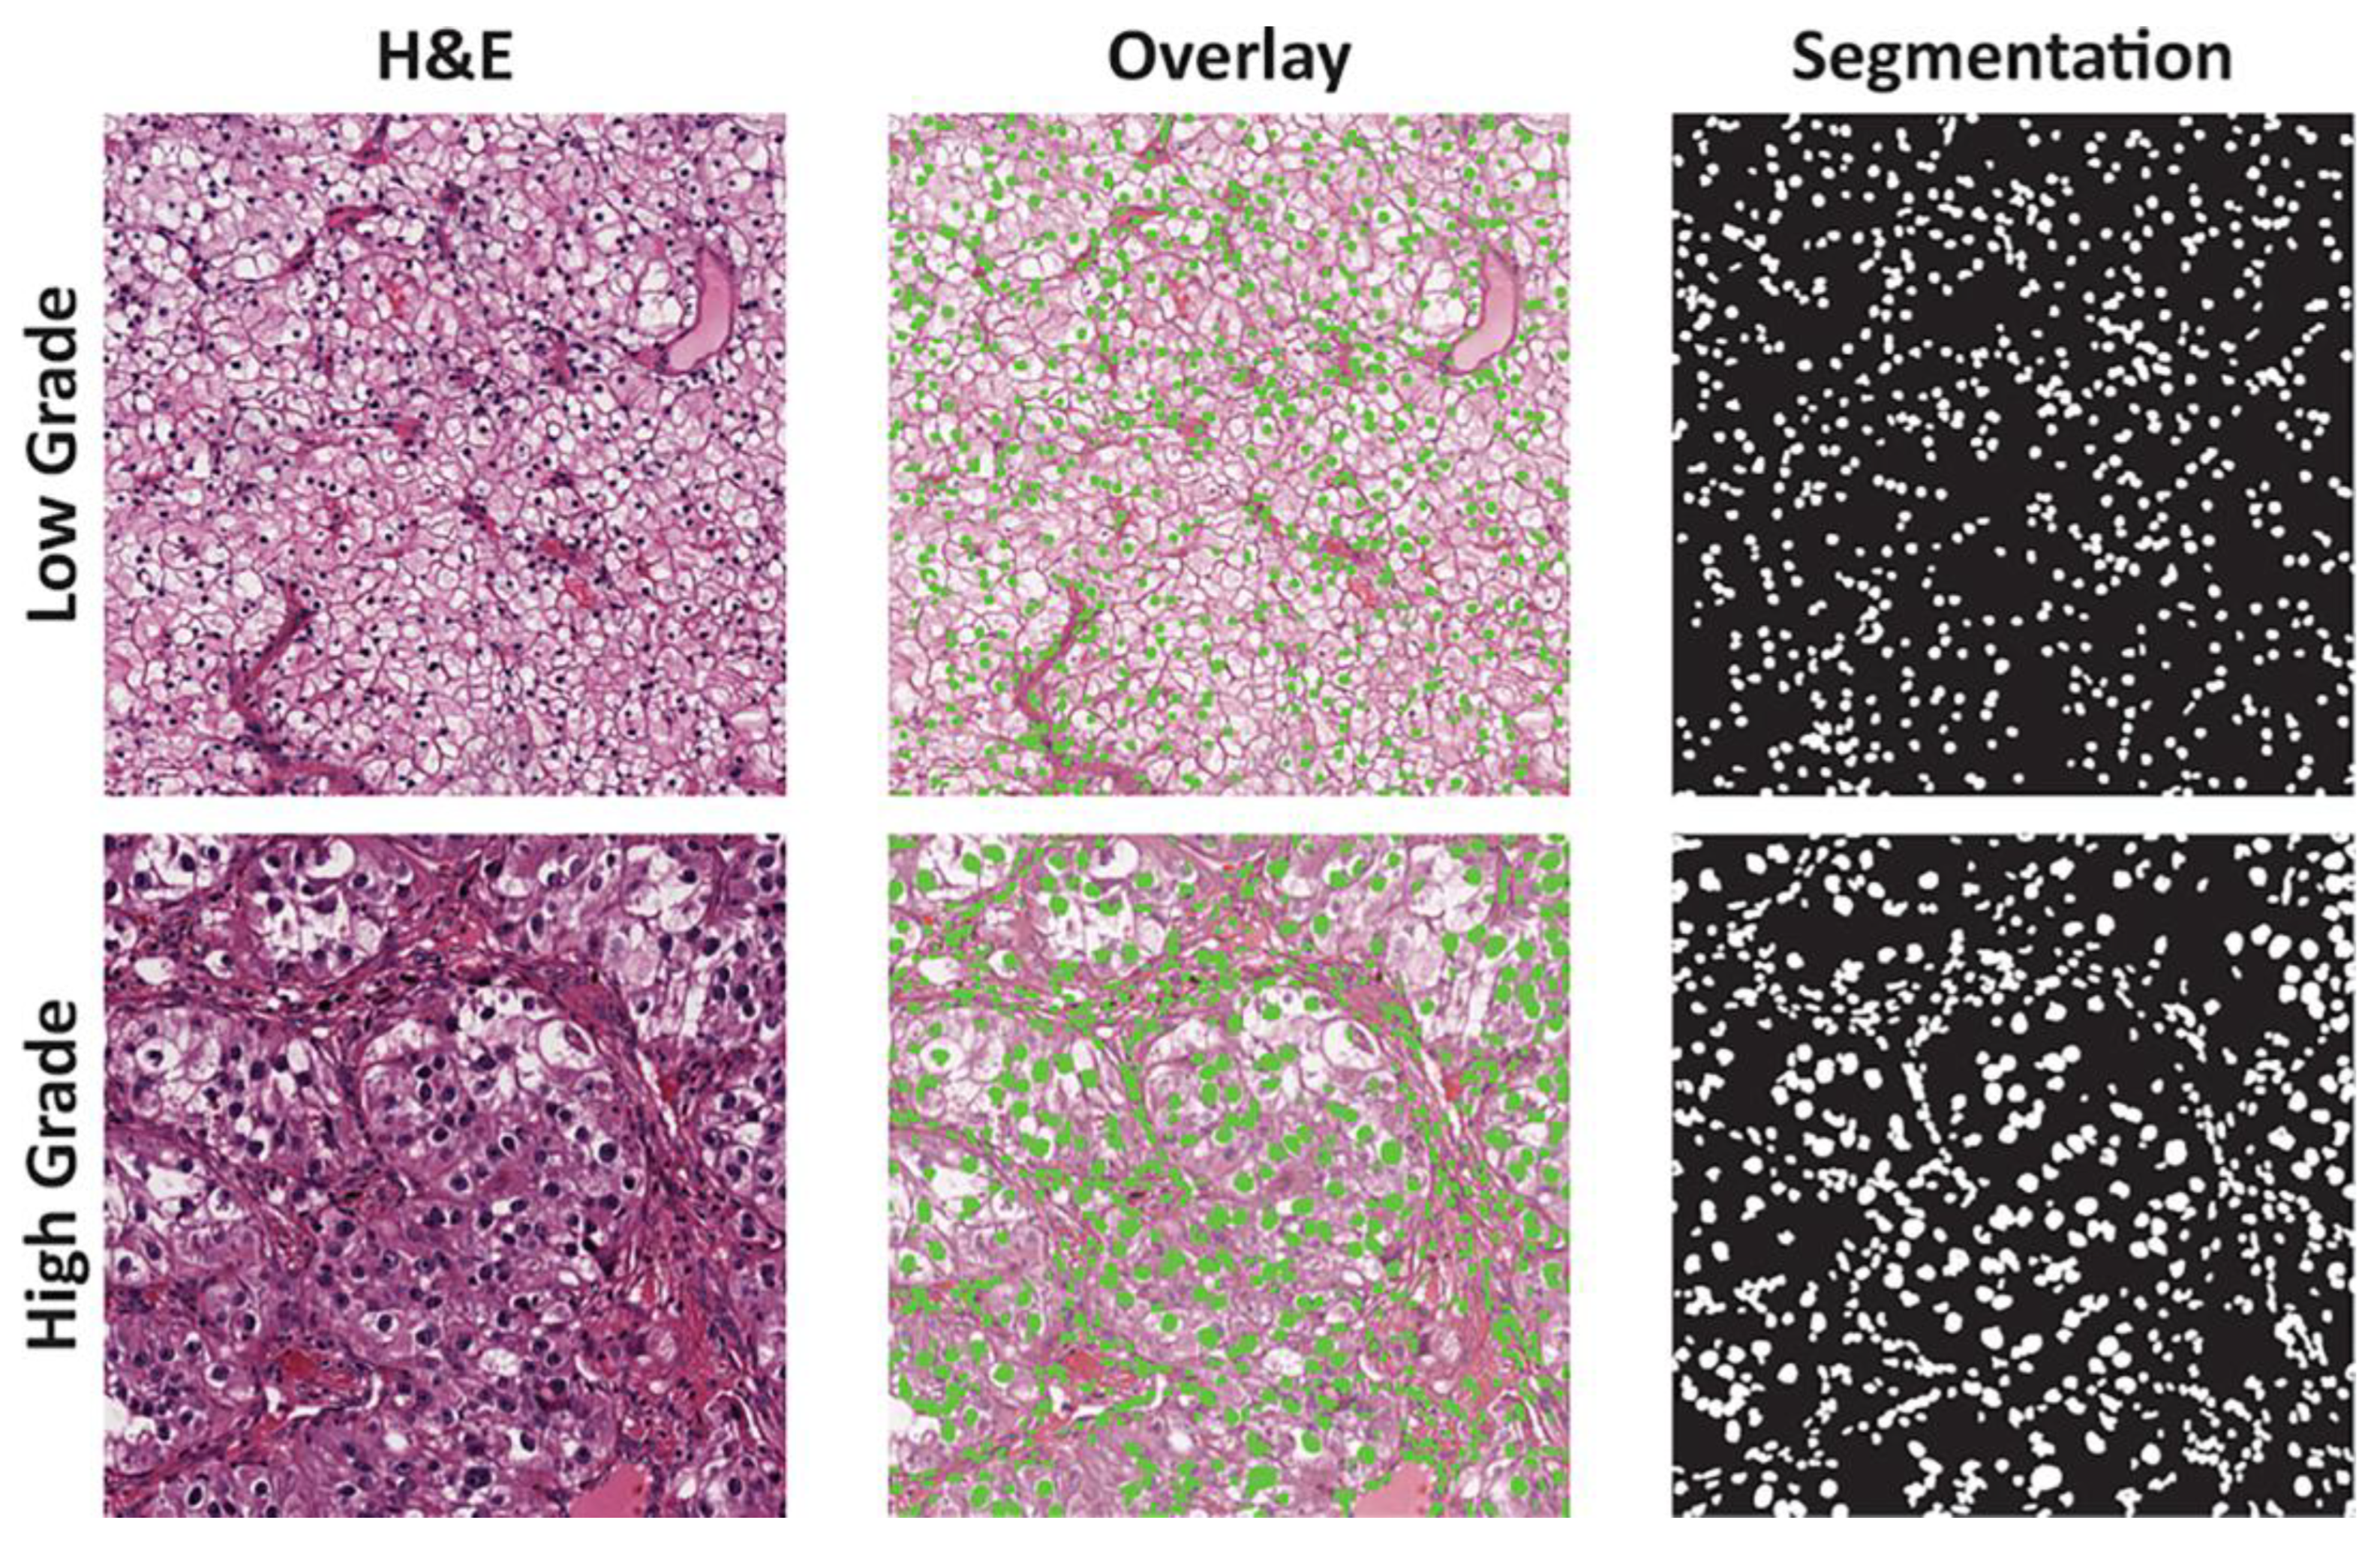
| High-grade (1, 2 Fuhrman grade) and low-grade (3, 4 Fuhrman grade) renal cell carcinoma | 395 WSI and clinical data of ccRCC cases from TCGA, 1895 ROI | Segmentation (thresholding + marker-controlled watershed-based), Creation of the automated 2-tiered grading system and developing machine learning, LASSO regression | The LASSO model consisted of 26 features (18 unique) and predicted grade with 84.6% sensitivity and 81.3% specificity in the test set | In the extended test set, predicted grade was significantly associated with overall survival after adjusting for age and gender (hazard ratio 2.05; 95% CI 1.21–3.47) | [14] |
| High-grade (1, 2 Fuhrman grade) and low-grade (3, 4 Fuhrman grade) renal cell carcinoma | 39 WSI of ccRCC cases from the archives at the University of Pittsburgh Medical Centre | Automatic stain recognition algorithm implemented in WS-Recognizer, classification (SVM) | The maximum nuclear size distinguished high-grade and low-grade tumors with a false-positive rate of 0.2 and a true-positive rate of 1.0. The area under the curve was 0.97, suggesting adequate sensitivity and specificity | - | [15] |
| High-grade (1, 2 Fuhrman grade) and low-grade (3, 4 Fuhrman grade) of renal cell carcinoma | 94 scans with ccRCC cases from Military Institute of Medicine, Warsaw, Poland; 3446 microscopic images of nuclei, extracted from these slides | Segmentation (wavelet transformation + watershed implementation), classification (SVM and RF) | Average accuracy of classification was 96.7%, sensitivity and specificity for each grade were different, ranging from 87.3 to 99.3% | - | [16] |
| High-grade (1, 2 Fuhrman grade) and low-grade (3, 4 Fuhrman grade) renal cell carcinoma | Histopathologic tissue slides of 59 patients with ccRCC who underwent surgery at Singapore General Hospital were assembled retrospectively | An automated image classification pipeline | The final classification was performed by a support vector machine and achieved F-scores ranging from 0.73 to 0.83 | Image score used by the pipeline, termed fraction value, correlated (R = 0.59) with an existing multigene-assay-based scoring system that has previously been demonstrated to be a strong indicator of prognosis in patients with ccRCC | [39] |
| Connecting histopathology imaging and proteomics in clear cell renal cell cancer | The proteomics data with 216 samples were downloaded from the CPTAC Data Portal. This dataset included complete information for 9964 proteins measured in 194 samples (84 normal, 110 tumor samples). The histology dataset was obtained from The Cancer Imaging Archive (TCIA) and included 783 slide images | CNN, fully connected neural network, classification | The proteomics-based classification model was capable of distinguishing between ccRCC and normal samples with an overall accuracy of 0.98 (10-fold CV results), as well as with high sensitivities and specificities (0.97 and 0.99 respectively). Histology-based classification model was capable of distinguishing between ccRCC and normal samples with an accuracy of 0.95 on the test dataset, as well as with high sensitivities and specificities (1 and 0.93 respectively) | The correlations between protein expression and image-based predictions were also concordant with the correlations between gene expression and image-based predictions, in particular for the strongest positive and negative correlations observed in each correlation setting | [19] |
| Deep learning model for prognosis prediction in ccRCC | The Cancer Genome Atlas cohort including 230 patients; the Mainz cohort including 18 patients with ccRCC | A new, comprehensive, multimodal deep learning model was developed | The model trained on the tiles achieved a mean C-index of 0.7169 ± 0.0296 with a maximum of 0.7638 and a mean C-index of 0.7424 ± 0.0339 with a maximum of 0.7821, respectively. When combining conventional histopathological input with CT and MRI images, the mean C-index increased to 0.7791 ± 0.0278 with a maximum of 0.8123 | The model showed the prognosis of ccRCC patients with a mean C-index of 0.7791 and a mean accuracy of 83.43% | [30] |
| Machine learning-based pathomics signature as a prognostic marker for patients with ccRCC | Clinical Proteomic Tumor Analysis Consortium (CPTAC) (59 patients); Shanghai General Hospital (146 patients); and The Cancer Genome Atlas (TCGA) (278 patients) | Segmentation, detection (watershed cell detection), an analysis pipeline, LASSO analysis | The mean follow-up duration of 26.4 ± 16.8, 54.9 ± 27.8 and 43.2 ± 30.6 months, respectively | Integration nomogram based on MLPS, tumor stage system and tumor grade system improved the current survival prediction accuracy for ccRCC patients, with area under curve values of 89.5%, 90.0%, 88.5% and 85.9% for 1-, 3-, 5- and 10-year disease-free survival prediction | [40] |
| Morphological differences between TFE3-RCC and ccRCC | Whole-slide images of 74 TFE3-RCC cases and 74 clear cell RCC cases from Indiana University, University of Michigan and TCGA | Segmentation (hierarchical multilevel thresholding), nucleus-level feature extraction and image-level feature extraction, classification (logistic regression, SVM with linear kernel, SVM with Gaussian kernel, and random forest) | Tests of the classification models on an external validation set revealed high accuracy with AUC ranging from 0.842 to 0.894 | - | [43] |
| Vascular phenotypes in renal cancer and predicting | 8 cases of ccRCC (H&E-stained digital slides with CD31 and CD45 antibodies), discovery cohort of 64 cases within the Cancer Genome Atlas (TCGA) | Annotation, classification (SVM, random forest, GLMNET) | Pixel-wise classification ultimately resulted in a binary (black and white) image of tumor vasculature that was assessed by referencing annotated images in a testing set (AUC = 0.79) | Two prediction models were built for 14 genes. Both models performed similarly to a previously reported, non-overlapping, 34 gene panel (Clear Code 34)33 (C-Index: Stage + CC34 = 0.75) | [23] |
| Prognostic and predictive value of tumor-infiltrating leukocytes and PD1, PDL1 in clear cell renal cell carcinoma | Tissue samples from 756 patients with primary ccRCC, treated at the Department of Urology at the University of Heidelberg | Image Analysis with HALO | Univariate survival analysis revealed that increased tumor-infiltrating B-cells, T-cells and PD-1-positive cells were significantly associated with favorable cancer-specific survival and high levels of intratumoral granulocytes, macrophages, cytotoxic T-cells and PD-L1 were significantly associated with poor cancer-specific survival | In patients responding to nivolumab therapy, significantly higher densities of CD3-positive T-cells, PD-1-positive tumor-specific T cells and cytotoxic T lymphocytes were observed in tumor centers and invasive margins compared to nonresponders and mixed responders (p < 0.01). Density of PD-L1-positive cells in the invasive margin also showed a tendency to be higher in responders, though not statistically significant (p = 0.2) | [41] |
| Tumor microenvironment of clear cell renal cell carcinoma | Tissue samples from 150 patients who were diagnosed with ccRCC from the pathology archive in Edinburgh | Definiens Tissue Studio, Indica Labs Halo AI software | We found that coexpression of cancer stem cell and epithelial-to-mesenchymal transition markers such as OCT4 and ZEB1 were indicative of poor outcome. OCT4 and the immune markers CD8, CD34 and CD163 significantly stratified patients at intermediate phase of treatment | Analysis showed that a combination of PD1+ T cells and ZEB1 predicted 5-year survival, whereas these two features did not reach statistical significance alone | [42] |
| Characteristics | Data | Technique | Results | Prognosis | Reference |
|---|---|---|---|---|---|
| Topological features in renal tumor microenvironment associated with patient survival | 190 WSI from TCGA, 856 ROIs in total | Nucleus segmentation and patch extraction, creation of stacked sparse autoencoder, LASSO-regularized Cox regression model (LASSO–Cox model) | Recall was (4159 − 168)/4082 = 97.77%, and precision was (4159 − 168)/4159 = 95.96% | Patients with pRCC type 2 have worse prognosis than those with pRCC type 1 (log-rank test p = 0.00946). Patient stratification using the predicted risk index provided the best prognosis prediction AUCs for 5-year survival for stage and subtype of 0.63 and 0.66, respectively | [17] |
| Characteristics | Data | Technique | Results | Prognosis | Reference |
|---|---|---|---|---|---|
| Types of chromophobe renal cell carcinoma and their chromosomal losses | 42 Swiss chRCCs, 119 Japanese chRCCs and whole-slide digital images of 66 chRCCs from the Cancer Genome Atlas (TCGA) | Statistical analysis (Cox regression analysis, Kaplan–Meier analysis, Fisher’s exact test) | Classic chRCC showed significantly more chromosome 2 (p < 0.05), and chromosome 6 losses (p < 0.01) than eosinophilic RCC | chRCCs without any CN loss of chromosome 1, 2, 6, 10, 13, 17, 21 groups revealed 100% survival in the combined Swiss/TCGA-KICH cohorts | [46] |
Disclaimer/Publisher’s Note: The statements, opinions and data contained in all publications are solely those of the individual author(s) and contributor(s) and not of MDPI and/or the editor(s). MDPI and/or the editor(s) disclaim responsibility for any injury to people or property resulting from any ideas, methods, instructions or products referred to in the content. |
© 2023 by the authors. Licensee MDPI, Basel, Switzerland. This article is an open access article distributed under the terms and conditions of the Creative Commons Attribution (CC BY) license (https://creativecommons.org/licenses/by/4.0/).
Share and Cite
Ivanova, E.; Fayzullin, A.; Grinin, V.; Ermilov, D.; Arutyunyan, A.; Timashev, P.; Shekhter, A. Empowering Renal Cancer Management with AI and Digital Pathology: Pathology, Diagnostics and Prognosis. Biomedicines 2023, 11, 2875. https://doi.org/10.3390/biomedicines11112875
Ivanova E, Fayzullin A, Grinin V, Ermilov D, Arutyunyan A, Timashev P, Shekhter A. Empowering Renal Cancer Management with AI and Digital Pathology: Pathology, Diagnostics and Prognosis. Biomedicines. 2023; 11(11):2875. https://doi.org/10.3390/biomedicines11112875
Chicago/Turabian StyleIvanova, Elena, Alexey Fayzullin, Victor Grinin, Dmitry Ermilov, Alexander Arutyunyan, Peter Timashev, and Anatoly Shekhter. 2023. "Empowering Renal Cancer Management with AI and Digital Pathology: Pathology, Diagnostics and Prognosis" Biomedicines 11, no. 11: 2875. https://doi.org/10.3390/biomedicines11112875
APA StyleIvanova, E., Fayzullin, A., Grinin, V., Ermilov, D., Arutyunyan, A., Timashev, P., & Shekhter, A. (2023). Empowering Renal Cancer Management with AI and Digital Pathology: Pathology, Diagnostics and Prognosis. Biomedicines, 11(11), 2875. https://doi.org/10.3390/biomedicines11112875