
Effect of Probiotic Therapy on Neuropsychiatric Manifestations in Children with Multiple Neurotransmitter Disorders: A Study
 and
and
Abstract
:
1. Introduction
2. Materials and Methods
2.1. Clinical Analysis
2.2. Paraclinical Analysis
2.3. Statistical Analysis
3. Results
3.1. Neurotransmitter Levels
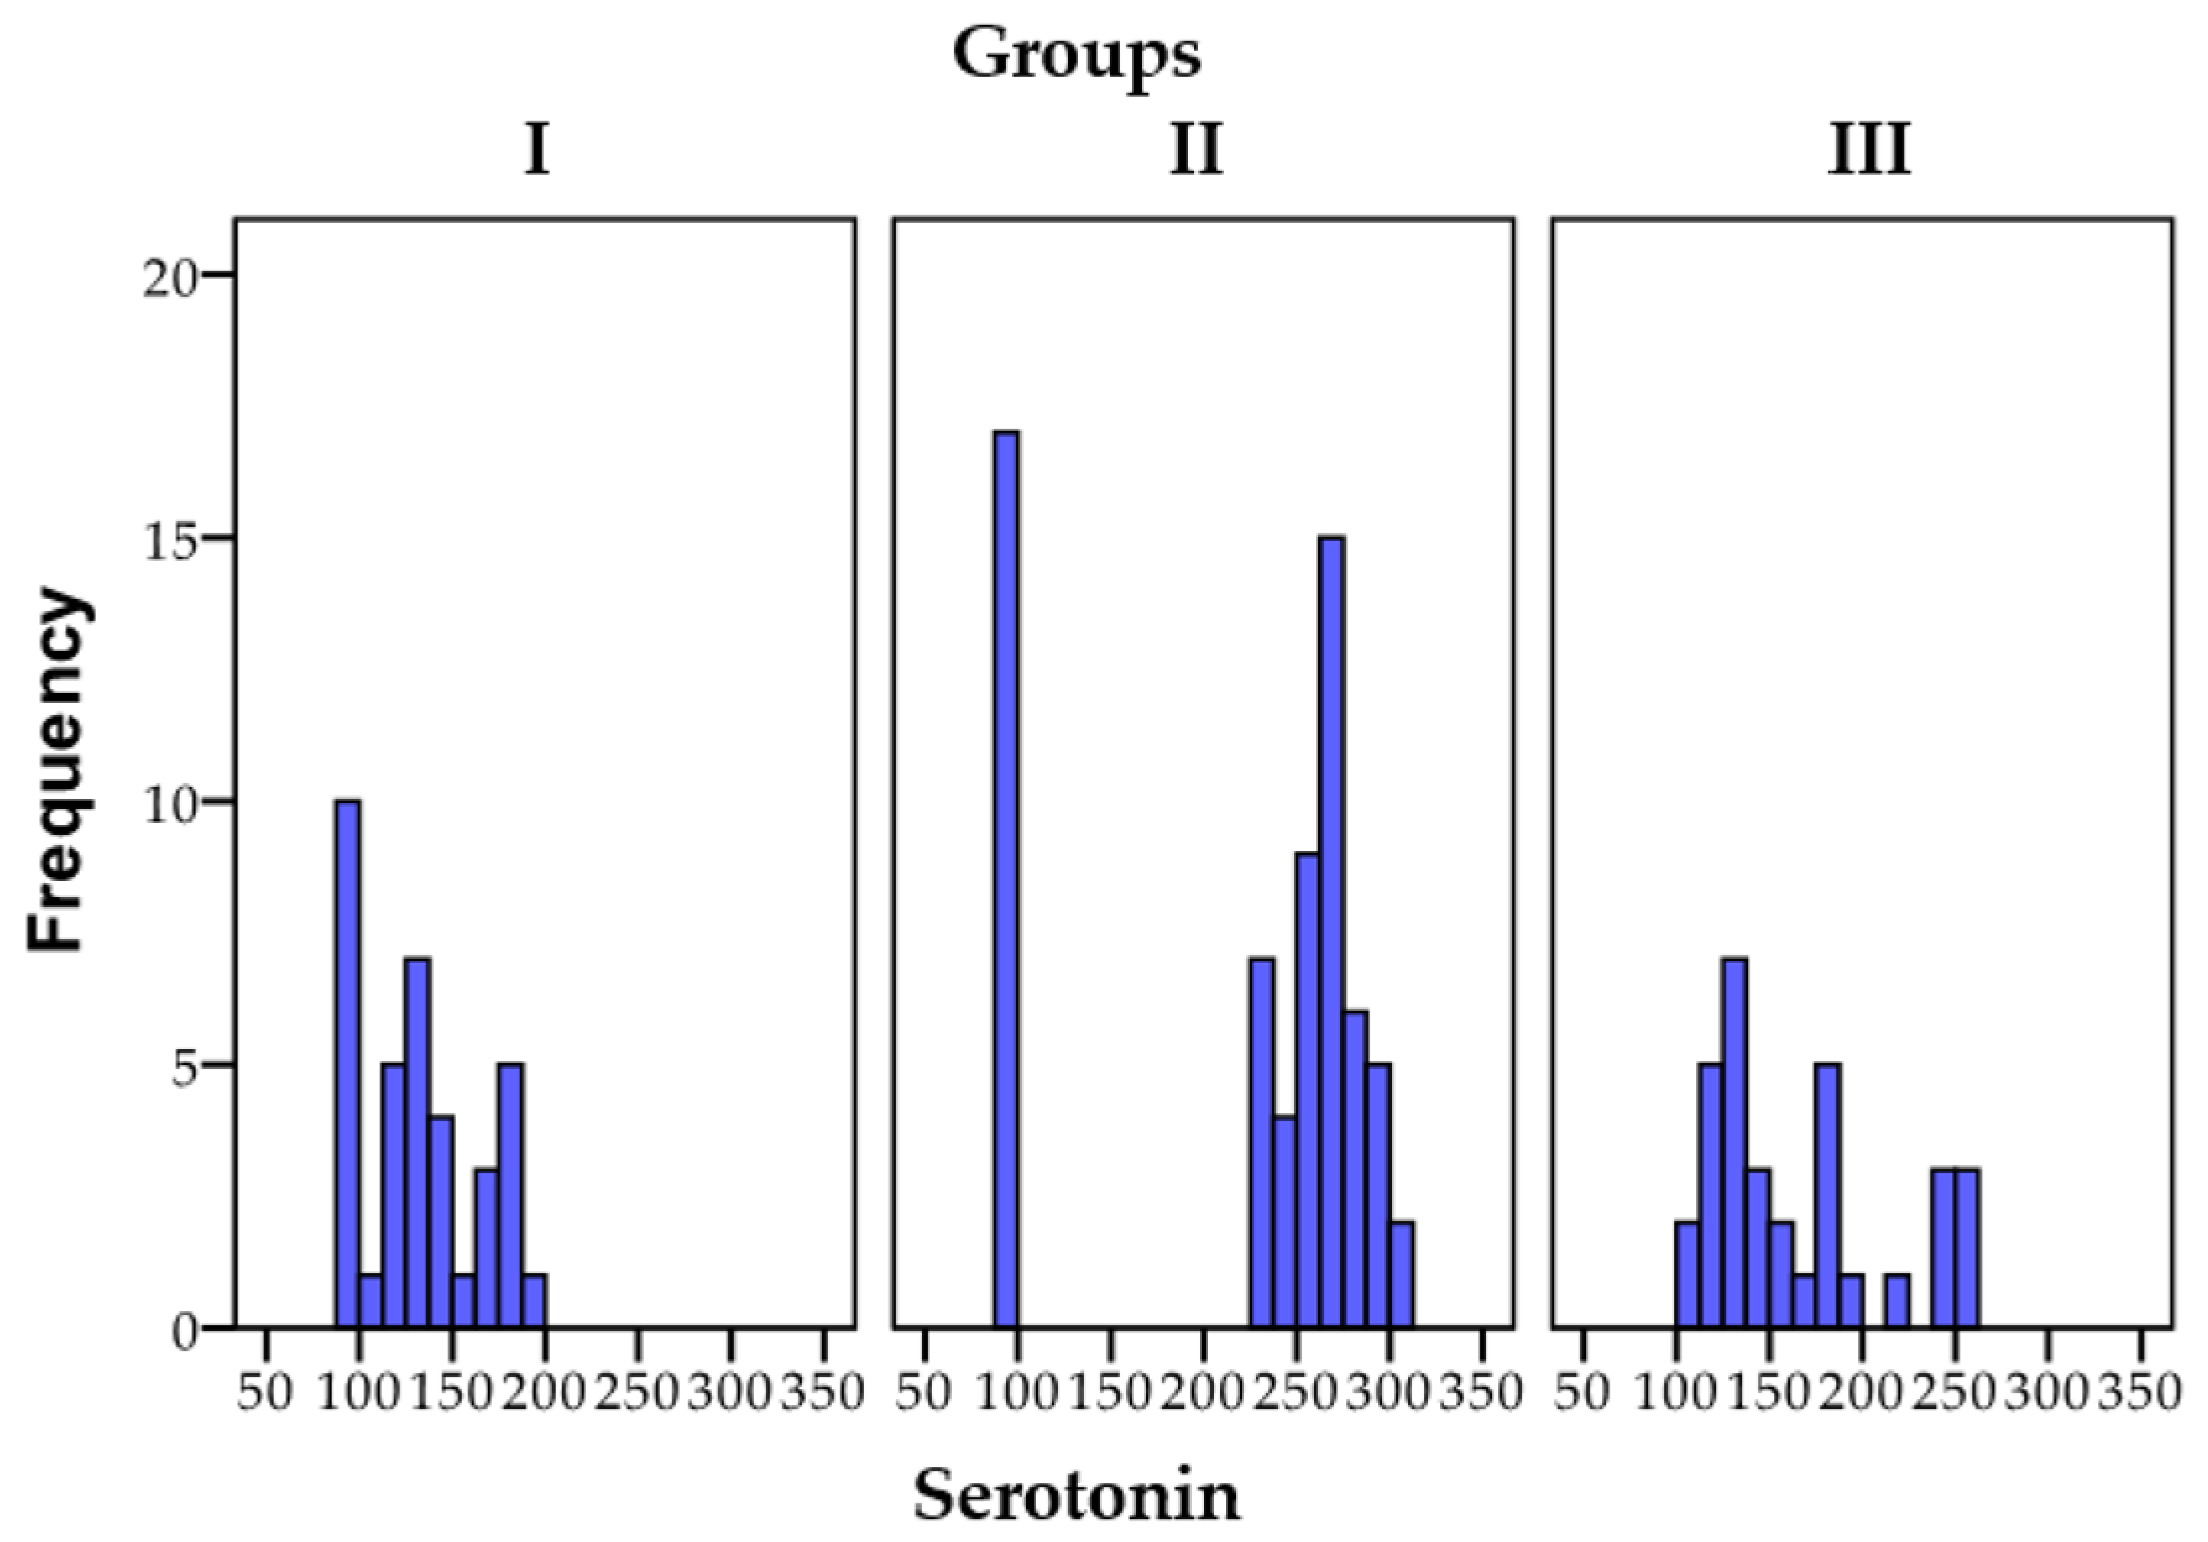
3.1.1. Serotonin
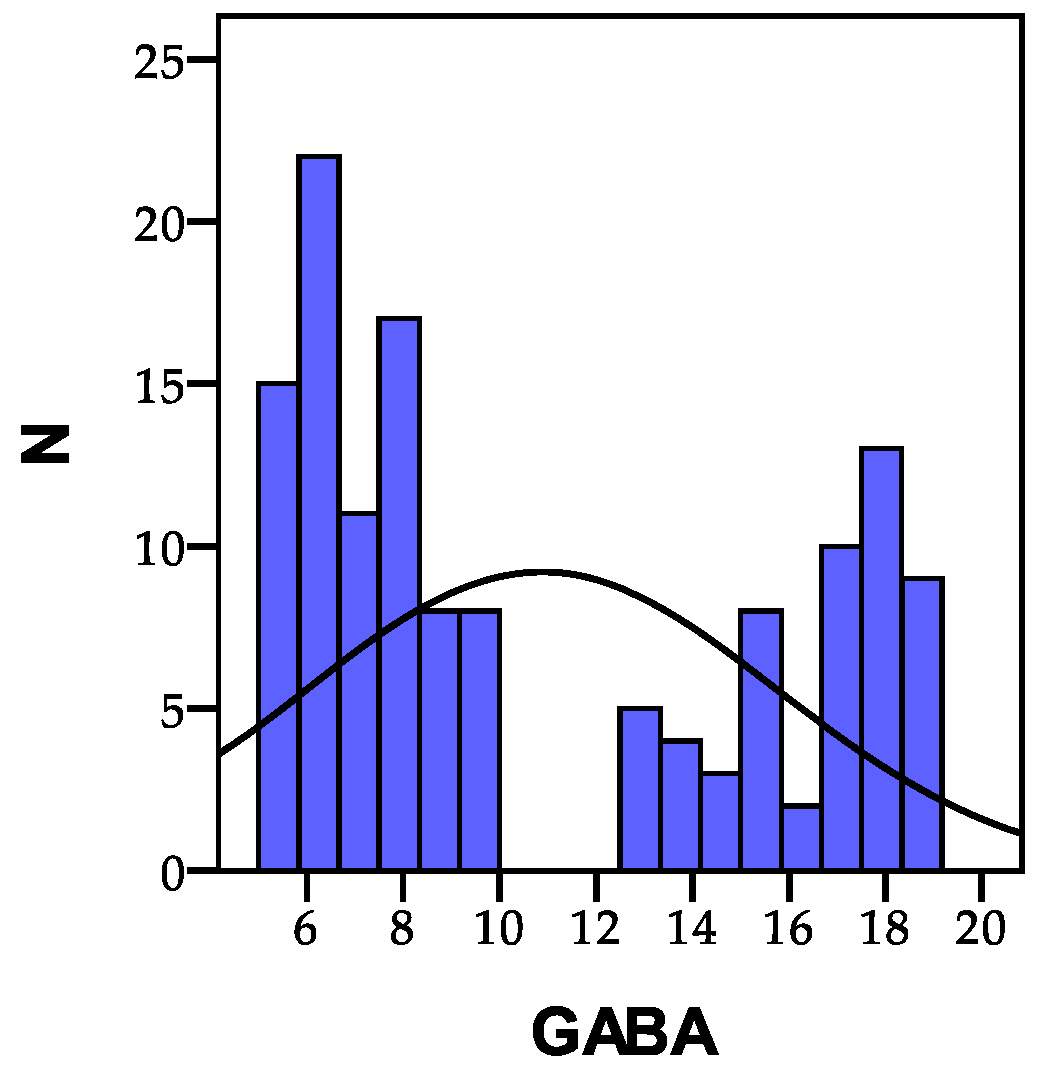
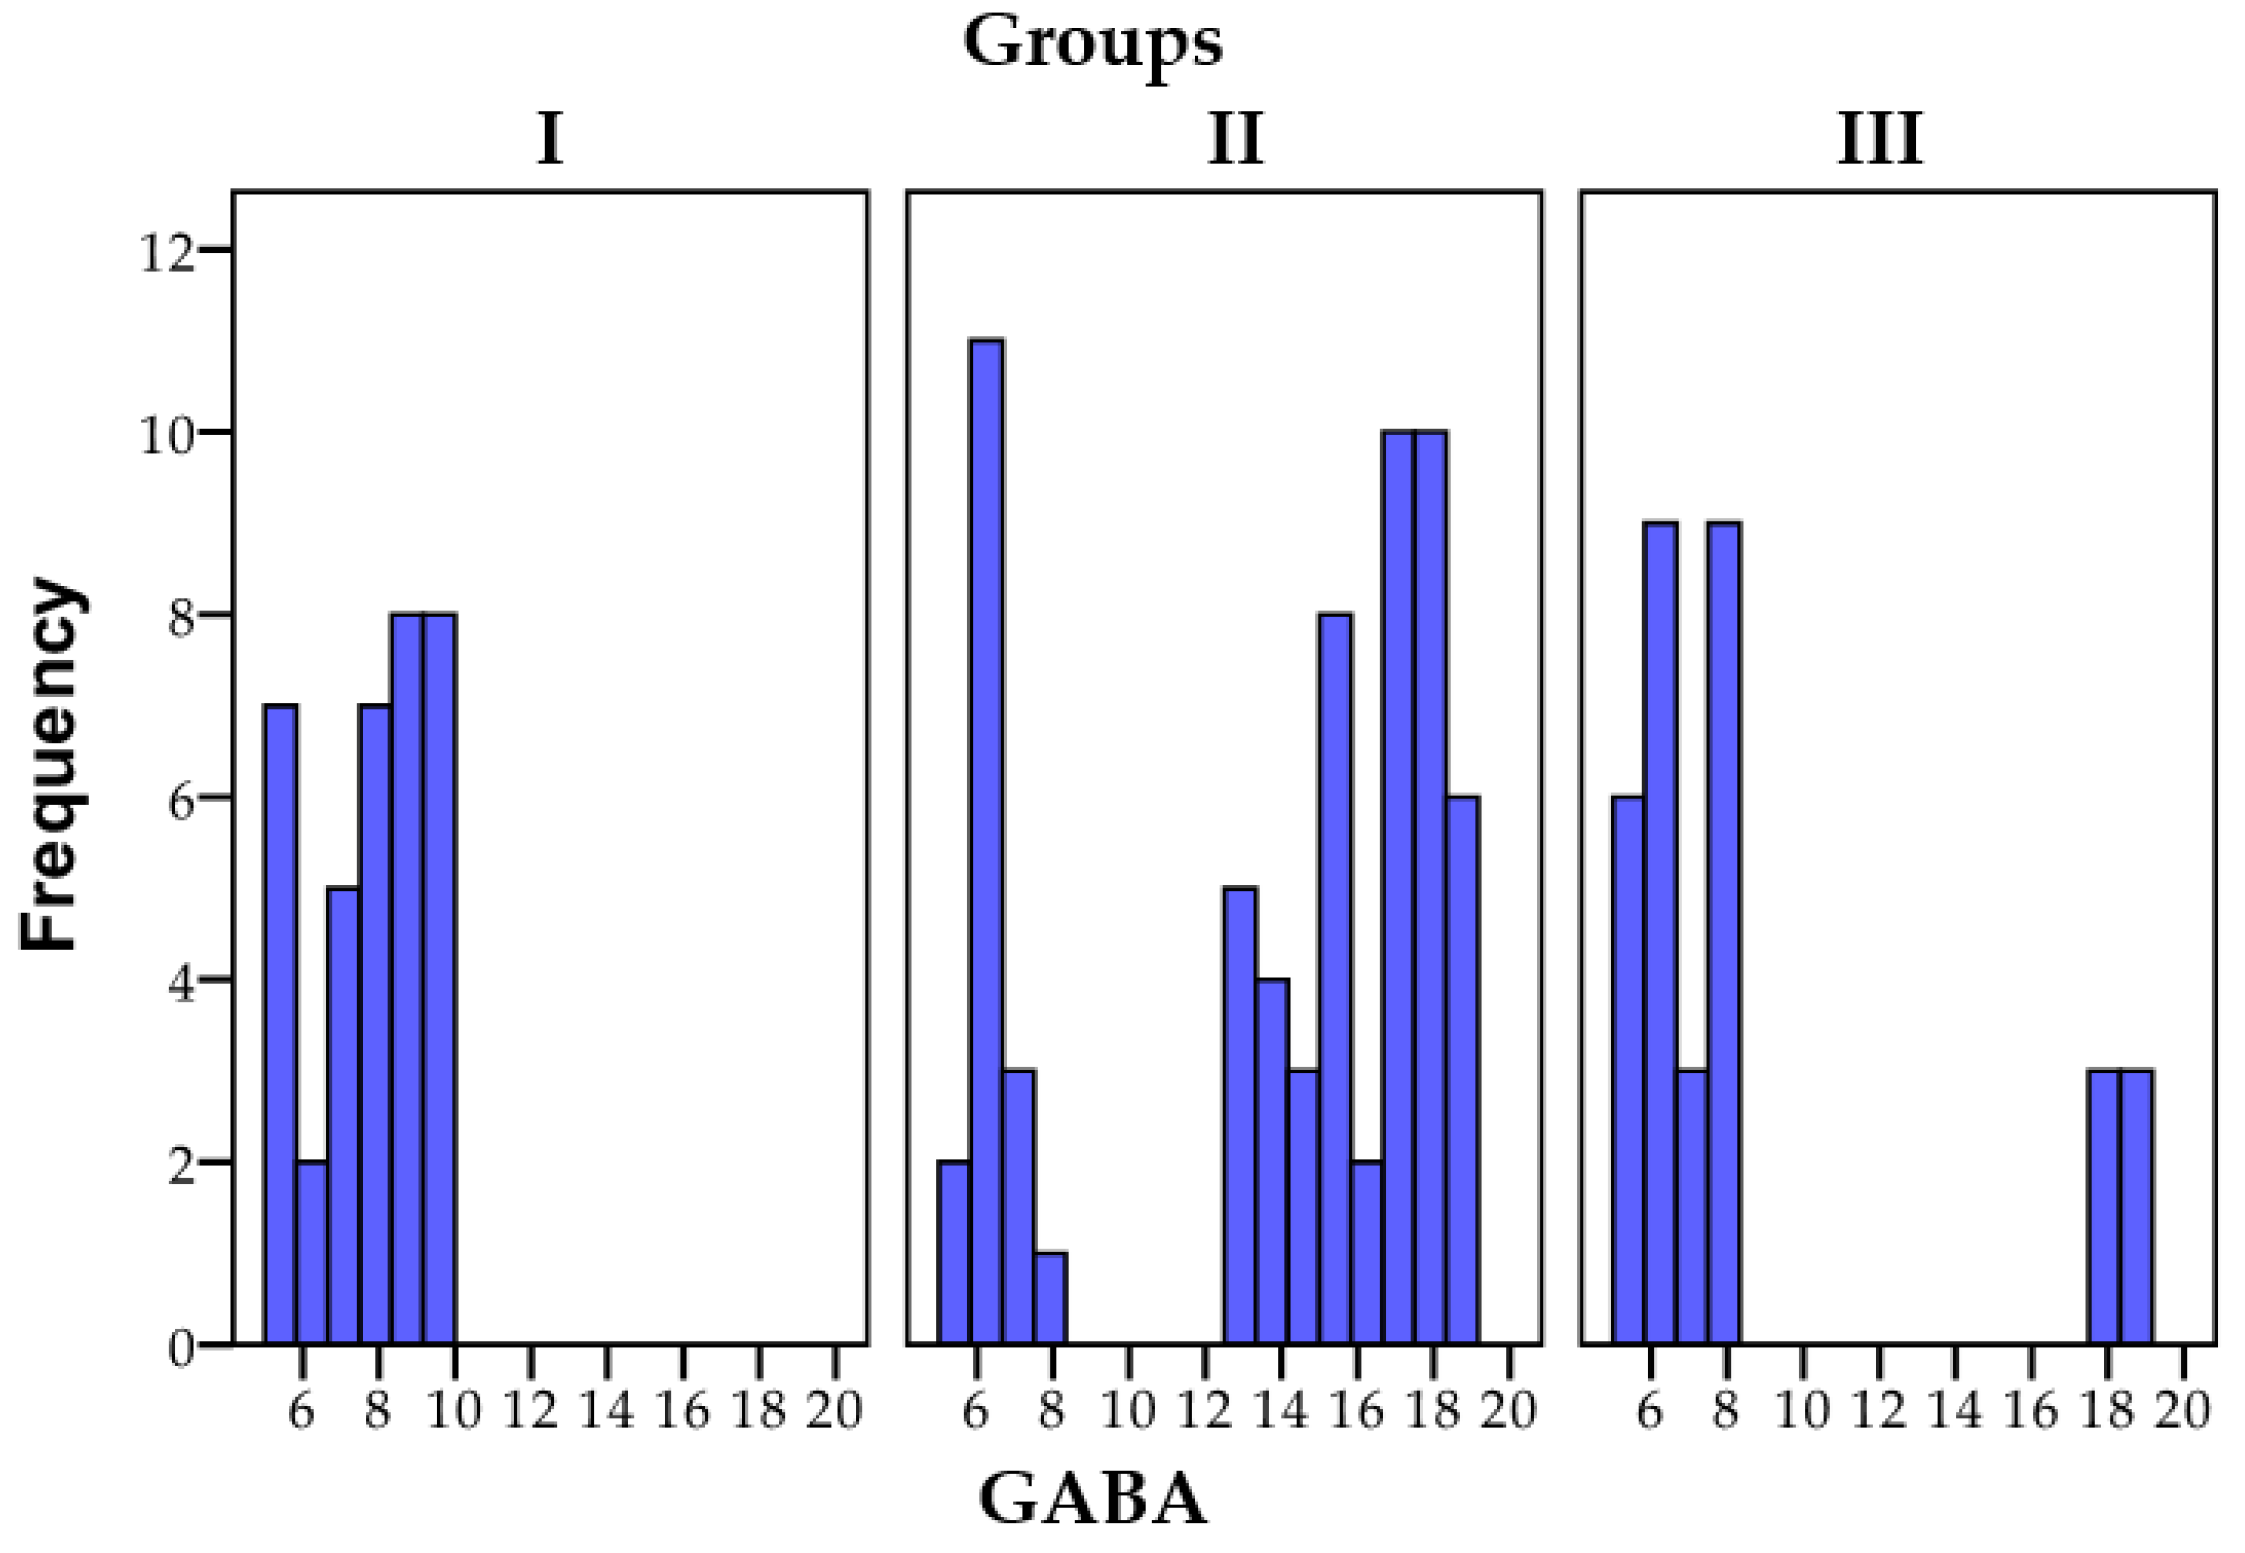
3.1.2. GABA
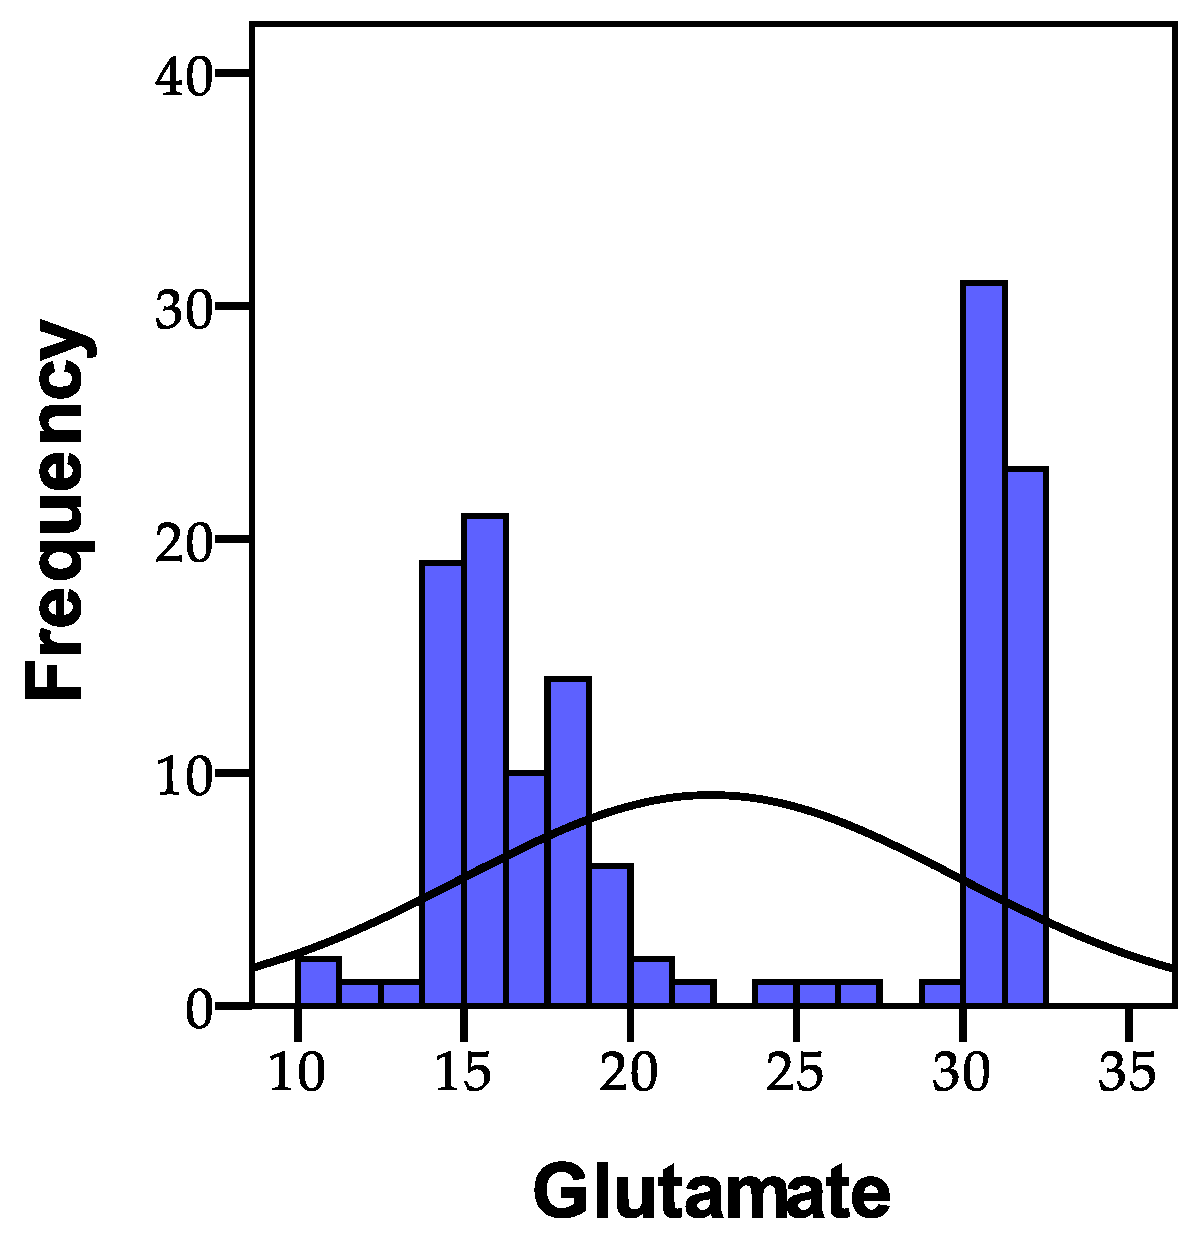
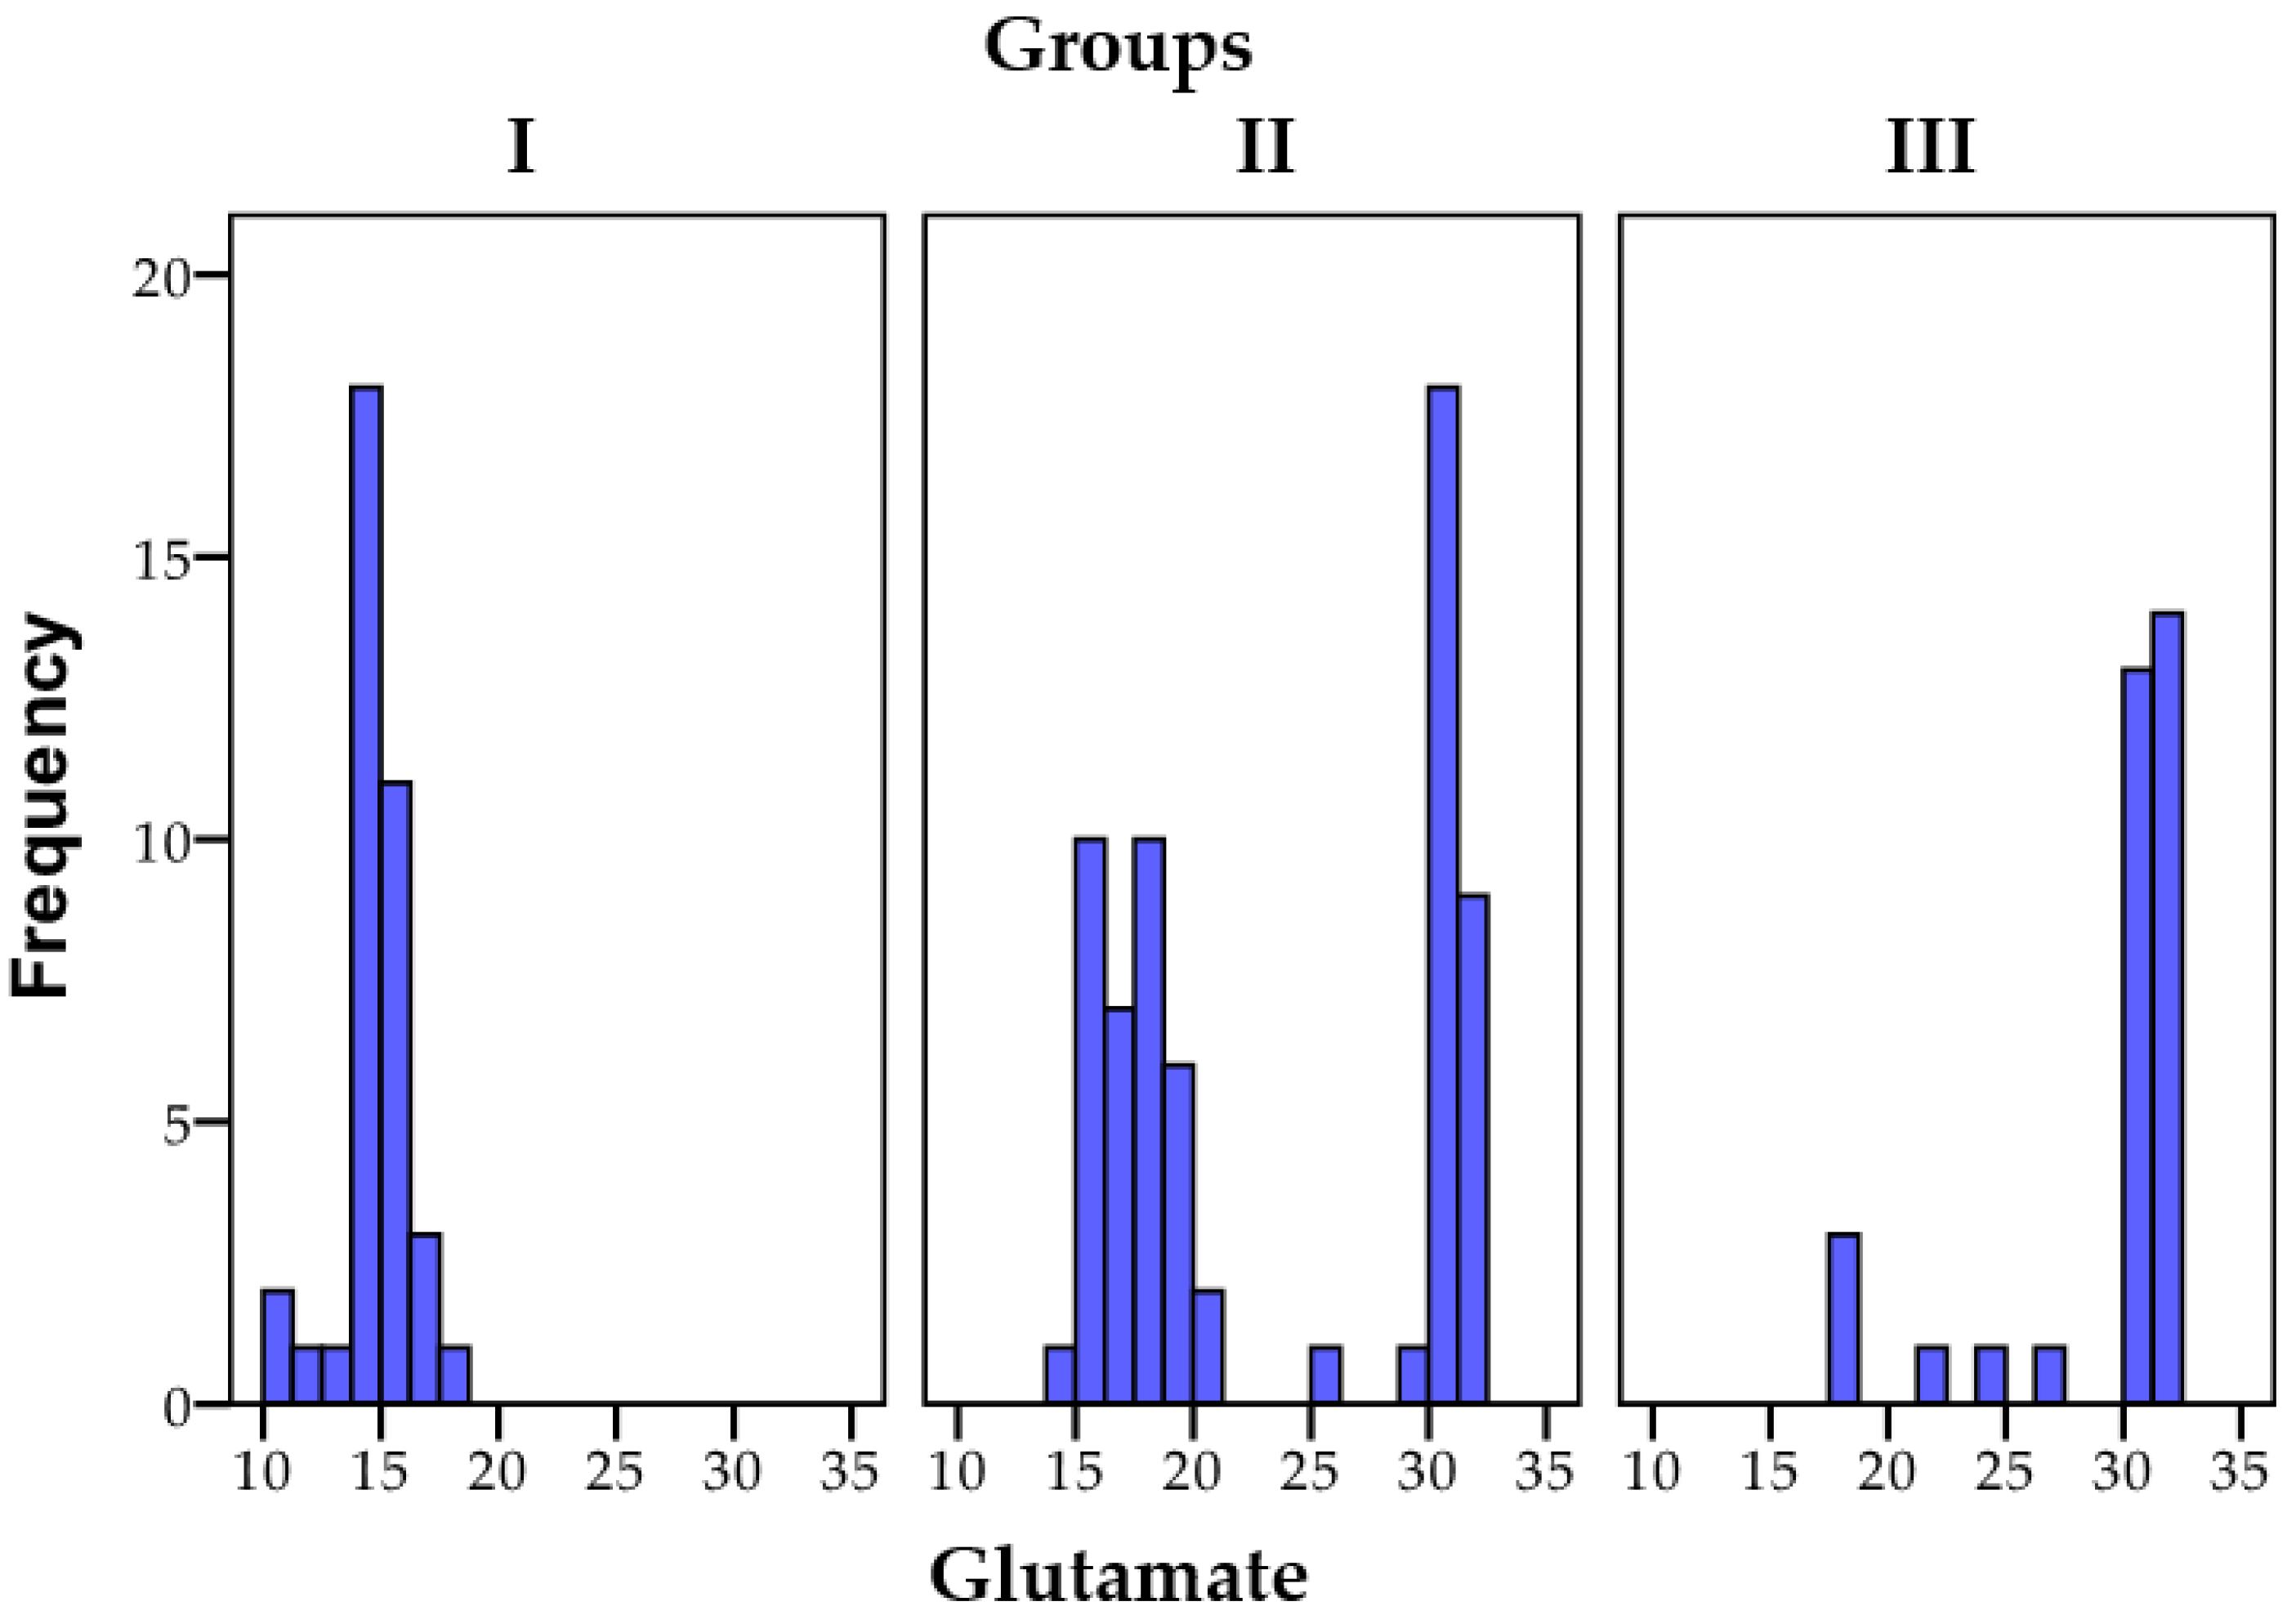
3.1.3. Glutamate
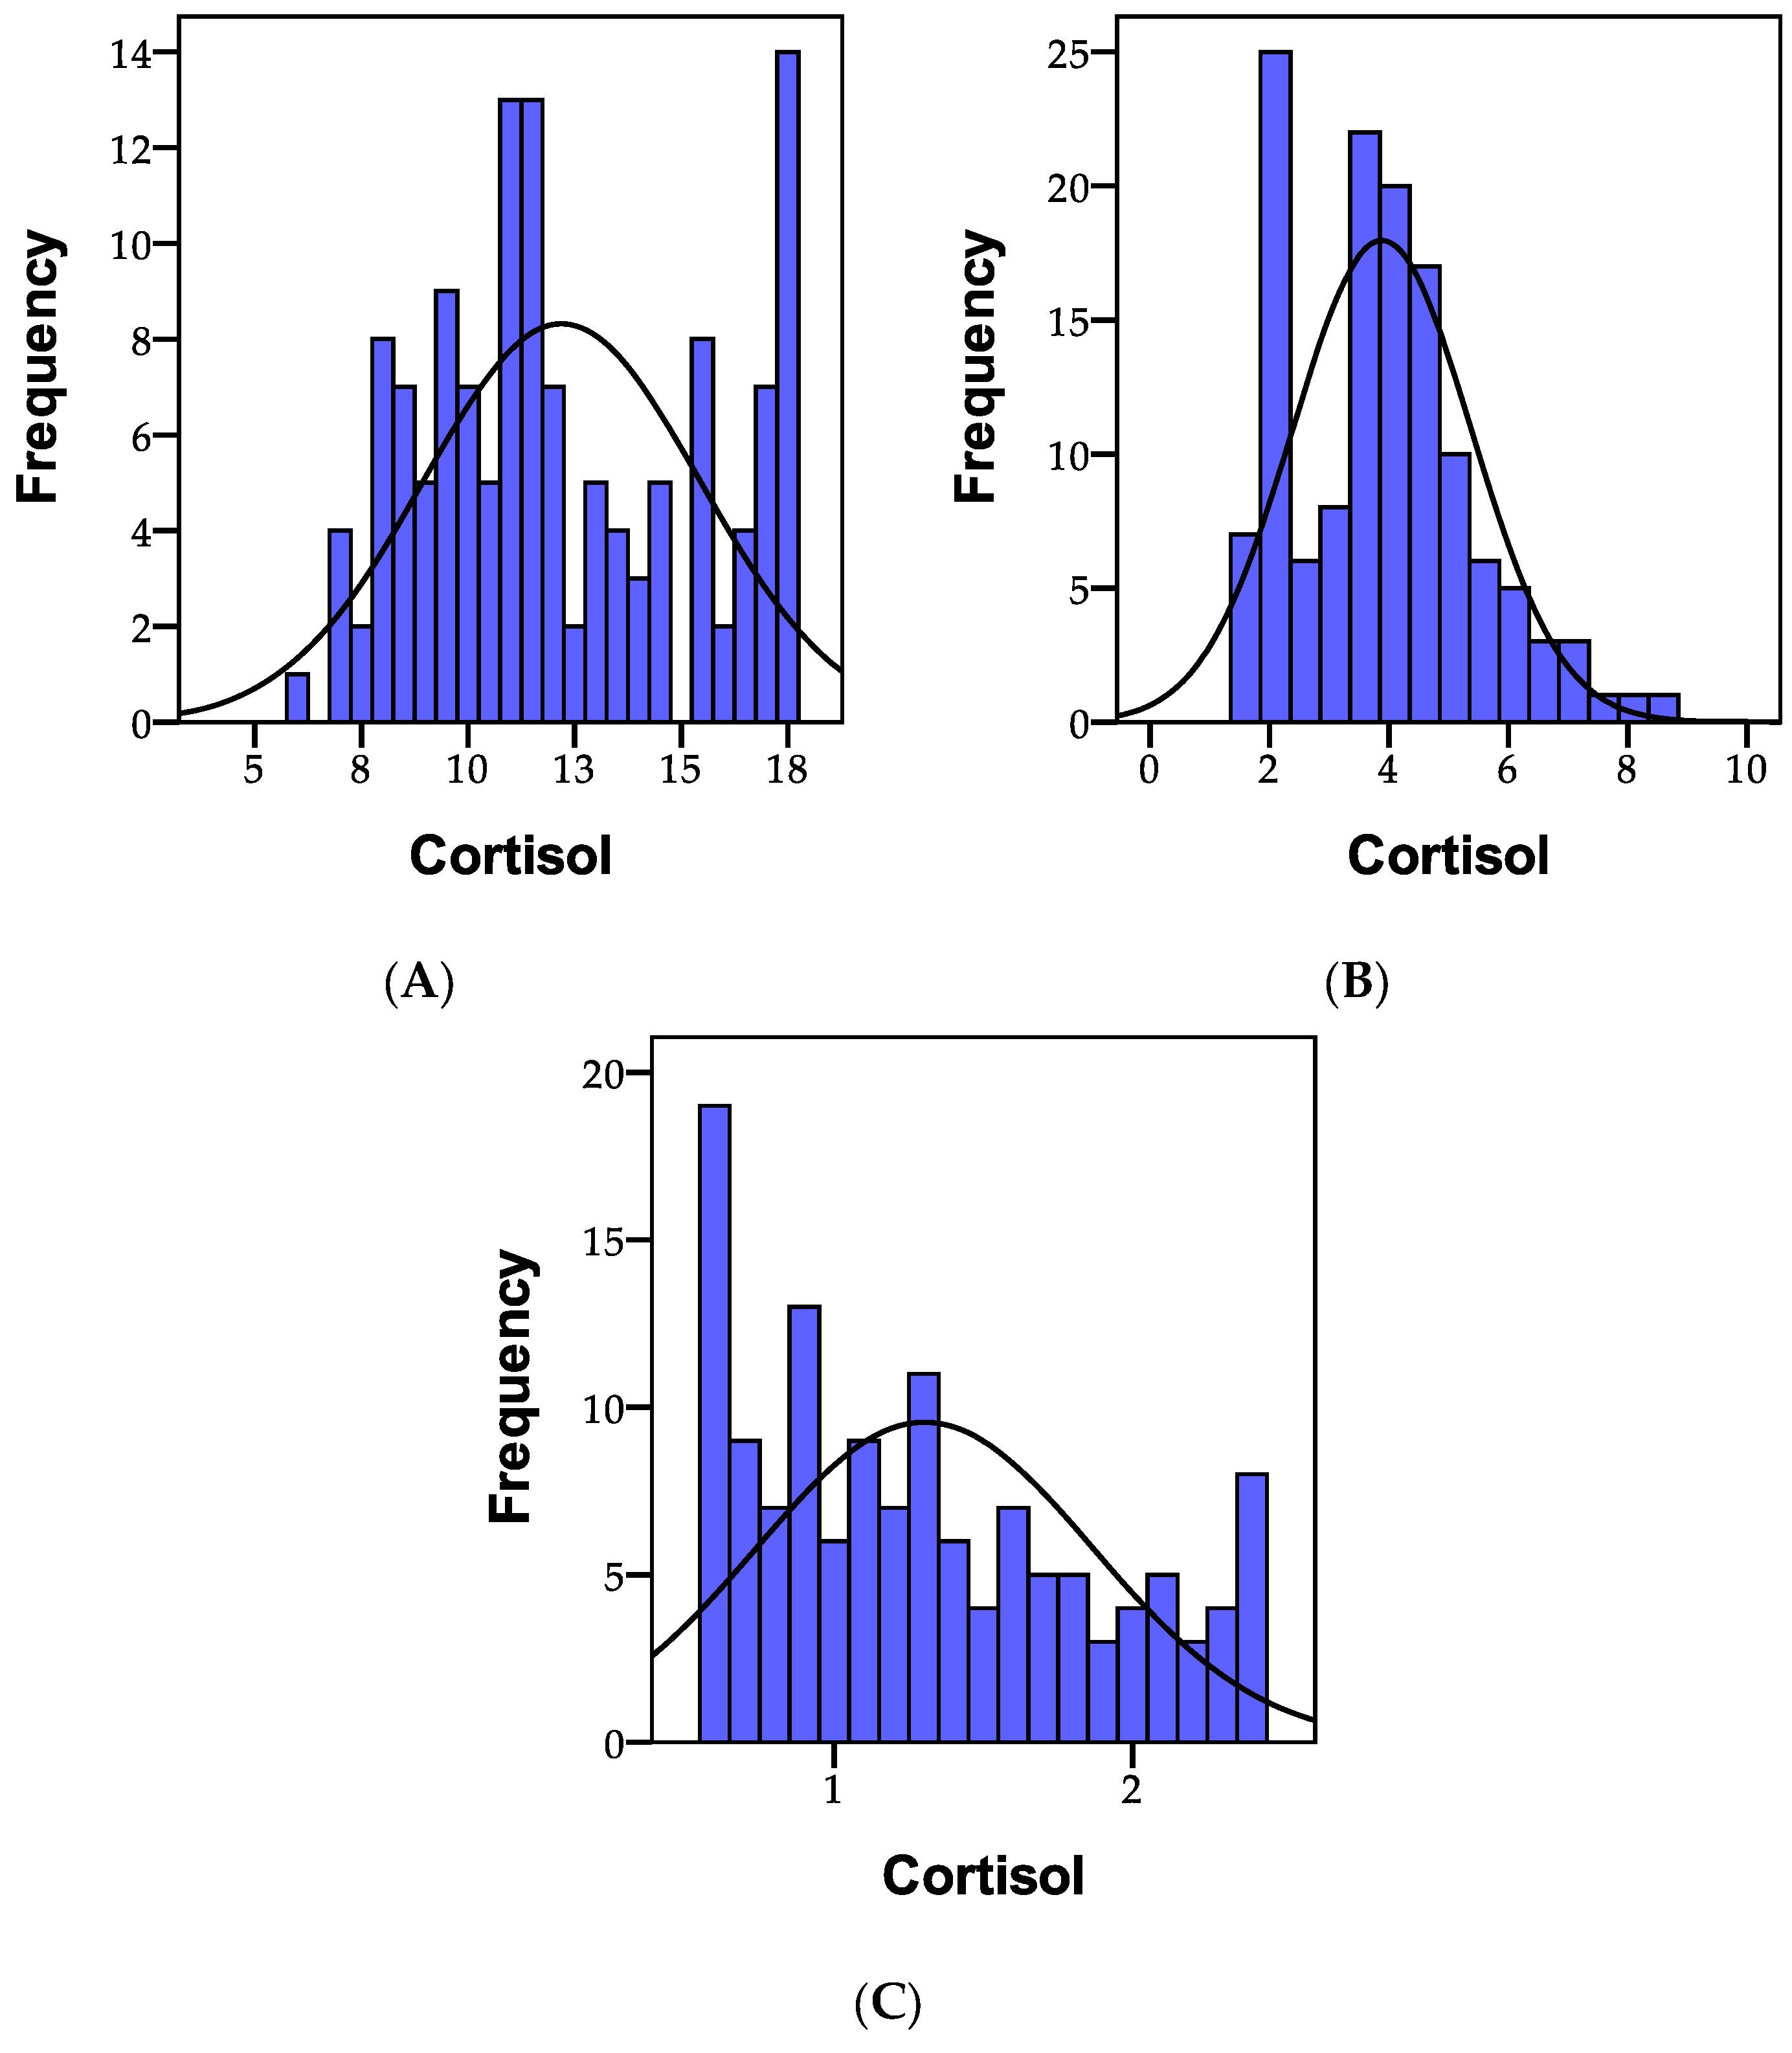
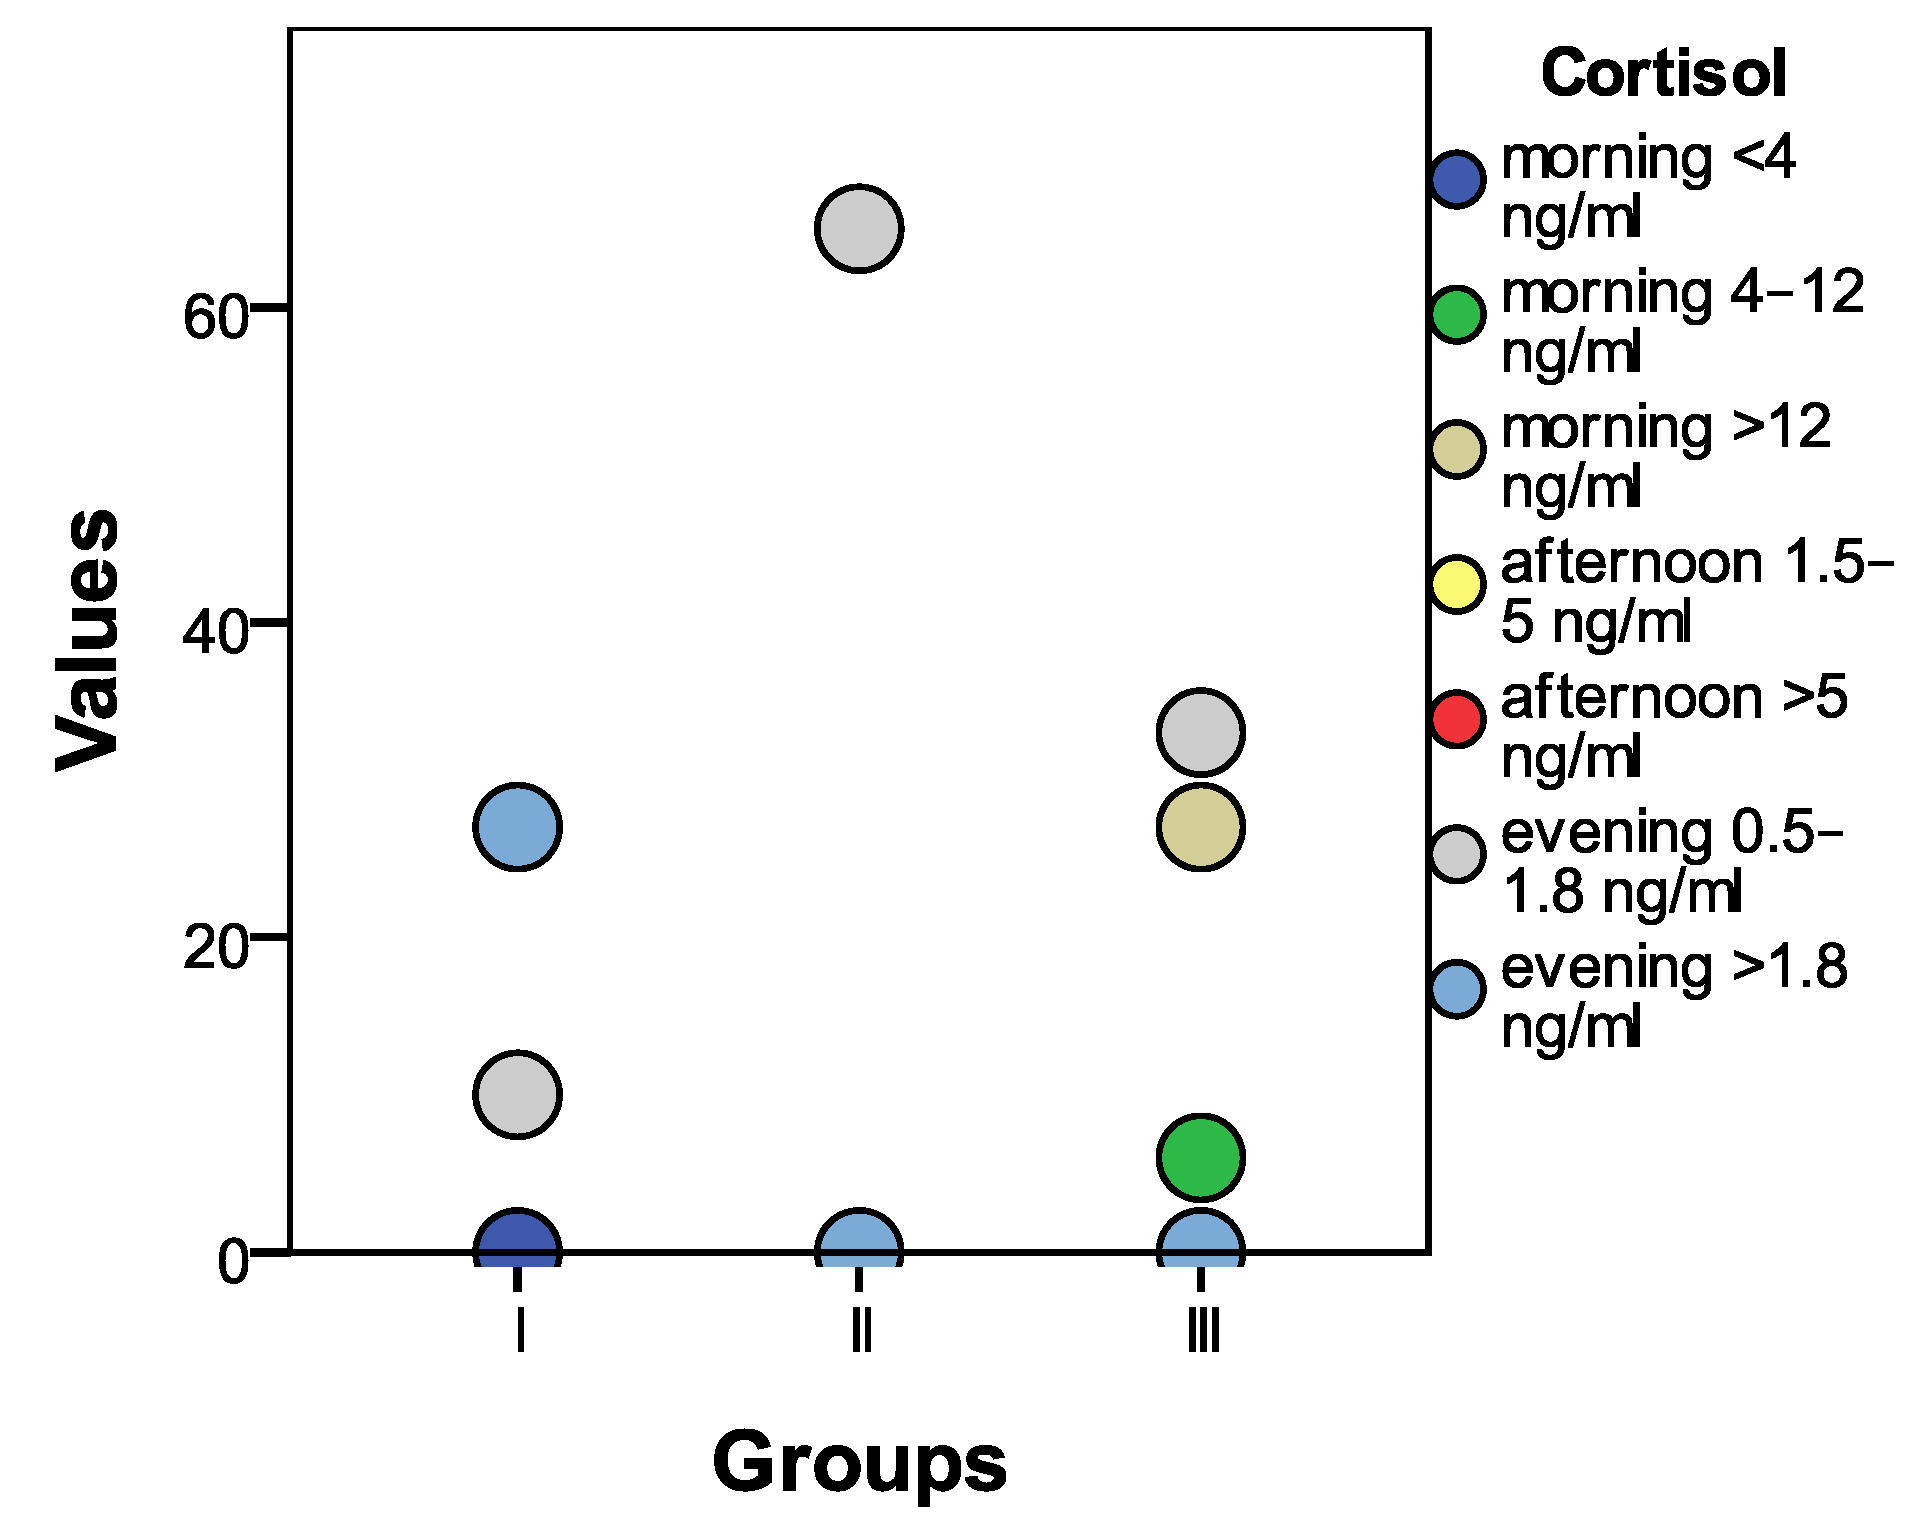
3.1.4. Cortisol
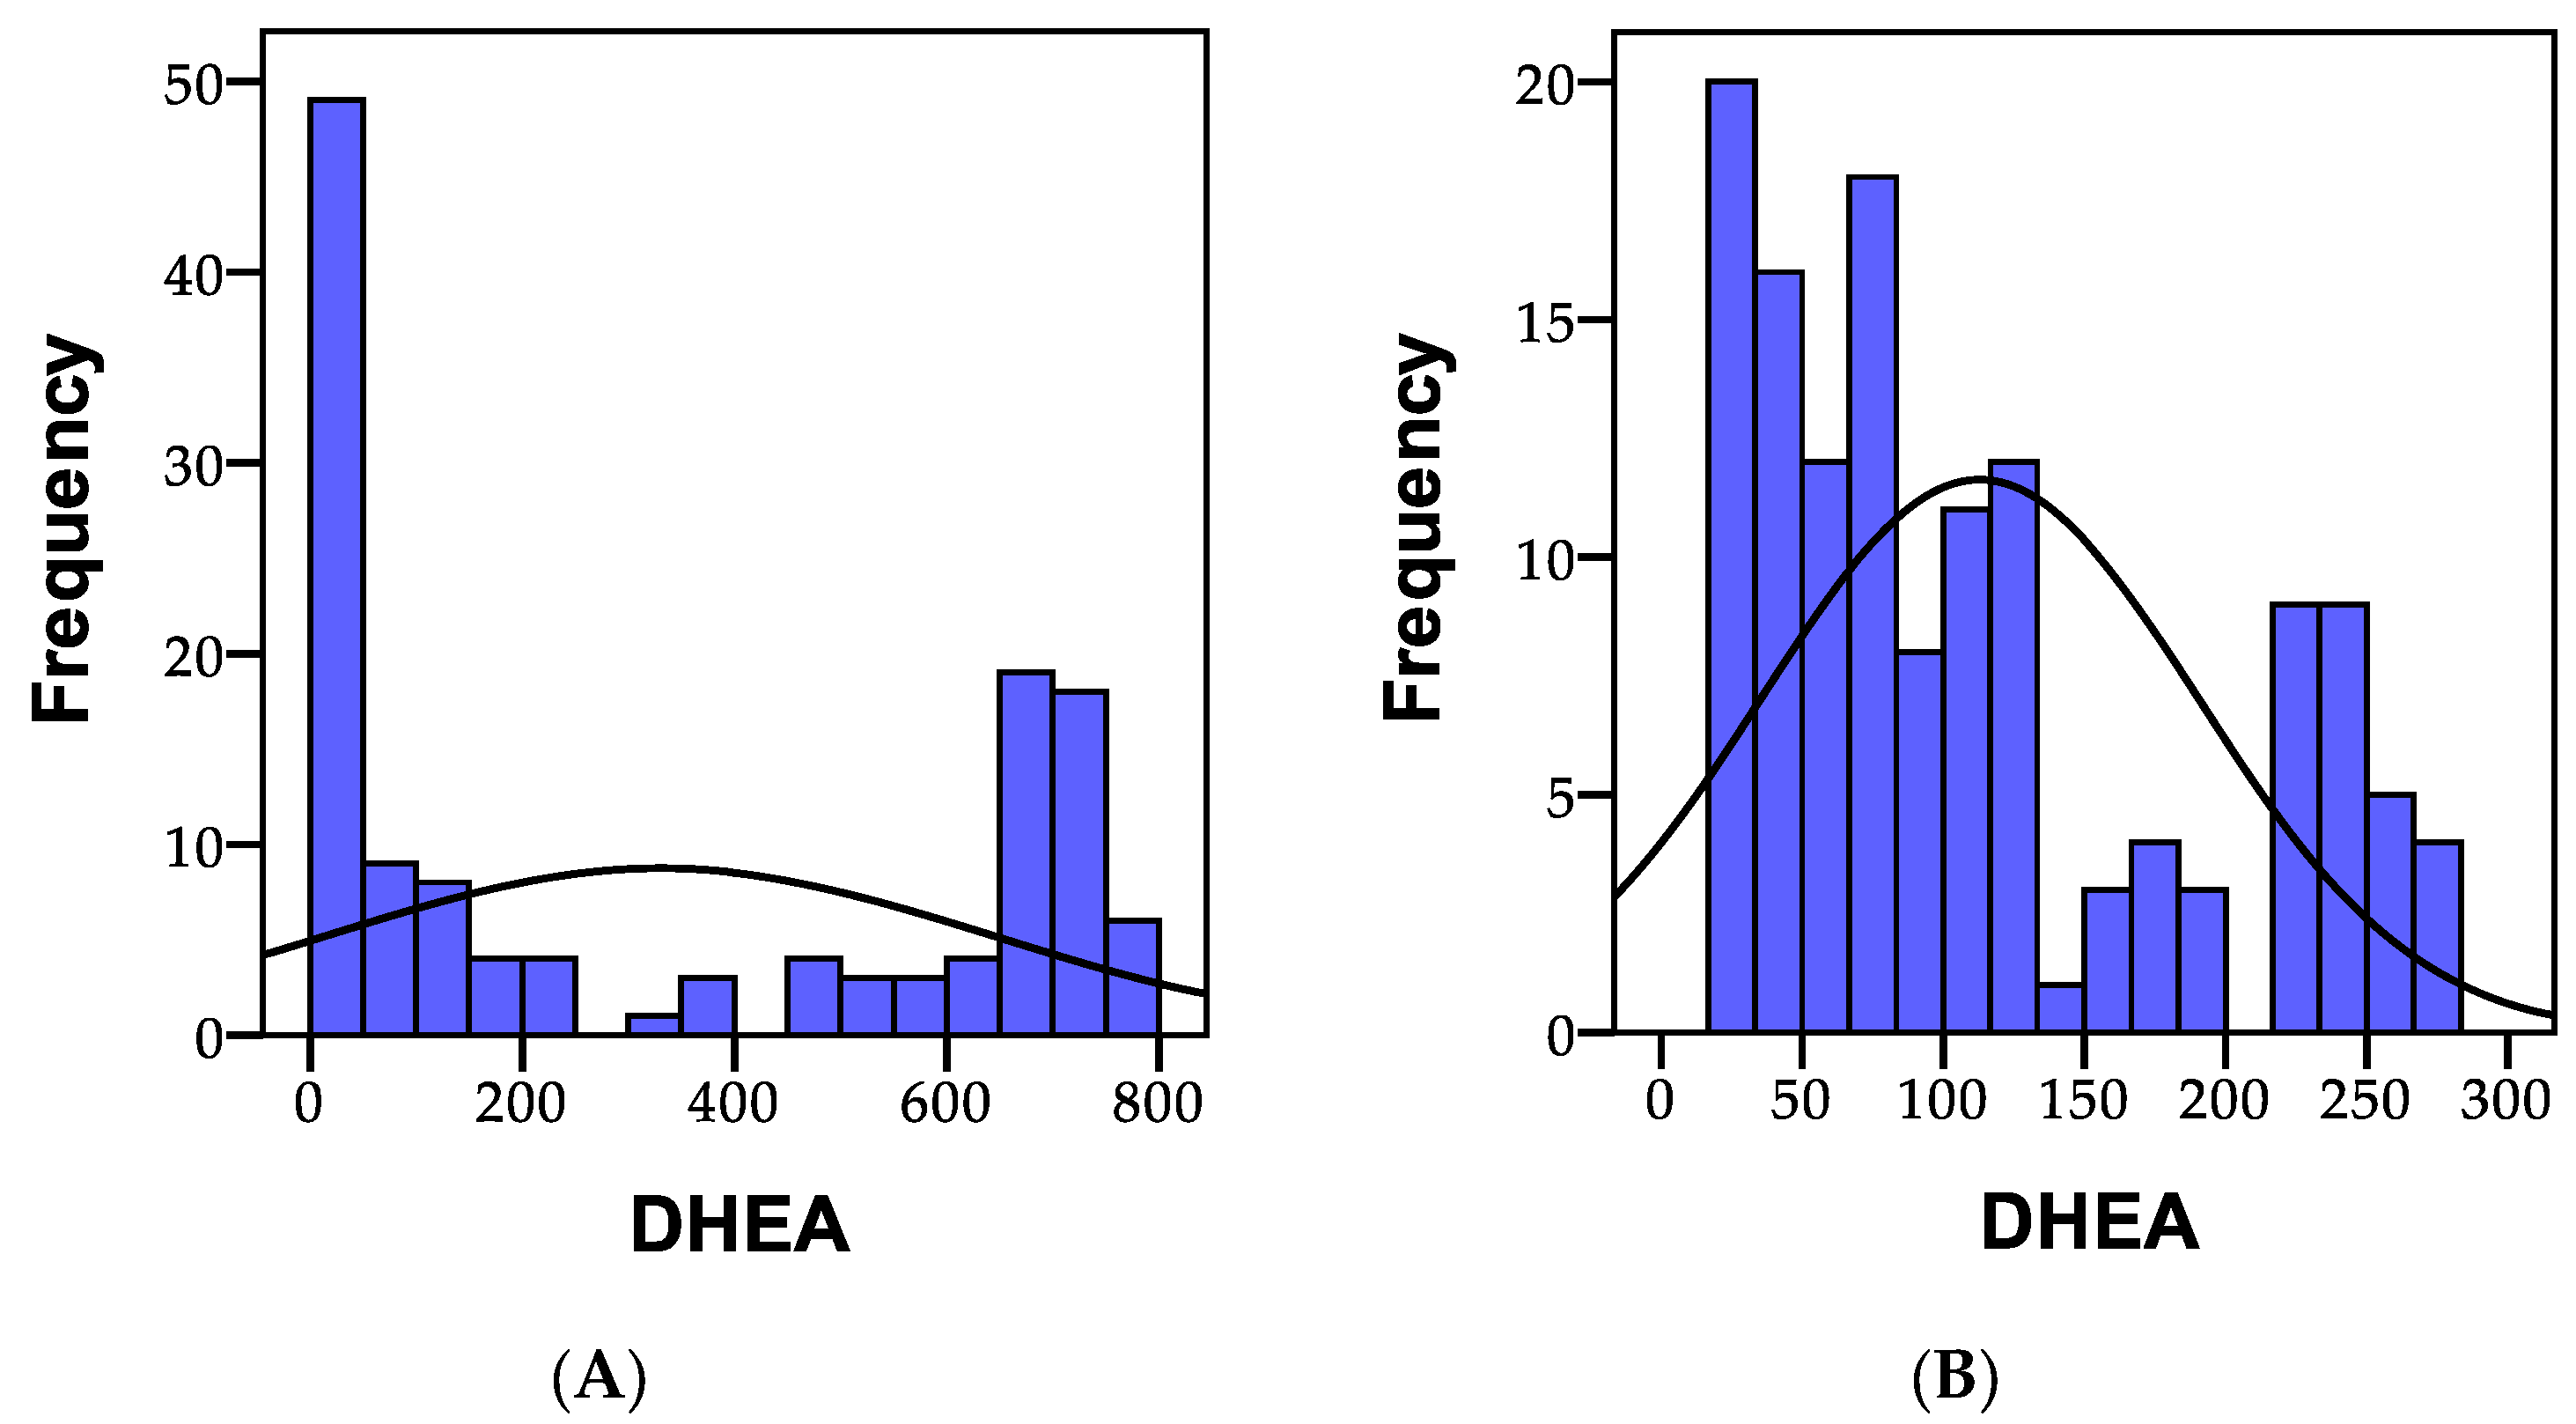
3.1.5. DHEA
3.2. Neuropsychiatric Manifestations in Patients with Gastrointestinal Disorders
3.3. Correlations
4. Discussion
5. Conclusions
Author Contributions
Funding
Institutional Review Board Statement
Informed Consent Statement
Data Availability Statement
Acknowledgments
Conflicts of Interest
References
- Bakshi, A.; Tadi, P. Biochemistry, Serotonin; StatPearls Publishing: Treasure Island, FL, USA, 2020. [Google Scholar]
- Meloni, M. A Randomized, Double-Blind, Placebo-Controlled, Crossover Study to Evaluate the Safety and Efficacy of the 5-Hydroxytryptophan on REM Sleep Behavior Disorder, Levodopa-Induced Motor Complications and Neuropsychiatric Disorders in Idiopathic Parkinson’s Disease; 2018. Available online: https://iris.unica.it/handle/11584/255971 (accessed on 14 June 2023).
- Thambyrajah, J.; Dilanthi, H.; Handunnetti, S.; Dissanayake, D. Serum melatonin and serotonin levels in long-term skilled meditators. Explore 2023, 19, 695–701. [Google Scholar] [CrossRef] [PubMed]
- Marsh, W. Tryptophan. In xPharm: The Comprehensive Pharmacology Reference; Enna, S.J., Bylund, D.B., Eds.; Elsevier: New York, NY, USA, 2007; pp. 1–5. [Google Scholar]
- Kohlmeier, M. Tryptophan. In Nutrient Metabolism; Kohlmeier, M., Ed.; Academic Press: London, UK, 2003; pp. 328–338. [Google Scholar]
- Santos, A.; Khemiri, S.; Simões, S.; Prista, C.; Sousa, I.; Raymundo, A. The importance, prevalence and determination of vitamins B6 and B12 in food matrices: A review. Food Chem. 2023, 426, 136606. [Google Scholar] [CrossRef] [PubMed]
- Vitamin B6. Available online: https://www.hsph.harvard.edu/nutritionsource/vitamin-b6/ (accessed on 10 September 2023).
- Hepsomali, P.; Groeger, J.A.; Nishihira, J.; Scholey, A. Effects of Oral Gamma-Aminobutyric Acid (GABA) Administration on Stress and Sleep in Humans: A Systematic Review. Front. Neurosci. 2020, 14, 923. [Google Scholar] [CrossRef] [PubMed]
- Jewett, B.E.; Sharma, S. Physiology, GABA; StatPearls Publishing: Treasure Island, FL, USA, 2018. Available online: https://www.ncbi.nlm.nih.gov/books/NBK513311/ (accessed on 14 June 2023).
- Goyal, S.; Gupta, M.; Sharma, P.; Beniwal, V. Hypersensitivity Associated with Food Additives. In Microbes for Natural Food Additives; Springer: Berlin/Heidelberg, Germany, 2023; pp. 205–227. [Google Scholar]
- Arıkoğlu, T.; Ozhan, A.K.; Kuyucu, S. Management of anaphylaxis in pediatric population. Curr. Pharm. Des. 2023, 29, 209–223. [Google Scholar] [PubMed]
- Deepika; Shukla, A.K.; Kumari, A.; Kumar, A. Gut brain regulation using psychobiotics for improved neuropsychological illness. Dev. Psychobiol. 2023, 65, e22404. [Google Scholar]
- Sapkota, S.; Ali, M.H.; Alshamrani, A.A.; Napit, P.R.; Roy, S.C.; Pasula, M.B.; Briski, K.P. GHRH Neurons from the Ventromedial Hypothalamic Nucleus Provide Dynamic and Sex-Specific Input to the Brain Glucose-Regulatory Network. Neuroscience 2023, 529, 73–87. [Google Scholar] [CrossRef]
- Andersen, J.V.; Schousboe, A. Glial glutamine homeostasis in health and disease. Neurochem. Res. 2023, 48, 1100–1128. [Google Scholar] [CrossRef]
- Abd-Elrahman, K.S.; Sarasija, S.; Ferguson, S.S. The role of neuroglial metabotropic glutamate receptors in Alzheimer’s disease. Curr. Neuropharmacol. 2023, 21, 273–283. [Google Scholar] [CrossRef]
- Méndez-Narváez, J.; Warkentin, K.M. Early onset of urea synthesis and ammonia detoxification pathways in three terrestrially developing frogs. J. Comp. Physiol. B 2023, 1, 1–21. [Google Scholar] [CrossRef]
- van der Valk, E.S.; Savas, M.; van Rossum, E.F.C. Stress and Obesity: Are There More Susceptible Individuals? Curr. Obes. Rep. 2018, 7, 193–203. [Google Scholar] [CrossRef]
- Abraham, S.B.; Rubino, D.; Sinaii, N.; Ramsey, S.; Nieman, L.K. Cortisol, obesity, and the metabolic syndrome: A cross-sectional study of obese subjects and review of the literature. Obesity 2013, 21, E105–E117. [Google Scholar] [CrossRef] [PubMed]
- Ok, J.; Park, S.; Jung, Y.H.; Kim, T.i. Wearable and Implantable Cortisol Sensing Electronics for Stress Monitoring. Adv. Mater. 2023, 14, 2211595. [Google Scholar] [CrossRef] [PubMed]
- Chan, S.; Debono, M. Replication of cortisol circadian rhythm: New advances in hydrocortisone replacement therapy. Ther. Adv. Endocrinol. Metab. 2010, 1, 129–138. [Google Scholar] [CrossRef]
- Liang, J.; Luo, L.; Wang, X. Advances in the study of corticoid and melatonin in circadian rhythm disorders of oncology patients. Highlights Sci. Eng. Technol. 2023, 36, 227–234. [Google Scholar] [CrossRef]
- Nuzzi, R.; Scalabrin, S.; Becco, A.; Panzica, G. Gonadal Hormones and Retinal Disorders: A Review. Front. Endocrinol. 2018, 9, 66. [Google Scholar] [CrossRef] [PubMed]
- Nenezic, N.; Kostic, S.; Strac, D.S.; Grunauer, M.; Nenezic, D.; Radosavljevic, M.; Jancic, J.; Samardzic, J. Dehydroepiandrosterone (DHEA): Pharmacological effects and potential therapeutic application. Mini Rev. Med. Chem. 2023, 23, 941–952. [Google Scholar] [CrossRef] [PubMed]
- Farooqi, N.A.I.; Scotti, M.; Lew, J.M.; Botteron, K.N.; Karama, S.; McCracken, J.T.; Nguyen, T.V. Role of DHEA and cortisol in prefrontal-amygdalar development and working memory. Psychoneuroendocrinology 2018, 98, 86–94. [Google Scholar] [CrossRef]
- Marciniak, M.; Sato, M.; Rutkowski, R.; Zawada, A.; Juchacz, A.; Mahadea, D.; Grzymisławski, M.; Dobrowolska, A.; Kawka, E.; Korybalska, K. Effect of the one-day fasting on cortisol and DHEA daily rhythm regarding sex, chronotype, and age among obese adults. Front. Nutr. 2023, 10, 1078508. [Google Scholar] [CrossRef]
- Stein, H.R. Strategies to Implement the Use of Supplements versus Psychotropics in a Pediatric and Adolescent Population: A Quality Improvement Project; 2023. Available online: https://digitalcommons.fiu.edu/cgi/viewcontent.cgi?article=1186&context=cnhs-studentprojects (accessed on 16 June 2023).
- Ghitea, T.C.; Vlad, S.; Birle, D.; Tit, D.M.; Lazar, L.; Nistor-Cseppento, C.; Behl, T.; Bungau, S. The influence of diet therapeutic intervention on the sarcopenic index of patients with metabolic syndrome. Acta Endocrinol 2020, 16, 470–478. [Google Scholar] [CrossRef]
- Ghitea, T.C.; Aleya, L.; Tit, D.M.; Behl, T.; Stoicescu, M.; Sava, C.; Iovan, C.; El-Kharoubi, A.; Uivarosan, D.; Pallag, A.; et al. Influence of diet and sport on the risk of sleep apnea in patients with metabolic syndrome associated with hypothyroidism—A 4-year survey. Environ. Sci. Pollut. Res. 2022, 29, 23158–23168. [Google Scholar] [CrossRef]
- Ghitea, T.C. Correlation of Periodontal Bacteria with Chronic Inflammation Present in Patients with Metabolic Syndrome. Biomedicines 2021, 9, 1709. [Google Scholar] [CrossRef] [PubMed]
- Nistor-Cseppento, C.D.; Moga, T.D.; Bungau, A.F.; Tit, D.M.; Negrut, N.; Pasca, B.; Bochis, C.F.; Ghitea, T.C.; Jurcau, A.; Purza, A.L.; et al. The Contribution of Diet Therapy and Probiotics in the Treatment of Sarcopenia Induced by Prolonged Immobilization Caused by the COVID-19 Pandemic. Nutrients 2022, 14, 4701. [Google Scholar] [CrossRef] [PubMed]
- Steiger, H. Eating disorders and the serotonin connection: State, trait and developmental effects. J. Psychiatry Neurosci. 2004, 29, 20–29. [Google Scholar] [PubMed]
- Sbrini, G.; Hanswijk, S.I.; Brivio, P.; Middelman, A.; Bader, M.; Fumagalli, F.; Alenina, N.; Homberg, J.R.; Calabrese, F. Peripheral serotonin deficiency affects anxiety-like behavior and the molecular response to an acute challenge in rats. Int. J. Mol. Sci. 2022, 23, 4941. [Google Scholar] [CrossRef]
- Kwon, Y.H.; Khan, W.I. Peripheral serotonin: Cultivating companionship with gut microbiota in intestinal homeostasis. Am. J. Physiol. Cell Physiol. 2022, 323, C550–C555. [Google Scholar] [CrossRef]
- Ledochowski, M.; Widner, B.; Murr, C.; Sperner-Unterweger, B.; Fuchs, D. Fructose malabsorption is associated with decreased plasma tryptophan. Scand. J. Gastroenterol. 2001, 36, 367–371. [Google Scholar] [CrossRef]
- Nishizawa, S.; Benkelfat, C.; Young, S.N.; Leyton, M.; Mzengeza, S.; de Montigny, C.; Blier, P.; Diksic, M. Differences between males and females in rates of serotonin synthesis in human brain. Proc. Natl. Acad. Sci. USA 1997, 94, 5308–5313. [Google Scholar] [CrossRef]
- Zhao, L.; Han, G.; Zhao, Y.; Jin, Y.; Ge, T.; Yang, W.; Cui, R.; Xu, S.; Li, B. Gender Differences in Depression: Evidence From Genetics. Front. Genet. 2020, 11, 562316. [Google Scholar] [CrossRef]
- Sramek, J.J.; Murphy, M.F.; Cutler, N.R. Sex differences in the psychopharmacological treatment of depression. Dialogues Clin. Neurosci. 2016, 18, 447–457. [Google Scholar] [CrossRef]
- Gorman, J.M. Gender differences in depression and response to psychotropic medication. Gend. Med. 2006, 3, 93–109. [Google Scholar] [CrossRef]
- Kroll, D.S.; Feldman, D.E.; Biesecker, C.L.; McPherson, K.L.; Manza, P.; Joseph, P.V.; Volkow, N.D.; Wang, G.-J. Neuroimaging of Sex/Gender Differences in Obesity: A Review of Structure, Function, and Neurotransmission. Nutrients 2020, 12, 1942. [Google Scholar] [CrossRef] [PubMed]
- Bremner, J.D.; Moazzami, K.; Wittbrodt, M.T.; Nye, J.A.; Lima, B.B.; Gillespie, C.F.; Rapaport, M.H.; Pearce, B.D.; Shah, A.J.; Vaccarino, V. Diet, Stress and Mental Health. Nutrients 2020, 12, 2428. [Google Scholar] [CrossRef] [PubMed]
- Gasmi, A.; Nasreen, A.; Menzel, A.; Gasmi Benahmed, A.; Pivina, L.; Noor, S.; Peana, M.; Chirumbolo, S.; Bjørklund, G. Neurotransmitters Regulation and Food Intake: The Role of Dietary Sources in Neurotransmission. Molecules 2022, 28, 210. [Google Scholar] [CrossRef] [PubMed]
- Maffei, M.E. 5-Hydroxytryptophan (5-HTP): Natural Occurrence, Analysis, Biosynthesis, Biotechnology, Physiology and Toxicology. Int. J. Mol. Sci. 2020, 22, 181. [Google Scholar] [CrossRef]
- Guo, F.; Zylinska, L.; Boczek, T. Role of metal ions in central nervous system: Physiology and pathophysiology. Front. Cell. Neurosci. 2022, 16, 1093224. [Google Scholar] [CrossRef]
- Bailey, M.T. Influence of the Gut Microbiota on Neuroendocrine-Immune Interactions. In Neuroendocrine-Immune System Interactions; Springer: Berlin/Heidelberg, Germany, 2023; pp. 279–320. [Google Scholar]
- Abdulzahir, A.; Klein, S.; Lor, C.; Perkins, M.G.; Frelka, A.; Pearce, R.A. Changes in Memory, Sedation, and Receptor Kinetics Imparted by the β2-N265M and β3-N265M GABAA Receptor Point Mutations. Int. J. Mol. Sci. 2023, 24, 5637. [Google Scholar] [CrossRef]
- Bi, C.; Guo, S.; Hu, S.; Chen, J.; Ye, M.; Liu, Z. The microbiota–gut–brain axis and its modulation in the therapy of depression: Comparison of efficacy of conventional drugs and traditional Chinese medicine approaches. Pharmacol. Res. 2022, 183, 106372. [Google Scholar] [CrossRef]
- Cortese, B.M.; Phan, K.L. The role of glutamate in anxiety and related disorders. CNS Spectr. 2005, 10, 820–830. [Google Scholar] [CrossRef]
- Stadtler, H.; Neigh, G.N. Sex Differences in the Neurobiology of Stress. Psychiatr. Clin. 2023, 46, 427–446. [Google Scholar] [CrossRef]
- Sagmeister, M.S.; Harper, L.; Hardy, R.S. Cortisol excess in chronic kidney disease–A review of changes and impact on mortality. Front. Endocrinol. 2023, 13, 1075809. [Google Scholar] [CrossRef]
- Lennartsson, A.K.; Theorell, T.; Rockwood, A.L.; Kushnir, M.M.; Jonsdottir, I.H. Perceived stress at work is associated with lower levels of DHEA-S. PLoS ONE 2013, 8, e72460. [Google Scholar] [CrossRef] [PubMed]
- Abercrombie, H.C.; Jahn, A.L.; Davidson, R.J.; Kern, S.; Kirschbaum, C.; Halverson, J. Cortisol’s effects on hippocampal activation in depressed patients are related to alterations in memory formation. J. Psychiatr. Res. 2011, 45, 15–23. [Google Scholar] [CrossRef] [PubMed]
- Sharma, S.; Johri, A. Hormones Responsible for Aging in Humans. Available online: http://www.ijcms2015.co/file/2021/vol-6-issue-1/aijra-vol-6-issue-1-21.pdf (accessed on 29 July 2023).
- Kokka, I.; Chrousos, G.P.; Darviri, C.; Bacopoulou, F. Measuring adolescent chronic stress: A review of established biomarkers and psychometric instruments. Horm. Res. Paediatr. 2023, 96, 74–82. [Google Scholar] [CrossRef] [PubMed]


| Groups | p | Total | ||||||||
|---|---|---|---|---|---|---|---|---|---|---|
| I | II | III | ||||||||
| N | % | N | % | N | % | N | % | |||
| Initial | ||||||||||
| Headache | No | 0 | 0.0 | 27 | 41.5 | 27 | 81.8 | 0.001 ** | 54 | 40.0 |
| Yes | 37 | 100.0 | 38 | 58.5 | 6 | 18.2 | 81 | 60.0 | ||
| Fatigue | No | 0 | 0.0 | 48 | 73.8 | 33 | 100.0 | 0.001 ** | 81 | 60.0 |
| Yes | 37 | 100.0 | 17 | 26.2 | 0 | 0.0 | 54 | 40.0 | ||
| Mood swings | No | 0 | 0.0 | 0 | 0.0 | 0 | 0.0 | 1.000 a | 0 | 0.0 |
| Yes | 37 | 100.0 | 65 | 100.0 | 33 | 100.0 | 135 | 100.0 | ||
| Hyperactivity | No | 10 | 27.0 | 44 | 67.7 | 0 | 0.0 | 0.001 ** | 54 | 40.0 |
| Yes | 27 | 73.0 | 21 | 32.3 | 33 | 100.0 | 81 | 60.0 | ||
| Aggression | No | 0 | 0.0 | 27 | 41.5 | 0 | 0.0 | 0.001 ** | 27 | 20.0 |
| Yes | 37 | 100.0 | 38 | 58.5 | 33 | 100.0 | 108 | 80.0 | ||
| Sleep disturbances | No | 0 | 0.0 | 27 | 41.5 | 0 | 0.0 | 0.001 ** | 27 | 20.0 |
| Yes | 37 | 100.0 | 38 | 58.5 | 33 | 100.0 | 108 | 80.0 | ||
| Lack of concentration | No | 27 | 73.0 | 0 | 0.0 | 0 | 0.0 | 0.001 ** | 27 | 20.0 |
| Yes | 10 | 27.0 | 65 | 100.0 | 33 | 100.0 | 108 | 80.0 | ||
| Final | ||||||||||
| Headache | No | 37 | 100.0 | 62 | 95.4 | 31 | 93.9 | 0.357 | 130 | 96.3 |
| Yes | 0 | 0.0 | 3 | 4.6 | 2 | 6.1 | 5 | 3.7 | ||
| Fatigue | No | 35 | 94.6 | 65 | 100.0 | 33 | 100.0 | 0.068 | 133 | 98.5 |
| Yes | 2 | 5.4 | 0 | 0.0 | 0 | 0.0 | 2 | 1.5 | ||
| Mood swings | No | 37 | 100.0 | 13 | 20.0 | 27 | 81.8 | 0.001 ** | 77 | 57.0 |
| Yes | 0 | 0.0 | 52 | 80.0 | 6 | 18.2 | 58 | 43.0 | ||
| Hyperactivity | No | 10 | 27.0 | 60 | 92.3 | 31 | 93.9 | 0.001 ** | 101 | 74.8 |
| Yes | 27 | 73.0 | 5 | 7.7 | 2 | 6.1 | 34 | 25.2 | ||
| Aggression | No | 37 | 100.0 | 65 | 100.0 | 0 | 0.0 | 1.000 a | 102 | 75.6 |
| Yes | 0 | 0.0 | 0 | 0.0 | 33 | 100.0 | 33 | 24.4 | ||
| Sleep disturbances | No | 36 | 97.3 | 59 | 90.8 | 33 | 100.0 | 0.110 | 128 | 94.8 |
| Yes | 1 | 2.7 | 6 | 9.2 | 0 | 0.0 | 7 | 5.2 | ||
| Lack of concentration | No | 37 | 100.0 | 44 | 67.7 | 27 | 81.8 | 0.001 ** | 108 | 80.0 |
| Yes | 0 | 0.0 | 21 | 32.3 | 6 | 18.2 | 27 | 20.0 | ||
| Pearson Correlation | Headache | Fatigue | Mood Swings | Hyperactivity | Aggression | Sleep Disturbances | Lack of Concentration | |
|---|---|---|---|---|---|---|---|---|
| Serotonin | r | 0.417 ** | 0.682 ** | 0.831 ** | −0.068 | 0.426 ** | 0.709 ** | 0.162 |
| p | 0.000 | 0.000 | 0.000 | 0.432 | 0.000 | 0.000 | 0.060 | |
| GABA | r | 0.140 | 0.566 ** | 0.880 ** | −0.064 | 0.169 * | 0.569 ** | 0.363 ** |
| p | 0.105 | 0.000 | 0.000 | 0.464 | 0.050 | 0.000 | 0.000 | |
| Glutamate | r | 0.913 ** | 0.784 ** | 0.274 ** | −0.356 ** | 0.921 ** | 0.469 ** | −0.596 ** |
| p | 0.000 | 0.000 | 0.001 | 0.000 | 0.000 | 0.000 | 0.000 | |
| Cortisol—morning | r | 0.441 ** | −0.009 | −0.640 ** | −0.225 ** | 0.418 ** | −0.213 * | −0.272 ** |
| p | 0.000 | 0.918 | 0.000 | 0.009 | 0.000 | 0.013 | 0.001 | |
| Cortisol—afternoon | r | −0.197 * | −0.122 | −0.159 | −0.136 | −0.200 * | −0.197 * | 0.771 ** |
| p | 0.022 | 0.158 | 0.065 | 0.115 | 0.020 | 0.022 | 0.000 | |
| Cortisol—evening | r | 0.059 | −0.348 ** | −0.591 ** | 0.145 | 0.040 | −0.167 | 0.176 * |
| p | 0.496 | 0.000 | 0.000 | 0.093 | 0.642 | 0.053 | 0.041 | |
| DHEA—morning | r | 0.075 | −0.230 ** | 0.190 * | 0.709 ** | 0.060 | 0.492 ** | −0.563 ** |
| p | 0.390 | 0.007 | 0.027 | 0.000 | 0.486 | 0.000 | 0.000 | |
| DHEA—evening | r | −0.597 ** | −0.006 | 0.416 ** | −0.078 | −0.556 ** | −0.185 * | 0.569 ** |
| p | 0.000 | 0.946 | 0.000 | 0.367 | 0.000 | 0.032 | 0.000 | |
| N | 135 | 135 | 135 | 135 | 135 | 135 | 135 | |
Disclaimer/Publisher’s Note: The statements, opinions and data contained in all publications are solely those of the individual author(s) and contributor(s) and not of MDPI and/or the editor(s). MDPI and/or the editor(s) disclaim responsibility for any injury to people or property resulting from any ideas, methods, instructions or products referred to in the content. |
© 2023 by the authors. Licensee MDPI, Basel, Switzerland. This article is an open access article distributed under the terms and conditions of the Creative Commons Attribution (CC BY) license (https://creativecommons.org/licenses/by/4.0/).
Share and Cite
Matiș, L.; Alexandru, B.A.; Fodor, R.; Daina, L.G.; Ghitea, T.C.; Vlad, S. Effect of Probiotic Therapy on Neuropsychiatric Manifestations in Children with Multiple Neurotransmitter Disorders: A Study. Biomedicines 2023, 11, 2643. https://doi.org/10.3390/biomedicines11102643
Matiș L, Alexandru BA, Fodor R, Daina LG, Ghitea TC, Vlad S. Effect of Probiotic Therapy on Neuropsychiatric Manifestations in Children with Multiple Neurotransmitter Disorders: A Study. Biomedicines. 2023; 11(10):2643. https://doi.org/10.3390/biomedicines11102643
Chicago/Turabian StyleMatiș, Loredana, Bogdana Ariana Alexandru, Radu Fodor, Lucia Georgeta Daina, Timea Claudia Ghitea, and Silviu Vlad. 2023. "Effect of Probiotic Therapy on Neuropsychiatric Manifestations in Children with Multiple Neurotransmitter Disorders: A Study" Biomedicines 11, no. 10: 2643. https://doi.org/10.3390/biomedicines11102643
APA StyleMatiș, L., Alexandru, B. A., Fodor, R., Daina, L. G., Ghitea, T. C., & Vlad, S. (2023). Effect of Probiotic Therapy on Neuropsychiatric Manifestations in Children with Multiple Neurotransmitter Disorders: A Study. Biomedicines, 11(10), 2643. https://doi.org/10.3390/biomedicines11102643