Article

Comprehensive Profiling of Early Neoplastic Gastric Microenvironment Modifications and Biodynamics in Impaired BMP-Signaling FoxL1+-Telocytes

by
Alain B. Alfonso
,
Véronique Pomerleau
,
Vilcy Reyes Nicolás
,
Jennifer Raisch
,
Carla-Marie Jurkovic
,
François-Michel Boisvert
and
Nathalie Perreault
*,†
Département d’Immunologie et Biologie Cellulaire, Faculté de Médecine et des Sciences de la Santé, Université de Sherbrooke, Sherbrooke, QC J1E 4K8, Canada
*
Author to whom correspondence should be addressed.
Co-senior authors.
Biomedicines 2023, 11(1), 19; https://doi.org/10.3390/biomedicines11010019
Submission received: 18 November 2022 / Revised: 13 December 2022 / Accepted: 16 December 2022 / Published: 22 December 2022

Abstract

:
FoxL1+telocytes (TCFoxL1+) are novel gastrointestinal subepithelial cells that form a communication axis between the mesenchyme and epithelium. TCFoxL1+ are strategically positioned to be key contributors to the microenvironment through production and secretion of growth factors and extracellular matrix (ECM) proteins. In recent years, the alteration of the bone morphogenetic protein (BMP) signaling in TCFoxL1+ was demonstrated to trigger a toxic microenvironment with ECM remodeling that leads to the development of pre-neoplastic gastric lesions. However, a comprehensive analysis of variations in the ECM composition and its associated proteins in gastric neoplasia linked to TCFoxL1+ dysregulation has never been performed. This study provides a better understanding of how TCFoxL1+ defective BMP signaling participates in the gastric pre-neoplastic microenvironment. Using a proteomic approach, we determined the changes in the complete matrisome of BmpR1a△FoxL1+ and control mice, both in total antrum as well as in isolated mesenchyme-enriched antrum fractions. Comparative proteomic analysis revealed that the deconstruction of the gastric antrum led to a more comprehensive analysis of the ECM fraction of gastric tissues microenvironment. These results show that TCFoxL1+ are key members of the mesenchymal cell population and actively participate in the establishment of the matrisomic fraction of the microenvironment, thus influencing epithelial cell behavior.

1. Introduction

The extracellular matrix (ECM) is a complex assembly of large fibrous proteins, glycoproteins, proteoglycans, and ECM-associated proteins, such as growth factors, whose composition varies from one tissue to another [1]. The ECM represents the insoluble fraction of the microenvironment, and although it was long believed to be a passive component, it is in fact highly dynamic and influences the behavior of neighboring cells through mechanosensing and signaling [2,3]. Thus, the architecture and homeostasis of a tissue, such as the stomach, are maintained in part by tight regulation of ECM dynamics. Dysregulation of the ECM composition in the microenvironment creates a disbalance in the physical (force, porosity, stiffness) and biochemical (growth factor density, cell adhesion, signaling) stimuli, providing an abnormal cell response to these biomechanical forces and leading to the development of diseases such as gastric neoplasia [4,5,6,7,8]. In gastric cancer, pre-malignant lesions already show dysregulation in ECM dynamics and will also influence the prognosis outcome and therapeutic strategies at later stages of the disease [2,5,9].
In mammals, the ECM is composed of approximately 300 proteins. This represents the core matrisome, which is mainly composed of proteins, such as collagens (CLs) and proteoglycans, with structural and fibrillar glycoproteins [10,11,12,13]. The biochemical properties of these proteins, such as their size, insolubility, and cross-linking, have made attempts to systematically characterize the entire tissue ECM composition challenging [14]. Recently, Naba et al. developed a proteomics-based approach to identify, quantify, and compare the matrisome of whole tissues, partially resolving the limitations of in vivo analysis of ECM dynamics [14]. This approach allows for comprehensive evaluation of the proteins from the core matrisome, as well as the components of matrisome-associated proteins such as ECM regulators (ECM-remodeling enzymes, cross-linkers, proteases) and secreted factors such as growth factors and cytokines binding the ECM [13,14].
As the microenvironment plays an essential role in tissue homeostasis and in the development of pathologies such as gastric cancer [4,5,6,7,8], mesenchymal cells have attracted considerable attention in recent years [15,16,17]. Mesenchymal cells, more precisely myofibroblasts as well as FoxL1+telocytes (TCFoxL1+), are better known for their contribution to the sub-epithelial microenvironment. Both myofibroblasts and TCFoxL1+ are capable secretors of cytokines, chemokines, growth factors, and ECM proteins [16,17,18,19,20,21,22]. In addition, TCFoxL1+ are advantageously positioned directly underlying the epithelium, forming a 3D nexus between the epithelium and the rest of the stroma [17,23]. TCFoxL1+ contribute to the stem cell niche microenvironment by secreting soluble factors such as WNT5a, R-spondin3, and gremlin, which has been documented in recent years [15,17,20,23,24]. However, the precise role of TCFoxL1+ in the insoluble fraction of the gastrointestinal (GI) microenvironment is poorly defined. Considering the effect of TCFoxL1+ on GI epithelial cells [17,18,19,22,23], there is a critical need to rigorously characterize the role of the ECM biodynamic microenvironment on GI epithelial cell behavior in vivo and determine the contribution of TCFoxL1+.
To date, there have been limitations to the study of the various roles of TCFoxL1+ in the in vivo microenvironment because of the limited models available [17,20,23,25,26]. A previous study, using a murine model with TCFoxL1+ impaired BMP signaling pathway, demonstrated the importance of these cells and this pathway in inducing gastric neoplastic lesions and polyps in 90-day-old mice [22]. BmpR1a△FoxL1+ mice did not develop chronic inflammation or a malignant phenotype; however, disturbed TCFoxL1+ led to early precancerous events with important disorganized gastric glands architecture, intestinal metaplasia, and spasmolytic polypeptide-expressing metaplasia (SPEM), in addition to remodeling of the ECM into a reactive microenvironment [22]. Consequently, BmpR1a△FoxL1+ mice represent an excellent model to investigate the TCFoxL1+ contribution instructing the microenvironment ECM biodynamics, leading to gastric neoplasia. Using this model, we can perform a matrisomic investigative of the stomach of control and BmpR1a△FoxL1+ mice, and better understand the contribution of TCFoxL1+ to this aspect of the microenvironment [13,14].
In the present study, we evaluated the contribution of TCFoxL1+ to the matrisomic microenvironment in mice with early gastric neoplasia. This matrisomic investigative approach, used in concert with the TCFoxL1+ signaling impaired gastric pre-neoplastic mouse model, revealed a detailed inventory of dysregulated core-matrisome and matrisome-associated proteins in early events of gastric neoplasia. We identified important and subtle changes in the ECM biology that occur during the etiology of gastric neoplasia associated with Bmp-signaling impaired TCFoxL1+.

2. Materials and Methods
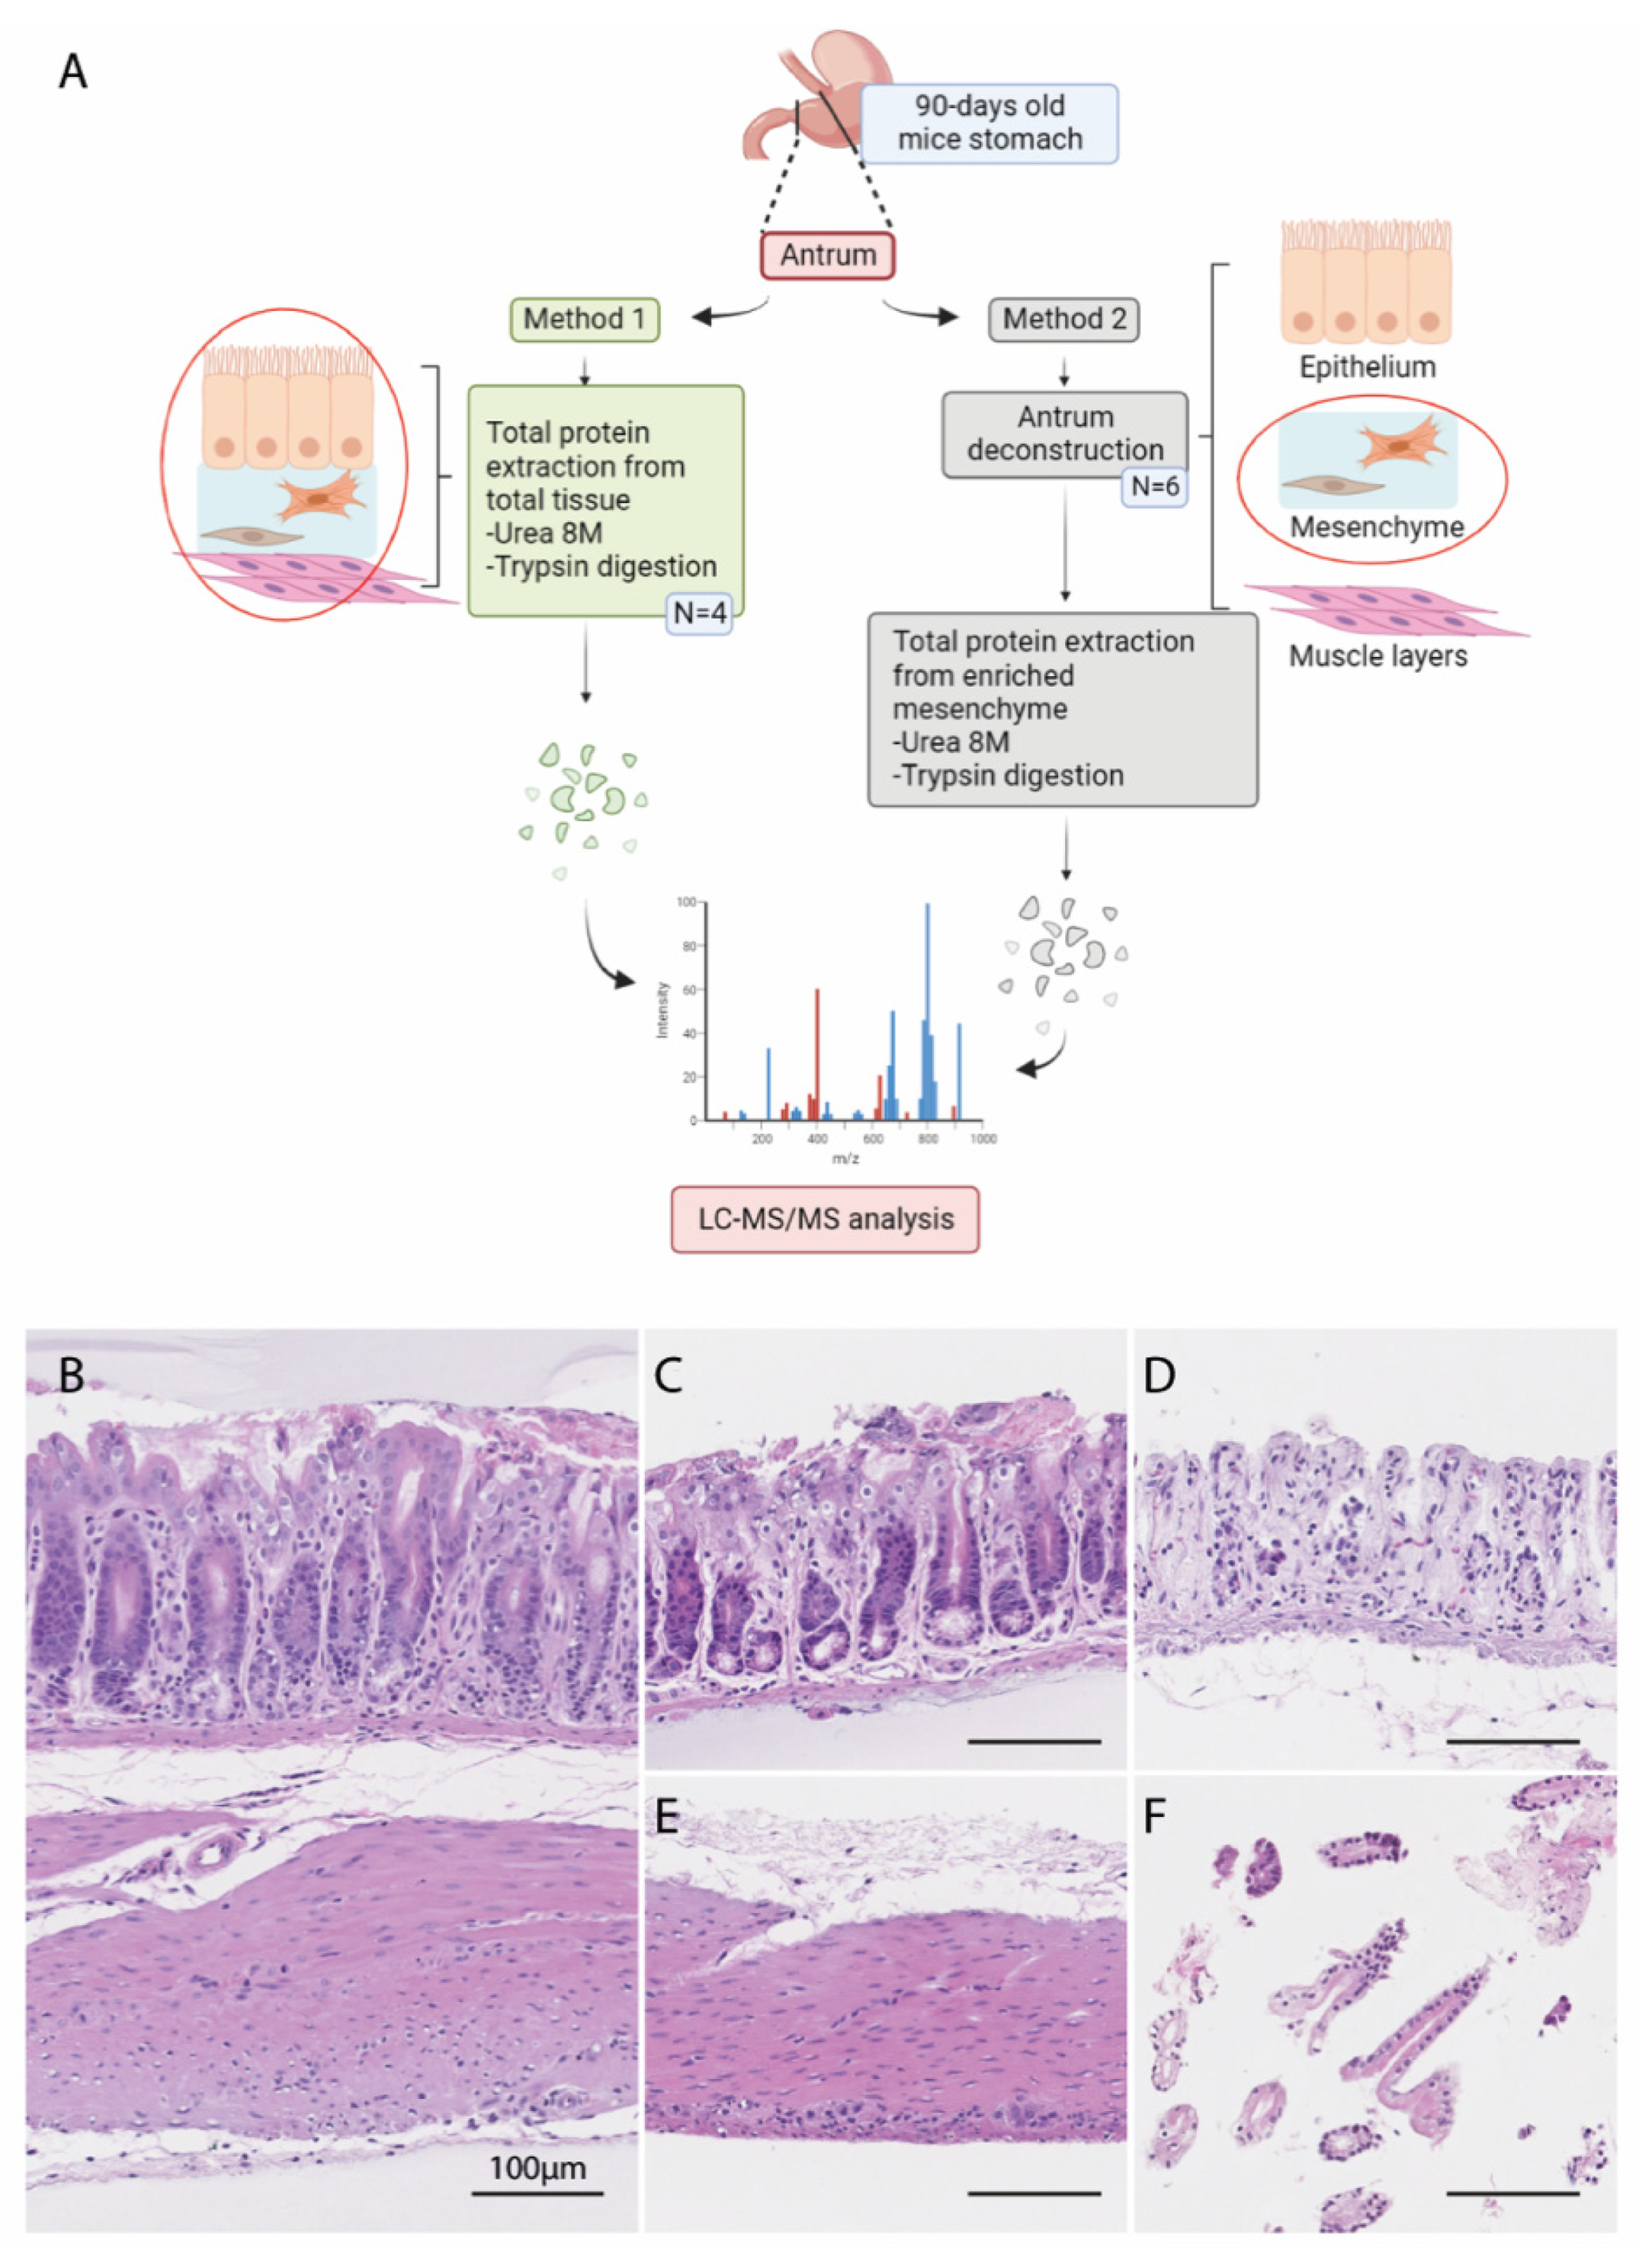
2.1. Animals

The transgenic mouse line C57BL/6J FoxL1Cre was provided by Dr. Kaestner [27] and 129 SvEv-BmpR1afx/fx mice were supplied by Dr. Mishina [28]. BmpR1aΔFoxL1+ conditional knockout mice were generated as previously described [18,21,22]. Male and female 90-day-old age-matched mice were used for the study. All experiments were performed in accordance with our animal welfare protocol (approval number: FMSS-2019-2370).

2.2. Deconstruction of Mouse Ex Vivo Stomach Tissues

Tissue deconstruction was performed stepwise to enrich each compartment (the epithelial, mesenchymal, and muscular layers). First, stomachs were opened along the greater curvature and rinsed with cold 1× PBS, and the antrums were isolated from the corpus and fundus sections of the total tissue. Mouse antrums were cut with a razor blade into 5 mm tissue sections and the muscle layer was mechanically dissociated using forceps under a stereomicroscope. Leftover tissues (mesenchyme and epithelium) were subsequently incubated in 4 mL sterile CorningTM Cell Recovery Solution without agitation (Corning Life Science, Corning, NY, USA) at 4 °C for 24 h. The following day, dissociation of the epithelial layer was performed with a 30 min incubation of the tissue on ice followed by vigorous manual shaking for 15 s. The mesenchymal tissue was incubated once again in 6 mL of sterile CorningTM Cell Recovery Solution (Corning Life Science, Corning, NY, USA) on ice with gentle shaking for 30 min followed by further dissociation by vigorous manual shaking for 15 s. Finally, mesenchymal tissues were washed four times with 1× PBS while all remaining epithelial cells were pooled and kept on ice. Deconstructed tissue sections were either snap-frozen for immunoblotting and proteomic analysis or fixed in 4% paraformaldehyde (PFA) (Thermo Fisher Scientific, Waltham, MA, USA) and paraffin-embedded for histological analysis. Total tissue samples were also collected to allow for a more comprehensive comparison of the matrisome content.

2.3. Histological Analysis

The total stomach antrum or deconstructed fractions were fixed overnight at 4 °C in 4% PFA (Thermo Fisher Scientific, Waltham, MA, USA) and subsequently processed for tissue embedding as previously described [18,21]. To avoid the diffusion of cells in paraffin, the epithelial layer from the deconstructed tissue was embedded in HistoGelTM (Thermo Fisher Scientific, Waltham, MA, USA) and wrapped in lens paper prior to embedding. Histological staining (H&E) on tissue sections was performed as previously described [18,21]. Virtual images were acquired with a slide scanner (Nanozoomer; Hamamatsu, Japan) and visualized using the NDP.view2 software (version 2.8.24).

2.4. In-Solution Digestion of Proteins to Peptides for Mass Spectrometry Analysis

Frozen samples of either the total stomach antrum or mesenchymal-enriched stomach antrum fractions were thawed on ice and homogenized directly in 8 M urea (Sigma Aldrich, St. Louis, MO, USA) dissolved in 10 mM HEPES pH 8.0 (Wisent, Saint-Jean-Baptiste, QC, Canada) (100 µL/10 mg wet tissue weight), using the QIAGEN TissueLyser LT (Hilden, Germany). Prior to protein quantification by BCA assay (Pierce Thermo Scientific, Waltham, MA, USA), samples were centrifuged following their homogenization to remove urea-insoluble materials. Following the protocol described by Naba et al., proteins were reduced, alkylated, deglycosylated, and digested, except for the Lys-C digestion, which was omitted [14,29]. Solutions were prepared using MS-grade water and low protein binding tubes were used for these experiments.

2.5. Purification and Desalting of the Peptides on C18 Columns

Trifluoroacetic acid (TFA) was added following incubation with the proteases to a final concentration of 0.2%, and the samples were desalted using C18 tips (Pierce Thermo Scientific, Waltham, MA, USA). Acetonitrile was first aspirated in the C18 tip initially and then equilibrated with 0.1% TFA. Each peptide sample was bound to the C18 tip by 10 successive up-and-down until the entire sample was loaded. The tip was then washed with a solution containing 0.1% TFA, and the peptides were eluted in a separate low-bind tube using a 50% acetonitrile/1% formic acid solution. The eluted peptides were lyophilized using a centrifugal evaporator at 60 °C and the dry peptides were resuspended in 1% formic acid. The peptide concentration was measured using a NanoDrop spectrophotometer (Thermo Fisher Scientific, Waltham, MA, USA) at 205 nm absorbance. The peptide samples were transferred to autosampler vials and stored at −20 °C until analyzed by mass spectrometry.

2.6. LC-MS/MS Analysis

Analysis of the purified peptides was carried out at the Université de Sherbrooke proteomics facility using the following parameters: Each sample (was injected into an HPLC system (NanoElute, Bruker Daltonics, Billerica, MA, USA) for LC-MS/MS. A total of 250 ng of peptides were loaded onto a trap column at a constant flow of 4 µL/min (Acclaim PepMap100 C18 column, 0.3 mm id × 5 mm, Dionex Corporation, Sunnyvale, CA, USA) and eluted onto the C18 analytical column (1.9 µm beads size, 75 µm × 25 cm, PepSep) over a 2 h gradient of acetonitrile (5–37%) in 0.1% FA at 500 nL/min into a TimsTOF Pro ion mobility mass spectrometer equipped with a Captive Spray nanoelectrospray source (NanoElute, Bruker Daltonics, Billerica, MA, USA). The data were acquired in data-dependent MS/MS mode with a 100–1700 m/z mass range, and the number of PASEF scans was set at 10 (1.27 s duty cycle) with a dynamic exclusion m/z isolation window of 0.4 min. The collision energy was set at 42.0 eV, and the target intensity was 20,000 with an intensity threshold of 2500.

2.7. Protein Identification Using MaxQuant Analysis

MaxQuant software version 1.6.17 (Munich, Bavaria, Germany), was used to analyze the raw files using the Uniprot mouse proteome database (25 March 2020, 55,366 entries). The analysis was performed under TIMS-DDA type in group-specific parameters, and included the following parameters: two miscleavages were allowed; fixed modification was carbamidomethylation of cysteine; the enzyme selected was trypsin (not before a proline). The following variable modifications were included in the analysis: methionine oxidation, N-terminal protein acetylation, and protein carbamylation (K, N-terminal). The limit for mass tolerance was set at 10 ppm for the precursor ions and at 20 ppm for the fragment ions. The identification values “PSM FDR”, “Protein FDR”, and “Site decoy fraction” were set to 0.05. The minimum peptide count was set to 1. Label-free quantification (LFQ) was performed using an LFQ minimal ratio count of 2. Both the “Second peptides” and “Match between runs” were allowed.

2.8. Differential and Statistical Analyses of Mass Spectrometry Data

Following the MaxQuant analysis, LFQ intensities were sorted according to several parameters using the Prostar software version 1.28.1 (Grenoble, France) [30]. Filtered proteins positive for the “Reverse”, “Only.identified.by.site”, or “Potential.contaminant” categories were eliminated, as were proteins identified from only one unique peptide. Data were normalized with quantile centering set to 0.5 for the intensity distribution. The non-detection of a protein was considered biologically relevant in the following cases: 75% (3 of 4) of the control or mutant mice group with respect to the other for total antrum (TA) and in 83% (5 of 6) of the control or mutant mice group with respect to the other for enriched mesenchyme (EM). Considering the aforementioned conditions, for all data corresponding to the matrisome, the partially observed value (POV) imputation was revised according to the following cases, followed by recalculation of Log2FC and p-value in ProStar. For TA data, the imputed POV was removed and replaced by the minimum POV when three out of four mice presented an LFQ intensity = 0 for a given protein. If two out of four mice presented LFQ intensity = 0, the Log2FC and the p-value recalculated in ProStar were considered non-conclusive (NC). For the EM data, the imputed POV was removed and replaced by the minimum POV when five out of six mice in one of the two groups presented an LFQ intensity = 0 for a given protein. If four out of six mice presented an LFQ intensity = 0 in one or both groups, the Log2FC and p-value recalculated by ProStar were considered NC. Structured least square adaptation (SLSA) and detQuantile imputation were performed for POV and missing values in the entire condition (MEC), respectively. The results were ranked to preserve the proteins present in at least three of the four (in TA) and three of the six (in MS EM) biological replicates for each condition. For hypotheses testing, a Limma statistical test was used, with a fold-change threshold of 1.5 and a p-value of 0.05, to determine the list of differentially abundant proteins. A “st.boot” calibration plot was chosen for p-value distribution.

2.9. Matrisome Identification

The Matrisome Annotator webtool (matrisomeproject.mit.edu) was used to annotate the list of differentially abundant proteins as previously described [13]. Matrisome divisions (core matrisome or matrisome-associated) and categories (ECM glycoproteins, collagens (CLs) and proteoglycans, ECM-affiliated, ECM regulators, and secreted factors) were used according to Naba et al. [13].

2.10. Indirect Immunofluorescence

Indirect immunofluorescence of stomach sections from 90-day old control and BmpR1a△FoxL1+ mice was performed as previously described [18,21,22,31,32,33]. Antigen blocking was performed with a solution of 2% bovine serum albumin (BSA), 0.1% fish gelatin, and 0.2% Triton X-100 in 1× PBS for 1 h at room temperature. The following primary antibodies were used in this study: S100A9 (Cell Signaling Technology, Danvers, MA, USA; Cat#73425; RRID:AB_2799839), fibronectin (Millipore; Burlington, MA, USA, Cat# AB2033, RRID:AB_2105702), and tenascin C (Millipore, Burlington, MA, USA; Cat# AB19013, RRID:AB_2256033). The following day, slides were incubated with anti-rabbit IgG Alexa-488 labeled secondary antibody (Cell Signaling Technology; Danvers, MA, USA; Cat# 4412; RRID:AB_1904025). Slides were examined under a Zeiss Axioscope 5 (Oberkochen, Germany) equipped with a Zeiss Axiocam 705 mono CMOS camera. Images were analyzed using ImageJ v.1.53j (RRID:SDR_003070).

2.11. Picro-Sirius Red Staining

Tissue sections of 90-day old mouse stomach were stained with picrosirius red following a previously published protocol [34] and CL content and fibers were analyzed under bright-field and polarized light. Images from four mice in each group were taken using a Zeiss Axioscope 5 equipped with a linear polarizer and analyzer. Multiple representative regions of interest (ROI) were assessed per image to characterize the alignment properties of CL fibers. ROI were selected in both the top and middle antrum glands of BmpR1a△FoxL1+ mice to better assess tissue complexity. Each ROI was the same dimension. The distribution of CL fiber angles and coherency was determined using ImageJ software (Madison, WI, USA) package Orientation J (version 2.0.5; RRID:SCR_014796). Statistical analysis was performed using Prism v9.4.1 (San Diego, CA, USA, RRID:SCR_002798). To test the normal distribution of the samples, we used D’Agostino-Pearson omnibus normality test and for group analyses we used nested ANOVA.

2.12. Immunoblot Analysis

The same 8 M urea proteins extracts from total antrum tissues used for proteomic analyses were also assessed to validate the potential proteins of interest (n = 4). Samples (10 μg each) were separated on NuPage 4–12% Bis-Tris gels (Thermo Fisher Scientific, Waltham, MA, USA) with MES buffer and transferred onto a PVDF membrane. Membranes were probed with the following antibodies: S100A8 (Proteintech, Rosemont, IL, USA; Cat# 15792-1-AP, RRID:AB_10666315), S100A9 (Cell Signaling Technology; Danvers, MA, USA; Cat#73425; RRID:AB_2799839), SPARCL1 (R&D Systems, Minneapolis, MN, USA; Cat# AF2836, RRID:AB_2195097), and ADAM9 (Cell Signaling Technology; Danvers, MA, USA; Cat# 4151, RRID:AB_1903892). GAPDH (Cell Signaling Technology; Danvers, MA, USA; Cat# 2118, RRID:AB_561053) was used as a loading control. Anti-rabbit (Cat#7074; RRID:AB_2099233) HRP-labeled secondary antibodies were purchased from Cell Signaling Technology; Danvers, MA, USA; and anti-goat HRP-labeled antibodies (Cat#705-035-003; RRID:AB_2340390) were from Jackson ImmunoResearch Laboratories (West Grove, PA, USA). Immunoreactive bands were detected using the Amersham ECL Western blotting Detection System (GE Healthcare Life Sciences/Cytiva, Chicago, IL, USA) with an Azure Biosystems c280 digital imager (Azure Biosystems, Dublin, CA, USA). Quantification was performed using ImageJ v1.53j (n = 4 mice/group). The Mann–Whitney U test was used to determine data significance.

3. Results

To study the contribution of TCFoxL1+ in instructing the microenvironment ECM biodynamic leading to gastric neoplasia through a matrisomic investigative approach, we compared and analyzed two methods for tissue preparation of the stomach antrum of 90-day-old control and BmpR1a△FoxL1+ mice (Figure 1A). In the first approach, an 8 M urea extraction of total proteins was performed on the stomach antrum of the control and BmpR1a△FoxL1+ mice. Proteins from the total antrum were identified using LC-MS/MS as previously described [14]. For the second method, we investigated whether other cell compartments in the tissue caused unwanted interference during the protein identification and quantification within the proteomic analysis. As the bulk of ECM/matrisome proteins is located in the mesenchymal compartment, we decided to deconstruct the stomach antrum to obtain an enriched mesenchymal compartment (Figure 1B–E). First, the stomach antrum was isolated from control and BmpR1a△FoxL1+ mice (Figure 1B), and the muscle layers (Figure 1C) were mechanically separated from the antrum using tweezers. Next, the remaining epithelium/mesenchymal fraction (Figure 1D) was incubated with a non-enzymatic cell recovery solution that dissociated the epithelial fraction (Figure 1E) from the underlying mesenchyme, as previously described [18,32,33,35]. The 8 M protein extraction was carried out for the isolated enriched mesenchymal fraction, and the analysis was performed as described above for the total tissue.

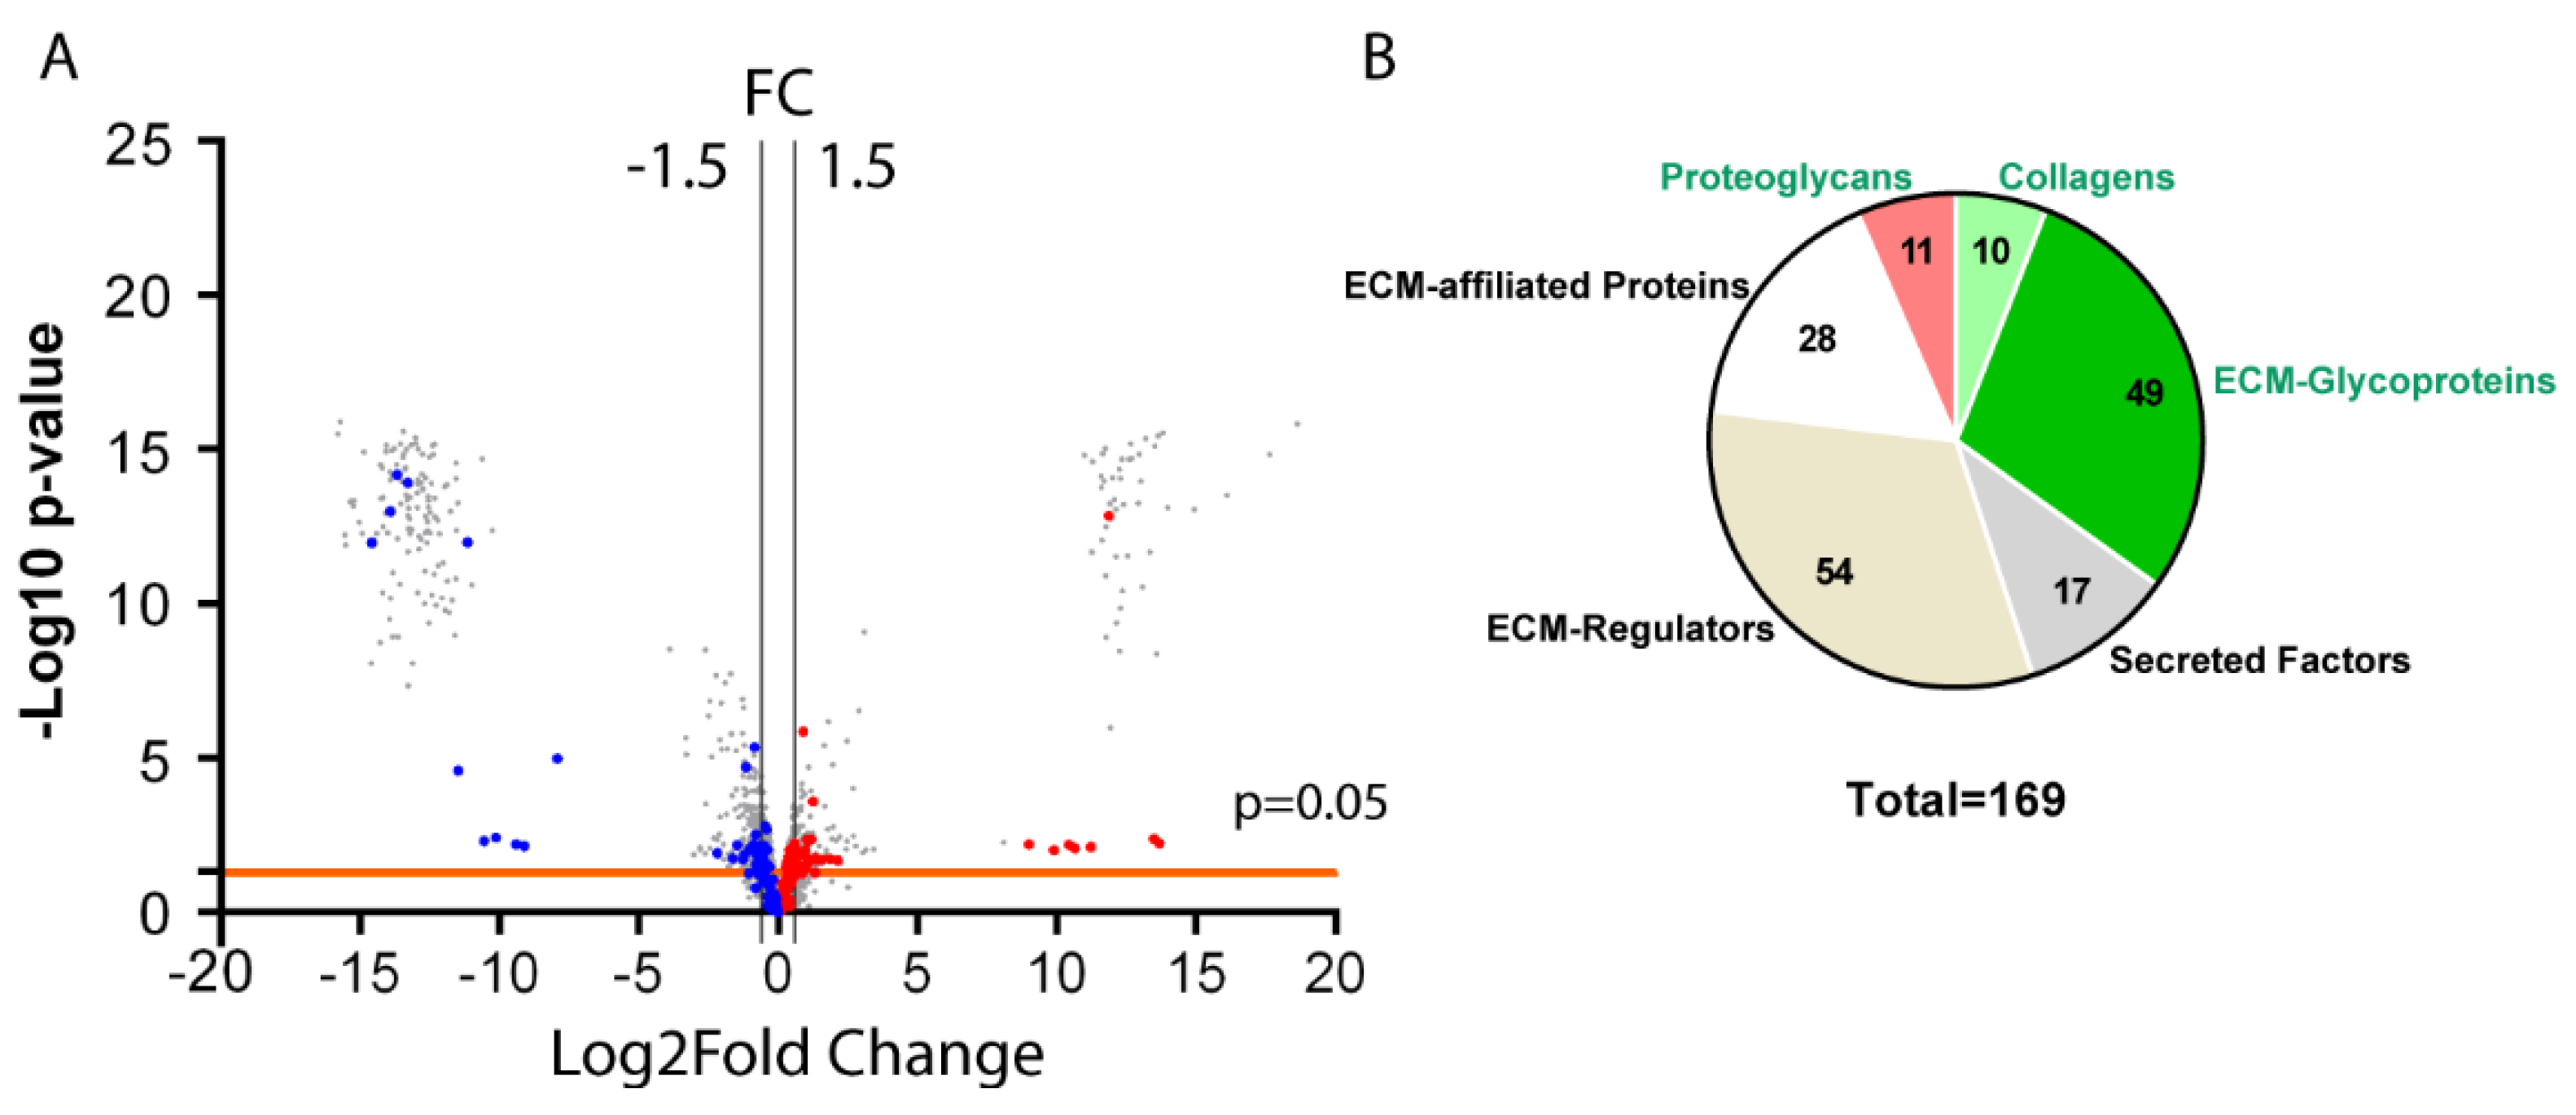
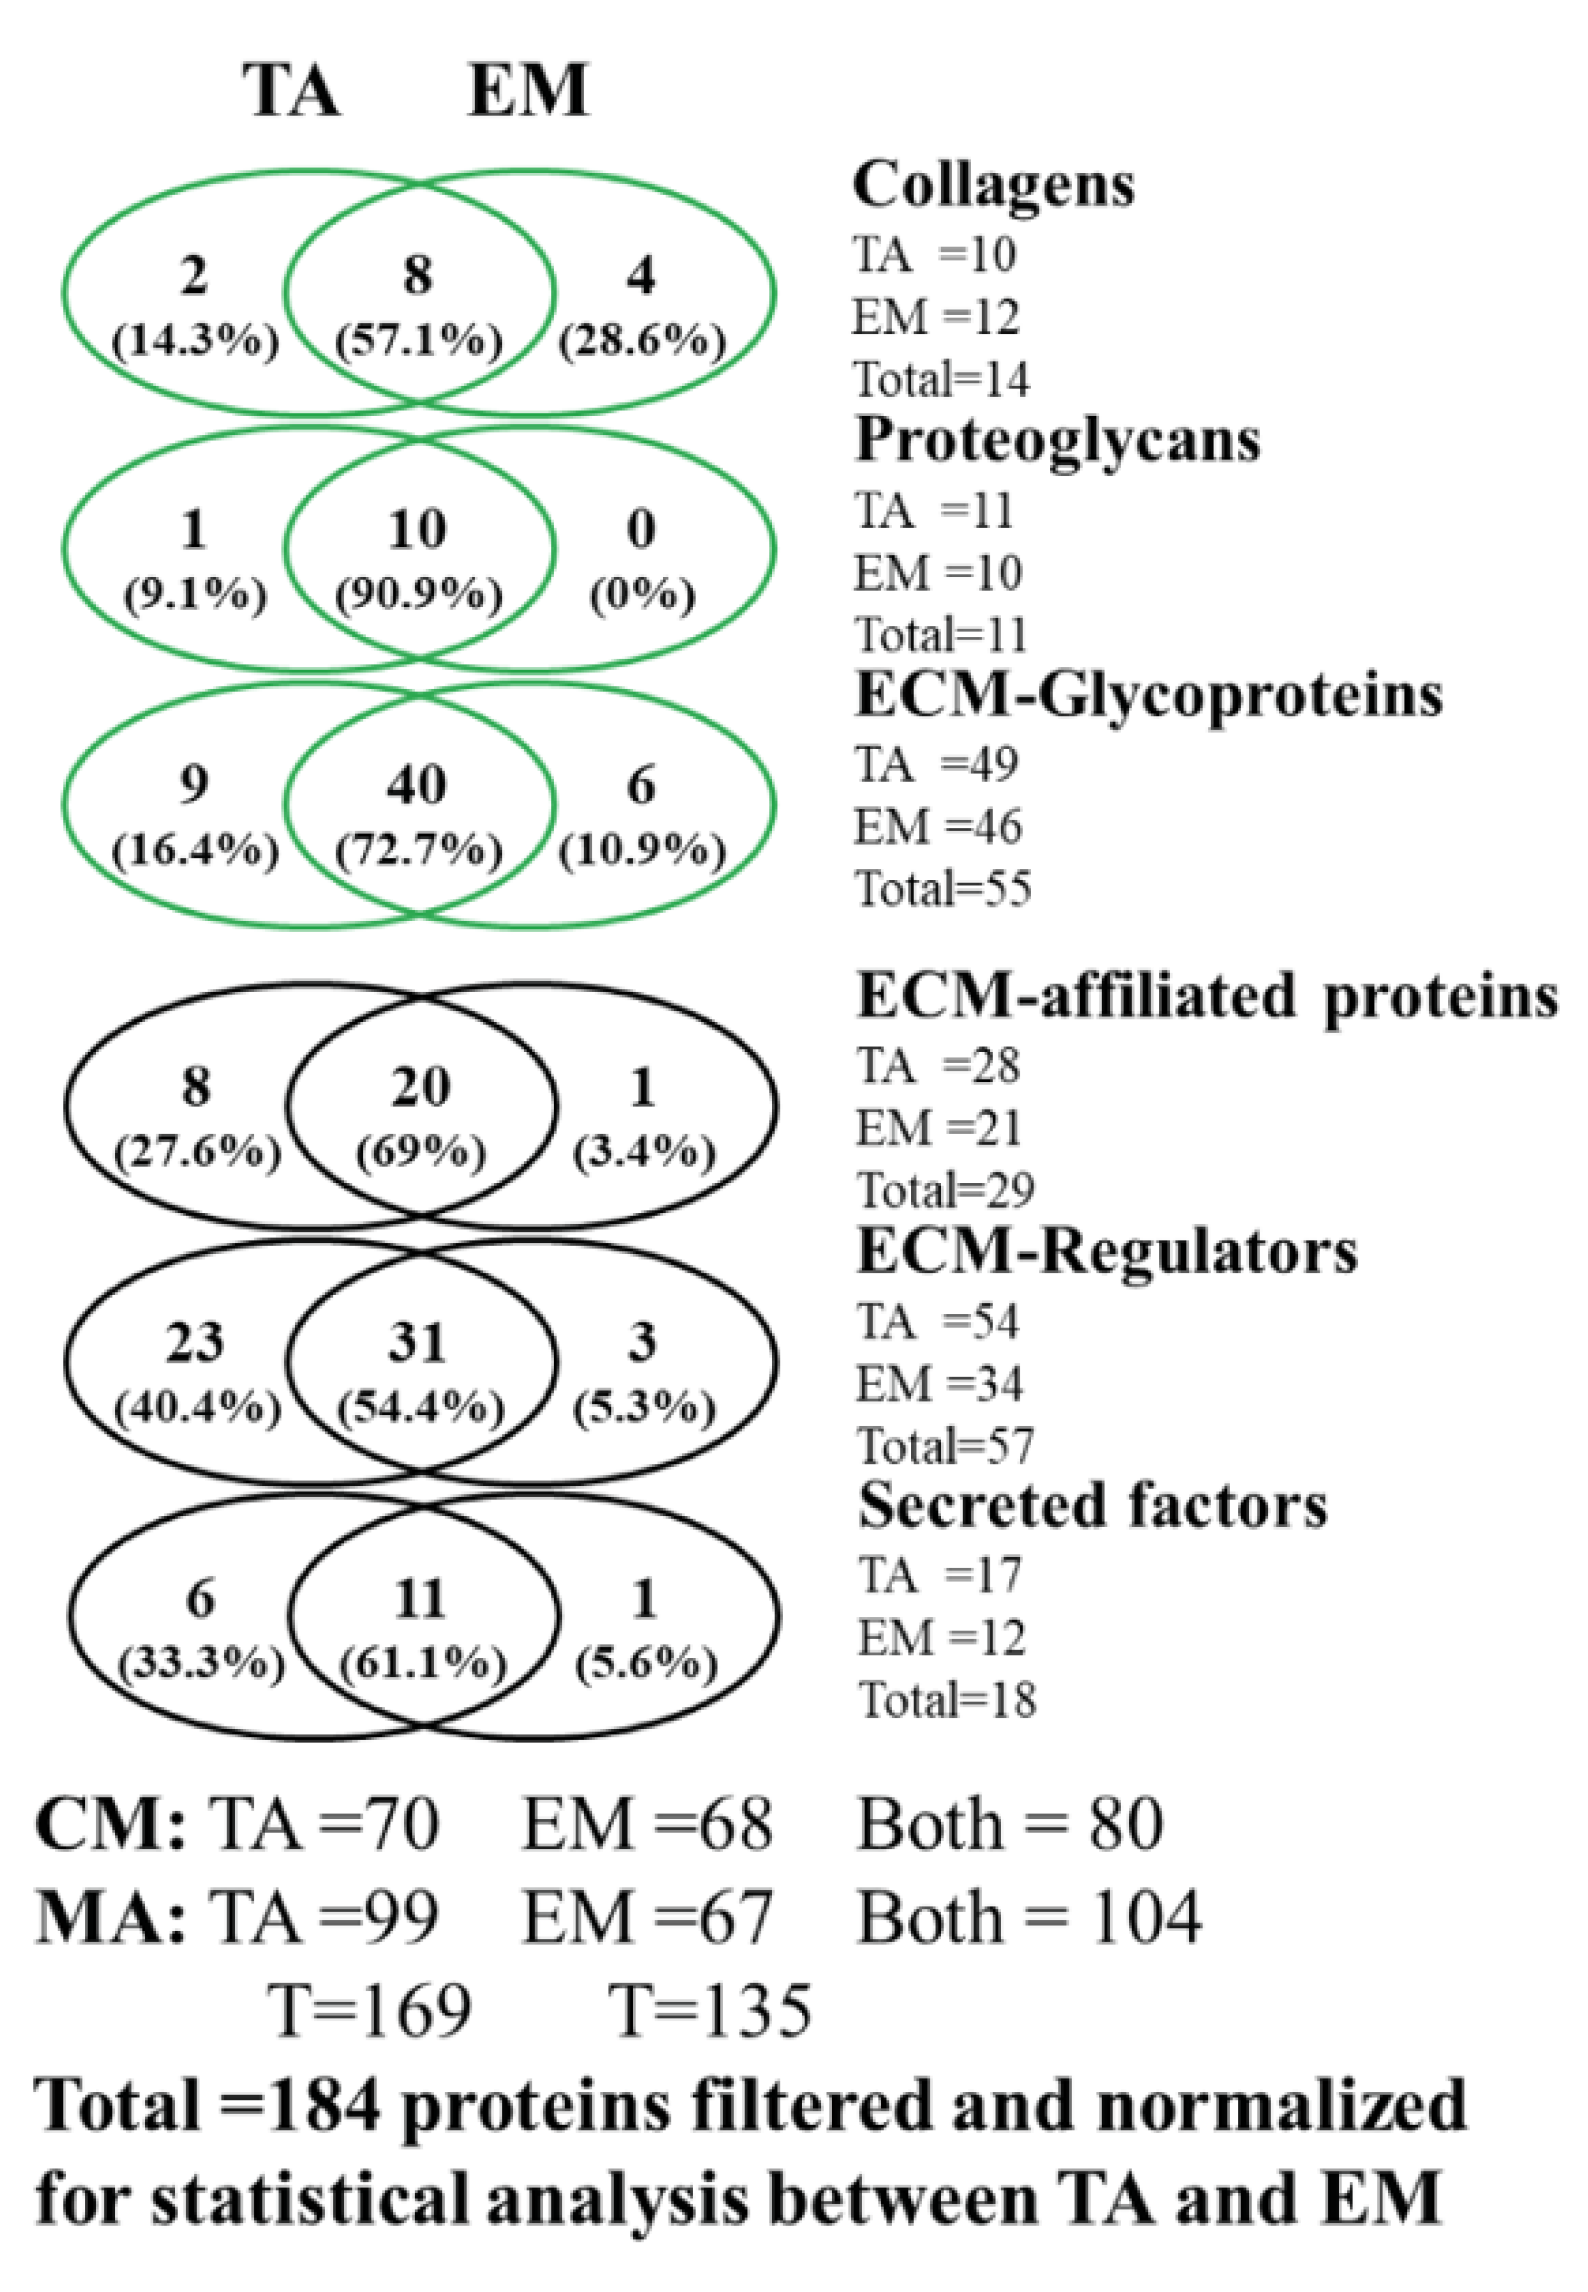
3.1. Analysis of the Matrisome from Total Antrum of BmpR1a△FoxL1+ Mouse

To evaluate the changes in ECM composition in our pre-neoplastic gastric BmpR1a△FoxL1+ mouse model, we calculated the fold change in matrisome proteins between the total antrum of mutant and control mice. The ratio (BmpR1a△FoxL1+/control) of relative expression of total proteins between both groups was compared. Among the 3803 proteins detected, 279 were shown to be upregulated, while 484 were downregulated (Figure 2A). The analysis identified, from the total antrum, the presence of 36 overexpressed matrisome proteins (dark red spots, FC > 1.5) and 37 downregulated proteins (dark blue spots, FC < −1.5) in BmpR1a△FoxL1+ mice compared to those observed in the control group (Figure 2A). Matrisome proteins were identified using the Matrisome Annotator analytical tool (http://matrisomeproject.mit.edu/; accessed on 29 September 2020) [13,14,36]. A total of 169 proteins were identified, 70 of them belonging to the core matrisome and 99 to matrisome-associated proteins. Of the proteins belonging to the core matrisome, we identified 11 proteoglycans, 10 CLs, and 49 glycoproteins, whereas we identified 28 ECM-affiliated proteins, 54 ECM regulators, and 17 secreted factors among the matrisome-associated proteins (Figure 2B). Surprisingly, except for two the CL chains (CL1α2, CL4α1, and α2; CL6α1, α2, and α5; CL12α1 and CL14α1) in BmpR1a△FoxL1+ mice, all were downregulated compared to those observed in controls (Table 1). Only CL15α1 and CL18α1 were upregulated in the mutant mice compared to those in the controls (Table 1). Similarly, most proteoglycans (HSPG2, perlecan; ASPN, asporin; DCN, decorin; LUM, lumican; and VCAN, versican) were observed to be negatively modulated in BmpR1a△FoxL1+ mice compared to those in the controls. Only biglycan (BGN) and bone marrow proteoglycan (PRG2) were upregulated in the mutant mice compared to those in the controls (Table 1) Glycoproteins such as Agrin (AGRN), fibronectin I (FNI), tenascin C (TNC), vitronectin (VTN), and periostin (POSTN) were upregulated in mutant mice compared to those in the controls, whereas others such as microfibrillar-associated proteins (MFAP2, 4, and 5), Nidogen1 and 2 (NID1 and NID2), as well as SPARC-like protein-1 (SPARCL-1) were downregulated (Table 1). Among the matrisome-associated proteins, the analysis revealed that ECM-affiliated proteins such as proteins of the annexin family including annexin 10 (ANXA10) and different galectins, such as galectin-4 (LGALS4) and mucin 4 (MUC4), were upregulated, whereas annexin 6 (ANXA6) and chondroitin sulfate proteoglycan 4 (CSPG4) were downregulated in BmpR1a△FoxL1+ mice compared to those in the controls (Table 1). Analysis of ECM regulators revealed that disintegrin, metalloproteinase family members (ADAM9 and 10), and various serpins (SERPINB1a, SERPINB5, and SERPINB12) were overexpressed, whereas α-1-microglobulin/bikunin (AMBP) and transglutaminase 2 (TGM2) were downregulated in mutant mice compared to those in the controls (Table 1). For the secreted factors, proteomic analyses showed that most members of the S100 protein group (S100A1, A2, A4, A6, A8, A9, A11, A13, A14, A16, and G) were overexpressed, except for S100B, which was downregulated in BmpR1a△FoxL1+ mice compared to that measured in controls (Table 1).

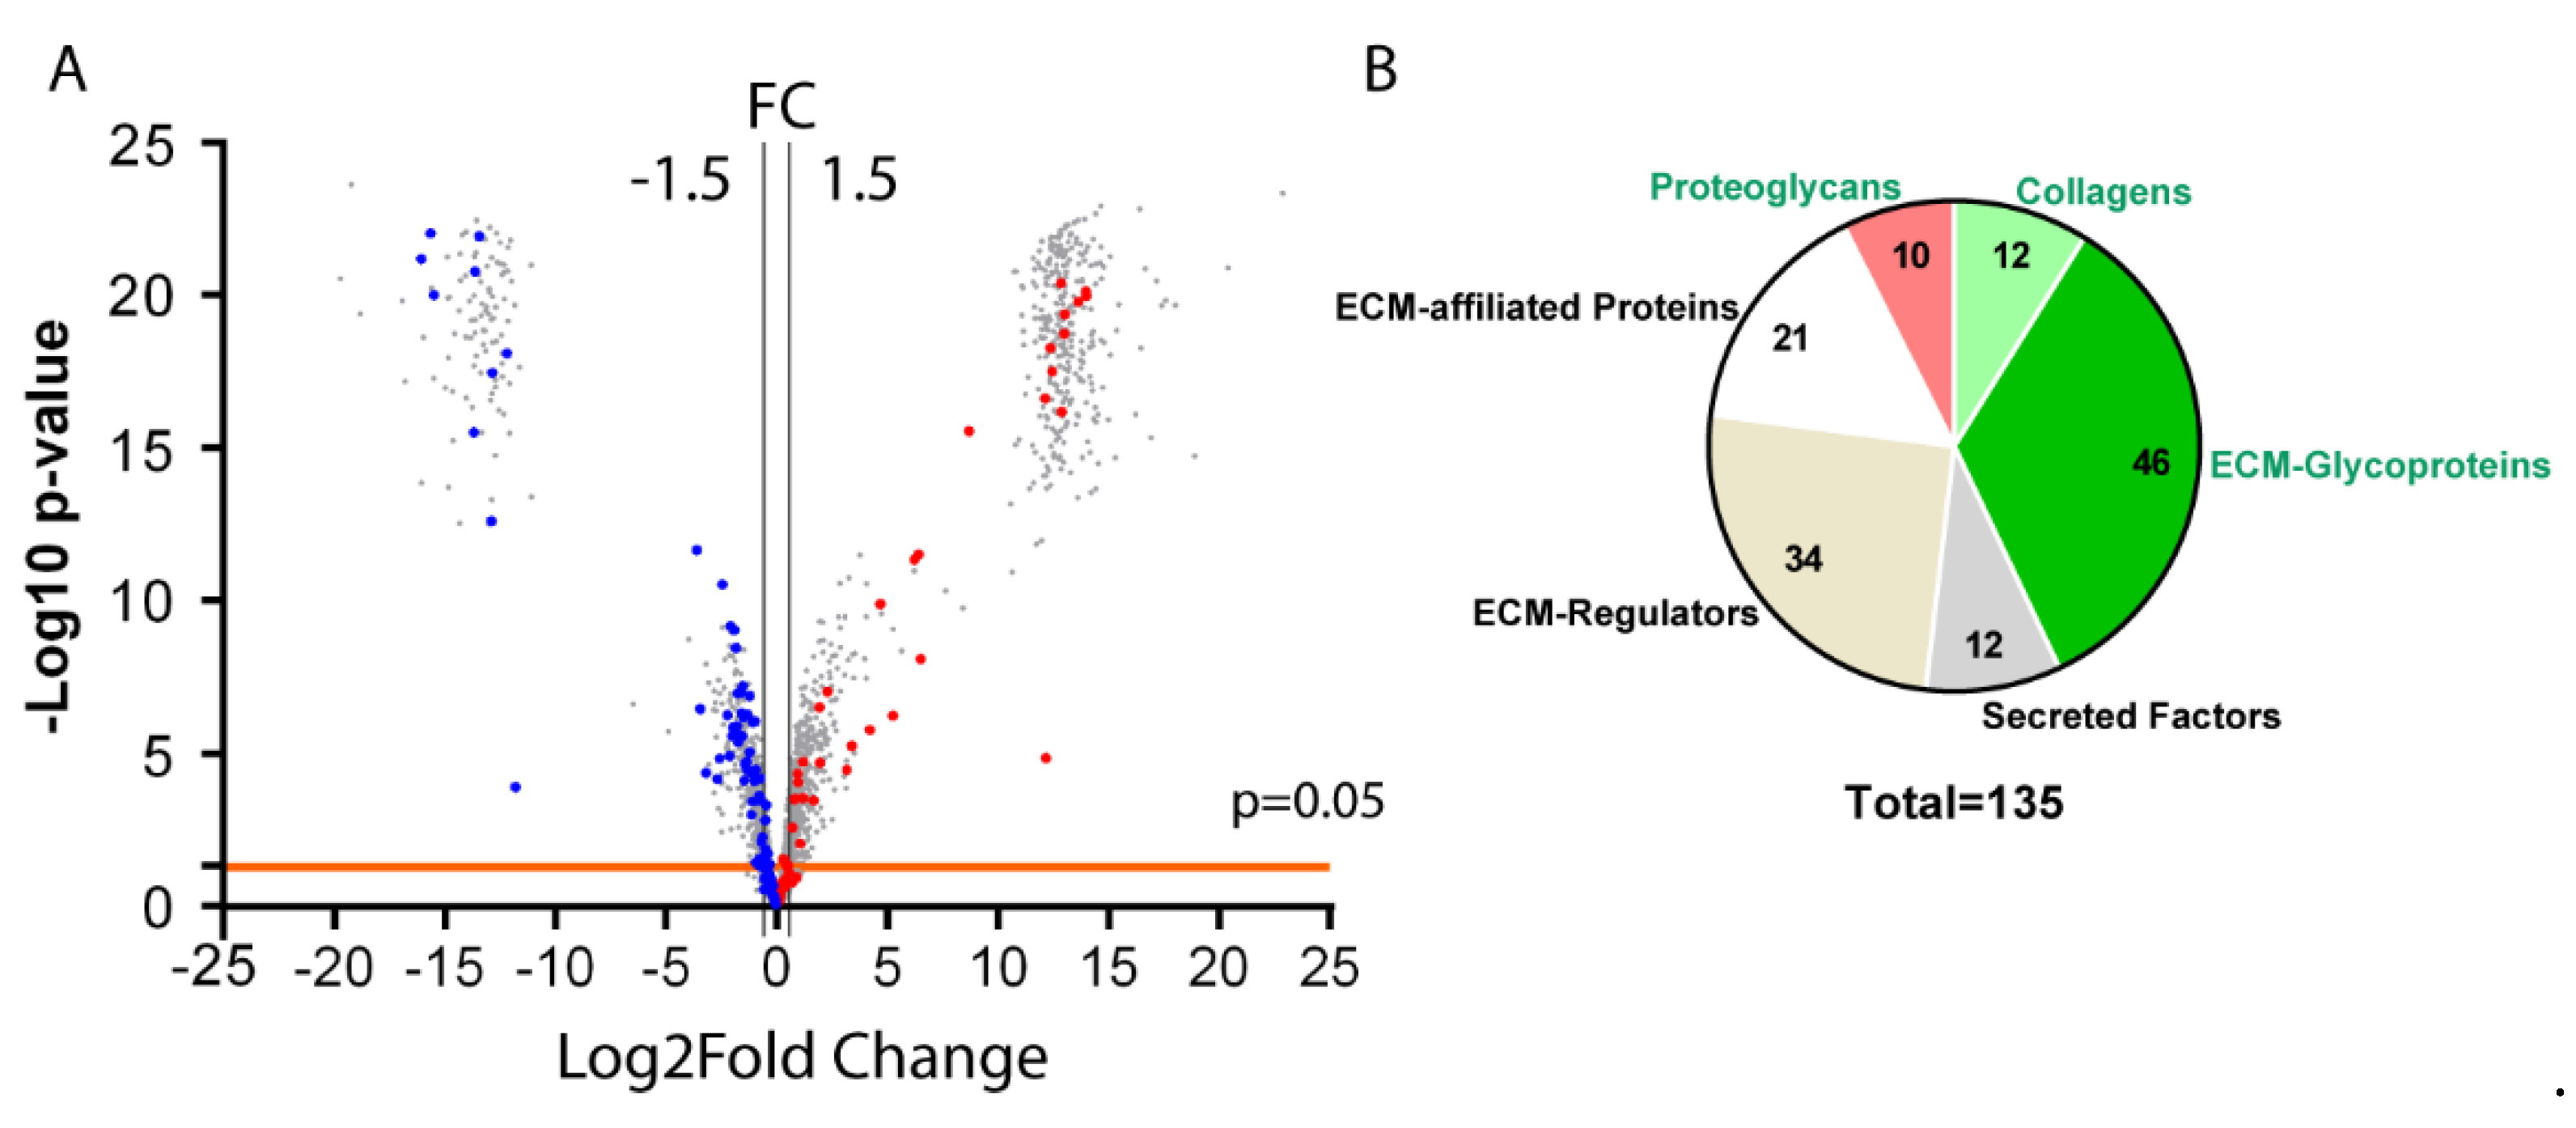
3.2. Analysis of the Matrisome from Enriched Mesenchymal Antrum of BmpR1a△FoxL1+ Mouse

Next, we evaluated changes in the ECM composition of antrum-enriched mesenchyme extracts from both mutant and control mice. We detected 37.5% fewer proteins in the enriched mesenchyme (2377) compared to those in the total antrum (3803); however, we discovered that a greater number of proteins were modulated, with 827 being upregulated and 492 being downregulated (Figure 3A). The analysis of the enriched mesenchymal antrum revealed the presence of 34 overexpressed matrisome proteins (dark red spots, FC > 1.5) and 59 downregulated proteins (dark blue spots, FC < −1.5) in BmpR1a△FoxL1+ mice compared to those in the control group (Figure 3A). As described above, matrisome proteins were identified using the Matrisome Annotator analytical tool (access date: 15 December 2020). A total of 135 proteins were identified, of which 68 belonged to the core matrisome and 67 to the matrisome-associated proteins. Of the proteins belonging to the core matrisome, we identified 10 proteoglycans, 12 CLs, and 46 glycoproteins, whereas among the matrisome-associated proteins, 21 ECM-affiliated proteins, 34 ECM regulators, and 12 secreted factors were identified (Table 2). As observed for the total tissue extract, most CL chains (CL1α1, CL4α1, CL6α1, α2, α3 and α5, and CL15α1) and most proteoglycans (perlecan, asporin, decorin, lumican, and versican) in the antrum enriched mesenchyme were downregulated in BmpR1a△FoxL1+ mice compared to those in the controls (Table 2). We observed that, unlike the total antrum extract, biglycan was downregulated in the enriched mesenchymal antrum extract from mutant mice compared to that from controls (Table 2). Similar results were obtained with the enriched mesenchymal antrum extract for glycoproteins. FN1, TNC, and VTN were upregulated, whereas MFAP2, 4, and 5, NID1 and NID2, and SPARCL-1 were downregulated in mutant mice compared to those measured in controls (Table 2). However, in the enriched mesenchymal antrum extract, Agrin was downregulated, in contrast to our observations for the total antrum extract. Finally, our analysis of the matrisome-associated proteins, ECM-affiliated proteins, ECM regulators, and secreted factors revealed variations in mostly similar proteins identified in the total tissue extract (Table 2). When we compared both analyses, we discovered that the matrisomic variations obtained from the enriched mesenchymal antrum extracts were more robust than those obtained from the total antrum extract.
Data from both types of tissue extracts analyzed were further processed to remove irrelevant data, which led to the identification of 184 matrisome proteins between both experiments (Figure 4). Venn diagrams of the different protein categories, core matrisome (in green), and matrisome-associated proteins (in black), revealed that mesenchymal enrichment did not lead to heavy loss of matrisomal proteins in relation to the total tissue extract, except for the ECM regulators, which were more affected by the tissue treatment. Next, we performed a functional association network using the STRING database and the 116 matrisome proteins that were identified to be significantly modulated in both experiments to obtain a signature profile of proteins indicative of biological processes occurring in the microenvironment of our mouse model. The STRING analysis revealed changes in proteins involved in immune regulation, fibrosis, and tumor microenvironment in BmpR1a△FoxL1+ mice compared to those in controls (data not shown).

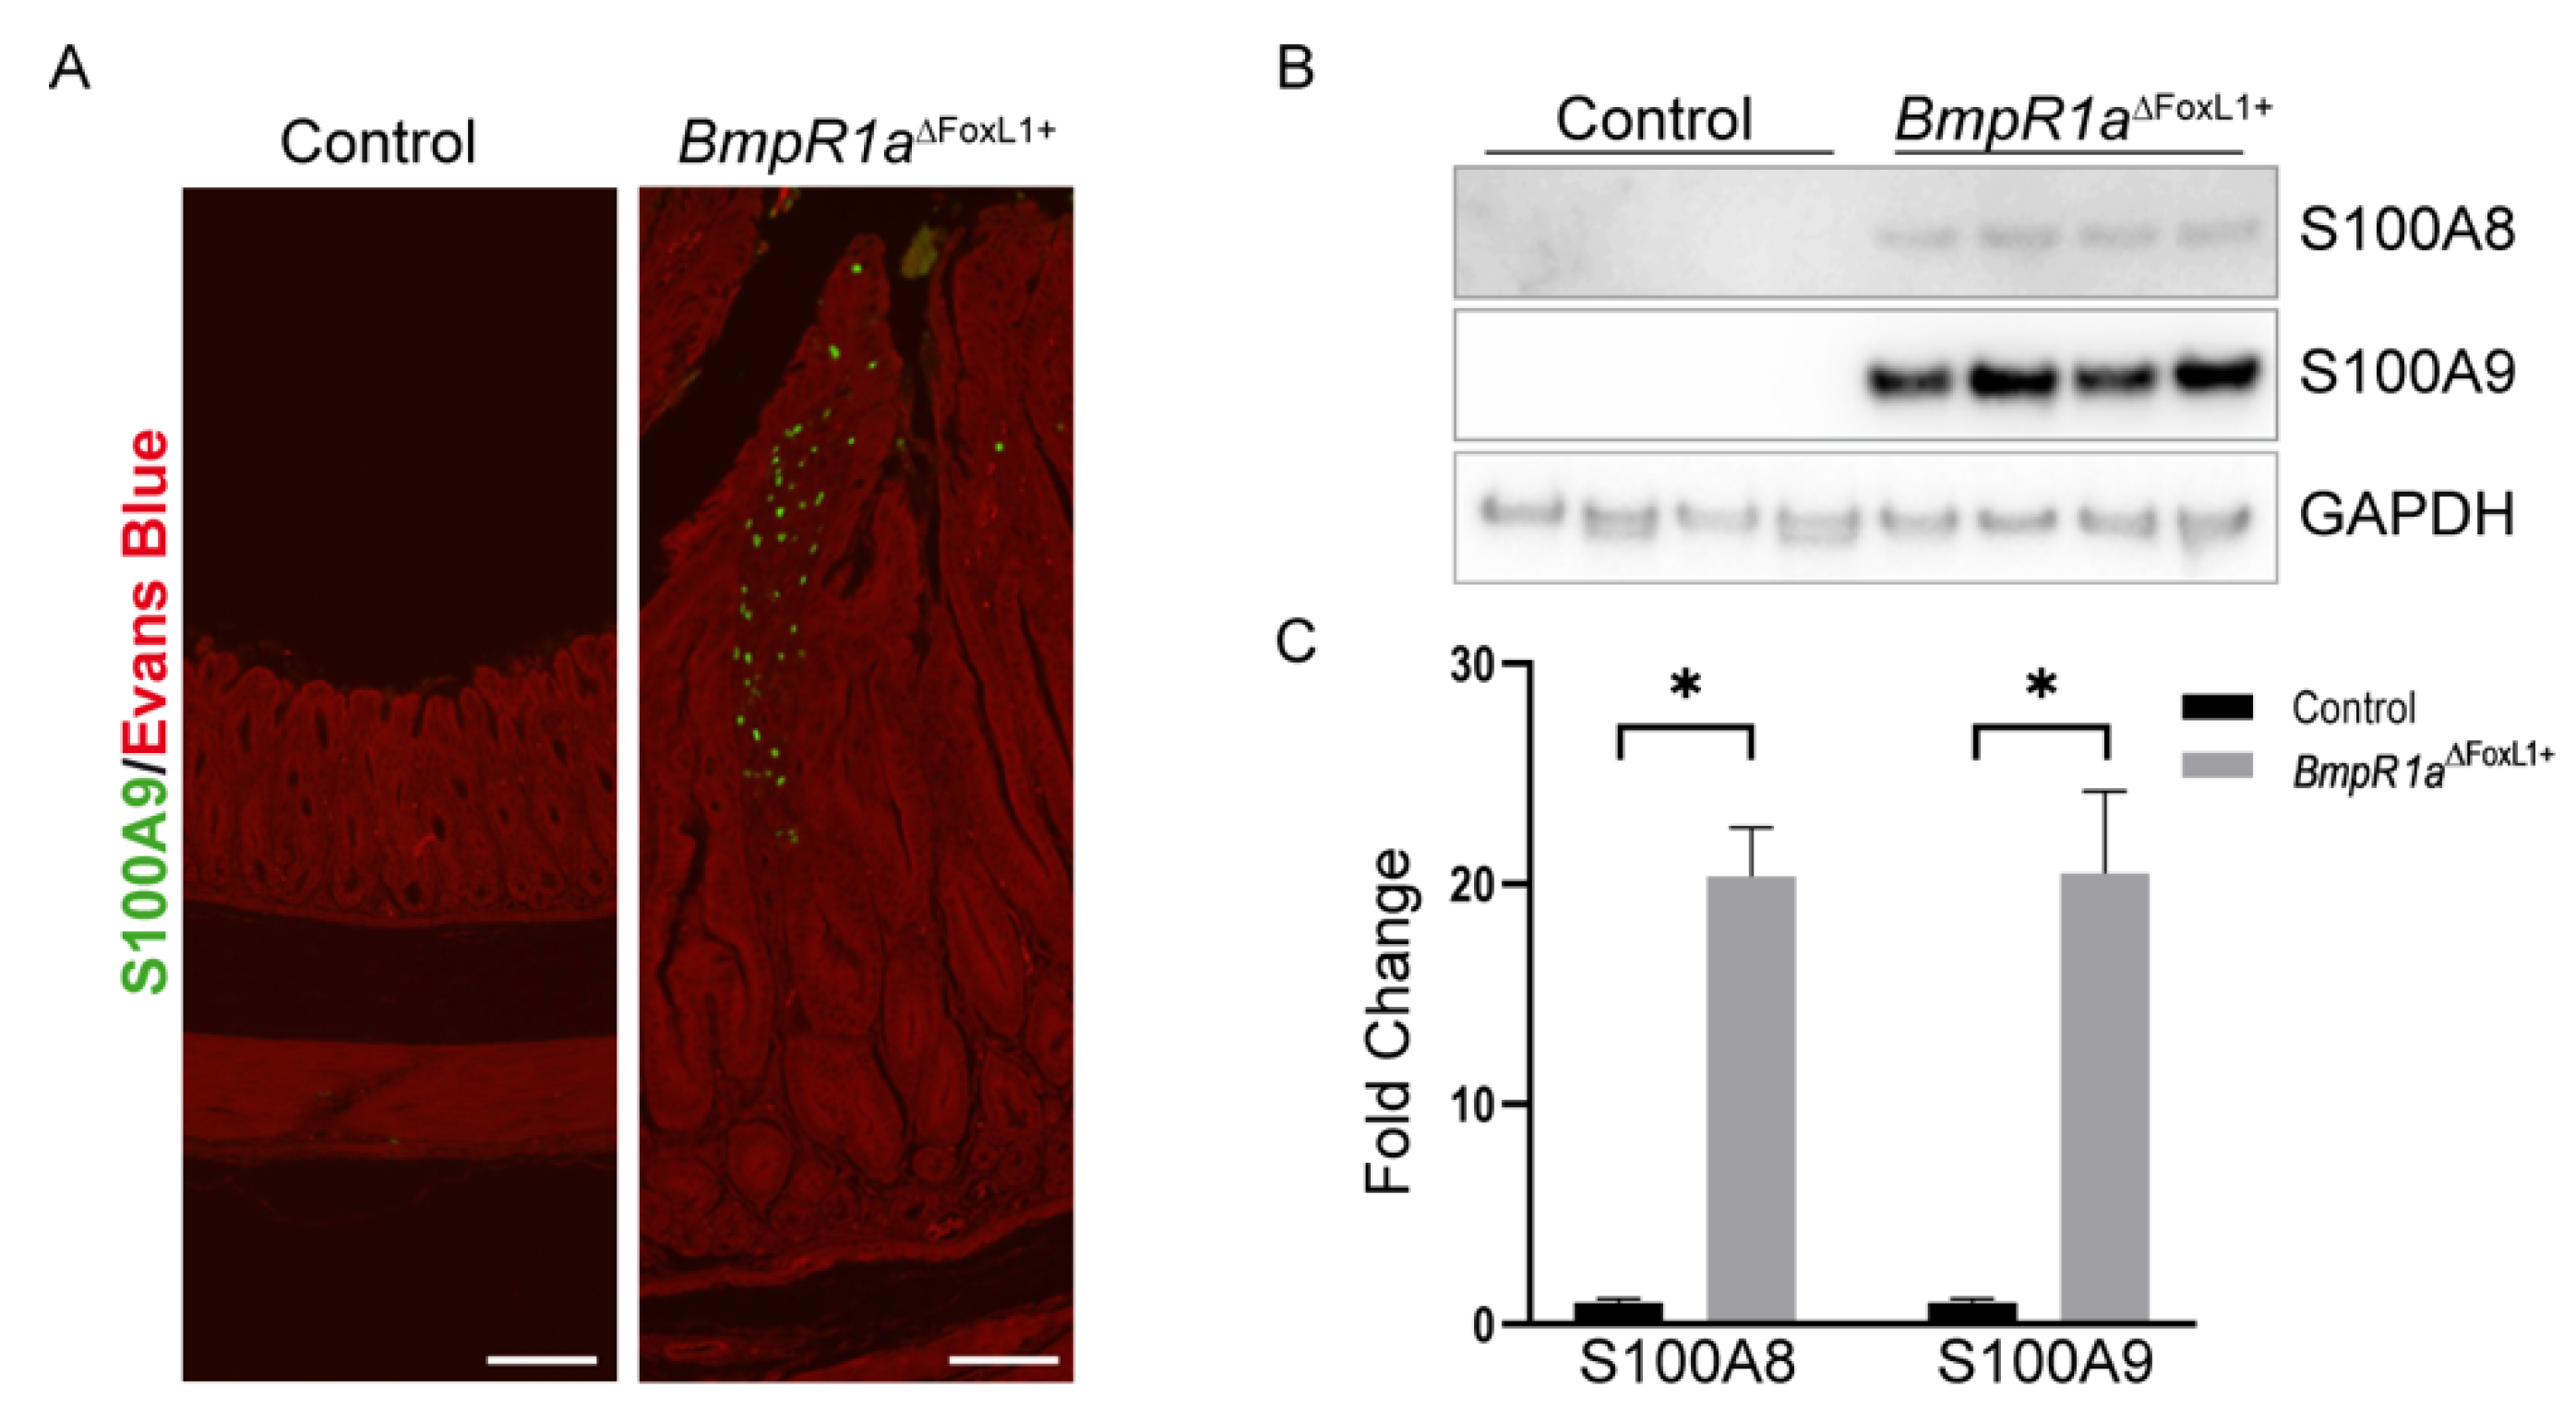
3.3. Loss of BMP Signaling in Gastric TCFoxL1+ Induces Dysregulations in ECM Biodynamics Associated with Inflammation

The tissue microenvironment can play an important role in cellular behavior, and ECM proteins influence the biodynamics as well as cell biology of tissues [37,38,39]. The core matrisome proteins’ influence on the microenvironment through biomechanical and biochemical sensing is evident. However, it is important to take into consideration that the ECM can act as a reservoir for secreted growth factors, chemokines, and cytokines also affecting the microenvironment and impacting cell behavior [37,39]. Histopathologically, BmpR1a△FoxL1+ mice have been shown to be more prone to gastric neoplasia with mild inflammation [22]. Here, a part of the functional network analysis suggested a protein signature profile linked to immune regulation. S100A8 and S100A9, both secreted factors associated with the ECM, have been associated with acute and chronic inflammatory conditions and autoimmune diseases [40,41,42]. Matrisomic profiling revealed a significant increase in S100A8 and S100A9 between BmpR1a△FoxL1+ mice and controls in total antrum (FC = 11,412 and 13058, respectively; Table 1) as well as in the enriched mesenchymal antrum (FC = 37.9 and 85.2, respectively; Table 2). S100A9 expression in mutant mice was confirmed through immunofluorescence, with strong expression in the BmpR1a△FoxL1+ mouse mesenchyme, whereas controls showed no expression of the protein (Figure 5A). In addition, immunoblot analysis against secreted factors S100A8 and A9 revealed de novo expression of both proteins in the mutant mice but not controls, where these proteins were not detected (fold change = 20.34 and 20.48, respectively; Figure 5B,C).

3.4. Disruption of the CL Network in Mice with Impaired Gastric BMP Signaling in TCFoxL1+

CL is a dominant and important element in the pathological microenvironment and has a significant influence on the initiation and development of pathologies such as cancer [10]. Furthermore, its expression is generally increased in gastric cancers [43]. However, as shown in Table 1 and Table 2, the expression of almost all CL chains was negatively modulated in BmpR1a△FoxL1+ mice compared to that in controls (CL1α2, CL4α1, and α2; CL6α1, α2 and α5; CL12α1 and CL14α1). Only a few examples were observed to be positively modulated in mutant mice using both tissue preparation methods (Table 1 and Table 2). These results differ from previously published work with this mouse model [22], in which marked expression and accumulation of CLI and IV in the gastric glands of BmpR1a△FoxL1+ mice were observed. Therefore, we decided to perform further analyses of the CL network in both mouse groups. Collagen deposition, fiber orientation, and spatial distribution were analyzed using picrosirius red staining under bright and polarized light microscopy in both control and mutant mice (Figure 6). The loss of BMP signaling in TCFoxL1+ mice affected the sub-epithelial CL fiber network in mutant mice, mainly towards the upper part of the gland, compared to controls, as shown following picrosirius red staining under bright field (Figure 6A, left panels). Visualization of CL fibers orientation and alignment was performed with polarized light, where fibrillar CL appeared in a range of colors from red, yellow, orange, and green (Figure 6A middle panels). Heterogeneous organization of CL fibers was observed in BmpR1a△FoxL1+ mice, with areas of increased alignment of fibrillar collagen towards the top of the gland compared to that in controls (Figure 6A middle and right panels). Analysis using the OrientationJ plugin in ImageJ indicates a similar distribution of fiber angles between the control and BmpR1a△FoxL1+ mice in the middle part of the glands (Figure 6B). However, the upper gland of the mutant mice revealed a divergent spatial organization of CL fibers with respect to the organization observed in the controls (Figure 6C). The coherency factor was significantly higher in the top of the gland in BmpR1a△FoxL1+ mice (CF = 0.338), indicating that the CL fibers tended to be in a predominant direction and had an increased alignment compared to that observed in control mice (CF = 0.245; Figure 6D).

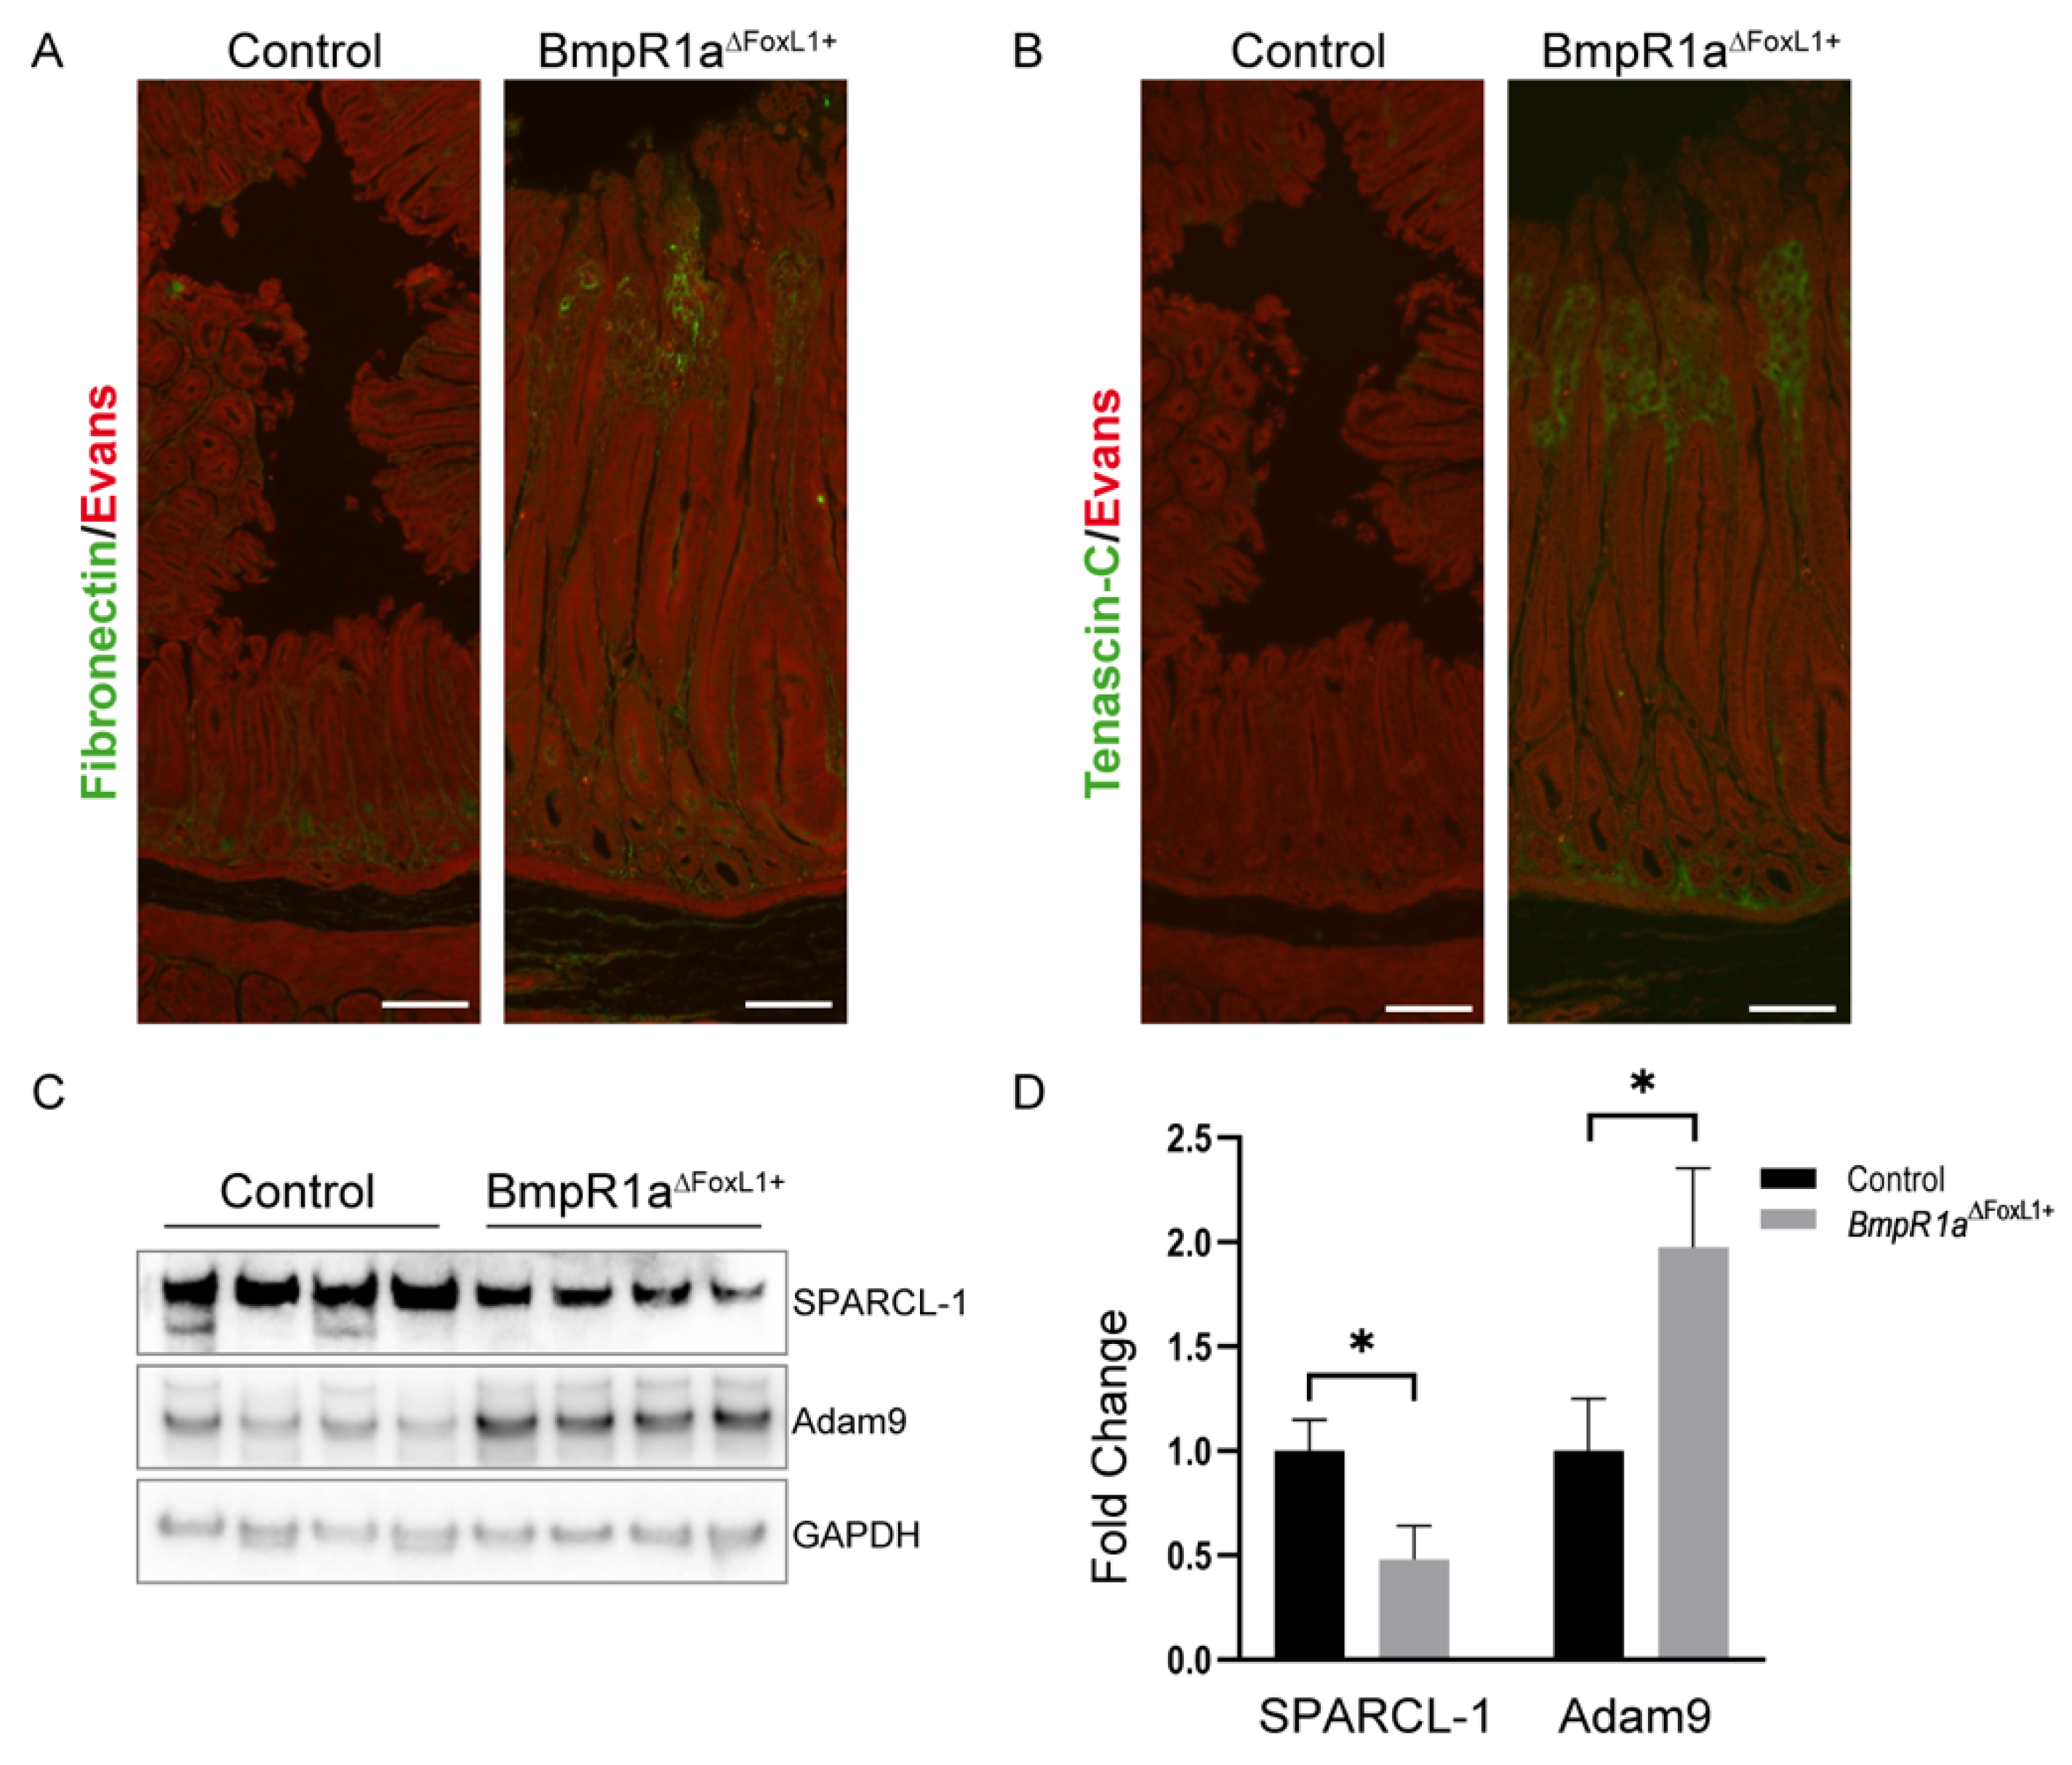
3.5. Loss of BMP Signaling in Gastric TCFoxL1+ Causes Remodeling of ECM Glycoproteins Associated with Early Gastric Neoplasia

ECM glycoproteins and ECM regulators are other matrix components essential for proper tissue function, including the stomach [10,44]. In addition, part of the functional annotation analysis also suggested a protein signature profile linked to the tumor microenvironment. Over the years, several ECM glycoproteins and ECM regulators have been associated with every stage of gastric cancer [45,46,47]. Matrisomic profiling revealed a significant increase in ECM glycoproteins such as FN1 between BmpR1a△FoxL1+ and control enriched mesenchymal antrum (FC = 1.46; Table 2) and TNC in total antrum (FC = 1.4; Table 1) as well as in enriched mesenchymal antrum (FC = 1.95; Table 2). A significant decrease in SPARCL-1 in total antrum (FC = −15377; Table 1) was also observed. Finally, we identified a significant increase in the ECM regulator, ADAM9, only in the in total antrum (FC = 510; Table 1). FN1 (Figure 7A) and TNC (Figure 7B) exhibited increased expressions in BmpR1a△FoxL1+ mice compared to those in controls, as confirmed by immunofluorescence of stomach sections (Figure 7A,B). The immunoblot analysis against SPARCL-1 confirmed a significant decrease in this ECM glycoprotein in mutant mice compared to that measured in controls (fold change = 0.48; Figure 7C,D). Immunoblot analysis against ADAM9 confirmed a significant increase in this ECM regulator in BmpR1a△FoxL1+ mice compared to that in controls (fold change = 1.976; Figure 7C,D).

4. Discussion

Due to the complexity and extremely low solubility of the ECM, exhaustive biochemical characterization of tissues has long been a challenge. In recent years, mass spectrometry has been used to characterize ECM proteins in various tissues [14,48,49,50]. In addition, the developments brought forward by Naba et al. of an in silico definition of the matrisome provide a possibility for a detailed characterization of the biochemistry and composition of the ECM in normal and diseased tissues [13,14,48,51]. Similar to other diseases, ECM deregulation has been shown to play a role in gastric neoplasia by creating a favorable microenvironment for the transformed cells to thrive from pre-neoplastic lesions to metastatic stages [5,52]. Recent studies have demonstrated that TCFoxL1+ are strong contributors to the GI microenvironment [15,17,20,23,24]; however, their precise contribution to the ECM fractions of the microenvironment is less clear. Qualitative analysis of ECM proteins in the BmpR1a△FoxL1+ mouse, where TCFoxL1+ are impaired in BMP signaling, suggests a potential role for this mesenchymal cell population in contributing to the ECM fraction of the microenvironment [18,21,22]. In addition, the pathophysiological phenotype of the BmpR1a△FoxL1+ mouse model is characterized by the development of gastric pre-neoplastic lesions [22]. Together, we discovered that BmpR1a△FoxL1+ mice represent an adequate model for understanding how TCFoxL1+ participates in an aberrant gastric pre-neoplastic ECM microenvironment.
As part of our study was to characterize the ECM contribution of BMP-signaling impaired TCFoxL1+ to the pre-neoplastic gastric microenvironment, we explored the validity of using enriched mesenchyme over total tissue extract for targeting matrisomic proteins. Tissue deconstruction into minimal mesenchymal compartment, where TCFoxL1+ and the microenvironment are observable, allows for the possibility of circumventing the complexity of the total tissue protein content. As expected, we observed an important decrease in the presence of ECM regulator proteins when we used enriched mesenchymal extract in comparison to the total tissue extract because these proteins are not bound to the ECM. Thus, they are easily lost during purification processes [48]. Deconstruction of the gastric antrum provides a more comprehensive analysis of the matrisome in BmpR1a△FoxL1+ mice compared to controls, with the removal of background noise from non-matrisomic proteins. In addition, the mesenchymal-enriched extract allows for improved identification of proteins with low expression levels that could be easily lost in a larger pool of proteins.
In a previous study, the gastric pathophysiological aspects of the BmpR1a△FoxL1+ mouse model showed that disruption of BMP signaling in TCFoxL1+ led to the creation of a toxic microenvironment with an increase in CLI, fibronectin, HGF, and FSP1/S100A4, pressuring the epithelium to initiate pre-malignant lesions [22]. Correa’s cascade of gastric carcinogenesis shows that a normal gastric epithelium gradually transitions from initial gastritis to chronic gastritis, mucosal atrophy, metaplasia, dysplasia, and carcinoma [53,54]. Early steps of this cascade prior to carcinoma involve the presence of inflammatory processes [54,55] and a reorganization of the nurturing microenvironment into a tumor microenvironment [5]. Interestingly, some protein profiles, such as immune regulation, fibrosis, and tumor microenvironment, were noticeably modulated in the BmpR1a△FoxL1+ matrisome analysis. Thus, the present protein profile, in combination with our previous phenotypic analysis of BmpR1a△FoxL1+ mice, allows for a better understanding of the sequence of events occurring in the ECM microenvironment of these mice with BMP-impaired TCFoxL1+ with regard to early events in gastric neoplasia.
Consequently, the overexpression of S100A8 and A9 in the matrisomic analysis, as secreted factors associated with the ECM, supports these profiles. Both proteins have been associated with numerous human disorders, including acute and chronic inflammatory conditions, autoimmune diseases, and cancer [40,56,57]. They are also reported to represent highly potent biomarkers of a wide range of inflammatory processes, including rheumatoid arthritis and inflammatory bowel disease [41,58]. In tumor biology, both proteins play a fundamental role, and their levels are elevated in numerous tumors, including gastric cancer, which is in line with our model [57,59,60,61,62,63]. Although there are signs of inflammation in mice with infiltration of lymphocytes (CD3) and macrophages (F4/80), no chronic inflammation was observed [22]. This could partially explain the overexpression of S100A8/A9 in the gastric microenvironment of the BmpR1a△FoxL1+ mice.
As for the tumor microenvironment profile identified in this study, ECM glycoproteins and ECM regulators are known to play key roles in the microenvironment for proper tissue function including the stomach [2,5,10,45,64,65,66]. For example, matricellular proteins such as FN1, TNC, and ADAM9 were upregulated, while SPARCL-1/Hevin was downregulated. In addition, these ECM glycoproteins and ECM regulators have been linked to the tumor microenvironment in various stages of gastric cancer [67,68,69,70]. Deregulation of protein expression, such as FN1 and ADAM9 (upregulated) or SPARCL-1 (downregulated), has been shown to affect cell growth and tissue proliferation in gastric cancer [70,71,72,73]. The hyperplasia seen in the gastric glands of BmpR1a△FoxL1+ mice [22] could be, in part, explained by the modification of these proteins in the microenvironment. TNC is generally absent or suppressed in most normal adult tissues, while it is markedly overexpressed in some pathological conditions, such as wound healing, inflammation, and in a variety of neoplasms [74]. This expression pattern was observed in the stomachs of BmpR1a△FoxL1+ mice when compared to that of controls. Thus, similar to gastrointestinal stromal tumors [67], whereas TNC is used as a potential marker, it can also be used as an indicator of gastric premalignancies, according to the results shown in this study.
CL is a polymeric protein present in greater quantities in the ECM under physiological conditions [75,76], as well as in the tumor microenvironment, where its extensive deposition is one of the pathological characteristics of cancers, such as gastric neoplasia [43,77]. As collagens play an important structural role in the ECM and contribute to its mechanical properties by influencing cellular behavior [78], any changes in CL organization, expression, and/or crosslinking will directly affect optimal tissue function [79]. Unexpectedly, in this study, we discovered that almost all CL chains analyzed using MS were downregulated in the BmpR1a△FoxL1+ pre-neoplastic model. This is in contrast to previous findings, especially regarding what is known from descriptive studies on ECM in gastric cancer, as well as previous studies with BmpR1a△FoxL1+ [5,22,43]. Other proteomic analyses have shown the difficulties of optimal CL protein extraction from tissues, especially when fibrotic [36,80,81]. We hypothesize that the extraction method used in this study was not optimal for CL protein analysis [81]. However, the choice of another method favoring CL protein extraction could be detrimental to the analysis of other matrisomic proteins [81]. Considering that CL chain expression, as well as its mechanical and biochemical organization, could be validated through other techniques, proteomic analyses would not be the preferred technique for studying fibrotic tissues. In this study, Sirius red staining under bright field was used for the visualization of total CL deposition in tissue, while under polarized light microscopy it provided more relevant information regarding the CL network, such as its organization, stiffness, and fiber alignment.
Altogether, the present study provides a more comprehensive representation of the evolving ECM fraction from the microenvironment in pre-neoplastic gastric lesions associated with BMP signaling-impaired TCFoxL1+. These findings support the importance of TCFoxL1+ and BMP signaling in the maintenance of a healthy microenvironment to maintain gastric homeostasis and prevent the development of pathologies such as neoplasia.

Author Contributions

Conceptualization, N.P. and F.-M.B.; methodology, A.B.A.; software, J.R., C.-M.J.; validation, A.B.A., V.P. and V.R.N.; formal analysis, A.B.A., V.P., F.-M.B. and NP.; investigation, A.B.A.; resources, N.P.; data curation, A.B.A.; writing—original draft preparation, N.P.; writing—review and editing, N.P. and F.-M.B.; visualization, A.B.A.; supervision, N.P. and F.-M.B.; project administration, N.P.; funding acquisition, N.P. and F.-M.B. All authors have read and agreed to the published version of the manuscript.

Funding

This research was funded by the Natural Sciences and Engineering Research Council of Canada (NSERC) RGPIN-2018-05414 to F.M.B. and RGPIN 2018-06115 to N.P.

Institutional Review Board Statement

The study protocol was approved by the Animal Welfare Research Committee of the Faculty of Medicine and Health Sciences of the Université de Sherbrooke (FMSS-2019-2370), and all experiments were conducted in strict adherence to the standards and policies of the Canadian Council on Animal Care in Sciences.

Data Availability Statement

Raw files, databases, and MaxQuant results have been deposited in ProteomeXchange with the accession number PXD038603.

Acknowledgments

NP and FMB are members of the Fonds de Recherche du Québec-Santé-funded “Centre de Recherche CHUS”. FMB is an FRQS senior scholar (award number 281824). The authors thank KHK for providing the FoxL1Cre transgenic line, Ariane De Castro for her technical assistance with the mouse colony and genotyping, and Electron Microscopy and Histology Research Core of the Faculté de Médecine et des Sciences de la Santé at the Université de Sherbrooke for their histology, electron microscopy, and phenotyping services.

Conflicts of Interest

The authors declare no conflict of interest.

References

  1. Mouw, J.K.; Ou, G.; Weaver, V.M. Extracellular matrix assembly: A multiscale deconstruction. Nat. Rev. Mol. Cell Biol. 2014, 15, 771–785. [Google Scholar] [CrossRef] [PubMed] [Green Version]
  2. Walker, C.; Mojares, E.; Del Rio Hernandez, A. Role of Extracellular Matrix in Development and Cancer Progression. Int. J. Mol. Sci. 2018, 19, 3028. [Google Scholar] [CrossRef] [Green Version]
  3. Filipe, E.C.; Chitty, J.L.; Cox, T.R. Charting the unexplored extracellular matrix in cancer. Int. J. Exp. Pathol. 2018, 99, 58–76. [Google Scholar] [CrossRef] [PubMed] [Green Version]
  4. Pickup, M.W.; Mouw, J.K.; Weaver, V.M. The extracellular matrix modulates the hallmarks of cancer. EMBO Rep. 2014, 15, 1243–1253. [Google Scholar] [CrossRef] [PubMed] [Green Version]
  5. Moreira, A.M.; Pereira, J.; Melo, S.; Fernandes, M.S.; Carneiro, P.; Seruca, R.; Figueiredo, J. The Extracellular Matrix: An Accomplice in Gastric Cancer Development and Progression. Cells 2020, 9, 394. [Google Scholar] [CrossRef] [Green Version]
  6. Gerarduzzi, C.; Hartmann, U.; Leask, A.; Drobetsky, E. The Matrix Revolution: Matricellular Proteins and Restructuring of the Cancer Microenvironment. Cancer Res. 2020, 80, 2705–2717. [Google Scholar] [CrossRef] [Green Version]
  7. Brauchle, E.; Kasper, J.; Daum, R.; Schierbaum, N.; Falch, C.; Kirschniak, A.; Schaffer, T.E.; Schenke-Layland, K. Biomechanical and biomolecular characterization of extracellular matrix structures in human colon carcinomas. Matrix Biol. 2018, 68–69, 180–193. [Google Scholar] [CrossRef]
  8. Xu, S.; Xu, H.; Wang, W.; Li, S.; Li, H.; Li, T.; Zhang, W.; Yu, X.; Liu, L. The role of collagen in cancer: From bench to bedside. J. Transl. Med. 2019, 17, 309. [Google Scholar] [CrossRef] [Green Version]
  9. Yang, Z.; Xue, F.; Li, M.; Zhu, X.; Lu, X.; Wang, C.; Xu, E.; Wang, X.; Zhang, L.; Yu, H.; et al. Extracellular Matrix Characterization in Gastric Cancer Helps to Predict Prognosis and Chemotherapy Response. Front. Oncol. 2021, 11, 753330. [Google Scholar] [CrossRef]
  10. Bonnans, C.; Chou, J.; Werb, Z. Remodelling the extracellular matrix in development and disease. Nat. Rev. Mol. Cell Biol. 2014, 15, 786–801. [Google Scholar] [CrossRef]
  11. Hynes, R.O.; Naba, A. Overview of the matrisome—An inventory of extracellular matrix constituents and functions. Cold Spring Harb. Perspect. Biol. 2012, 4, a004903. [Google Scholar] [CrossRef] [PubMed] [Green Version]
  12. Karamanos, N.K.; Theocharis, A.D.; Piperigkou, Z.; Manou, D.; Passi, A.; Skandalis, S.S.; Vynios, D.H.; Orian-Rousseau, V.; Ricard-Blum, S.; Schmelzer, C.E.H.; et al. A guide to the composition and functions of the extracellular matrix. FEBS J. 2021, 288, 6850–6912. [Google Scholar] [CrossRef] [PubMed]
  13. Naba, A.; Clauser, K.R.; Ding, H.; Whittaker, C.A.; Carr, S.A.; Hynes, R.O. The extracellular matrix: Tools and insights for the “omics” era. Matrix Biol. 2016, 49, 10–24. [Google Scholar] [CrossRef] [PubMed]
  14. Naba, A.; Clauser, K.R.; Hoersch, S.; Liu, H.; Carr, S.A.; Hynes, R.O. The matrisome: In silico definition and in vivo characterization by proteomics of normal and tumor extracellular matrices. Mol. Cell. Proteom. 2012, 11, M111.014647. [Google Scholar] [CrossRef] [Green Version]
  15. McCarthy, N.; Manieri, E.; Storm, E.E.; Saadatpour, A.; Luoma, A.M.; Kapoor, V.N.; Madha, S.; Gaynor, L.T.; Cox, C.; Keerthivasan, S.; et al. Distinct Mesenchymal Cell Populations Generate the Essential Intestinal BMP Signaling Gradient. Cell Stem Cell 2020, 26, 391–402.e5. [Google Scholar] [CrossRef]
  16. Powell, D.W.; Pinchuk, I.V.; Saada, J.I.; Chen, X.; Mifflin, R.C. Mesenchymal cells of the intestinal lamina propria. Annu. Rev. Physiol. 2011, 73, 213–237. [Google Scholar] [CrossRef] [Green Version]
  17. Shoshkes-Carmel, M.; Wang, Y.J.; Wangensteen, K.J.; Toth, B.; Kondo, A.; Massasa, E.E.; Itzkovitz, S.; Kaestner, K.H. Subepithelial telocytes are an important source of Wnts that supports intestinal crypts. Nature 2018, 557, 242–246. [Google Scholar] [CrossRef]
  18. Allaire, J.M.; Roy, S.A.; Ouellet, C.; Lemieux, E.; Jones, C.; Paquet, M.; Boudreau, F.; Perreault, N. Bmp signaling in colonic mesenchyme regulates stromal microenvironment and protects from polyposis initiation. Int. J. Cancer 2016, 138, 2700–2712. [Google Scholar] [CrossRef] [Green Version]
  19. Langlois, M.J.; Servant, R.; Reyes Nicolas, V.; Jones, C.; Roy, S.A.B.; Paquet, M.; Carrier, J.C.; Rivard, N.; Boudreau, F.; Perreault, N. Loss of PTEN Signaling in Foxl1(+) Mesenchymal Telocytes Initiates Spontaneous Colonic Neoplasia in Mice. Cell. Mol. Gastroenterol. Hepatol. 2019, 8, 530–533.e5. [Google Scholar] [CrossRef] [Green Version]
  20. McCarthy, N.; Kraiczy, J.; Shivdasani, R.A. Cellular and molecular architecture of the intestinal stem cell niche. Nature 2020, 22, 1033–1041. [Google Scholar] [CrossRef]
  21. Reyes Nicolas, V.; Allaire, J.M.; Alfonso, A.B.; Pupo Gomez, D.; Pomerleau, V.; Giroux, V.; Boudreau, F.; Perreault, N. Altered Mucus Barrier Integrity and Increased Susceptibility to Colitis in Mice upon Loss of Telocyte Bone Morphogenetic Protein Signalling. Cells 2021, 10, 2954. [Google Scholar] [CrossRef] [PubMed]
  22. Roy, S.A.; Allaire, J.M.; Ouellet, C.; Maloum-Rami, F.; Pomerleau, V.; Lemieux, E.; Babeu, J.P.; Rousseau, J.; Paquet, M.; Garde-Granger, P.; et al. Loss of mesenchymal bone morphogenetic protein signaling leads to development of reactive stroma and initiation of the gastric neoplastic cascade. Sci. Rep. 2016, 6, 32759. [Google Scholar] [CrossRef] [PubMed]
  23. Aoki, R.; Shoshkes-Carmel, M.; Gao, N.; Shin, S.; May, C.L.; Golson, M.L.; Zahm, A.M.; Ray, M.; Wiser, C.L.; Wright, C.V.; et al. Foxl1-expressing mesenchymal cells constitute the intestinal stem cell niche. Cell. Mol. Gastroenterol. Hepatol. 2016, 2, 175–188. [Google Scholar] [CrossRef] [PubMed] [Green Version]
  24. Greicius, G.; Kabiri, Z.; Sigmundsson, K.; Liang, C.; Bunte, R.; Singh, M.K.; Virshup, D.M. PDGFRalpha(+) pericryptal stromal cells are the critical source of Wnts and RSPO3 for murine intestinal stem cells in vivo. Proc. Natl. Acad. Sci. USA 2018, 115, E3173–E3181. [Google Scholar] [CrossRef] [Green Version]
  25. Kaestner, K.H. The Intestinal Stem Cell Niche: A Central Role for Foxl1-Expressing Subepithelial Telocytes. Cell. Mol. Gastroenterol. Hepatol. 2019, 8, 111–117. [Google Scholar] [CrossRef] [Green Version]
  26. Kondo, A.; Kaestner, K.H. Emerging diverse roles of telocytes. Development 2019, 146, dev175018. [Google Scholar] [CrossRef] [Green Version]
  27. Sackett, S.D.; Fulmer, J.T.; Friedman, J.R.; Kaestner, K.H. Foxl1-Cre BAC transgenic mice: A new tool for gene ablation in the gastrointestinal mesenchyme. Genesis 2007, 45, 518–522. [Google Scholar] [CrossRef]
  28. Mishina, Y.; Hanks, M.C.; Miura, S.; Tallquist, M.D.; Behringer, R.R. Generation of Bmpr/Alk3 conditional knockout mice. Genesis 2002, 32, 69–72. [Google Scholar] [CrossRef]
  29. Pomerleau, V.; Nicolas, V.R.; Jurkovic, C.M.; Faucheux, N.; Lauzon, M.A.; Boisvert, F.M.; Perreault, N. FOXL1+ Telocytes in mouse colon orchestrate extracellular matrix biodynamics and wound repair resolution. J. Proteom. 2023, 21, 104755. [Google Scholar] [CrossRef]
  30. Wieczorek, S.; Combes, F.; Lazar, C.; Giai Gianetto, Q.; Gatto, L.; Dorffer, A.; Hesse, A.M.; Coute, Y.; Ferro, M.; Bruley, C.; et al. DAPAR & ProStaR: Software to perform statistical analyses in quantitative discovery proteomics. Bioinformatics 2017, 33, 135–136. [Google Scholar] [CrossRef]
  31. Allaire, J.M.; Darsigny, M.; Marcoux, S.S.; Roy, S.A.; Schmouth, J.F.; Umans, L.; Zwijsen, A.; Boudreau, F.; Perreault, N. Loss of Smad5 leads to the disassembly of the apical junctional complex and increased susceptibility to experimental colitis. Am. J. Physiol. Gastrointest. Liver Physiol. 2011, 300, G586–G597. [Google Scholar] [CrossRef] [PubMed] [Green Version]
  32. Gagne-Sansfacon, J.; Allaire, J.M.; Jones, C.; Boudreau, F.; Perreault, N. Loss of Sonic hedgehog leads to alterations in intestinal secretory cell maturation and autophagy. PLoS ONE 2014, 9, e98751. [Google Scholar] [CrossRef] [PubMed] [Green Version]
  33. Maloum, F.; Allaire, J.M.; Gagne-Sansfacon, J.; Roy, E.; Belleville, K.; Sarret, P.; Morisset, J.; Carrier, J.C.; Mishina, Y.; Kaestner, K.H.; et al. Epithelial BMP signaling is required for proper specification of epithelial cell lineages and gastric endocrine cells. Am. J. Physiol. Gastrointest. Liver Physiol. 2011, 300, G1065–G1079. [Google Scholar] [CrossRef] [PubMed] [Green Version]
  34. Lattouf, R.; Younes, R.; Lutomski, D.; Naaman, N.; Godeau, G.; Senni, K.; Changotade, S. Picrosirius red staining: A useful tool to appraise collagen networks in normal and pathological tissues. J. Histochem. Cytochem. 2014, 62, 751–758. [Google Scholar] [CrossRef] [PubMed] [Green Version]
  35. Perreault, N.; Beaulieu, J.F. Primary cultures of fully differentiated and pure human intestinal epithelial cells. Exp. Cell Res. 1998, 245, 34–42. [Google Scholar] [CrossRef]
  36. Naba, A.; Pearce, O.M.T.; Del Rosario, A.; Ma, D.; Ding, H.; Rajeeve, V.; Cutillas, P.R.; Balkwill, F.R.; Hynes, R.O. Characterization of the Extracellular Matrix of Normal and Diseased Tissues Using Proteomics. J. Proteome Res. 2017, 16, 3083–3091. [Google Scholar] [CrossRef] [PubMed]
  37. Hynes, R.O. Stretching the boundaries of extracellular matrix research. Nat. Rev. Mol. Cell Biol. 2014, 15, 761–763. [Google Scholar] [CrossRef]
  38. Gjorevski, N.; Sachs, N.; Manfrin, A.; Giger, S.; Bragina, M.E.; Ordonez-Moran, P.; Clevers, H.; Lutolf, M.P. Designer matrices for intestinal stem cell and organoid culture. Nature 2016, 539, 560–564. [Google Scholar] [CrossRef]
  39. Lu, P.; Weaver, V.M.; Werb, Z. The extracellular matrix: A dynamic niche in cancer progression. J. Cell Biol. 2012, 196, 395–406. [Google Scholar] [CrossRef]
  40. Grevers, L.C.; de Vries, T.J.; Vogl, T.; Abdollahi-Roodsaz, S.; Sloetjes, A.W.; Leenen, P.J.; Roth, J.; Everts, V.; van den Berg, W.B.; van Lent, P.L. S100A8 enhances osteoclastic bone resorption in vitro through activation of Toll-like receptor 4: Implications for bone destruction in murine antigen-induced arthritis. Arthritis Rheum. 2011, 63, 1365–1375. [Google Scholar] [CrossRef]
  41. Ehrchen, J.M.; Sunderkotter, C.; Foell, D.; Vogl, T.; Roth, J. The endogenous Toll-like receptor 4 agonist S100A8/S100A9 (calprotectin) as innate amplifier of infection, autoimmunity, and cancer. J. Leukoc. Biol. 2009, 86, 557–566. [Google Scholar] [CrossRef] [PubMed]
  42. Foell, D.; Wittkowski, H.; Roth, J. Mechanisms of disease: A ‘DAMP’ view of inflammatory arthritis. Nat. Clin. Pr. Rheumatol. 2007, 3, 382–390. [Google Scholar] [CrossRef] [PubMed]
  43. Zhou, Z.H.; Ji, C.D.; Xiao, H.L.; Zhao, H.B.; Cui, Y.H.; Bian, X.W. Reorganized Collagen in the Tumor Microenvironment of Gastric Cancer and Its Association with Prognosis. J. Cancer 2017, 8, 1466–1476. [Google Scholar] [CrossRef] [PubMed] [Green Version]
  44. Kim, S.; Min, S.; Choi, Y.S.; Jo, S.H.; Jung, J.H.; Han, K.; Kim, J.; An, S.; Ji, Y.W.; Kim, Y.G.; et al. Tissue extracellular matrix hydrogels as alternatives to Matrigel for culturing gastrointestinal organoids. Nat. Commun. 2022, 13, 1692. [Google Scholar] [CrossRef] [PubMed]
  45. Abbaszadegan, M.R.; Mojarrad, M.; Moghbeli, M. Role of extra cellular proteins in gastric cancer progression and metastasis: An update. Genes Environ. 2020, 42, 18. [Google Scholar] [CrossRef] [PubMed]
  46. Li, L.; Zhu, Z.; Zhao, Y.; Zhang, Q.; Wu, X.; Miao, B.; Cao, J.; Fei, S. FN1, SPARC, and SERPINE1 are highly expressed and significantly related to a poor prognosis of gastric adenocarcinoma revealed by microarray and bioinformatics. Sci. Rep. 2019, 9, 7827. [Google Scholar] [CrossRef] [PubMed] [Green Version]
  47. Sung, J.Y.; Cheong, J.H. The Matrisome Is Associated with Metabolic Reprograming in Stem-like Phenotypes of Gastric Cancer. Cancers 2022, 14, 1438. [Google Scholar] [CrossRef]
  48. Naba, A.; Clauser, K.R.; Hynes, R.O. Enrichment of Extracellular Matrix Proteins from Tissues and Digestion into Peptides for Mass Spectrometry Analysis. J. Vis. Exp. 2015, e53057. [Google Scholar] [CrossRef] [Green Version]
  49. Socovich, A.M.; Naba, A. The cancer matrisome: From comprehensive characterization to biomarker discovery. Semin. Cell Dev. Biol. 2019, 89, 157–166. [Google Scholar] [CrossRef]
  50. Taha, I.N.; Naba, A. Exploring the extracellular matrix in health and disease using proteomics. Essays Biochem. 2019, 63, 417–432. [Google Scholar] [CrossRef]
  51. Shao, X.; Taha, I.N.; Clauser, K.R.; Gao, Y.T.; Naba, A. MatrisomeDB: The ECM-protein knowledge database. Nucleic Acids Res. 2020, 48, D1136–D1144. [Google Scholar] [CrossRef] [PubMed]
  52. Hanahan, D.; Weinberg, R.A. Hallmarks of cancer: The next generation. Cell 2011, 144, 646–674. [Google Scholar] [CrossRef] [PubMed] [Green Version]
  53. Correa, P. A human model of gastric carcinogenesis. Cancer Res. 1988, 48, 3554–3560. [Google Scholar] [PubMed]
  54. Piazuelo, M.B.; Correa, P. Gastric cancer: Overview. Colomb. Med. 2013, 44, 192–201. [Google Scholar]
  55. De Re, V. Molecular Features Distinguish Gastric Cancer Subtypes. Int. J. Mol. Sci. 2018, 19, 3121. [Google Scholar] [CrossRef] [PubMed] [Green Version]
  56. Hiratsuka, S.; Watanabe, A.; Aburatani, H.; Maru, Y. Tumour-mediated upregulation of chemoattractants and recruitment of myeloid cells predetermines lung metastasis. Nat. Cell Biol. 2006, 8, 1369–1375. [Google Scholar] [CrossRef]
  57. Salama, I.; Malone, P.S.; Mihaimeed, F.; Jones, J.L. A review of the S100 proteins in cancer. Eur. J. Surg. Oncol. 2008, 34, 357–364. [Google Scholar] [CrossRef]
  58. Foell, D.; Wittkowski, H.; Vogl, T.; Roth, J. S100 proteins expressed in phagocytes: A novel group of damage-associated molecular pattern molecules. J. Leukoc. Biol. 2007, 81, 28–37. [Google Scholar] [CrossRef] [Green Version]
  59. Emberley, E.D.; Murphy, L.C.; Watson, P.H. S100 proteins and their influence on pro-survival pathways in cancer. Biochem. Cell Biol. 2004, 82, 508–515. [Google Scholar] [CrossRef]
  60. Gebhardt, C.; Nemeth, J.; Angel, P.; Hess, J. S100A8 and S100A9 in inflammation and cancer. Biochem. Pharmacol. 2006, 72, 1622–1631. [Google Scholar] [CrossRef]
  61. Hermani, A.; De Servi, B.; Medunjanin, S.; Tessier, P.A.; Mayer, D. S100A8 and S100A9 activate MAP kinase and NF-kappaB signaling pathways and trigger translocation of RAGE in human prostate cancer cells. Exp. Cell Res. 2006, 312, 184–197. [Google Scholar] [CrossRef] [PubMed]
  62. Ott, H.W.; Lindner, H.; Sarg, B.; Mueller-Holzner, E.; Abendstein, B.; Bergant, A.; Fessler, S.; Schwaerzler, P.; Zeimet, A.; Marth, C.; et al. Calgranulins in cystic fluid and serum from patients with ovarian carcinomas. Cancer Res. 2003, 63, 7507–7514. [Google Scholar] [PubMed]
  63. Bresnick, A.R.; Weber, D.J.; Zimmer, D.B. S100 proteins in cancer. Nat. Rev. Cancer 2015, 15, 96–109. [Google Scholar] [CrossRef] [PubMed] [Green Version]
  64. Efthymiou, G.; Saint, A.; Ruff, M.; Rekad, Z.; Ciais, D.; Van Obberghen-Schilling, E. Shaping Up the Tumor Microenvironment With Cellular Fibronectin. Front. Oncol. 2020, 10, 641. [Google Scholar] [CrossRef]
  65. Liu, A.Y.; Zheng, H.; Ouyang, G. Periostin, a multifunctional matricellular protein in inflammatory and tumor microenvironments. Matrix Biol. 2014, 37, 150–156. [Google Scholar] [CrossRef]
  66. Sirica, A.E. Matricellular proteins in intrahepatic cholangiocarcinoma. Adv. Cancer Res. 2022, 156, 249–281. [Google Scholar] [CrossRef]
  67. Shen, C.; Wang, C.; Yin, Y.; Chen, H.; Yin, X.; Cai, Z.; Chen, Z.; Zhang, B.; Zhou, Z. Tenascin-C expression is significantly associated with the progression and prognosis in gastric GISTs. Medicine 2019, 98, e14045. [Google Scholar] [CrossRef]
  68. Sun, Y.; Zhao, C.; Ye, Y.; Wang, Z.; He, Y.; Li, Y.; Mao, H. High expression of fibronectin 1 indicates poor prognosis in gastric cancer. Oncol. Lett. 2020, 19, 93–102. [Google Scholar] [CrossRef] [Green Version]
  69. Wang, J.; Deng, L.; Huang, J.; Cai, R.; Zhu, X.; Liu, F.; Wang, Q.; Zhang, J.; Zheng, Y. High expression of Fibronectin 1 suppresses apoptosis through the NF-kappaB pathway and is associated with migration in nasopharyngeal carcinoma. Am. J. Transl. Res. 2017, 9, 4502–4511. [Google Scholar]
  70. Jakharia, A.; Borkakoty, B.; Singh, S. Expression of SPARC like protein 1 (SPARCL1), extracellular matrix-associated protein is down regulated in gastric adenocarcinoma. J. Gastrointest. Oncol. 2016, 7, 278–283. [Google Scholar] [CrossRef]
  71. Pankov, R.; Yamada, K.M. Fibronectin at a glance. J. Cell Sci. 2002, 115, 3861–3863. [Google Scholar] [CrossRef] [PubMed] [Green Version]
  72. Wang, J.; Zhou, Y.; Fei, X.; Chen, X.; Yan, J.; Liu, B.; Zhu, Z. ADAM9 functions as a promoter of gastric cancer growth which is negatively and post-transcriptionally regulated by miR-126. Oncol. Rep. 2017, 37, 2033–2040. [Google Scholar] [CrossRef] [PubMed]
  73. Wang, H.; Zhang, J.; Li, H.; Yu, H.; Chen, S.; Liu, S.; Zhang, C.; He, Y. FN1 is a prognostic biomarker and correlated with immune infiltrates in gastric cancers. Front. Oncol. 2022, 12, 918719. [Google Scholar] [CrossRef] [PubMed]
  74. Midwood, K.S.; Orend, G. The role of tenascin-C in tissue injury and tumorigenesis. J. Cell Commun. Signal. 2009, 3, 287–310. [Google Scholar] [CrossRef] [PubMed] [Green Version]
  75. Bella, J.; Hulmes, D.J. Fibrillar Collagens. Subcell. Biochem. 2017, 82, 457–490. [Google Scholar] [CrossRef]
  76. Ricard-Blum, S. The collagen family. Cold Spring Harb. Perspect. Biol. 2011, 3, a004978. [Google Scholar] [CrossRef] [Green Version]
  77. Fang, M.; Yuan, J.; Peng, C.; Li, Y. Collagen as a double-edged sword in tumor progression. Tumor Biol. 2014, 35, 2871–2882. [Google Scholar] [CrossRef] [Green Version]
  78. Taufalele, P.V.; VanderBurgh, J.A.; Munoz, A.; Zanotelli, M.R.; Reinhart-King, C.A. Fiber alignment drives changes in architectural and mechanical features in collagen matrices. PLoS ONE 2019, 14, e0216537. [Google Scholar] [CrossRef] [Green Version]
  79. Kirkness, M.W.; Lehmann, K.; Forde, N.R. Mechanics and structural stability of the collagen triple helix. Curr. Opin. Chem. Biol. 2019, 53, 98–105. [Google Scholar] [CrossRef] [Green Version]
  80. Krasny, L.; Paul, A.; Wai, P.; Howard, B.A.; Natrajan, R.C.; Huang, P.H. Comparative proteomic assessment of matrisome enrichment methodologies. Biochem. J. 2016, 473, 3979–3995. [Google Scholar] [CrossRef] [Green Version]
  81. McCabe, M.C.; Schmitt, L.R.; Hill, R.C.; Dzieciatkowska, M.; Maslanka, M.; Daamen, W.F.; van Kuppevelt, T.H.; Hof, D.J.; Hansen, K.C. Evaluation and Refinement of Sample Preparation Methods for Extracellular Matrix Proteome Coverage. Mol. Cell. Proteom. 2021, 20, 100079. [Google Scholar] [CrossRef] [PubMed]
Figure 1. Methods for tissue preparation of stomach antrum for proteomic analysis. (A) Schematic representation of the experimental pipeline to assess the gastric matrisome profile in the BmpR1a△FoxL1+ mouse model. Created with BioRender.com. (BF) Histological assessment of the deconstructed antrum tissue. Total antrum tissue (B) was deconstructed in a stepwise manner, where the muscle layers (E) were first dissociated from the other two compartments (C). Epithelial/mesenchymal tissue (C) was further dissociated, yielding the mesenchyme compartment (D) and the epithelium (F). Scale bar = 100 μm.
Biomedicines 11 00019 g001
Figure 2. Total antrum matrisome in mice upon deletion of telocyte BMP-associated signaling. (A) Proteomic data from total antrum tissue isolated from control and BmpR1a△FoxL1+ mice (n = 4) were analyzed using ProStar to determine which proteins were significantly modulated. The volcano plot shows all differentially regulated proteins identified following mass spectrometry, highlighting significant matrisome proteins with at least a 1.5-fold change (plotted as log2FC) and a p-value lower than 0.05. Blue dots represent downregulated matrisome proteins; red dots represent upregulated matrisome proteins. The horizontal line represents the threshold p-value of 0.05. Vertical lines represent the 1.5-fold change threshold (in log2). Volcano plot was generated using GraphPad Prism version 9.4.1. (B). Pie chart indicates the number of matrisome proteins identified in total antrum tissue according to categories (core matrisome proteins in green and matrisome-associated proteins in black).
Biomedicines 11 00019 g002
Figure 3. Enriched mesenchyme antrum matrisome in mice upon deletion of telocyte BMP-associated signaling. (A) Proteomic data from mesenchyme-enriched antrum tissue isolated from control and BmpR1a△FoxL1+ mice (n = 6) were analyzed using ProStar to determine which proteins were significantly modulated. The volcano plot shows all differentially regulated proteins identified following mass spectrometry, highlighting significant matrisome proteins with at least a 1.5-fold change (plotted as log2FC) and a p-value lower than 0.05. Blue dots represent downregulated matrisome proteins; Red dots represent upregulated matrisome proteins. The horizontal line represents the threshold p-value of 0.05. Vertical lines represent the 1.5-fold change threshold (in log2FC). Volcano plot was generated using GraphPad Prism version 9.4.1. (B) Pie chart indicates the number of matrisome proteins identified in mesenchyme-enriched antrum tissue according to categories (core matrisome proteins in green and matrisome-associated proteins in black).
Biomedicines 11 00019 g003
Figure 4. Mesenchymal enrichment of the antrum does not lead to notable ECM protein loss. Venn diagrams illustrating the overall BmpR1a△FoxL1+ mouse gastric matrisome proteins identified using the two methods combined, indicating a wide overlap between the two approaches. Core matrisome proteins are presented in green and matrisome-associated proteins are shown in black. TA, total antrum; EM, enriched mesenchyme; CM, core matrisome; MA, matrisome-associated.
Biomedicines 11 00019 g004
Figure 5. S100A8 and A9 proteins are upregulated secreted factors in BmpR1a△FoxL1+ mice, indicating an inflammatory response. (A) Immunostaining against S100A9 (shown in green) revealed an increase in its expression in the mesenchyme-enriched area of the antrum tissue of BmpR1a△FoxL1+ mice compared to that in controls. (B) Immunoblot analysis of the total antrum tissue indicates strong expression of both S100A8 and S100A9 proteins in BmpR1a△FoxL1+ mice compared to that in controls. (C) Quantification of immunoblots confirmed a significant increase in both S100A8 and S100A9 in the mutant animals (FC = 20.34 and 20.48, respectively) compared to that in controls. Statistical analysis was assessed using the Mann–Whitney test with * p < 0.05. Evans blue was used as a counterstain (red signal in (A)). Scale bar = 100 μm.
Biomedicines 11 00019 g005
Figure 6. Loss of BMP signaling in gastric TCFoxL1+ disrupts the collagen network. (A) Picrosirius red staining was performed on stomach sections from both control and BmpR1a△FoxL1+ mice. Collagen fiber organization and alignment was evaluated under bright field (left panels) and polarizing light (middle panels). Imaging was performed using a Zeiss Axioscope 5 equipped with an analyzer and a linear polarizer. ROI (dotted squares) were converted to grayscale 16-bit images and color-coded where pixel hue corresponds to the angle of local fiber orientation, which ranges from −90° to +90°. Representative ROI are shown with their color-coded fiber orientation (right panels) and color-coded orientation legend is shown. (B) Distribution of fiber orientations was compiled for each ROI in all analyzed images, to compare control tissue with middle of the gland in BmpR1a△FoxL1+ mice antrum. Data are shown as means of distribution ± SD, for four individual mice in each group. (C) Distribution of fiber orientations was compiled for each ROI in all analyzed images, to compare control tissue with top of the gland in BmpR1a△FoxL1+ mice antrum. Data are shown as means of distribution ± SD, for four individual mice in each group. (D) Coherency factor was computed for all ROI and data were plotted showing a significant increase of fiber alignment in the top part of antrum gland in BmpR1a△FoxL1+ mice, with a mean coherency factor of 0.338 compared to 0.245 observed in control mice. No significant difference was observed between the middle part of antrum gland in control and that in BmpR1a△FoxL1+ mice. Statistical analyses were performed using Prism, with a table and group nested ANOVA. Scale bar = 50 μm. ** p < 0.01. ROI: representative region of interests.
Biomedicines 11 00019 g006
Figure 7. Modulations in ECM glycoproteins and ECM regulator correlate with a neoplasia phenotype in stomach of BmpR1a△FoxL1+ mice. (A). Immunostaining against ECM glycoprotein fibronectin (shown in green) revealed an increased expression in the enlarged mesenchymal area of the antrum tissue in BmpR1a△FoxL1+ mice compared to that in controls. (B) Immunostaining against ECM glycoprotein Tenascin C (shown in green) revealed an increased expression in the antrum mesenchyme of BmpR1a△FoxL1+ mice compared to that in controls. (C). Immunoblot analysis showed a decrease of the ECM glycoprotein SPARCL-1 expression and an increase of the ECM regulator ADAM9 in total antrum samples of BmpR1a△FoxL1+ mice compared to that in controls. GAPDH was used as a loading control. (D) Quantification of immunoblots revealed a significant modulation of SPARCL-1 and ADAM9 between both group (FC = 0.48 and 1.98, respectively). All quantifications were performed using ImageJ and statistical analyses were performed using Prism. All immunoblot quantification data are presented as the mean ± SD (n = 4). Statistical analysis was assessed using the Mann–Whitney test with * p < 0.05. Evans blue was used as a counterstain (red signal in A and B). Scale bar = 100 μm.
Biomedicines 11 00019 g007
Table 1. Total antrum tissue.
Core Matrisome Matrisome-Associated
ECM-GlycoproteinsCollagen ChainsECM-RegulatorsECM-Affiliated Proteins
NameFC p-ValueNameFC p-ValueNameFC p-Value NameFC p-Value
Agrn23720.0076Col18a11.940.0099Adam95100.0063 Muc415940.0084
Dmbt13.600.0188Col15a11.19NC/0.1689Prss32.51NC/0.0528Mbl213820.0066
Fgb2.960.0200Col6a5−1.150.4277Leprel12.38NC/0.0002Lgals74.40NC/0.0210
Fgg2.670.0206Col4a1−1.360.1037Serpinb1a2.290.0044Lgals42.090.0276
Fga2.540.0175Col12a1−1.730.0030Serpinb52.070.0183Lgals91.630.0293
Vtn2.490.0191Col14a1−2.080.0558Ctss2.050.0043Anxa31.540.0224
Thbs12.100.0049Col6a1−3.100.0178Ctsc1.850.0134Anxa101.510.0454
Mfge81.510.071Col6a2−4.520.0124Serpinb121.84NC/0.0554Anxa11.480.0121
Tnc1.400.0253Col4a2−5530.0071Ctsh1.730.0113Lgalsl1.430.0206
Igfbp71.390.1144Col1a2−14960.0049F21.560.0280Reg11.350.6373
Creld21.350.1078 Try101.53NC/0.0394Hpx1.310.0656
Fn11.330.0094ProteoglycansHrg1.510.0357Reg21.29NC/0.1715
Vwa11.28NC/0.0437NameFCp-ValuePlg1.390.0466Anxa21.260.0574
Fbln21.240.174Bgn1.310.0160Ctse1.380.0548Anxa71.250.0696
Sparc1.230.1481Prg21.090.7556Serpinf21.370.0572Lman11.120.4453
Postn1.220.0344Vcan−1.270.0841Itih31.360.0472Anxa51.100.1127
Lrg11.140.2343Hspg2−1.390.0302Ctsa1.350.0365Anxa41.080.2235
Vwa5a1.130.1869Prelp−1.410.0513Serpini21.34NC/0.3921Muc61.050.7641
Tgfbi1.120.1154Lum−1.470.0188Serping11.330.0997Sema4b1.010.9016
Aebp11.030.8022Aspn−1.560.0104Serpinc11.300.1275Lgals3−1.030.7888
Efemp11.020.7931Ogn−1.850.0065Itih21.260.1419Anxa11−1.050.3729
Ltbp41.010.906Dcn−2.050.0094Kng11.240.0814Plxnb2−1.060.3421
Fbln1−1.010.8928Podn−28353 × 10−5F13a11.230.0278Lgals1−1.100.2588
Thbs4−1.12NC/0.5325Fmod−12,9337 × 10−15Cst31.230.0257Anxa6−1.470.0357
Nid2−1.200.1529 Adam101.210.1819Muc5ac−1.500.0477
Fbln5−1.230.1405 Ctsb1.170.1297Sdc1−1.55NC/0.0175
Lamb1−1.270.0300 Ctsl1.150.1851Lgals2−2.760.0067
Pcolce−1.31NC/0.0097 Ctsz1.140.1260Cspg4−99771 × 10−14
Lamb3−1.32NC/0.0020 A2m1.130.3687
Sbspon−1.34NC/0.0423 Itih11.130.2482Secreted factors
Tsku−1.44NC/0.0188 Serpinb91.100.4599NameFCp-Value
Dpt−1.580.0069 Serpina1e1.080.8936S100a9130580.0059
Mfap4−1.600.0210 Serpinh11.060.5231S100a8114120.0043
Adipoq−1.610.0623 Ctsd1.050.4297Sfrp13720NC/1 × 10−13
Lama4−1.670.0145 Cstb1.040.5912Il1rn9480.0100
Lamc1−1.690.0269 Ngly11.030.8976S100a61.990.0389
Mfap5−1.690.0429 Serpinf1−1.000.9864Rptn1.86NC/1 × 10−13
Nid1−1.700.0116 Serpind1−1.020.8891S100g1.580.0410
Lama2−1.700.0377 Cela2a−1.050.9419S100a41.520.0059
Tinagl1−1.740.0283 Fam20b−1.060.5655S100a11.460.0119
Lama5−1.770.0121 St14−1.090.4949S100a131.380.0825
Emilin1−1.79NC/4 × 10−6 Cela3b−1.110.8716S100a111.360.0774
Lamb2−2.330.0140 Serpina3k−1.180.5193S100a141.320.0266
Tnxb−2.380.0193 Prss2−1.200.7794Il181.200.2779
Fbn1−2431 × 10−5 Serpina1d−1.250.1443S100a161.180.1155
Abi3bp−11170.0038 Tgm2−1.290.0344Hcfc1−1.120.0848
Mfap2−2262NC/1 × 10−12 Serpina1c−1.300.3113S100a10−1.230.0344
Sparcl1−15,3771 × 10⁻¹³ Cela1−1.300.6149S100b−2.201 × 10⁻⁵
Spp1−24,277NC/1 × 10−12 F12−1.380.0016
P4ha1−1.41NC/0.0071
Serpina1b−1.470.1053
P4ha2−1.63NC/0.0159
Serpina6−1.760.1680
Ambp−6710.0064
Table 2. Total Enriched mesenchyme from antrum tissue.
Core MatrisomeMatrisome-Associated
ECM-GlyucoproteinsCollagen ChainsECM-Regulators ECM-Affiliated Proteins
NameFC p-ValueNameFC p-ValueNameFC p-ValueNameFC p-Value
Fbln155353 × 10−18Col18a12.282 × 10−5Serpinb515,9667 × 10−21Muc473574 × 10−21
Dmbt174,25 × 10−12Col4a1−1.170.4016Plg83044 × 10−20Muc5ac409NC/3 × 10−16
Fgb18,42 × 10−6Col6a4−1.490.0575Mmp982012 × 10−19Anxa1090.478 × 10−9
Fgg10,46 × 10−6Col4a2−1.720.0288Loxl27570NC/6 × 10−17Lgals425.551 × 10−10
Fga8.913 × 10−5Col15a1−2.722 × 10⁻⁵Fam20b52655 × 10−19Lgals94.899 × 10−8
Tnc1.969 × 10−5Col6a2−2.846 × 10⁻⁷Adam1045862 × 10−5Lgals23.872 × 10−5
Vtn1.93NC/4 × 10−5Col6a1−2.963 × 10⁻⁷P4ha24433NC/2 × 10−17Anxa31.740.0003
Mfge81.780.0003Col6a3−3.081 × 10⁻⁷Ctse3.813 × 10−7Anxa111.350.0461
Fn11.460.0760Col1a2−6.447 × 10⁻⁵Cst32.08NC/0.0088Anxa71.160.1634
Fbln51.41NC/0.0454Col1a1−9.154 × 10−5Serpinc11.880.1149Lman11.150.2975
Igfbp71.300.1291Col6a5−10.973 × 10⁻⁷F13a11.660.1621Plxnb21.120.4665
Ecm11.10NC/0.3423Col4a6−12,771NC/2 × 10−21Serpinb91.64NC/0.0025Anxa4−1.070.4975
Creld21.090.6556 Serpinb1a1.270.0296Anxa1−1.170.2537
Ltbp4−1.040.8548ProteoglycansA2m1.200.1905Muc6−1.220.2380
Tgfbi−1.060.5927NameFCp-ValueCtsc−1.050.6744Cspg4−1.25NC/0.0437
Agrn−1.080.4679Prg22.270.0003Itih1−1.080.7179Lgals3−1.280.0832
Vwf−1.320.0853Hspg2−1.40.0134Ctsh−1.120.2113Anxa2−1.310.0187
Vwa1−1.32NC/0.0617Bgn−1.500.1212Ctsb−1.130.2275Sema3d−1.44NC/0.0015
Postn−1.580.0054Podn−2.230.0010Ctsa−1.200.1233Anxa5−2.055 × 10⁻⁵
Vwa5a−1.610.0076Prelp−3.015 × 10⁻⁷Serpina1c−1.220.1968Lgals1−2.788 × 10⁻⁵
Mfap4−1.610.0311Aspn−3.421 × 10⁻⁷Ctsz−1.260.0404Anxa6−3.532 × 10⁻⁶
Lamb1−1.730.0002Dcn−3.623 × 10⁻⁹Itih3−1.300.2241
Emilin1−1.790.0432Lum−3.789 × 10⁻¹⁰Ctsd−1.400.0005Secreted factors
Adipoq−1.95NC/0.0357Ogn−4.297 × 10−10Itih2−1.490.2789NameFCp-Value
Papln−1.96NC/9 × 10−7Vcan−12.302 × 10⁻¹²Cstb−1.520.0248S100a1616,1771 × 10−20
Aebp1−2.000.0004 Serpinh1−1.660.0003S100a1412,5452 × 10−20
Nid2−2.099 × 10⁻⁷ Serpina3k−1.68NC/7 × 10−5S100a985.2NC/3 × 10−12
Lamc1−2.339 × 10⁻⁶ Serping1−1.93NC/3 × 10−5S100a837.96 × 10−7
Lama4−2.341 × 10⁻⁷ P4ha1−2.018 × 10⁻⁵S100a13.1NC/0.0003
Nid1−2.505 × 10⁻⁷ Ctss−2.135 × 10⁻⁵S100a41.30.2283
Sbspon−2.54NC/3 × 10−5 Tgm2−2.886 × 10⁻⁸Angptl21.22NC/0.0289
Lama5−2.572 × 10⁻⁵ Cela1−3.384 × 10⁻⁶Hcfc11.200.2782
Tinagl1−3.451 × 10⁻⁶ Ambp−13,2213 × 10⁻¹⁶S100a61.200.1979
Lamb2−3.981 × 10⁻⁶ Adamts20−68,487NC/6 × 10−22S100a111.120.3482
Mfap5−4.093 × 10⁻⁶ S100a13−1.120.4822
Tnxb−4.371 × 10⁻⁵ S100a10−2.160.0004
Lama2−4.666 × 10⁻⁷
Dpt−5.493 × 10⁻¹¹
Fbn1−5.992 × 10⁻⁵
Sparc−36200.0001
Spp1−4710NC/8 × 10−19
Mmrn2−74503 × 10−18
Mfap2−75883 × 10−13
Abi3bp−11,2001 × 10⁻²²
Fbn2−46,2871 × 10⁻²⁰
Spon1−51,711NC/9 × 10−23
Disclaimer/Publisher’s Note: The statements, opinions and data contained in all publications are solely those of the individual author(s) and contributor(s) and not of MDPI and/or the editor(s). MDPI and/or the editor(s) disclaim responsibility for any injury to people or property resulting from any ideas, methods, instructions or products referred to in the content.

