
Evaluation of Morphological Changes in Retinal Vessels in Type 1 Diabetes Mellitus Patients with the Use of Adaptive Optics

 , , and
Abstract
1. Introduction
2. Materials and Methods
2.1. The Analysed Population
2.2. Metabolic Control Assessment Methods
2.3. Assessment Methods of the Eye
2.4. Statistical Analysis
3. Results
4. Discussion
5. Conclusions
Author Contributions
Funding
Institutional Review Board Statement
Informed Consent Statement
Data Availability Statement
Conflicts of Interest
References
- Henschen, F. On the term diabetes in the works of Aretaeus and Galen. Med. Hist. 1969, 13, 190–192. [Google Scholar] [CrossRef] [PubMed]
- Matuszewski, W.; Bandurska-Stankiewicz, E.; Modzelewski, R.; Kamińska, U.; Stefanowicz-Rutkowska, M.M. Diagnosis and treatment of diabetic retinopathy—Historical overview. Clin. Diabetol. 2017, 6, 182–188. [Google Scholar] [CrossRef]
- WHO. Definition, Diagnosis and Classification of Diabetes Mellitus and Its Complications. Report of a WHO Consultation—Part 1: Diagnosis and Classification of Diabetes Mellitus; WHO: Geneva, Switzerland, 1999. [Google Scholar]
- Solis-Herrera, C.; Triplitt, C.; Reasner, C.; DeFronzo, R.A.; Cersosimo, E. Classification of Diabetes Mellitus. In Endotext; Feingold, K.R., Anawalt, B., Boyce, A., Chrousos, G., De Herder, W.W., Dhatariya, K., Dungan, K., Hershman, J.M., Hofland, J., Kalra, S., Eds.; MDText.com, Inc.: South Dartmouth, MA, USA, 2000. Available online: https://www.ncbi.nlm.nih.gov/books/NBK279119/ (accessed on 1 April 2022).
- American Diabetes Association. Classification and Diagnosis of Diabetes: Standards of Medical Care in Diabetes. Diabetes Care 2021, 44, S15–S33. [Google Scholar] [CrossRef] [PubMed]
- Khan, M.A.B.; Hashim, M.J.; King, J.K.; Govender, R.D.; Mustafa, H.; Al Kaabi, J. Epidemiology of Type 2 Diabetes–Global Burden of Disease and Forecasted Trends. J. Epidemiol. Glob. Health 2020, 10, 107–111. [Google Scholar] [CrossRef]
- Mobasseri, M.; Shirmohammadi, M.; Amiri, T.; Vahed, N.; Fard, H.H.; Ghojazadeh, M. Prevalence and incidence of type 1 diabetes in the world: A systematic review and meta-analysis. Health Promot. Perspect. 2020, 10, 98–115. [Google Scholar] [CrossRef]
- Kempen, J.H.; O’Colmain, B.J.; Leske, M.C.; Haffner, S.M.; Klein, R.; Moss, S.E.; Taylor, H.R.; Hamman, R.F.; West, S.K.; Wang, J.J.; et al. The prevalence of diabetic retinopathy among adults in the United States. Arch. Ophthalmol. 2004, 122, 552–563. [Google Scholar]
- Aiello, L.P.; Gardner, T.W.; King, G.L. Diabetic retinopathy. Diabetes Care 1998, 21, 143–156. [Google Scholar] [CrossRef]
- Burrows, N.R.; Hora, I.A.; Li, Y.F.; Saaddine, J.B. Self-Reported Visual Impairment Among Persons with Diagnosed Diabetes-United States, 1997–2010. MMWR 2011, 60, 1549–1553, reprinted in JAMA 2012, 307, 25–27. [Google Scholar]
- Von Jaeger, E. Retinitis diabetica. Beiträge zur Pathologie des Auges; Hof-und Staatsdruckerei: Vienna, Austria, 1855; Volume 2. [Google Scholar]
- Ivanišević, M. First look into the eye. Eur. J. Ophthalmol. 2019, 29, 685–688. [Google Scholar] [CrossRef]
- Li, Y.; Xia, X.; Paulus, Y.M. Advances in Retinal Optical Imaging. Photonics 2018, 5, 9. [Google Scholar] [CrossRef]
- Amin, J.; Sharif, M.; Yasmin, M. A Review on Recent Developments for Detection of Diabetic Retinopathy. Scientifica 2016, 2016, 6838976. [Google Scholar] [CrossRef]
- Babcock, H.W. Adaptive Optics Revisited. Science 1990, 249, 253–257. [Google Scholar] [CrossRef]
- Akyol, E.; Hagag, A.M.; Sivaprasad, S.; Lotery, A.J. Adaptive optics: Principles and applications in ophthalmology. Eye 2021, 35, 244–264. [Google Scholar] [CrossRef]
- Katz, M.S.J.; Jonna, G. Adaptive Optics: Astronomy, Military Might, and Retinal Imaging. J. Pediatr. Ophthalmol. Strabismus 2015, 52, 11. [Google Scholar] [CrossRef]
- Williams, D.R. Imaging single cells in the living retina. Vis. Res. 2011, 51, 1379–1396. [Google Scholar] [CrossRef]
- Chui, T.Y.P.; Gast, T.J.; Burns, S.A. Imaging of vascular wall fine structure in the human retina using adaptive optics scanning laser ophthalmoscopy. Investig. Ophthalmol. Vis. Sci. 2013, 54, 7115–7124. [Google Scholar] [CrossRef]
- Hillard, J.G.; Gast, T.J.; Chui, T.Y.; Sapir, D.; Burns, S.A. Retinal Arterioles in Hypo-, Normo-, and Hypertensive Subjects Measured Using Adaptive Optics. Transl. Vis. Sci. Technol. 2016, 5, 16. [Google Scholar] [CrossRef]
- Doble, N.; Choi, S.S.; Codona, J.L.; Christou, J.; Enoch, J.M.; Williams, D.R. In vivo imaging of the human rod photoreceptor mosaic. Opt. Lett. 2011, 36, 31–33. [Google Scholar] [CrossRef]
- Takayama, K.; Ooto, S.; Hangai, M.; Ueda-Arakawa, N.; Yoshida, S.; Akagi, T.; Ikeda, H.; Nonaka, A.; Hanebuchi, M.; Inoue, T.; et al. High-Resolution Imaging of Retinal Nerve Fiber Bundles in Glaucoma Using Adaptive Optics Scanning Laser Ophthalmoscopy. Am. J. Ophthalmol. 2013, 155, 870–881.e3. [Google Scholar] [CrossRef]
- Scoles, D.; Sulai, Y.N.; Dubra, A. In vivo dark-field imaging of the retinal pigment epithelium cell mosaic. Biomed. Opt. Express 2013, 4, 1710–1723. [Google Scholar] [CrossRef]
- Georgiou, M.; Kalitzeos, A.; Patterson, E.J.; Dubra, A.; Carroll, J.; Michaelides, M. Adaptive optics imaging of inherited retinal diseases. Br. J. Ophthalmol. 2018, 102, 1028–1035. [Google Scholar] [CrossRef] [PubMed]
- Takagi, S.; Mandai, M.; Gocho, K.; Hirami, Y.; Yamamoto, M.; Fujihara, M.; Sugita, S.; Kurimoto, Y.; Takahashi, M. Evaluation of Transplanted Autologous Induced Pluripotent Stem Cell-Derived Retinal Pigment Epithelium in Exudative Age-Related Macular Degeneration. Ophthalmol. Retin. 2019, 3, 850–859. [Google Scholar] [CrossRef] [PubMed]
- Zwillinger, S.; Paques, M.; Safran, B.; Baudouin, C. In vivo characterization of lamina cribrosa pore morphology in primary open-angle glaucoma. J. Français Ophtalmol. 2016, 39, 265–271. [Google Scholar] [CrossRef][Green Version]
- Hayashi, A.; Tojo, N.; Nakamura, T.; Fuchizawa, C.; Oiwake, T. Adaptive optics fundus images of cone photoreceptors in the macula of patients with retinitis pigmentosa. Clin. Ophthalmol. 2013, 7, 203–210. [Google Scholar] [CrossRef] [PubMed][Green Version]
- Seyedahmadi, B.J.; Vavvas, D. In Vivo High-Resolution Retinal Imaging Using Adaptive Optics. Semin. Ophthalmol. 2010, 25, 186–191. [Google Scholar] [CrossRef] [PubMed]
- Nguyen, C.T.O.; Acosta, M.L.; Di Angelantonio, S.; Salt, T.E. Editorial: Seeing Beyond the Eye: The Brain Connection. Front. Neurosci. 2021, 15, 719717. [Google Scholar] [CrossRef] [PubMed]
- Delles, C.; Michelson, G.; Harazny, J.; Oehmer, S.; Hilgers, K.F.; Schmieder, R.E. Impaired endothe-lial function of the retinal vasculature in hypertensive patients. Stroke 2004, 35, 1289–1293. [Google Scholar] [CrossRef] [PubMed]
- Members, T.F.; Mancia, G.; Fagard, R.; Narkiewicz, K.; Redon, J.; Zanchetti, A.; Bohm, M.; Christiaens, T.; Cifkova, R.; De Backer, G.; et al. 2013 ESH/ESC Guidelines for the management of arterial hypertension. Eur. Heart J. 2013, 34, 2159–2219. [Google Scholar] [CrossRef]
- NHLBI. Obesity Education Initiative Expert Panel on the Identification, Evaluation, and Treatment of Obesity in Adults (US). Clinical Guidelines on the Identification, Evaluation, and Treatment of Overweight and Obesity in Adults: The Evidence Report; National Heart, Lung, and Blood Institute: Bethesda, MD, USA, 1998. Available online: https://www.ncbi.nlm.nih.gov/books/NBK2003/ (accessed on 1 March 2022).
- The IDF Consensus Worldwide Definition of the Metabolic Syndrome. Available online: https://www.idf.org/e-library/consensus-statements/60-idfconsensus-worldwide-definitionof-the-metabolic-syndrome.html (accessed on 20 March 2022).
- Wilkinson, C.P.; Ferris, F.L.; Klein, R.E.; Lee, P.P.; Agardh, C.D.; Davis, M.; Dills, D.; Kampik, A.; Pararajasegaram, R.; Verdaguer, J.T. Global Diabetic Retinopathy Project Group. Proposed International clinical diabetic retinopathy and diabetic macular edema disease severity scales. Ophthalmology 2003, 110, 1677–1682. [Google Scholar] [CrossRef]
- Harazny, J.M.; Ritt, M.; Baleanu, D.; Ott, C.; Heckmann, J.; Schlaich, M.P.; Michelson, G.; Schmieder, R.E. Increased wall:lumen ratio of retinal arterioles in male patients with a history of a cerebrovascular event. Hypertension 2007, 50, 623–629. [Google Scholar] [CrossRef]
- Marco, L.; Mariacristina, P.; Serrao Sebastiano, D.P.; Mario, S.; Giuseppe, L. Analysis of Retinal Capillaries in Patients With Type 1 Diabe-Tes And Nonproliferative Diabetic Retinopathy Using Adaptive Optics Imaging. Retina 2013, 33, 1630–1639. [Google Scholar]
- Burns, S.; Elsner, A.E.; Chui, T.Y.; VanNasdale, D.A.; Clark, C.A.; Gast, T.J.; Malinovsky, V.E.; Phan, A.-D.T. In vivo adaptive optics microvascular imaging in diabetic patients without clinically severe diabetic retinopathy. Biomed. Opt. Express 2014, 5, 961–974. [Google Scholar] [CrossRef]
- Zaleska-Żmijewska, A.; Wawrzyniak, Z.M.; Dąbrowska, A.; Szaflik, J.P. Adaptive Optics (rtx1) High-Resolution Imaging of Photoreceptors and Retinal Arteries in Patients with Diabetic Retinopathy. J. Diabetes Res. 2019, 2019, 548324. [Google Scholar] [CrossRef]
- Ueno, Y.; Iwase, T.; Goto, K.; Tomita, R.; Ra, E.; Yamamoto, K.; Terasaki, H. Association of changes of retinal vessels diameter with ocular blood flow in eyes with diabetic retinopathy. Sci. Rep. 2021, 11, 4653. [Google Scholar] [CrossRef]
- Zaleska-Żmijewska, A.; Piątkiewicz, P.; Śmigielska, B.; Sokołowska-Oracz, A.; Wawrzyniak, Z.M.; Romaniuk, D.; Szaflik, J.; Szaflik, J.P. Retinal Photoreceptors and Microvascular Changes in Prediabetes Measured with Adaptive Optics (rtx1™): A Case-Control Study. J. Diabetes Res. 2017, 2017, 4174292. [Google Scholar] [CrossRef]
- Zaleska-Żmijewska, A.; Wawrzyniak, Z.; Kupis, M.; Szaflik, J.P. The Relation between Body Mass Index and Retinal Photoreceptor Morphology and Microvascular Changes Measured with Adaptive Optics (rtx1) High-Resolution Imaging. J. Ophthalmol. 2021, 2021, 6642059. [Google Scholar] [CrossRef]
- Meixner, E.; Michelson, G. Measurement of retinal wall-to-lumen ratio by adaptive optics retinal camera: A clinical research. Graefes Arch. Clin. Exp. Ophthalmol. 2015, 253, 1985–1995. [Google Scholar] [CrossRef]
- Koch, E.; Rosenbaum, D.; Brolly, A.; Sahel, J.-A.; Chaumet-Riffaud, P.; Girerd, X.; Rossant, F.; Paques, M. Morphometric analysis of small arteries in the human retina using adaptive optics imaging: Relationship with blood pressure and focal vascular changes. J. Hypertens. 2014, 32, 890–898. [Google Scholar] [CrossRef]
- Paul, B.; Sapra, B.; Maheshwari, S.; Goyal, R.K. Role of losartan therapy in the management of diabetic hypertension. J. Assoc. Physicians India 2000, 48, 514–518. [Google Scholar]
- Schutta, M.H. Diabetes and Hypertension: Epidemiology of the Relationship and Pathophysiology of Factors Associated with These Comorbid Conditions. J. Cardiometabolic Syndr. 2007, 2, 124–130. [Google Scholar] [CrossRef]
- Katon, W.J.; Rutter, C.; Simon, G.; Lin, E.H.; Ludman, E.; Ciechanowski, P.; Kinder, L.; Young, B.; Von Korff, M. The Association of Comorbid Depression with Mortality in Patients with Type 2 Diabetes. Diabetes Care 2005, 28, 2668–2672. [Google Scholar] [CrossRef]
- Tatsumi, Y.; Ohkubo, T. Hypertension with diabetes mellitus: Significance from an epidemiological perspective for Japanese. Hypertens. Res. 2017, 40, 795–806. [Google Scholar] [CrossRef]
- Rosenbaum, D.; Alessandro, M.; Koch, E.; Rossant, F.; Gallo, A.; Kachenoura, N.; Paques, M.; Redheuil, A.; Girerd, X. Effects of age, blood pressure and antihyperten-sive treatments on retinal arterioles remodeling assessed by adaptive optics. J. Hypertens. 2016, 34, 1115–1122. [Google Scholar] [CrossRef]
- Gallo, A.; Mattina, A.; Rosenbaum, D.; Koch, E.; Paques, M.; Girerd, X. Retinal arteriolar remodeling evaluated with adaptive optics camera: Relationship with blood pressure levels. Ann. Cardiol. Angeiol. 2016, 65, 203–207. [Google Scholar] [CrossRef]
- Arichika, S.; Uji, A.; Ooto, S.; Muraoka, Y.; Yoshimura, N. Effects of age and blood pressure on the retinal arterial wall, analyzed using adaptive optics scanning laser ophthalmoscopy. Sci. Rep. 2015, 5, 12283. [Google Scholar] [CrossRef]
- Nardin, M.; Coschignano, M.A.; Rossini, C.; De Ciuceis, C.; Caletti, S.; Rizzoni, M.; Docchio, F.; Porteri, E.; Rizzoni, D. Methods of evaluation of microvascular structure: State of the art. Eur. J. Transl. Clin. Med. 2018, 1, 7–17. [Google Scholar] [CrossRef]
- Holt, R.; DeVries, J.H.; Hess-Fischl, A.; Hirsch, I.B.; Kirkman, M.S.; Klupa, T.; Ludwig, B.; Nørgaard, K.; Pettus, J.; Renard, E.; et al. The management of type 1 diabetes in adults. A consensus report by the American Diabetes Association (ADA) and the European Association for the Study of Diabetes (EASD). Diabetologia 2021, 64, 2609–2652. [Google Scholar] [CrossRef] [PubMed]


| Assessed Laboratory Markers | Recommended Range |
|---|---|
| Glycated haemoglobin (HbA1c) | ≤7.0% (≤53 mmol/mol) |
| Concentration of total cholesterol | <200 mg/dL (<5.2 mmol/L) |
| Concentration of HDL | >40 mg/dL (>1.0 mmol/L) in men >45 mg/dL (>1.2 mmol/L) in women |
| Concentration of LDL | <100 mg/dL (2.6 mmol/L) |
| Concentration of triglycerides | <150 mg/dL (<1.7 mmol/L) |
| Concentration of creatinine | 0.6–1.3 mg/dL (53–115 µmol/L) |
| Glomerular filtration rate (GFR) | <90 mL/min/1.73 m2 |
| Albumin/creatinine ratio (ACR) | <2.5 mg/g creatinine |
| Study Group | |||
|---|---|---|---|
| DM1 | Control Group | p | |
| n (%) | 22 (49) | 23 (51) | - |
| Age, years (SD) mean ± SD | 43 ± 9 | 41 ± 11 | 0.54 |
| Median (IQR) | 41 (37; 51) | 42 (33–48) | |
| DDY mean ± SD | 22.6 ± 10.0 | - | - |
| Median (IQR) | 22.5 (15–29.25) | ||
| HbA1c (%) mean ± SD | 7.5 ± 1.1 | 5.26 ± 0.18 | 0.04 |
| Median (IQR) | 7.45 (6.8–8.7) | 5.27 (5.11–5.45) | |
| Total cholesterol (mg/dL) mean ± SD | 196 ± 46 | 185.2 ± 23.4 | 0.54 |
| Median (IQR) | 191 (158–232) | 184 (152–222) | |
| HDL cholesterol (mg/dL) mean ± SD | 77 ± 21 | 63.0 ± 9.76 | 0.27 |
| Median (IQR) | 73 (63–94) | 61 (55–85) | |
| LDL cholesterol (mg/dL) mean ± SD | 127 ± 42 | 116.67 ± 31.76 | 0.05 |
| Median (IQR) | 114 (93–166) | 117 (72–174) | |
| TG (mg/dL) mean ± SD | 86 ± 38 | 101.67 ± 33.13 | 0.71 |
| Median (IQR) | 76 (55–115) | 92 (54–141) | |
| Creatinine (mg/dL) mean ± SD | 0.86 ± 0.13 0.85 (0.80–0.90) | 0.93 ± 0.18 | 0.27 |
| Median (IQR) | 0.88 (0.76–0.90) | ||
| eGFR (mL/(min/1.73m2)) mean ± SD | 83.8 ± 13.4 82 (77–93) | 80.21 ± 11.05 | 0.99 |
| Median (IQR) | 81 (78–92) | ||
| ACR (mg/mmol) mean ± SD | 1.28 ± 1.72 0.45 (0.20–1.95) | 0.61 ± 0.69 | 0.69 |
| Median (IQR) | 0.59 (0.11–1.25). | ||
| Systolic BP (mHg) | 135 ± 14 135 (125; 147) | 128 ± 9 | 0.053 |
| 127 (123; 136) | |||
| Diastolic BP (mmHg) | 85 ± 9 83 (79; 94) | 84 ± 9 | 0.71 |
| 85 (78; 89) | |||
| BMI [kg/m2] mean ± SD | 24.4 ± 2.6 24.0 (22.0–26.4) | 23.7 ± 3.0 | 0.27 |
| Median (IQR) | 22.3 (21.6–26.0) | ||
| Waist circumference (cm) mean ± SD | 80.73 ± 11.4 80.5 (70.5–87.8) | 81.87 ± 11.81 | 0.34 |
| Median (IQR) | 78 (71–91) | ||
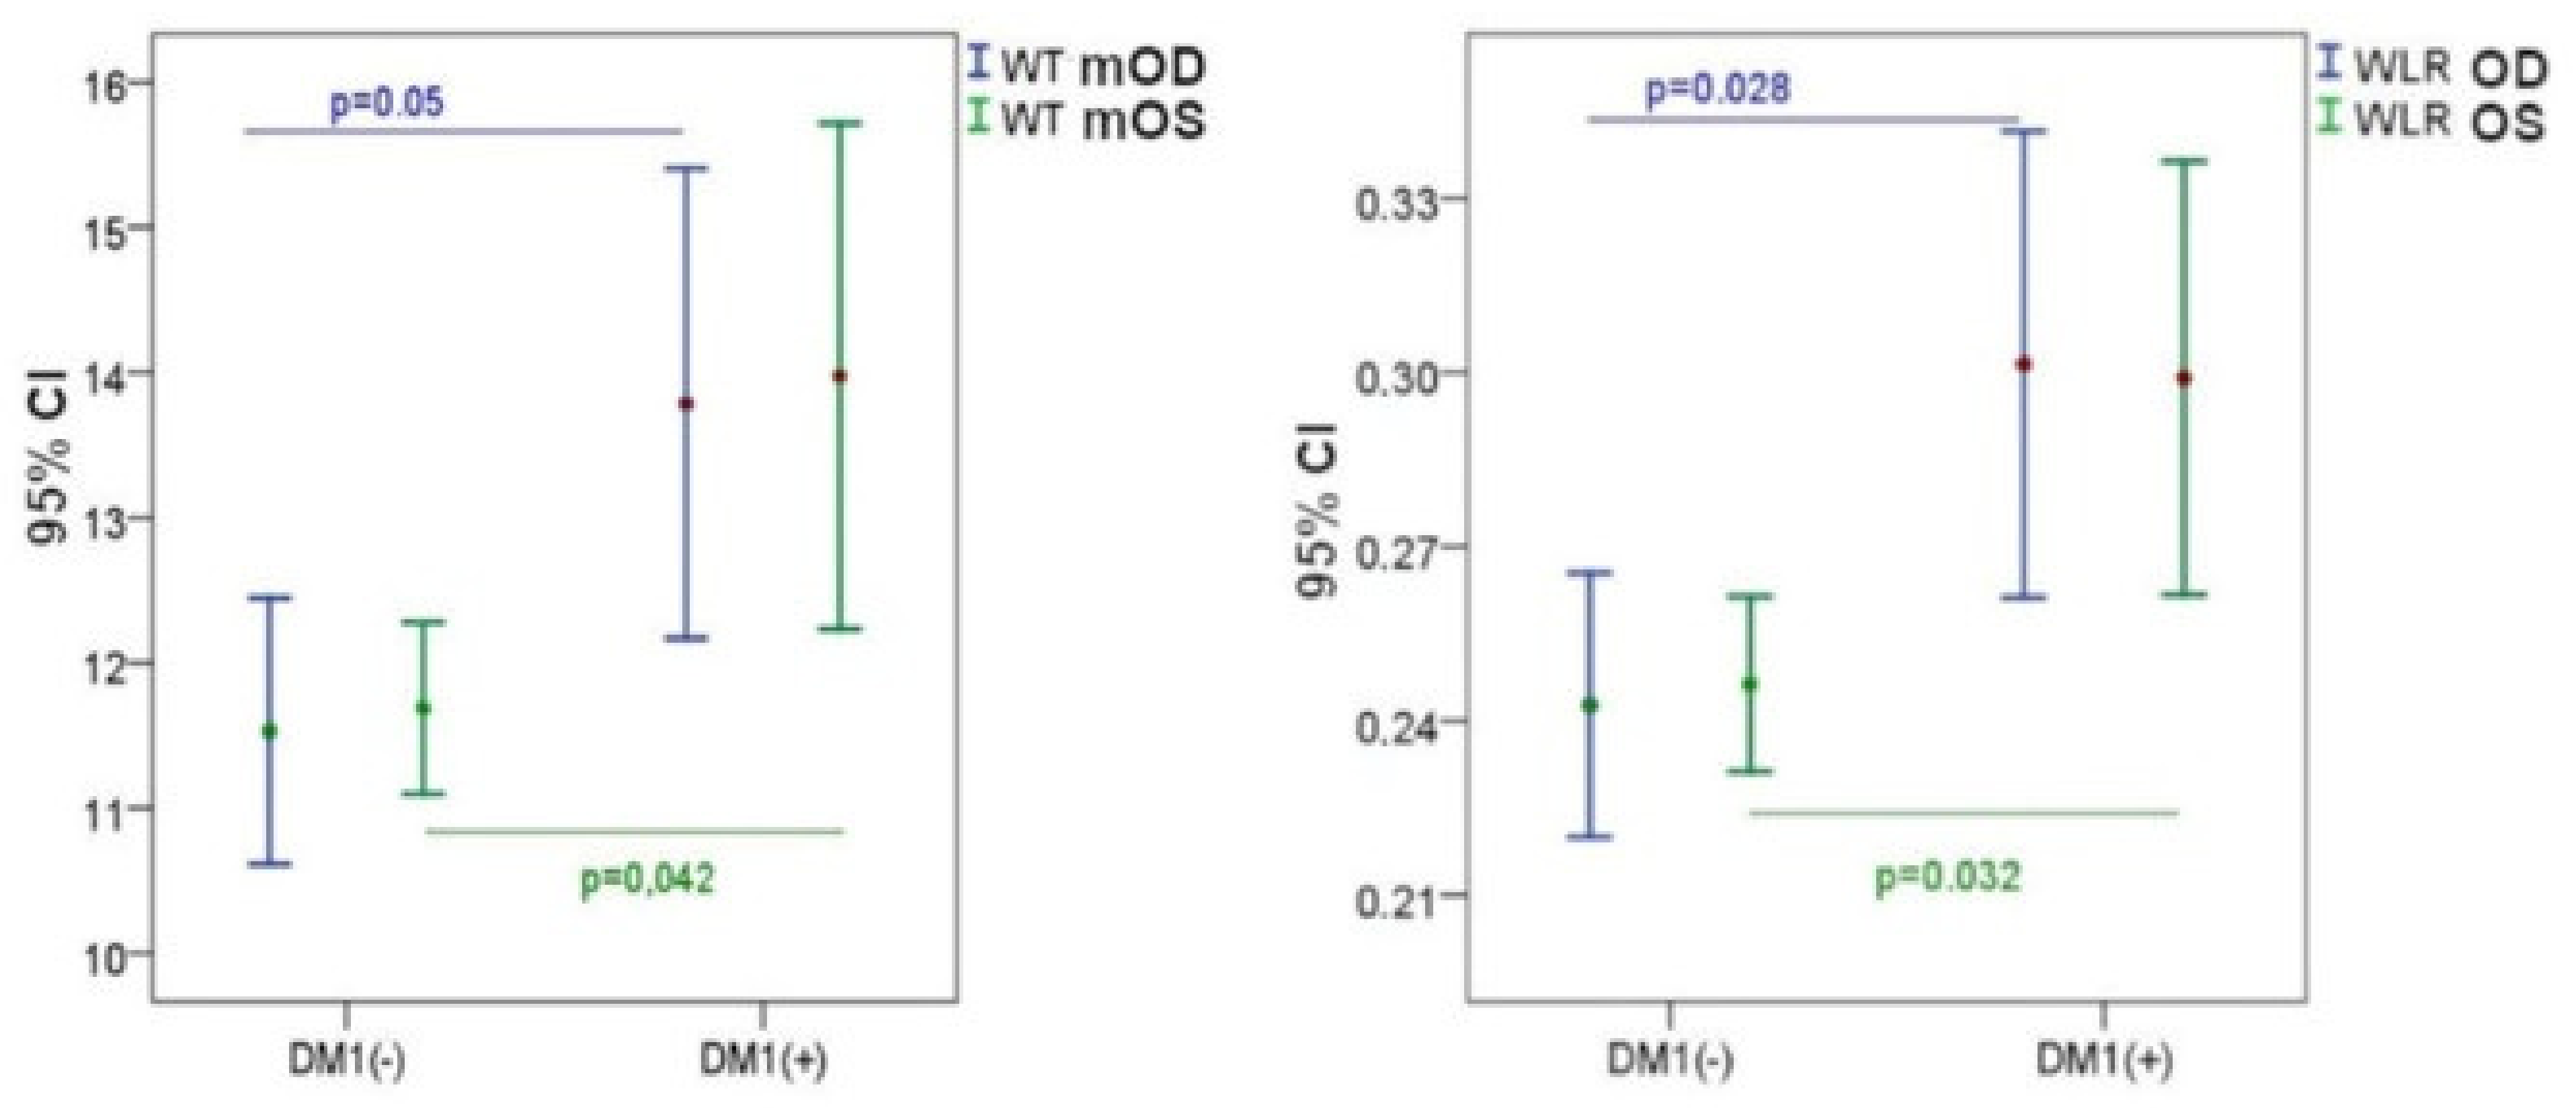
| DM1 Control Group (−) | DM1 Patients Group (+) | p | |||
|---|---|---|---|---|---|
| Mean ± SD | Median (IQR) | Mean ± SD | Median (IQR) | ||
| WT_r (μm) | 11.5 ± 2.1 | 11.5 (10.2; 12.3) | 13.6 ± 3.5 | 12.4 (11.0; 16.0) | 0.050 |
| WT_l (μm) | 11.7 ± 1.3 | 11.5 (10.7; 12.2) | 13.9 ± 3.7 | 13.7 (11.0; 16.3) | 0.042 |
| WLR_r | 0.24 ± 0.5 | 0.24 (0.22; 0.28) | 0.30 ± 0.09 | 0.30 (0.23; 0.34) | 0.028 |
| WLR_l | 0.25 ± 0.03 | 0.24 (0.22; 0.28) | 0.30 ± 0.08 | 0.28 (0.23; 0.36) | 0.032 |
| WCSA_r (μm2) | 3893 ± 967 | 3731(3208; 4667) | 4661 ± 1825 | 4470 (3532; 5560) | 0.098 |
| WCSA_l (μm2) | 3836 ± 878 | 3882 (3412; 4232) | 4837 ± 2018 | 4353 (3577; 5952) | 0.089 |
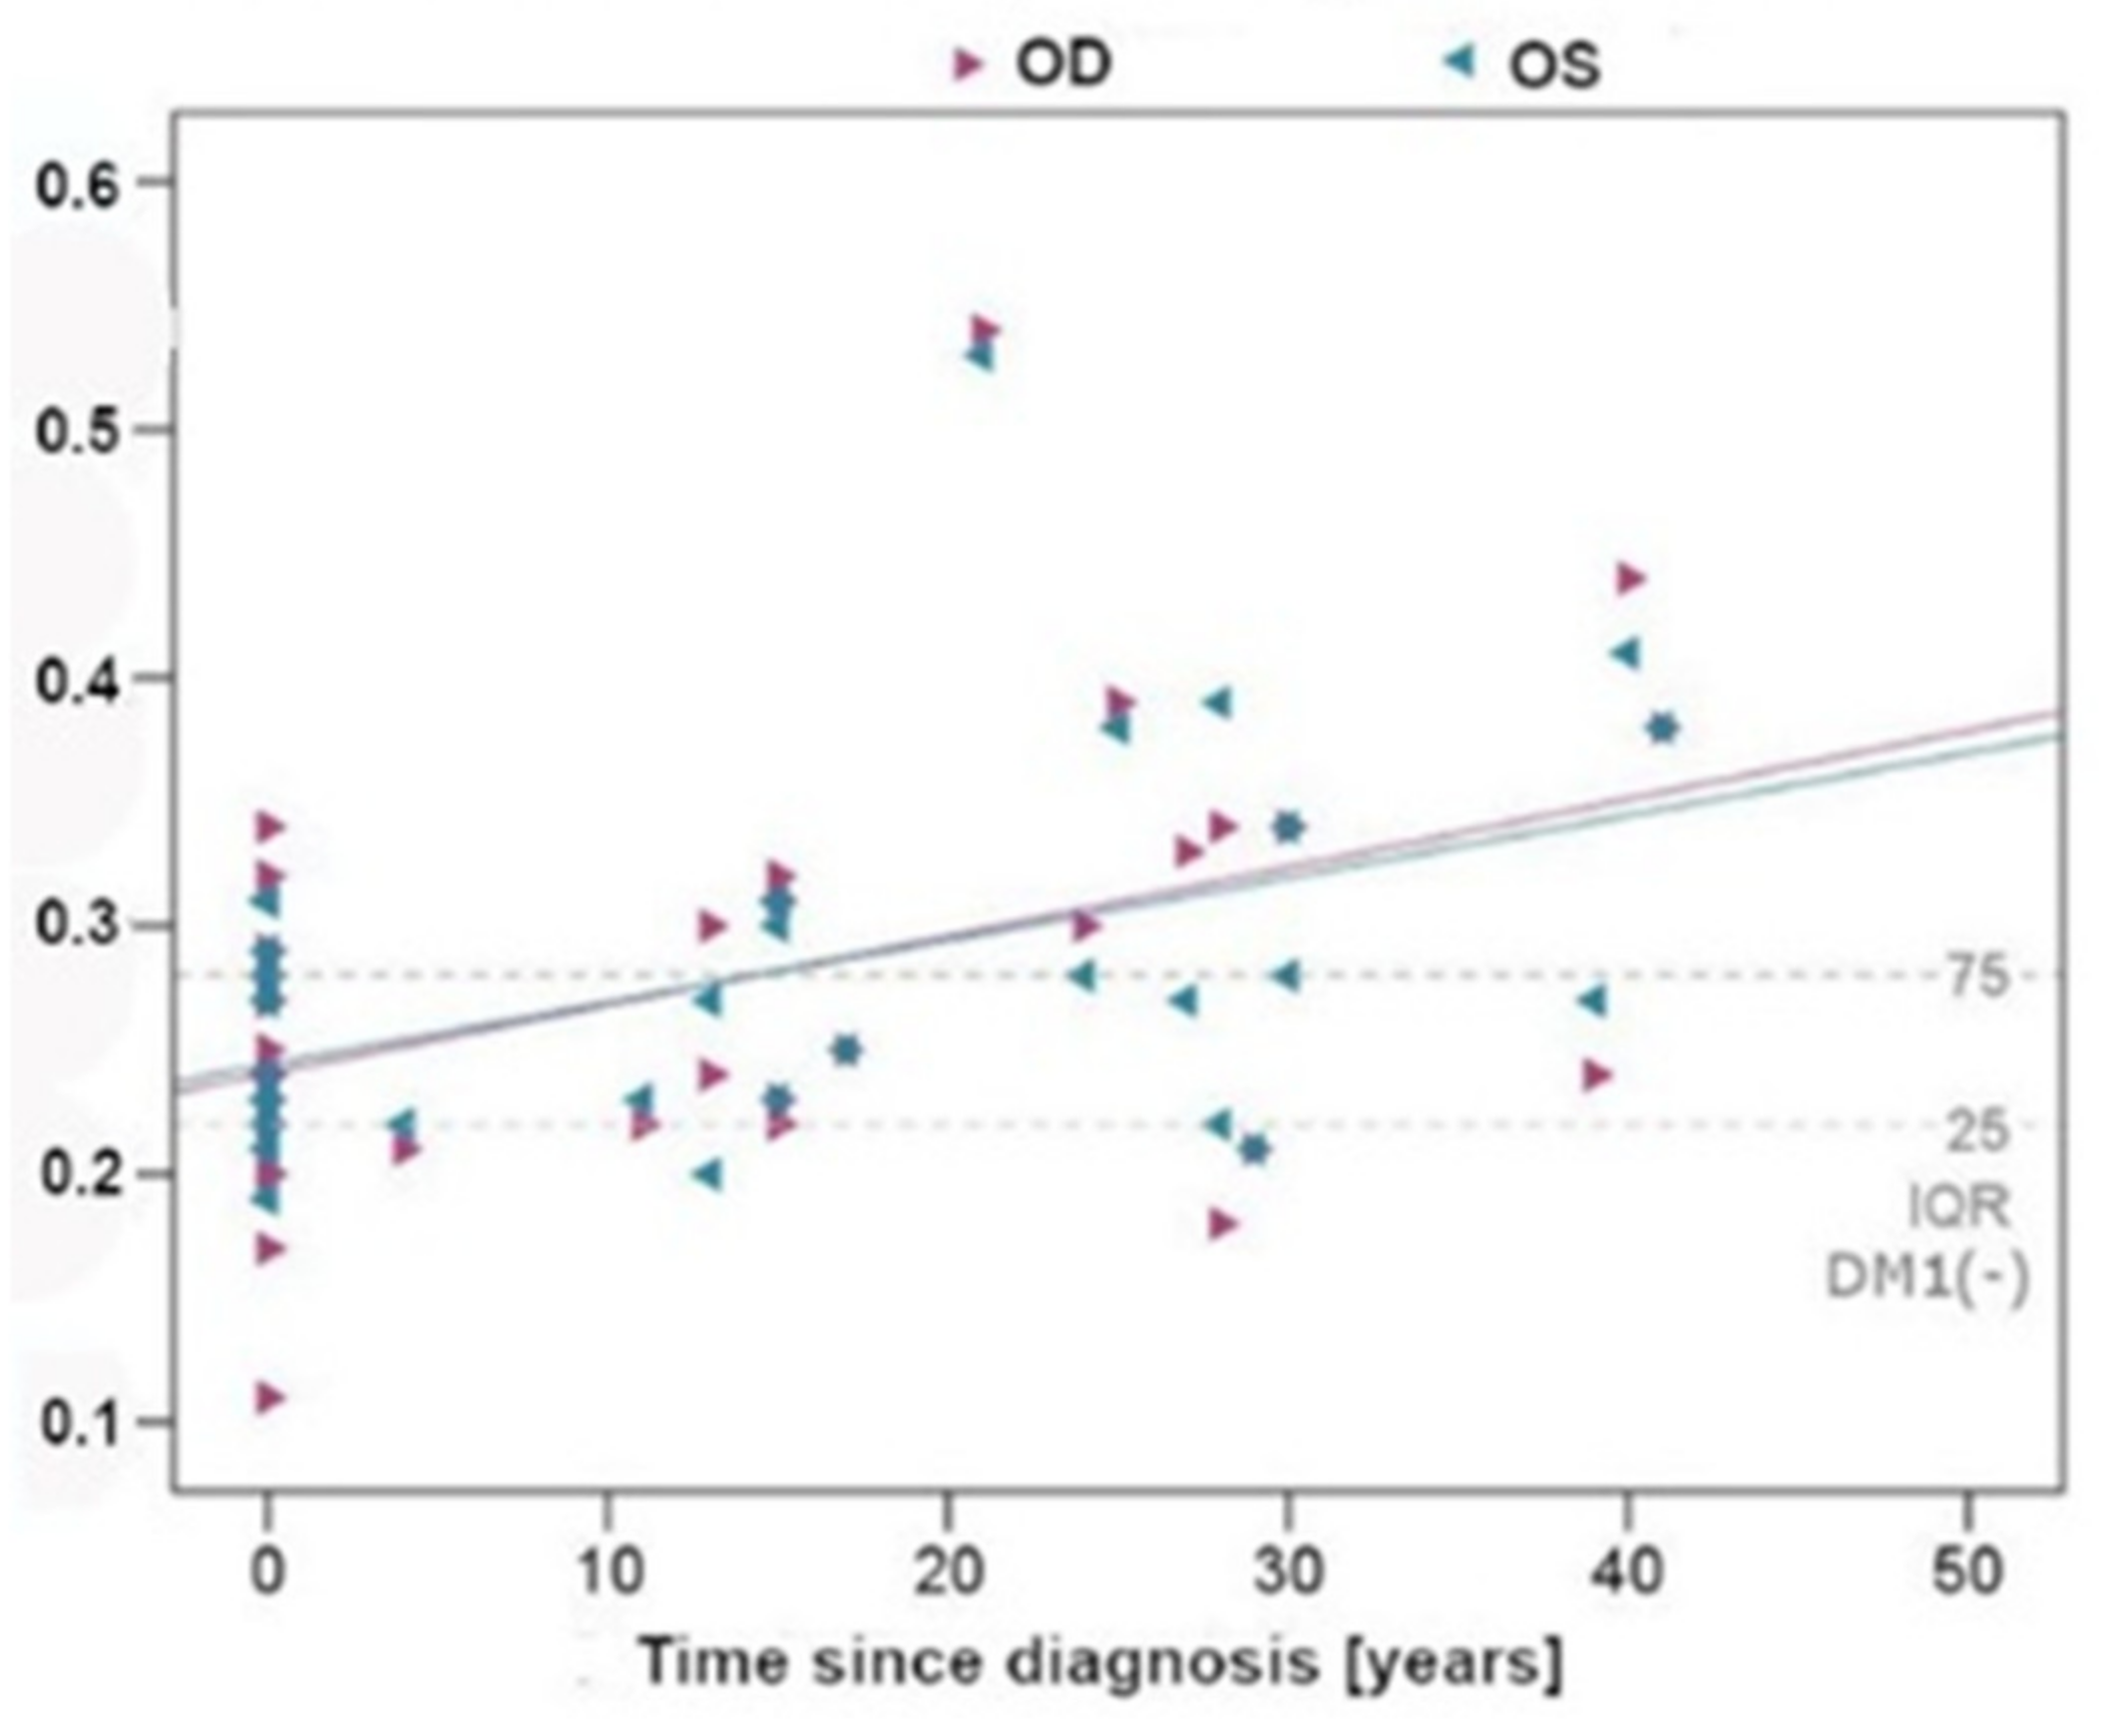
| Partial Correlation Controlled by: Age, Gender, BMI | Time from DM1 Diagnosis | |
|---|---|---|
| r | p | |
| WTr (μm) | 0.452 | 0.004 |
| WTl (μm) | 0.489 | 0.001 |
| WLRr | 0.454 | 0.004 |
| WLRl | 0.477 | 0.002 |
| WCSAr (μm2) | 0.322 | 0.046 |
| WCSAl (μm2) | 0.398 | 0.012 |
Publisher’s Note: MDPI stays neutral with regard to jurisdictional claims in published maps and institutional affiliations. |
© 2022 by the authors. Licensee MDPI, Basel, Switzerland. This article is an open access article distributed under the terms and conditions of the Creative Commons Attribution (CC BY) license (https://creativecommons.org/licenses/by/4.0/).
Share and Cite
Matuszewski, W.; Gontarz-Nowak, K.; Harazny, J.M.; Bandurska-Stankiewicz, E. Evaluation of Morphological Changes in Retinal Vessels in Type 1 Diabetes Mellitus Patients with the Use of Adaptive Optics. Biomedicines 2022, 10, 1926. https://doi.org/10.3390/biomedicines10081926
Matuszewski W, Gontarz-Nowak K, Harazny JM, Bandurska-Stankiewicz E. Evaluation of Morphological Changes in Retinal Vessels in Type 1 Diabetes Mellitus Patients with the Use of Adaptive Optics. Biomedicines. 2022; 10(8):1926. https://doi.org/10.3390/biomedicines10081926
Chicago/Turabian StyleMatuszewski, Wojciech, Katarzyna Gontarz-Nowak, Joanna M. Harazny, and Elżbieta Bandurska-Stankiewicz. 2022. "Evaluation of Morphological Changes in Retinal Vessels in Type 1 Diabetes Mellitus Patients with the Use of Adaptive Optics" Biomedicines 10, no. 8: 1926. https://doi.org/10.3390/biomedicines10081926
APA StyleMatuszewski, W., Gontarz-Nowak, K., Harazny, J. M., & Bandurska-Stankiewicz, E. (2022). Evaluation of Morphological Changes in Retinal Vessels in Type 1 Diabetes Mellitus Patients with the Use of Adaptive Optics. Biomedicines, 10(8), 1926. https://doi.org/10.3390/biomedicines10081926