Article

Identification of Novel Vascular Genes Downstream of Islet2 and Nr2f1b Transcription Factors

1
Department of Biological Sciences, National Sun Yat-sen University, Kaohsiung 804, Taiwan
2
Doctoral Degree Program in Marine Biotechnology, National Sun Yat-sen University, Kaohsiung 804, Taiwan
3
Doctoral Degree Program in Marine Biotechnology, Academia Sinica, Taipei 115, Taiwan
4
Department of Biotechnology and Bioindustry Sciences, National Cheng Kung University, Tainan 701, Taiwan
5
The iEGG and Animal Biotechnology Center, National Chung Hsing University, Taichung 402, Taiwan
6
Department of Biotechnology, Kaohsiung Medical University, Kaohsiung 807, Taiwan
7
Institute of Biomedical Sciences, National Sun Yat-sen University, Kaohsiung 804, Taiwan
8
Institute of Medical Science and Technology, National Sun Yat-sen University, Kaohsiung 804, Taiwan
*
Author to whom correspondence should be addressed.
These authors contributed equally to this work.
Biomedicines 2022, 10(6), 1261; https://doi.org/10.3390/biomedicines10061261
Submission received: 8 March 2022 / Revised: 21 May 2022 / Accepted: 22 May 2022 / Published: 27 May 2022
(This article belongs to the Special Issue Angiogenesis in Health and Disease)

Abstract

:
The genetic regulation of vascular development is not elucidated completely. We previously characterized the transcription factors Islet2 (Isl2) and Nr2f1b as being critical for vascular growth. In this study, we further performed combinatorial microarrays to identify genes that are potentially regulated by these factors. We verified the changed expression of several targets in isl2/nr2f1b morphants. Those genes expressed in vessels during embryogenesis suggested their functions in vascular development. We selectively assayed a potential target follistatin a (fsta). Follistatin is known to inhibit BMP, and BMP signaling has been shown to be important for angiogenesis. However, the fsta’s role in vascular development has not been well studied. Here, we showed the vascular defects in ISV growth and CVP patterning while overexpressing fsta in the embryo, which mimics the phenotype of isl2/nr2f1b morphants. The vascular abnormalities are likely caused by defects in migration and proliferation. We further observed the altered expression of vessel markers consistent with the vascular defects in (fli:fsta) embryos. We showed that the knockdown of fsta can rescue the vascular defects in (fli:fsta) fish, suggesting the functional specificity of fsta. Moreover, the decreased expression of fsta rescues abnormal vessel growth in isl2 and nr2f1b morphants, indicating that fsta functions downstream of isl2/nr2f1b. Lastly, we showed that Isl2/Nr2f1b control vascular development, via Fsta–BMP signaling in part. Collectively, our microarray data identify many interesting genes regulated by isl2/nr2f1b, which likely function in the vasculature. Our research provides useful information on the genetic control of vascular development.

1. Introduction

The proper functioning of the cardiovascular system depends on the precise formation of blood vessels that were established in an evolutionary conserved manner in vertebrates. Vascular endothelial cells are differentiated from angioblasts that originated in the lateral plate mesoderm. The main axial vessels formed by the process of vasculogenesis, which involves the specification and differentiation of angioblasts, as well as their migration and aggregation into vascular cords [1,2]. Then, angiogenesis involves sprouting, migration, and proliferation of differentiated vascular endothelial cells, which form a vessel plexus [3,4,5]. The zebrafish model has been effective in identifying the molecules and signals responsible for blood vessel growth and patterning during development [6,7,8,9,10].
Recent studies have identified genes and singal pathways to regulate artery and vein specification of vasculogenesis in various vertebrates [11,12]. In zebrafish embryos, arterial specification is mainly controlled by vascular endothelial growth factor (Vegf) activating Notch signals via PLC-r-PKC-MEK pathways [13,14,15,16]. Venous cells expressing different markers indicated a distinct genetic regulation via PI3K/AKT signaling in angioblasts to enhance vein specification [17,18]. However, the precise mechanism of signaling interactions during vasculogenesis is not fully understood. After the artery and vein have formed, VEGF–Notch signaling continuously plays a critical role in ISV growth and patterning, including the specification of tip cells and stalk cells, as well as the proliferation and migration of endothelial cells [19,20,21]. Meanwhile at the tail region, a distinct mechanism of angiogenesis from ISV growth, BMP signaling, promotes endothelial progenitor cells sprouting from the posterior cardinal vein (PCV), as well as their proliferation and migration to form a CVP network [22]. Therefore, a complex coordination among molecules and signals has a critical role in regulating endothelial cell fates and behaviors during angiogenesis. However, the molecules that are required for ISV and CVP formation have yet to be fully documented. Identification of the novel regulators during the developmental processes will help in the understanding of vascular patterning and could serve as new therapeutic targets.
Transcription factors play a central role in the regulation of vascular development after receiving signals [23,24]; however, little is known about vein identity and ISV patterning in zebrafish. CoupTFII (Nr2f2) in mice, which plays a key role in venous identity and angiogenesis, has been identified [18,25], but nr2f2 in zebrafish only plays a minor role in vein differentiation, as observed in other groups as well as from our observations [26,27]. Further, we previously identified the transcription factors Islet2 and Nr2f1b, which are required for the specification of the vein and tip cell identity, mediated by Notch pathways in zebrafish [28,29]. We, thus, hypothesized that Isl2 and Nr2f1b signaling pathways are involved in vein specification, tip cells’ proliferation, and migration during angiogenesis. To reveal the molecular mechanisms for how Isl2/Nr2f1b control vascular development, we used a genome-wide microarray approach to identify nr2f1b- and isl2-regulated genes in the vasculature.
In the current study, we knocked down nr2f1b and/or isl2 as tools to identify novel genes that are potentially involved in vasculogenesis and angiogenesis. We validated expression patterns and changes in many interesting genes used by wt and isl2/nr2f1bMO. The identification of novel genes is critical to further understanding mechanisms of vascular development, which are regulated by Isl2 and Nr2f1b. We selectively assayed the functional relevance of one potential target, follistatin a (fsta), from the array data. Follistatin is a glycosylated protein and binds and neutralizes the actions of many members of the transforming growth factor-β family of proteins, such as activin, myostatin, TGFβ, and BMPs [30]. The functions of follistatin are known for oocyte maturation, neural morphogenesis, and skeletal muscle development [31,32]. However, not much is known about whether it functions in vascular development, although it has been reported to be involved in angiogenesis during skeletal muscle healing after injury and disease [33]. BMP signaling has been reported in vascular differentiation and angiogenesis via SMAD or non-SMAD pathways [34,35]. The deregulation of BMP signals has been implicated in vascular diseases and tumor angiogenesis [36]. However, the molecular mechanisms for how BMP signals regulate endothelial cell angiogenesis is not fully understood. Recent efforts in zebrafish studies reveal dab2- and β-catenin-mediated BMP signals that control CVP patterning [37,38].
We hypothesized that Isl2/Nr2f1b regulate ISV growth and CVP formation, mediated by Fsta–BMP signals, since BMP signaling has been shown to be involved in venous angiogenesis in zebrafish. Our data support fsta functioning in the vasculature downstream of isl2/nr2f1b. We also revealed that the interaction of isl2/nr2f1b and Fsta-BMP signals works in order to control vascular development. Together, our results have identified many vascular genes acting downstream of the Isl2/Nr2f1b pathway. Those targets might play important functions in regulating the networks of vascular development.

2. Materials and Methods

2.1. Zebrafish Husbandry and Chemical Treatment

Zebrafish (Danio rerio) and embryos were raised and maintained in a 28.5 °C fish room based on the Zebrafish Book guidelines [39]. The regulations were approved from the National Sun Yat-Sen University Animal Care Committee (approval reference #10231). Wild-type fish and transgenic fish lines Tg(flk:eGFP), Tg(fli1a:negfp)y7, Tg(gata1:dsRed)sd2, and Tg(kdrl:mCherry)ci5 [13,40,41,42] were used in this study from the Taiwan Zebrafish Core Facility at Academia Sinica. Embryos were cultured in E3 medium and dechorionation by incubation was performed in 2 mg/mL pronase (Sigma, St. Louis, MO, USA). 0.003% 1-Phenyl-2-Thiourea (PTU) (Sigma), which was added into the medium at 6 h post fertilization (hpf) to inhibit pigmentation. To investigate signal pathways, the embryos were treated with 15 μM of the VEGF inhibitor SU5416 (Calbiochem, Nottingham, UK) and 75 μM of the Notch signal inhibitor DAPT (Sigma) at a working concentration in E3 fish water at 6 hpf. Concentrations of 10 μM Dorsomorphin (DM, Calbiochem) or 40 μM DMH1 (Calbiochem) were used to inhibit BMP signals at 20 hpf. The control embryos were cultured in 0.3% DMSO medium.

2.2. Morpholinos and Tol2 DNA Injection

Gene expression knockdowns were performed through an injection of morpholino antisense oligonucleotides (MOs) (GeneTools LLC, Corvallis, OR, USA). Morpholinos were injected into embryos around the 1–2 cell stage using a FemtoJet microinjector (Eppendorf, Germany). Morpholinos specifically targeted to nr2f1b and islet2 were described in [28,29]. Translation-blocking morpholinos targeting the ATG start codon of fsta or targeting the exon3–intron3 boundary to interfere with the splicing of fsta (fstae3i3 MO) (both MOs are gifts from Dr. Waskiewicz; [43]) were injected with 8 ng.
fsta e3i3MO sequence: 5′-TGTGTTACCTACTTTTGCATTTGCC-3′
fsta ATGMO sequence: 5′-CGCTTTAGCATCCTTAGCATGTTTA-3′
To generate fli:fsta-overexpressing embryos, we used the Tol2kit vectors with the multisite Gateway cloning system (Invitrogen) to make expression constructs. Fsta coding region franking with attb1/b2 sequences was amplified using the following primers to make pDONR-fsta. fsta-f-attb1: 5′-GGGGACAAGTTTGTACAAAAAAGCAG-GCTCCACCATGCTAAGGATGCTAAAGCGTC-3′ and fsta-r-attb2: 5′-GGGGACCACTTTGTACAAGAAAGCTGGGTTTTACTTACAGTTGCAAGATCC-3′. A Gateway construct containing a 0.8-kb fli1a promoter fragment was described in [44]. About 100 pg of plasmid DNA and 25 pg of transposase mRNA were co-injected into 1-cell stage embryos. The GFP signals driven by cardiomyocyte light chain (CMLC) from the vector backbone allowed us to verify transient (fli:fsta) overexpressing embryos

2.3. Microarray Analysis

The total RNA of wildtype and isl2 morphants or nr2f1b morphants at 24 hpf were extracted using an RNAeasy mini kit (QIAGEN, Valencia, CA, USA) labeled with Cy3 or Cy5 and hybridized to a Nimblegen zebrafish 385 k chip (Roche Applied Science) at the University of Idaho IBEST DNA Sequencing Analysis Core. To control for features and obtain the raw intensity data for each probe and each array, the NimbleScan software program (NimbleGen) was used to align a chip-specific grid. Chip images for each array were checked as to whether they had any significant spatial artifacts. Raw intensity data were analyzed into an R statistical computing environment for a quality check. In addition, the distributions of chip intensity and hierarchical clusters were compared as to whether any unusual global patterns existed. Each array then performed background correction and normalization. Lastly, we used the median polish procedure to summarize all the probes contained within each probe set into a single expression value for each gene [45,46,47]. Probe sets with low expression levels were removed from the final number of statistical tests. Differential expression was analyzed using a linear model and an empirical Bayesian adjustment to the variances [48]. To control for the expected false discovery rate (FDR) given multiple tests, the Benjamini and Hochberg (BH) method was used [49]. Together, probe sets were considered statistically differentially expressed if they had a BH adjusted p-value of < 0.05. The average ratios of expression values of isl2 morphants vs. control or nr2f1b morphants vs. control were calculated from three experiments. We chose an arbitrary cut-off value of an expression fold change ≥2.5 or <0.5 on both arrays (Table 1 and Table 2). Results were listed by the fold change from highest to lowest.

2.4. RNA Extraction and cDNA Preparation

Total RNA was prepared from certain stages (15S, and 24, 30, or 48 hpf) of embryos using the RNeasy mini extraction kit (Qiagen) according to the manufacturer’s instructions. To generate cDNA, 1 μg of total RNA was used as template, using a mix of oligo-dT primer (Roche) and the RT-reverse transcriptase (Roche) according to the manufacturer’s instructions.

2.5. Real-Time RT-PCR Analysis

Real-time quantitative PCR was assayed using SYBR Green Master mix (Roche) and the LightCycler 96 real-time PCR system (Roche) and relative cDNA levels were measured and calculated using the LC96 software (Roche), and adjusted to the internal control β-actin levels based on the ΔΔCt method. The experiment was performed as biological triplicates. Real-time PCR primers were designed and listed in the Supplemental Table S1.

2.6. Whole-Mount In Situ Hybridization and Frozen Sections

Whole-mount in situ hybridization followed the protocol based on Thisse et. al. [50]. In-situ probes were obtained by PCR amplifying about 0.5~1 kb using the primers described in the Supplemental Table S2, as well as in vitro transcription using T7 Polymerase (Roche) with a DIG-labeled RNA labeling kit (Roche). Briefly, embryos were fixed in 4% paraformaldehyde (PFA) for 16 h and switched to methanol at −20 °C. After rehydration, permeabilization with proteinase K, the probe was added to embryos in hybridization buffer at 65 °C overnight, then was washed and blocked with BSA. An AP-conjugated anti-Dig antibody was added and proceeded to react with NBT/BCIP substrate (Roche). After the reaction, embryos were embedded and photographed. For transverse sections, the embryos were fixed and embedded with Tissue-Tek O.C.T Compound (Sakura Finetek, USA), sectioned at 10 µm using a CM3050S cryostat (Leica) and photographed on an IX71 microscope (Olympus, Tokyo, Japan).

2.7. Image Acquisition and Processing

Embryos were mounted in 3% methyl cellulose (Sigma) or 1.5% low melt agarose (Invitrogen, Philadelphia, PA, USA), and images captured with a color digital, an AxioCam HRc camera, and AxioVision software (Carl Zeiss, Germany). Embryos for the confocal images were immobilized and embedded in 5% Tricaine in 1.5% low-melting-point agarose (Invitrogen) and images were collected on a Zeiss LSM700 confocal microscope, and processed in ImageJ software. Final figures were made using Adobe Photoshop.

2.8. Protein Extraction and Western Blotting

Zebrafish embryos were dechorionated and homogenized at 4 °C using RIPA lysis buffer (AllBio Science, Taiwan) with protease inhibitor cocktails (Roche) and phosSTOP (Roche). The lysates were collected, then sodium dodecyl sulfate (SDS) sample buffer was added, and boiled for 15 min. The proteins were separated by SDS-PAGE (polyacrylamide gel electrophoresis) and then transferred to a polyvinylidene fluoride (PVDF) membrane (GE Healthcare). The membranes were washed in TBS-T (Tris-buffered saline with Tween-20) and blocked with nonfat milk at room temperature for 1 hr. The membranes were then incubated with anti-SMAD1, anti-phospho-SMAD1, anti-Erk1/2, anti-phospho-Erk1/2 (Cell Signaling Technology, Boston, MA, USA), and anti-β-actin (Sigma) overnight at 4 °C. The membranes were washed with TBS-T and incubated with a horseradish peroxidase (HRP)-conjugated secondary antibody at room temperature for 2 h. The signal was developed by an ECL chemiluminescence (Bio-Rad, Hercules, CA, USA) reaction.

2.9. Statistical Analyses

Data are shown as the mean ± standard error (S.E.) or mean ± standard deviation (S.D.) for at least two independent experiments with biological triplicates. Statistical analyses were performed with GraphPad Prism software. The p values of group comparisons were obtained by using the unpaired two-tailed Student’s t test. Statistical significance was concluded when the p values were <0.05.

3. Results

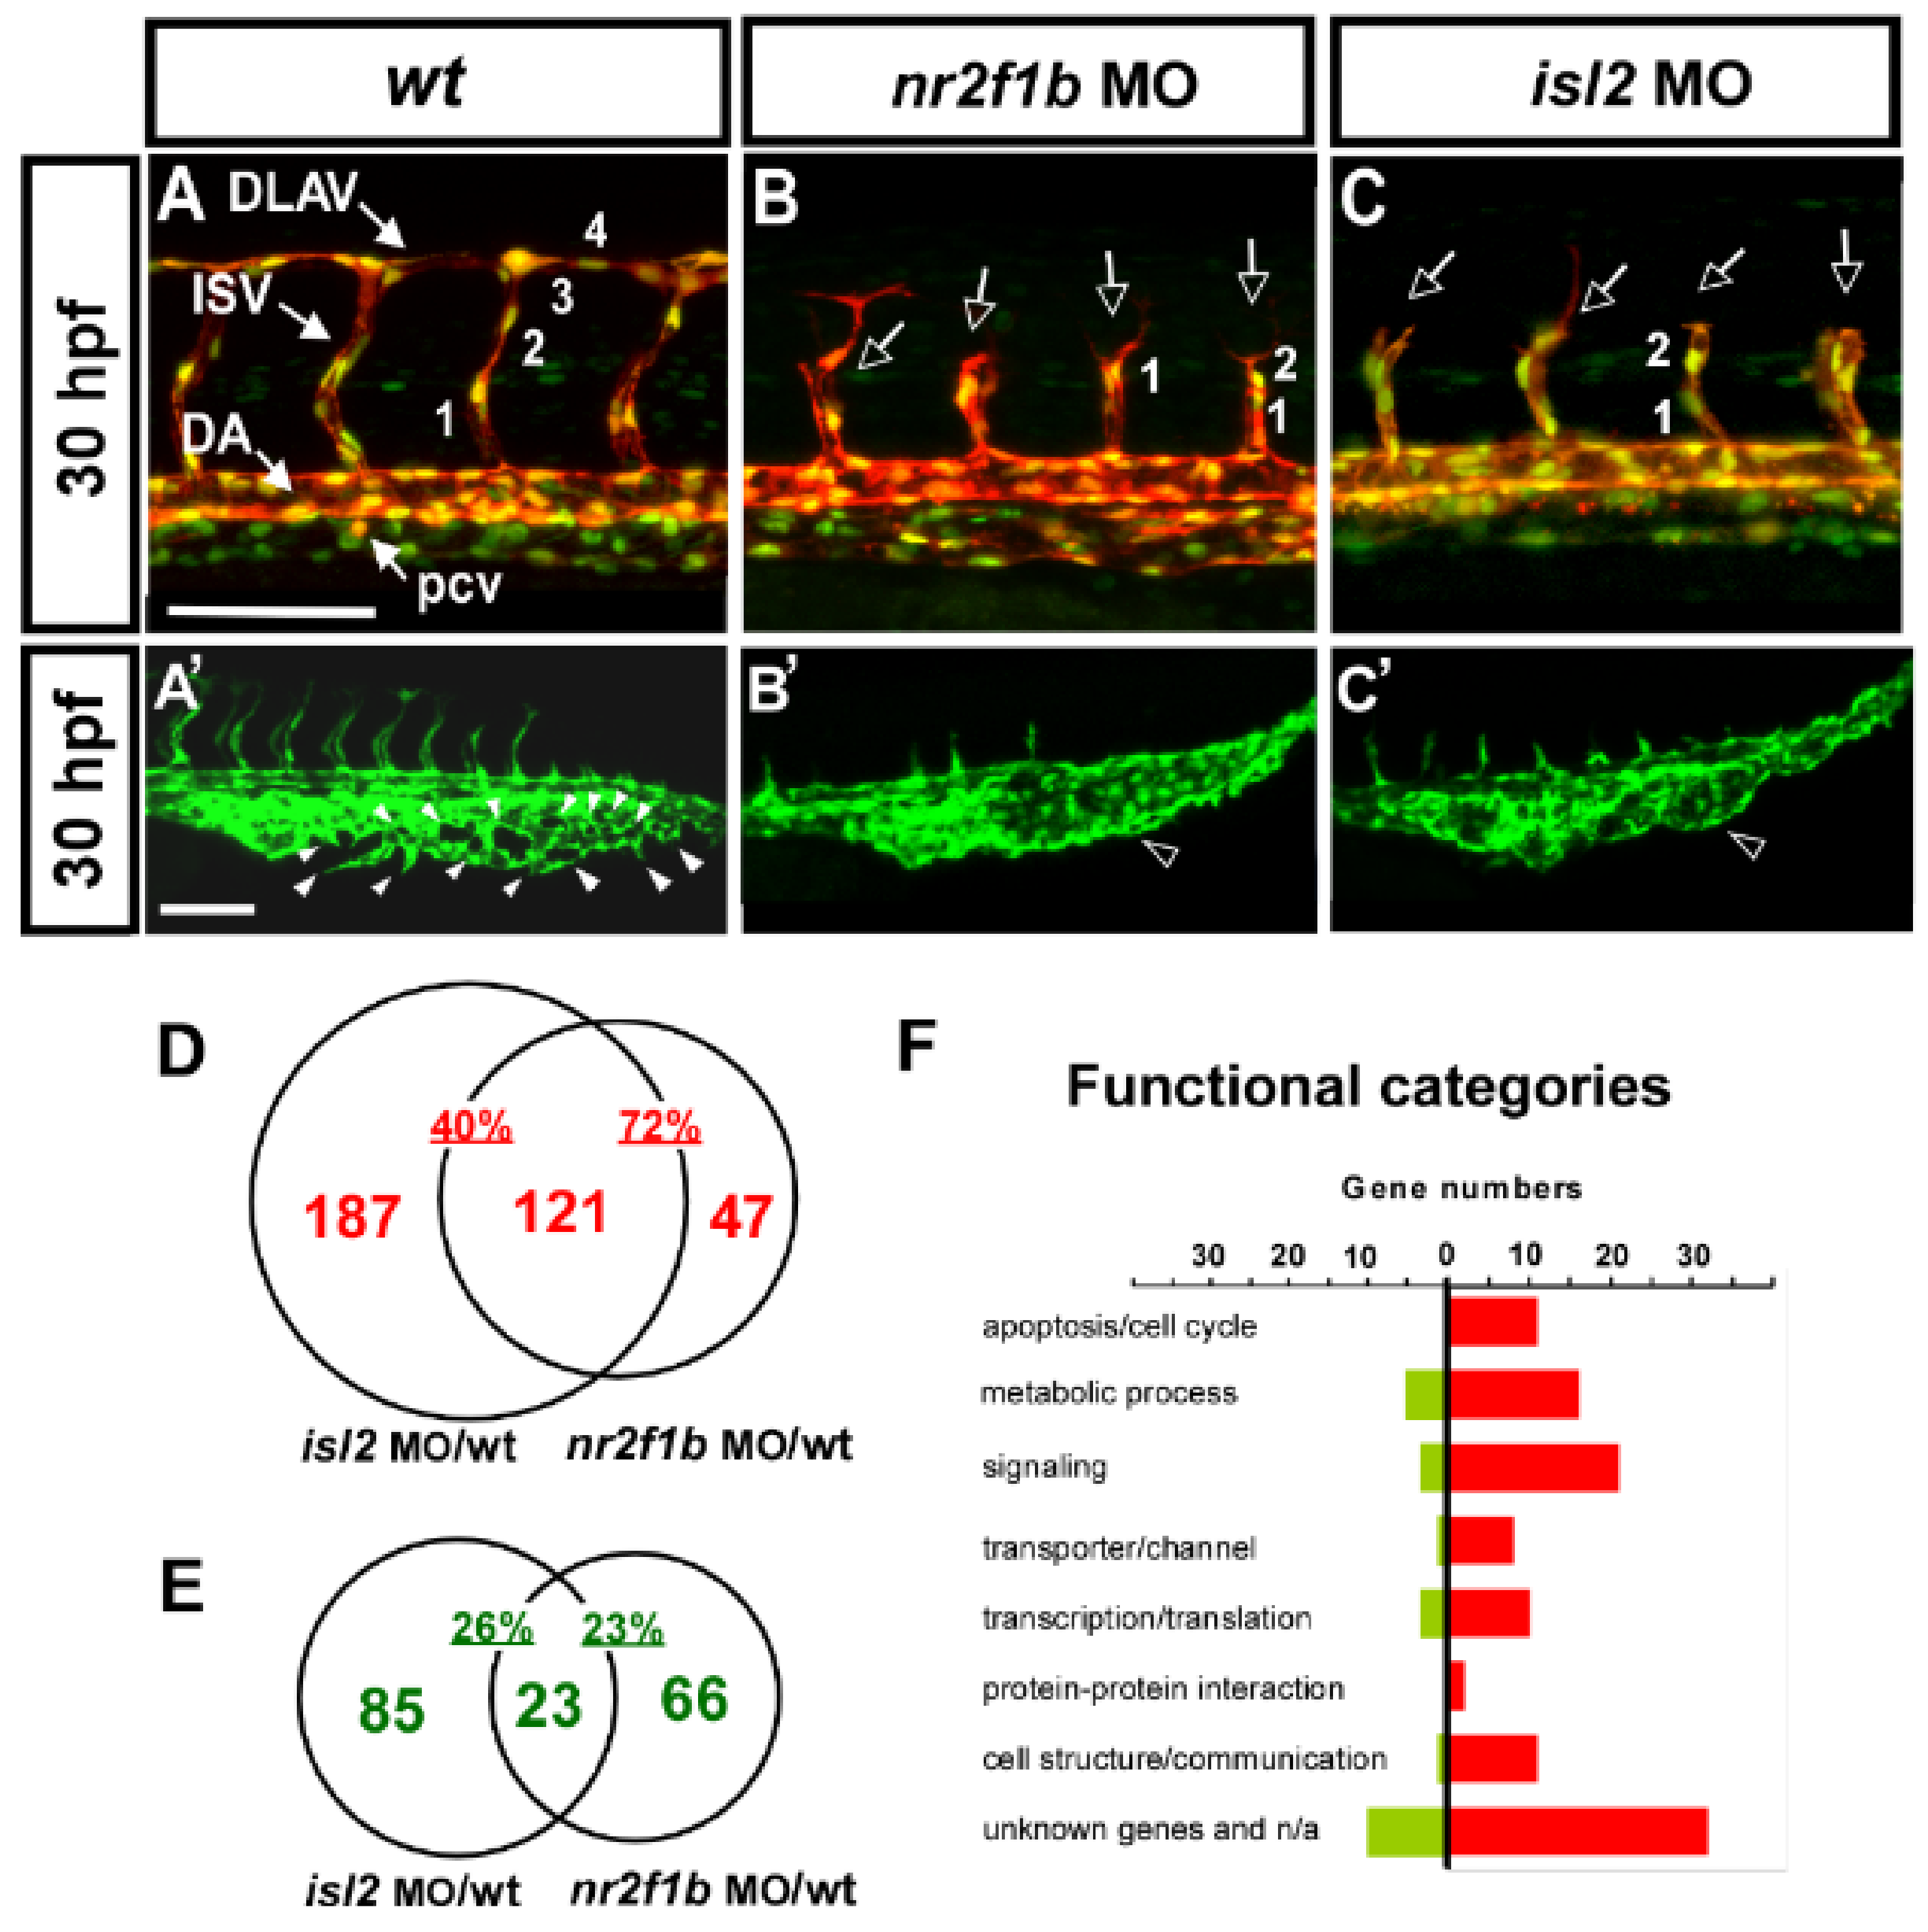
3.1. Microarray Analysis of nr2f1b and isl2 Downstream Targets

Our previous showed the transcription factors Islet2 and Nr2f1b to be critical for the specification of the vein and tip cell, mediated by the Notch pathway in zebrafish [28,29]. The knockdown of isl2 or nr2f1b impairs the vascular patterning of ISV and CVP (Figure 1A–C,A′–C′). At 30 hpf, in uninjected control embryos, ISV reached the DLAV at the dorsal region of the trunk (Figure 1A) and the CVP formed honeycomb-like structures via the sprouting and fusion of endothelial cells at the tail part (Figure 1A′). The loss of nr2f1b or isl2 showed an ISV growth defect (Figure 1B,C hollow arrows) and a mis-patterning of the plexus at the CVP (Figure 1B′,C′ hollow arrowhead). In addition, the knockdown of isl2 or nr2f1b resulted in reduced numbers of endothelial cells per ISV in the Tg (kdrl:mCherry; fli1a:negfp y7) embryos, where GFP was expressed in the nucleus of endothelial cells and the mCherry, labeled on ISV cells (Figure 1A–C numbers). We hypothesize that Islet2 and Nr2f1b signaling pathways are involved in vein specification and tip cells’ proliferation and migration during angiogenesis. In this study, we used a genome-wide microarray approach to identify nr2f1b- and isl2-regulated genes in the vasculature, specifically in the patterning of ISV and CVP.
To assay transcriptome level changes after the loss of nr2f1b or isl2, we undertook microarray analysis and compared the gene expressions for isl2 or nr2f1b morphants and wild-type embryos using 32,000 gene Nimblegen zebrafish chips (based on Zv8 genomic sequence assembly) and a full hybridization service from Nimblegen. The array was run in three biological replicates (i.e., independent morpholino injections). Data from the array were statistically analyzed and we chose an arbitrary cut-off value of an expression fold change of ≥ 2.5 or < 0.5 on both arrays (Table 1 and Table 2). The results were sorted by the fold change from highest to lowest. We found 79 potential targets to be up-regulated over 2.5-fold after the knockdown of nr2f1b and isl2 transcription factors. On the other hand, Table 2 lists a downregulation of greater than 2-fold of the 23 potential targets controlled by isl2 and nr2f1b.
We found a large portion of overlapping downstream targets for nr2f1b and islet2. There are 121 of 308 (40%) potential repression targets of isl2 and 121 of 168 (72%) potential repression targets of nr2f1b that are overlapped (Figure 1D). In addition, 23 of 108 (21%) and 23 of 89 (26%) are downregulated in isl2 and nr2f1b morphants, respectively (Figure 1E). The high percentage of overlapping targets suggests that nr2f1b and isl2 cooperatively regulate vascular development, likely in the same pathway. Functional analysis showed many genes involved in cell cycle regulation, signaling, transporter/channels, transcription, cell communication, and protein–protein interactions (Figure 1F). These functions are critical for the behavior of endothelial cells to form vessel networks [51,52].
Table 1. Genes that are up-regulated ≥2.5-fold in both isl2 MO and nr2f1b MO.
Genbank/Array IDGene Symbol aGene Nameisl2MO/wt bnr2f1bMO/wt b
AI943081 voltage-dependent calcium channel29.1023.72
BC151913.1 receptor activity14.1819.74
BC066689.1cpn1carboxypeptidase N, polypeptide 112.4010.85
ENSDART00000073432RBL2retinoblastoma-like protein 211.3111.88
ZV700S00000110casp8caspase 810.1510.17
ZV700S00000432lnx1ligand of numb-protein X19.909.92
ENSDART00000086206ATXN1ataxin-1/Spinocerebellar ataxia type 1 protein9.2312.45
ENSDART00000005808 calponin-1-like8.499.00
ZV700S00000355phlda3pleckstrin homology-like domain, family A, member 38.258.03
ENSDART00000016263 probable G-protein-coupled receptor-like7.503.21
OTTDART00000022443fstafollistatin a7.416.36
TC254361bbc3bcl2 binding component 36.846.68
OTTDART00000030315cdkn1acyclin-dependent kinase inhibitor 1A6.575.01
OTTDART00000021597ftr82finTRIM family, member 826.507.25
ENSDART00000097728 similar to neurotoxin/C596.495.68
OTTDART00000027213mdm2murine double minute 2 homolog6.488.07
OTTDART00000007800foxo3bforkhead box O3b Transcription factor6.387.35
ZV700S00006205RPS27Lribosomal protein S27-like protein5.744.68
OTTDART00000019467tp53tumor protein p535.745.44
BC072702.1cyp3a65cytochrome P450, family 3, subfamily A, polypeptide 655.615.60
OTTDART00000025224mmp2matrix metalloproteinase 25.225.99
ZV700S00003980gadd45aagrowth arrest and DNA-damage-inducible, alpha, a5.074.50
TC253576 Beta-1,3-glucosyltransferase-like5.054.12
ENSDART00000034197SUSD5Sushi domain-containing protein 54.804.91
ZV700S00006317igf2ainsulin-like growth factor 2a4.684.46
OTTDART00000007033fosv-fos FBJ murine osteosarcoma viral oncogene homolog4.544.82
BC056806.1gtpbp1lGTP-binding protein 1-like4.304.23
BM571671  protein p84.255.95
ENSDART00000081980 LAG1 homolog, ceramide synthase 5-like4.244.26
TC250557slc4a2asolute carrier family 4, anion exchanger, member 2a4.232.93
OTTDART00000007990cx32.2connexin 32.2/cell junction4.176.50
TC242899crfb1cytokine receptor family member b14.074.06
ENSDART00000097555PAPPAPappalysin-1 Precursor4.052.82
AW826461sept8bseptin 8b Septin-like protein3.983.29
ZV700S00005741pik3r1phosphoinositide-3-kinase regulatory subunit3.983.61
TC245426ect2epithelial-cell-transforming sequence 2 oncogene3.903.71
AI793818chrnglcholinergic receptor, nicotinic, gamma like3.903.75
NM_131862jag2jagged 23.864.95
TC238338otop1otopetrin 13.853.23
OTTDART00000029706 similar to vertebrate doublecortin domain-containing 2, DCDC23.783.53
OTTDART00000025192f2coagulation factor II, thrombin/(prothrombin)3.733.58
ZV700S00004623cdkal1CDK5 regulatory subunit-associated protein 1-like 13.722.89
OTTDART00000017384aqp12aquaporin 123.683.90
ZV700S00005526sesn3Sestrin 33.665.11
ZV700S00000935hdac4histone deacetylase 4 chromatin modification3.653.01
OTTDART00000010432ncl1nicalin3.523.28
ZV700S00003982rlbp1bretinaldehyde binding protein 1b3.423.09
ZV700S00003517rhoubras homolog gene family, member Ub3.373.18
ZV700S00000580ccng1cyclin G13.363.40
BI984278_R; BI984278taf1aTATA box binding protein (TBP)-associated factor3.322.70
OTTDART00000027172cry-dashcryptochrome DASH. (photolyase-like)3.263.53
ZV700S00000920phlda2pleckstrin homology-like domain, family A, member 23.253.02
TC249636C6complement component 63.232.78
BQ419558 nardilysin isoform b (N-arginine dibasic convertase)3.222.79
OTTDART00000030385qdpraquinoid dihydropteridine reductase3.202.70
ENSDART00000049419 jagged2-like3.183.93
ZV700S00004928rasl11bRAS-like, family 11, member B3.163.33
ZV700S00003200fabp1b.1Fatty acid binding protein 1b3.122.89
ENSDART00000059592MEP1BMeprin A beta3.123.17
ZV700S00002841scarb2scavenger receptor class B, member 22.723.40
BC053278.1itm2bbintegral membrane protein 2b2.683.14
BI980126SEC15L2SEC15-like 1 isoform a2.952.70
BC153975rpz5Rapunzel 52.904.01
BC064309.1tmem38atransmembrane protein 38A/cation channel transport activity2.802.56
ENSDART00000065340tlr9Toll-like receptor 9/innate immune response2.794.52
OTTDART00000017062 similar to vertebrate capicua homolog2.783.11
NM_001007784crygn1crystallin, gamma N12.723.33
ENSDART00000080490 similar to peroxidasin2.642.57
OTTDART00000025182slc38a3solute carrier family 38, member 32.542.71
NM_131156krt5keratin 52.542.68
a Genes shown in bold were confirmed independently by in situ hybridization in Figure 2. b Expression rations are the average of three independent microarray experiments.
Table 2. Genes down-regulated ≥2-fold in both isl2 MO and nr2f1b MO.
Genbank/Array IDGene Symbol aGene Nameisl2MO/wt bnr2f1bMO/wt b
ENSDART00000008778 extracellular-glutamate-gated ion channel activity 0.240.23
OTTDART00000007452eef1dbtranslation elongation factor-1, delta,b0.330.19
OTTDART00000028819nsdhlNAD(P) dependent steroid dehydrogenase-like 0.330.31
NM_213309stap2bsignal transducing adaptor family member 2b0.340.32
NM_001002580pmepa1prostate transmembrane protein, androgen-induced 1 0.360.37
ENSDART00000066927 N/A 0.370.41
BC085576dhrs13a.1oxidoreductase activity 0.370.39
NM_001082856rorbRAR-related orphan receptor B (NR1F2) 0.370.29
AL922441 N/A 0.370.38
CD605872_R DNA helicase B 0.380.37
ENSDART00000027268otpa orthopedia homolog a0.390.37
ENSDART00000074537shisa9bprotein shisa-9B0.390.30
ENSDART00000077671 similar to Aldehyde dehydrogenase 9 family, member A1 like 10.390.38
NM_001025174fam110b family with sequence similarity 110, member B0.420.42
TC246456 metallocarboxypeptidase activity0.420.29
ENSDART00000111589hapln1ahyaluronan and proteoglycan link protein 1a0.430.45
ENSDART00000097296 similar to alpha-2,3-sialyltransferase ST3Gal I-r2 0.430.36
ENSDART00000058866nesNestin0.430.36
CR545462WASF1similar to vertebrate WAS protein family, member 10.440.34
ZV700S00001176 ccn1cyclin I0.450.47
NM_001003834 top2a DNA topoisomerase (DNA) II alpha0.450.35
BC164898.1her4.1hairy-related 4.10.460.42
NM_205585sfrp1asecreted frizzled-related protein 1a0.460.43
a Genes shown in bold were confirmed independently by in situ hybridization in Figure 2. b Expression rations are the average of three independent microarray experiments.

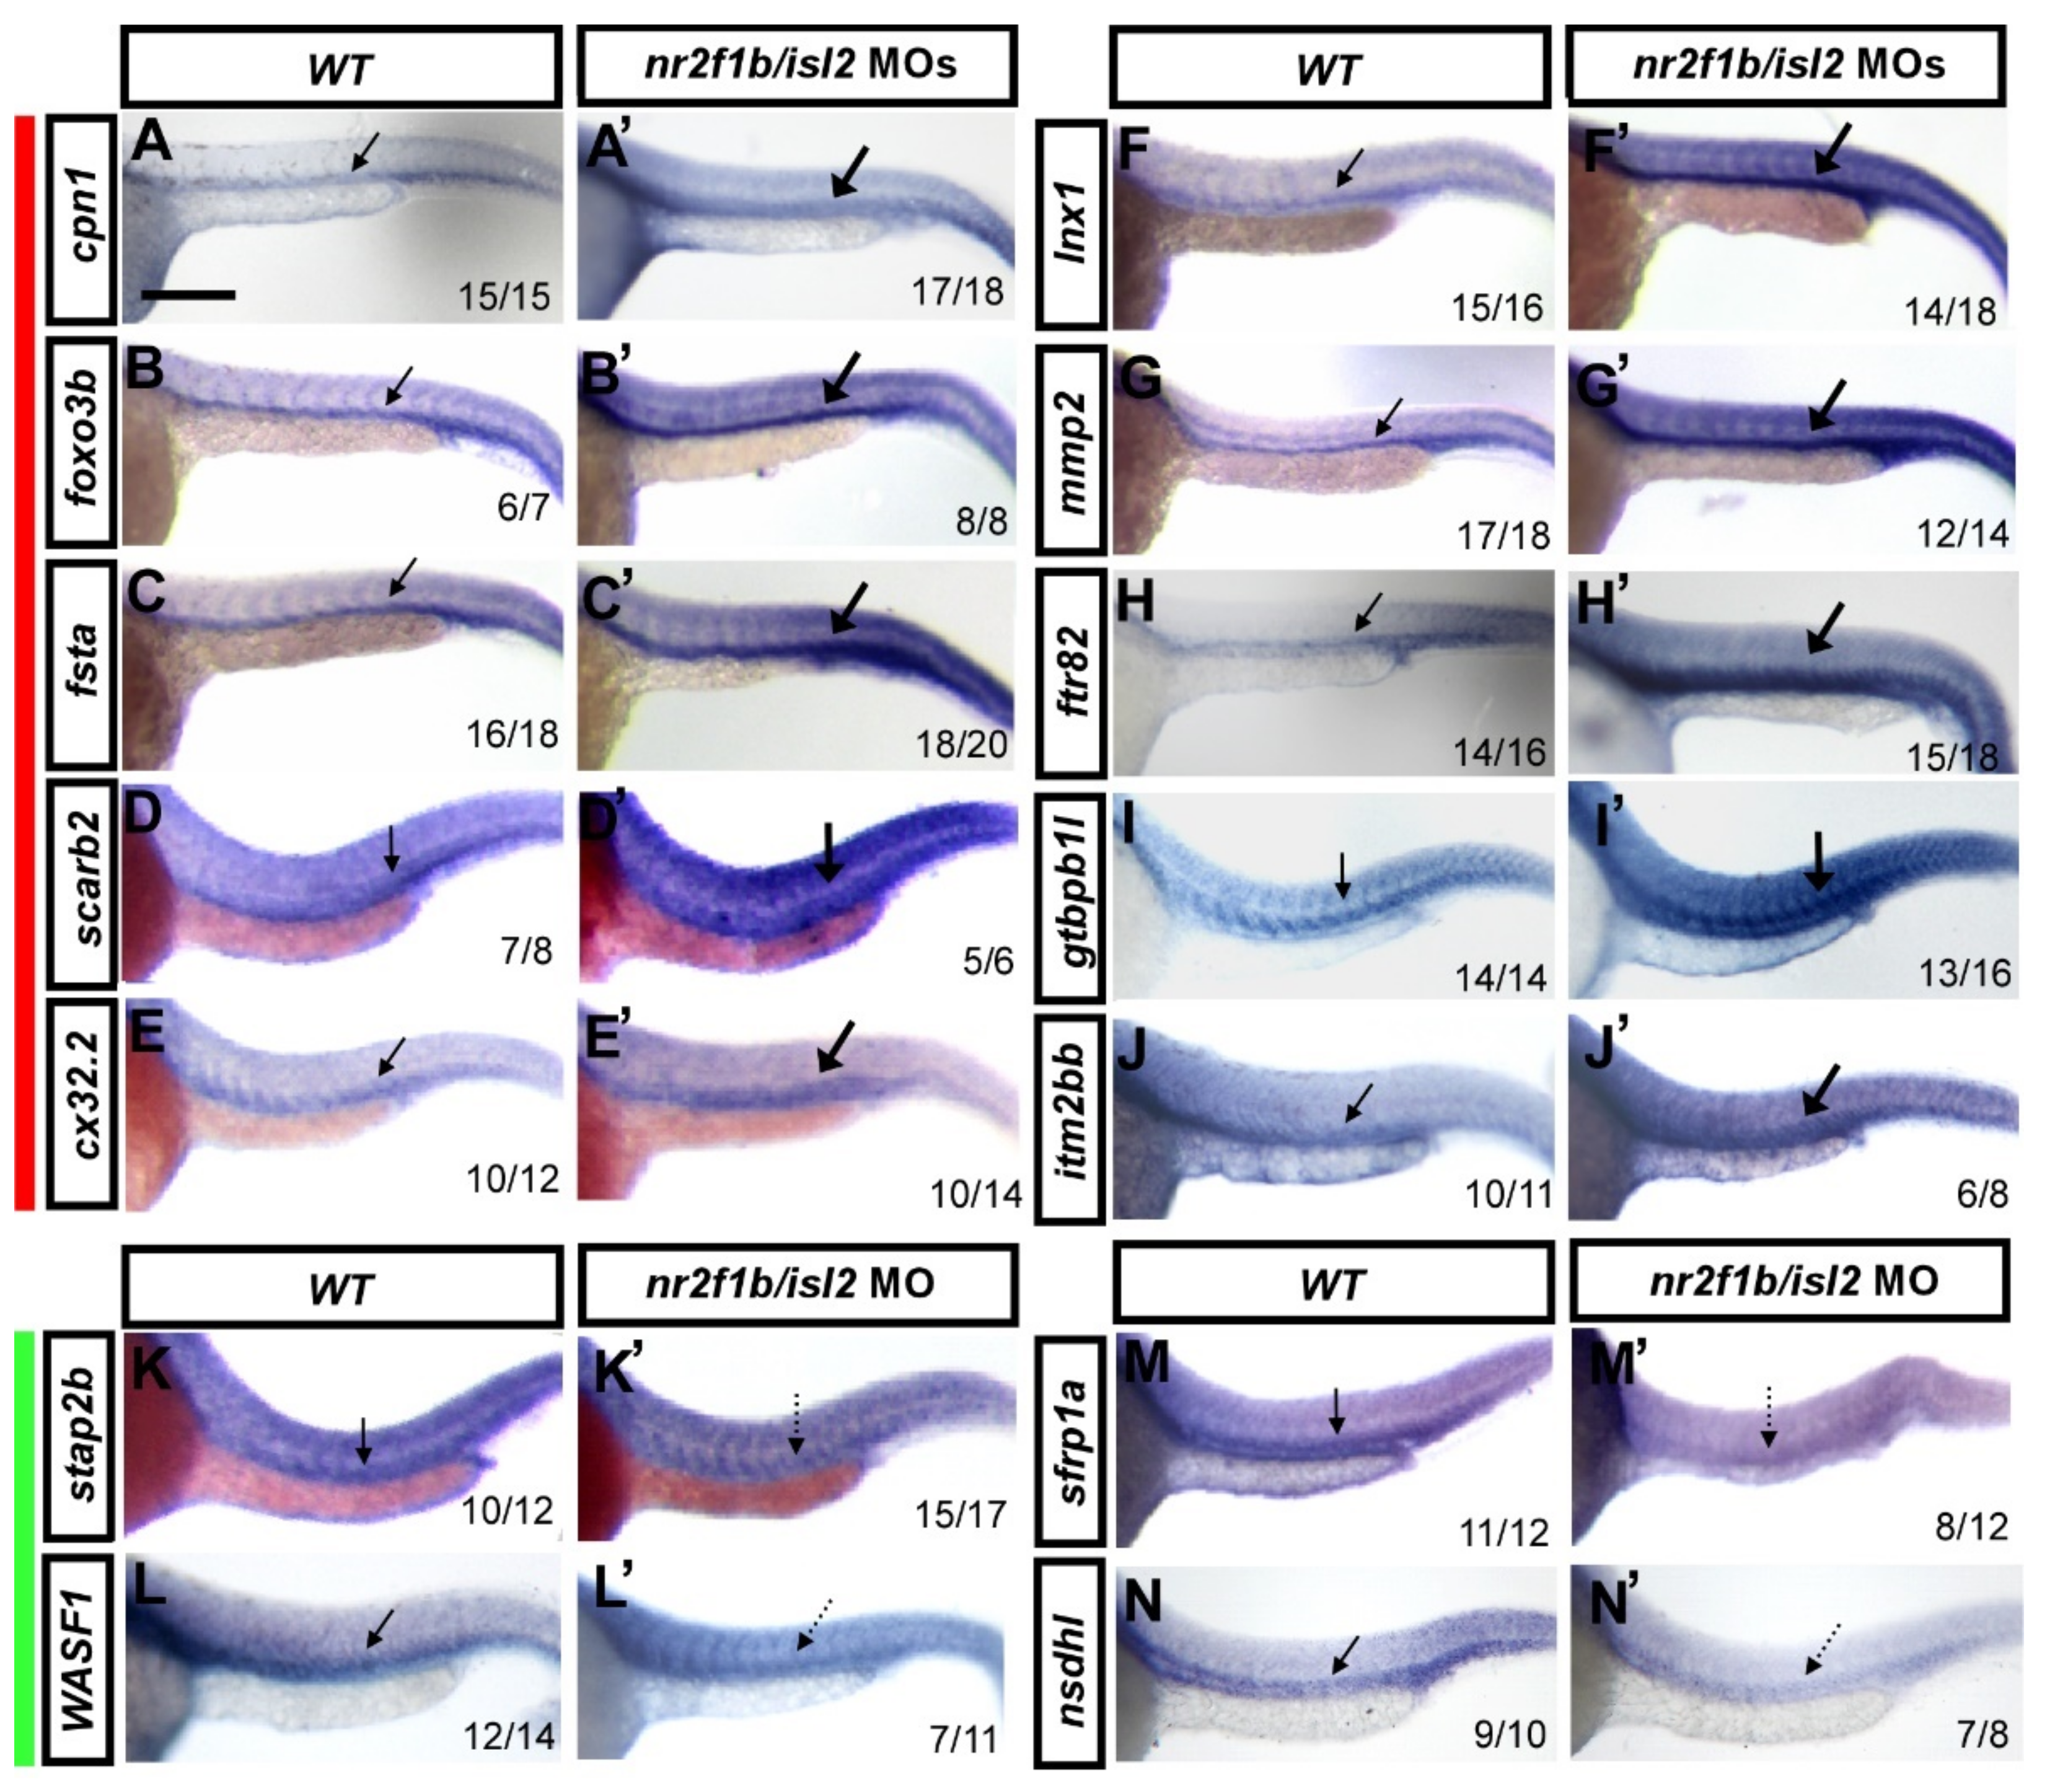
3.2. Verification of Expression Pattern of Several Potential Targets

The morpholino knockdown of isl2/nr2f1b increased the expression of genes identified by isl2 MO and nr2f1b MO transcriptome analysis. To independently validate expression changes of the most interesting genes, we verified whether the expression changes of the novel targets changed using whole-mount in situ hybridization at 24 hpf. We selectively analyzed ten up-regulated genes: cpn1, foxo3b, fsta, lnx1, mmp2, ftr82, cx32.2, gtpbp1l, scarb2, and itm2bb, and four down-regulated genes: stap2b, WASF1, nsdhl, and sfrp1a. Embryos were injected with a combination of isl2 and nr2f1b morpholinos (8 and 1.7 ng, respectively) and gene expressions were examined by in situ hybridization at 24 h post-fertilization. An increased expression of cpn1, foxo3b, fsta, scarb2, cx32.2, lnx1, mmp2, ftr82, gtpbp1l, and itm2bb was observed in the vasculature in isl2/ nr2f1b morphants (thick arrows) when compared to wild-type embryos (Figure 2A–J,A′–J′). A reduced expression of stap2b, WASF1, sfrp1a, and nsdhl in the vessels in isl2/nr2f1b morphants (dash arrows) was observed when compared to wild-type embryos (Figure 2K–N,K′–N′). This was consistent with the microarray results, which supports that the genes showed higher expression in uninjected wild-type embryos when compared to nr2f1b/isl2 knockdown fish. The data also show the expression of genes in the vessels, suggesting their function in vascularization.

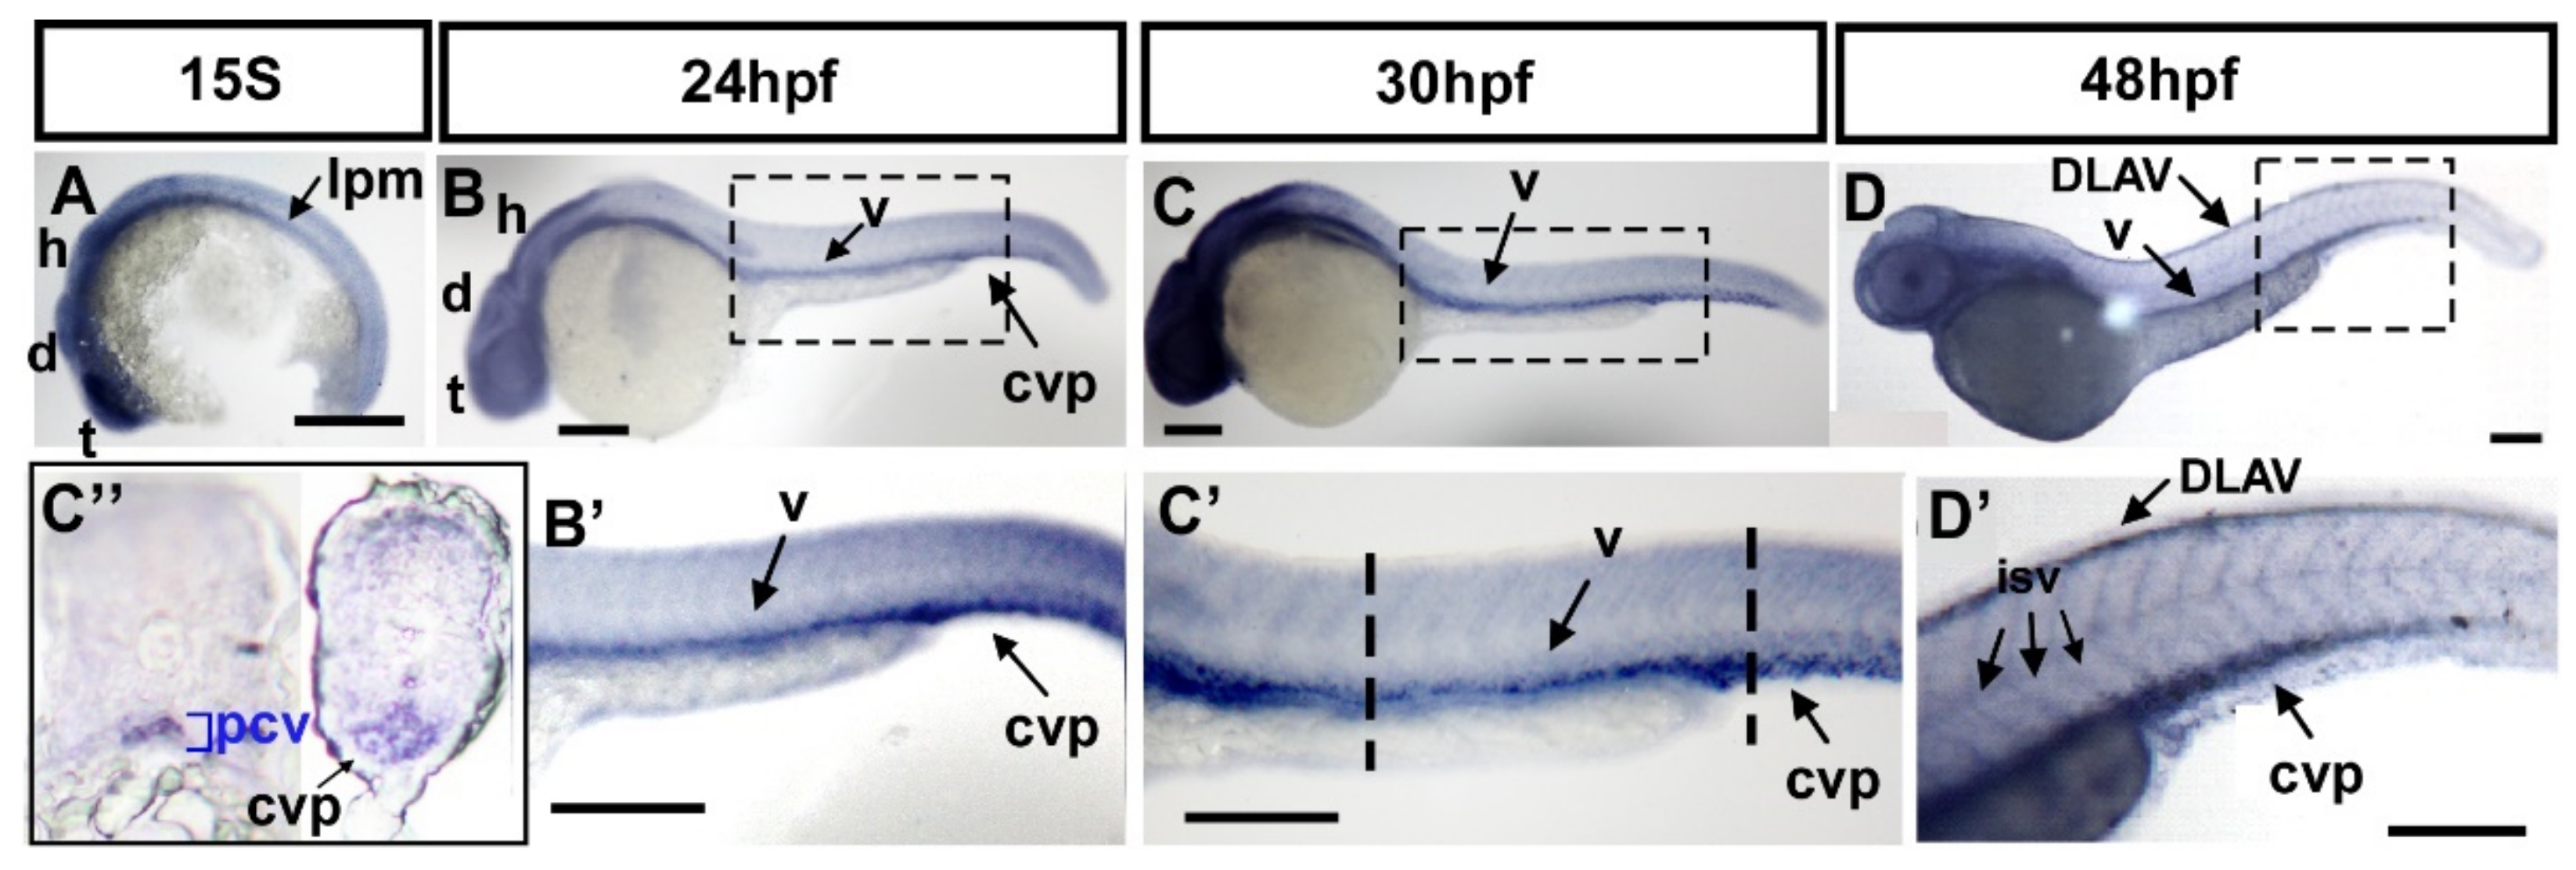
3.3. fsta Is Highly Conserved and Is Expressed in the Vasculature during Development

We selectively assayed the functional relevance of one potential target from the array data, fsta. Follistatin (Fst) is a known BMP antagonist related to axis formation during embryogenesis, and BMP signals have been shown to be important for angiogenesis, in order to form the CVP. However, no description of fsta functioning in vascular development is reported. We started to align follistatin amino acid sequences among vertebrates such as humans, mice, and zebrafish using ClustalW2 software. By comparing the amino acid sequences of zebrafish follistatin with orthologs from other species, a high percentage of conservation (>75%) of amino acids was shown (Supplementary Figure S1A,C). Zebrafish have a paralogous Fstb, which showed 79 and ~66% similarity to zFsta and mammalian FST, respectively. We also identified the putative TB ligand-binding domain (similarity = 95%), three F-like domains, and three Kazal-like domains (similarity = 98%), suggesting their role in protein–protein interaction (Supplementary Figure S1B). This information suggests the function of zebrafish Fsta has a similar function as mammalian FST.
To investigate the function of fsta in vascular formation, we first determined the expression of fsta by in situ hybridization during zebrafish development. fsta is expressed in the lateral plate mesoderm (lpm), and the head area of the telencephalon (t), diencephalon (d), and hindbrain (h) at the 15 somite stage (S) (Figure 3A). Expression of fsta at the lpm is consistent with the place of the developing vessels. At 24–30 hpf, fsta is expressed in the head region, as well as the vessels (v) of the trunk and the CVP (Figure 3B,C,B′,C′). At 48 hpf, fsta expression can be detected in the head, vessels (v), ISV, DLAV, and CVP (Figure 3D,D′). Transverse sections of 30 hpf fish embryos show that fsta is expressed in the posterior cardinal vein (PCV) and CVP (Figure 3C″). The data show the expression pattern of fsta in blood vessels during zebrafish embryogenesis and indicate that fsta plays a role in vascular development.

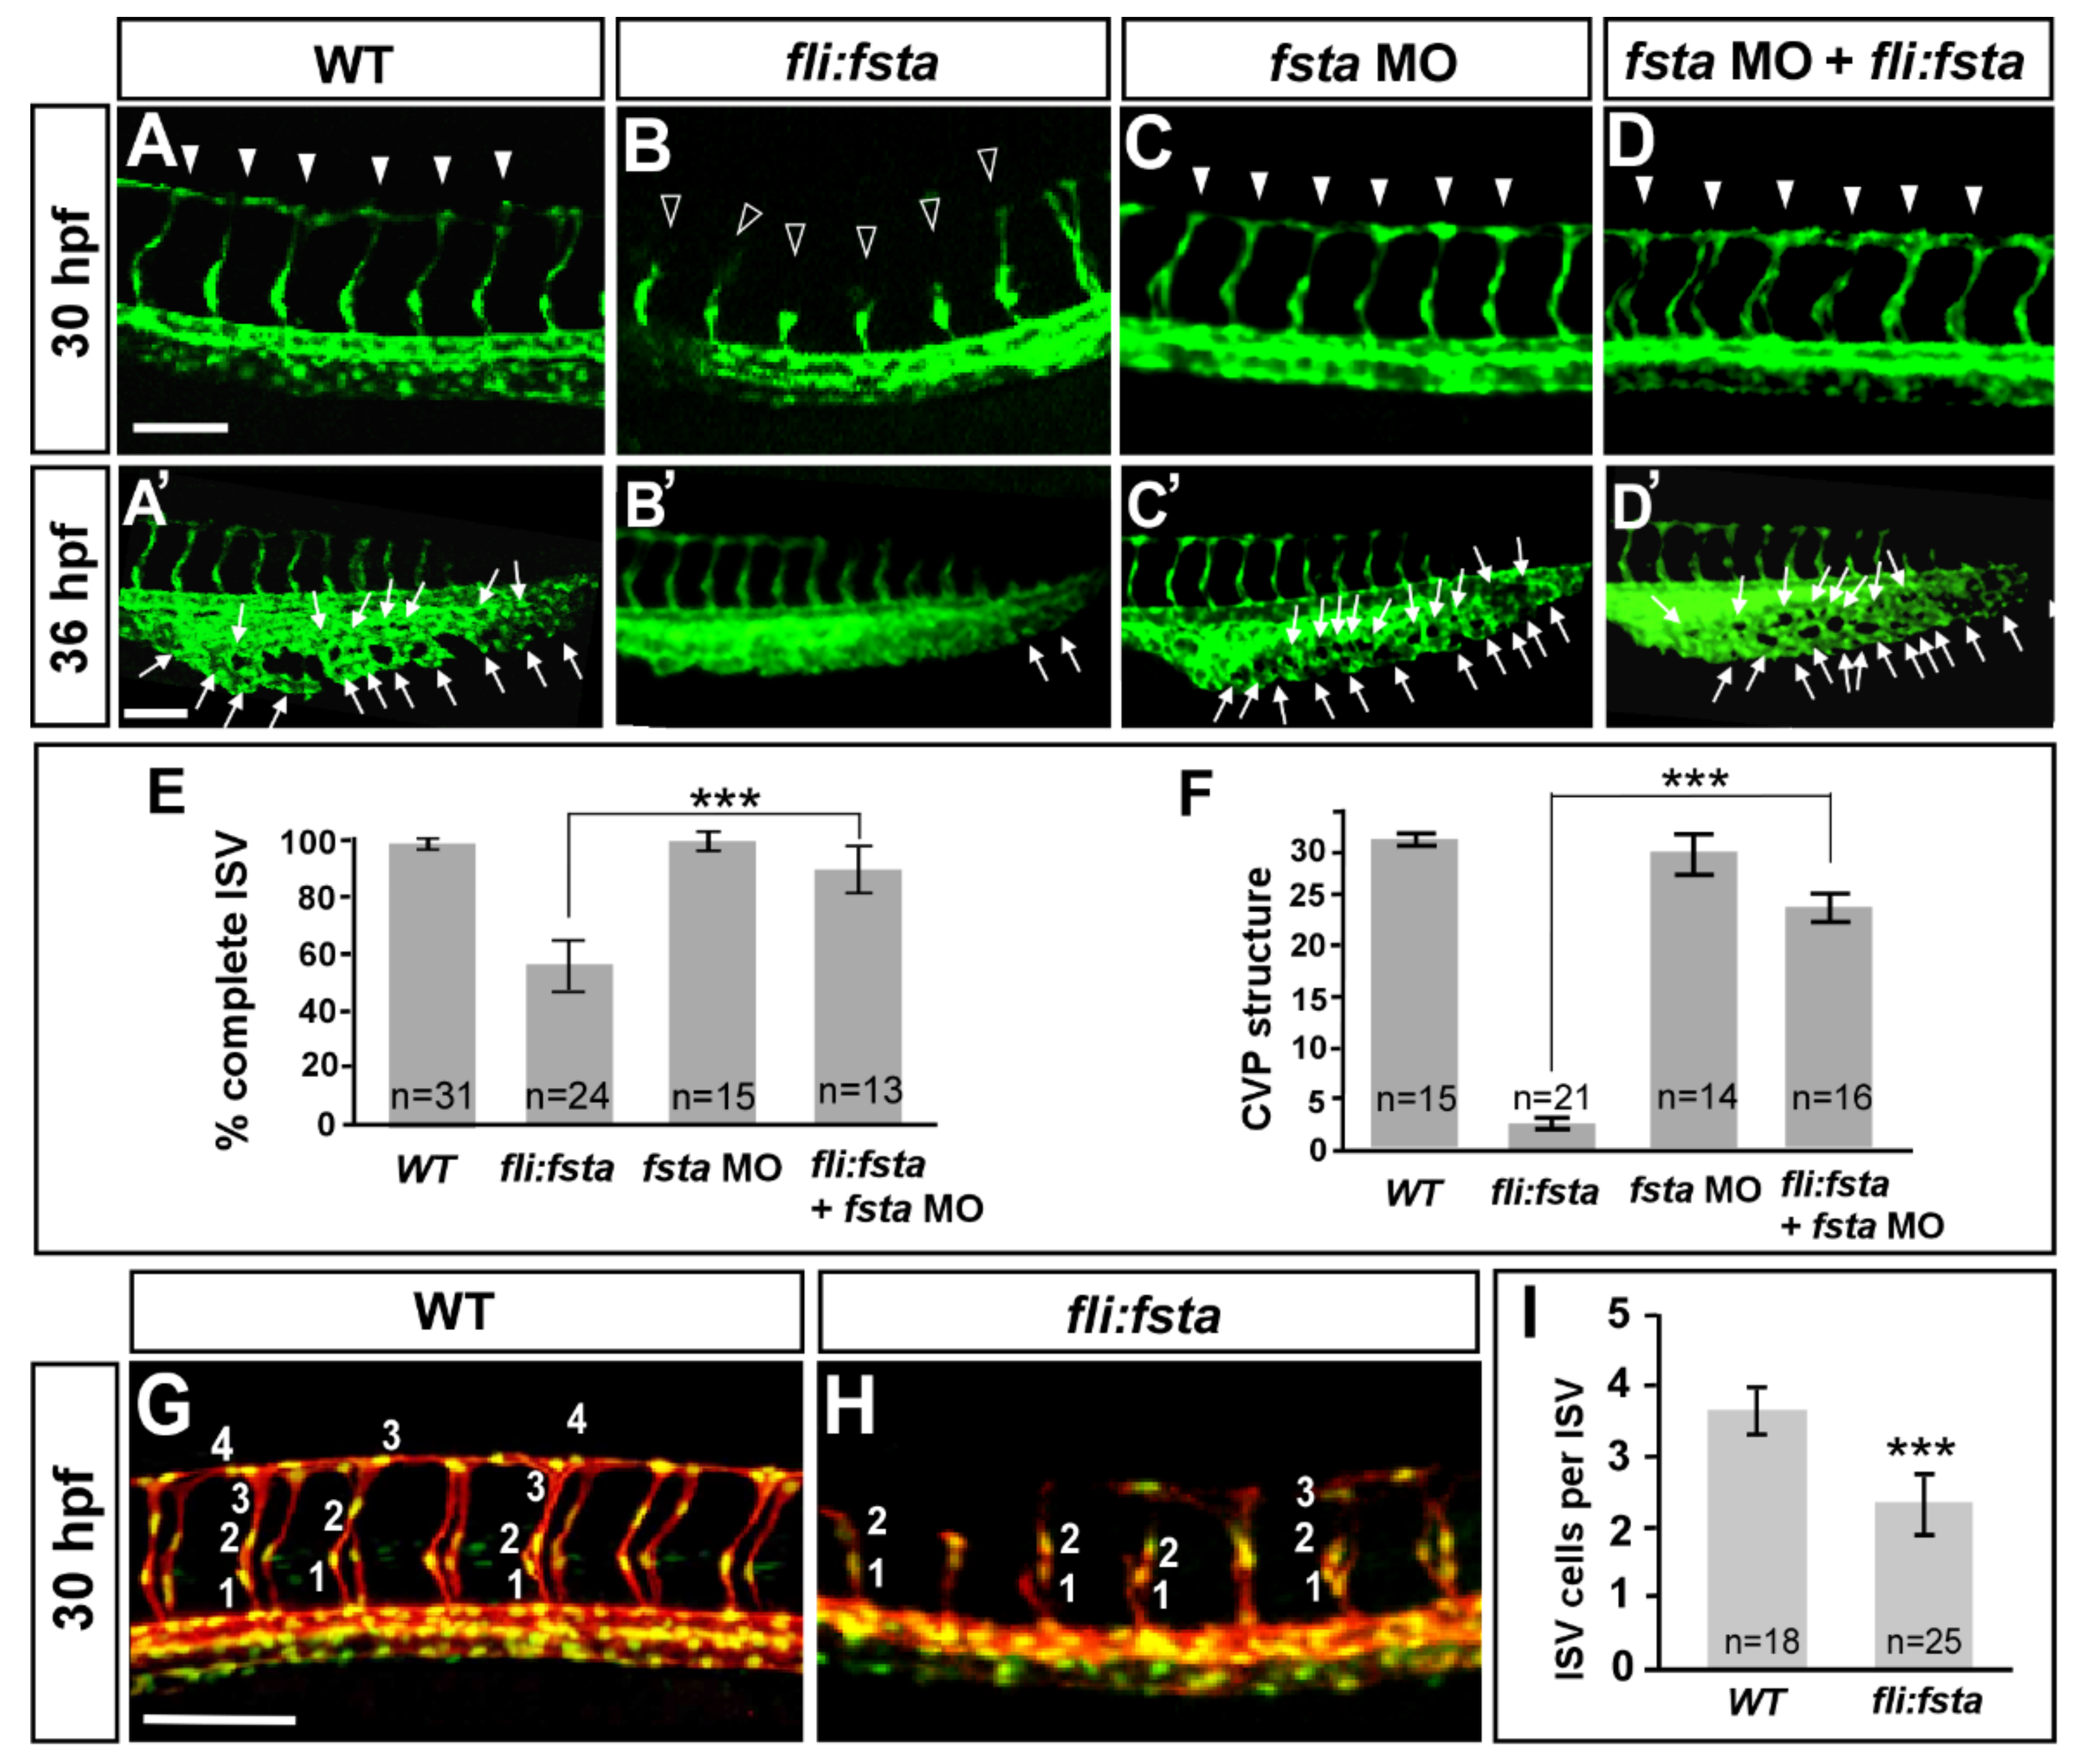
3.4. Overexpression of the fsta Gene Causes Defects in Vascular Development

We observed the increased expression of fsta during the knockdown of isl2/nr2f1b. Thus, we hypothesized that by overexpressing fsta in the embryos, we should see similar vascular defects as observed with the isl2/nr2f1b morphants. While overexpressing fsta by 200pg mRNA injection, we observed severe defects in axis formation and dorsalization (data not shown), which is consistent with the function of Fsta in dorsal–ventral formation [43]. Alternatively, we transiently overexpressed fsta in endothelial cells using the fli1 promoter. In this way, we observed the similar vascular defects as isl2 or nr2f1b morphants, including the uncompleted migration of ISV to the top of embryo (Figure 4B), the decreased number of ISV cells (Figure 4H), and reduced CVP loop formation via angiogenic sprouting and the fusion of endothelial cells (Figure 4B′). Specifically, at 30–36 hpf in the wt control, ISV reached the DLAV at the dorsal region of the embryo (Figure 4A) and the CVP formed loop structures at the tail (Figure 4A′). At the same stage, the overexpression of fsta driven by the fli promoter caused ~45% ISVs to stall at the mid-somite (Figure 4B, hollow arrowheads) and less/no honeycomb structure formation at CVP was observed (Figure 4B′). The knockdown of fsta by morpholino had no obvious defects on the vasculature (Figure 4C,C′), but rescued the defect of ISV stalling (solid arrowheads) about 30% of the time and restored the honeycomb structure ~8-fold at the CVP, which was significant (Figure 4D,D′). We also counted the numbers of endothelial cells per ISV in the Tg (kdrl:mCherryci5; fli1a:negfp y7) embryos and showed reduced ISV cells in (fli:fsta) fish (2.3 ± 0.4, n = 25 embryos) when compared to the wild-type control (3.7 ± 0.3, n = 18 embryos) (Figure 4G–I). Together, the overexpression of fsta phenocopying the loss of nr2f1b or isl2 (Figure 1B,C,B′,C′) is consistent with our hypothesis that fsta functions in vascular patterning, and is negatively regulated by nr2f1b and/or isl2.
The overexpression of fsta resulting in vascular growth defects suggests the impairment of endothelial cellular migration, proliferation, or an increase in cell death. Our data showed a reduced completion of the ISV structure and ISV cells, suggesting that fsta negatively regulates ISV cell growth to contribute to vascular development, likely by regulation of the proliferation or migration of the cells. In addition, we also examined if there is more cell death in (fli:fsta) embryos. We showed that vascular defects in the (fli:fsta) embryo were not the result from non-specific cell death, as there was no significant increase in apoptosis in the vessels with overexpressed fsta when compared to wild type embryos, as observed by Acridine orange staining and a TUNEL assay (Supplementary Figure S2).
Since edema and the blocking of circulation are common secondary effects of blood vessel impairment, we examined if these side effects occurred in the overexpressed fsta embryo. At 48–72 hpf, we found that the overexpression of fsta causes an increasing pericardial edema or circulation defects (Supplementary Figure S3A–F). The overexpression of fsta in transgenic Tg (gata1:dsRed)sd2 embryos with dsRed-labeled blood cells allowed us to observe the circulation. The overexpression of fsta embryos showed 60% circulation defects with slower blood flow in the arteries/veins and/or less-to-no circulation at the ISV/DLAV at 48 hpf when compared to wild-type fish (Supplementary Figure S3A–C). Embryos showed ~50% pericardial edema at 72 hpf (n = 20 in wt and n = 19 in (fli:fsta) embryos) (Supplementary Figure S3D–F). The data are correlated with vasculature defects in overexpressed fsta embryos.

3.5. Specificity of fsta Effects

We showed that the overexpression of fsta driven by fli1 promoter causes vascular defects. To test if any vascular phenotypes caused by loss of fsta, we knocked down fsta by using two different morpholinos, fstaATG MO and fstae3i3 MO. We showed that a loss of fsta does not show obvious vascular defects (Figure 4C,C′ and Supplementary Figure S4A–C) from the injection of 2 kinds of morpholinos, suggesting the loss of fsta expression caused by morpholino inhibition specifically. In addition, there was no significant increase in ISV completion and the CVP loop formation in fsta morphants, suggesting that the loss of fsta is not sufficient for ISV and CVP growth (Figure 4C,C′). To examine as to whether the morpholino knockdown is fsta-sequence-specific, we tested the efficiency of fstae3i3 morpholino knockdown. By RT-PCR analysis, we showed that the injection of 8.0 ng of fstae3i3 morpholino diminished the normal fragments of fsta completely (Supplementary Figure S4E), while the injection of a lower dosage 1.0 ng fsta morpholino showed a decreased expression of fsta, suggesting the morpholino knockdown is fsta-specific. To further confirm the specificity of our morpholino experiments, we performed rescue experiments by the knockdown of fsta in (fli:fsta) embryos. The reduced expression of fsta indeed rescued ISV stalling by 30% in (fli:fsta) fish when compared with overexpressed fsta embryos (Figure 4B,D,E). In addition, the injection of fsta morpholino restored the honeycomb-like structure in (fli:fsta) fish to 80% at the CVP when compared to the overexpressed fsta embryos (Figure 4B′,D′,F).

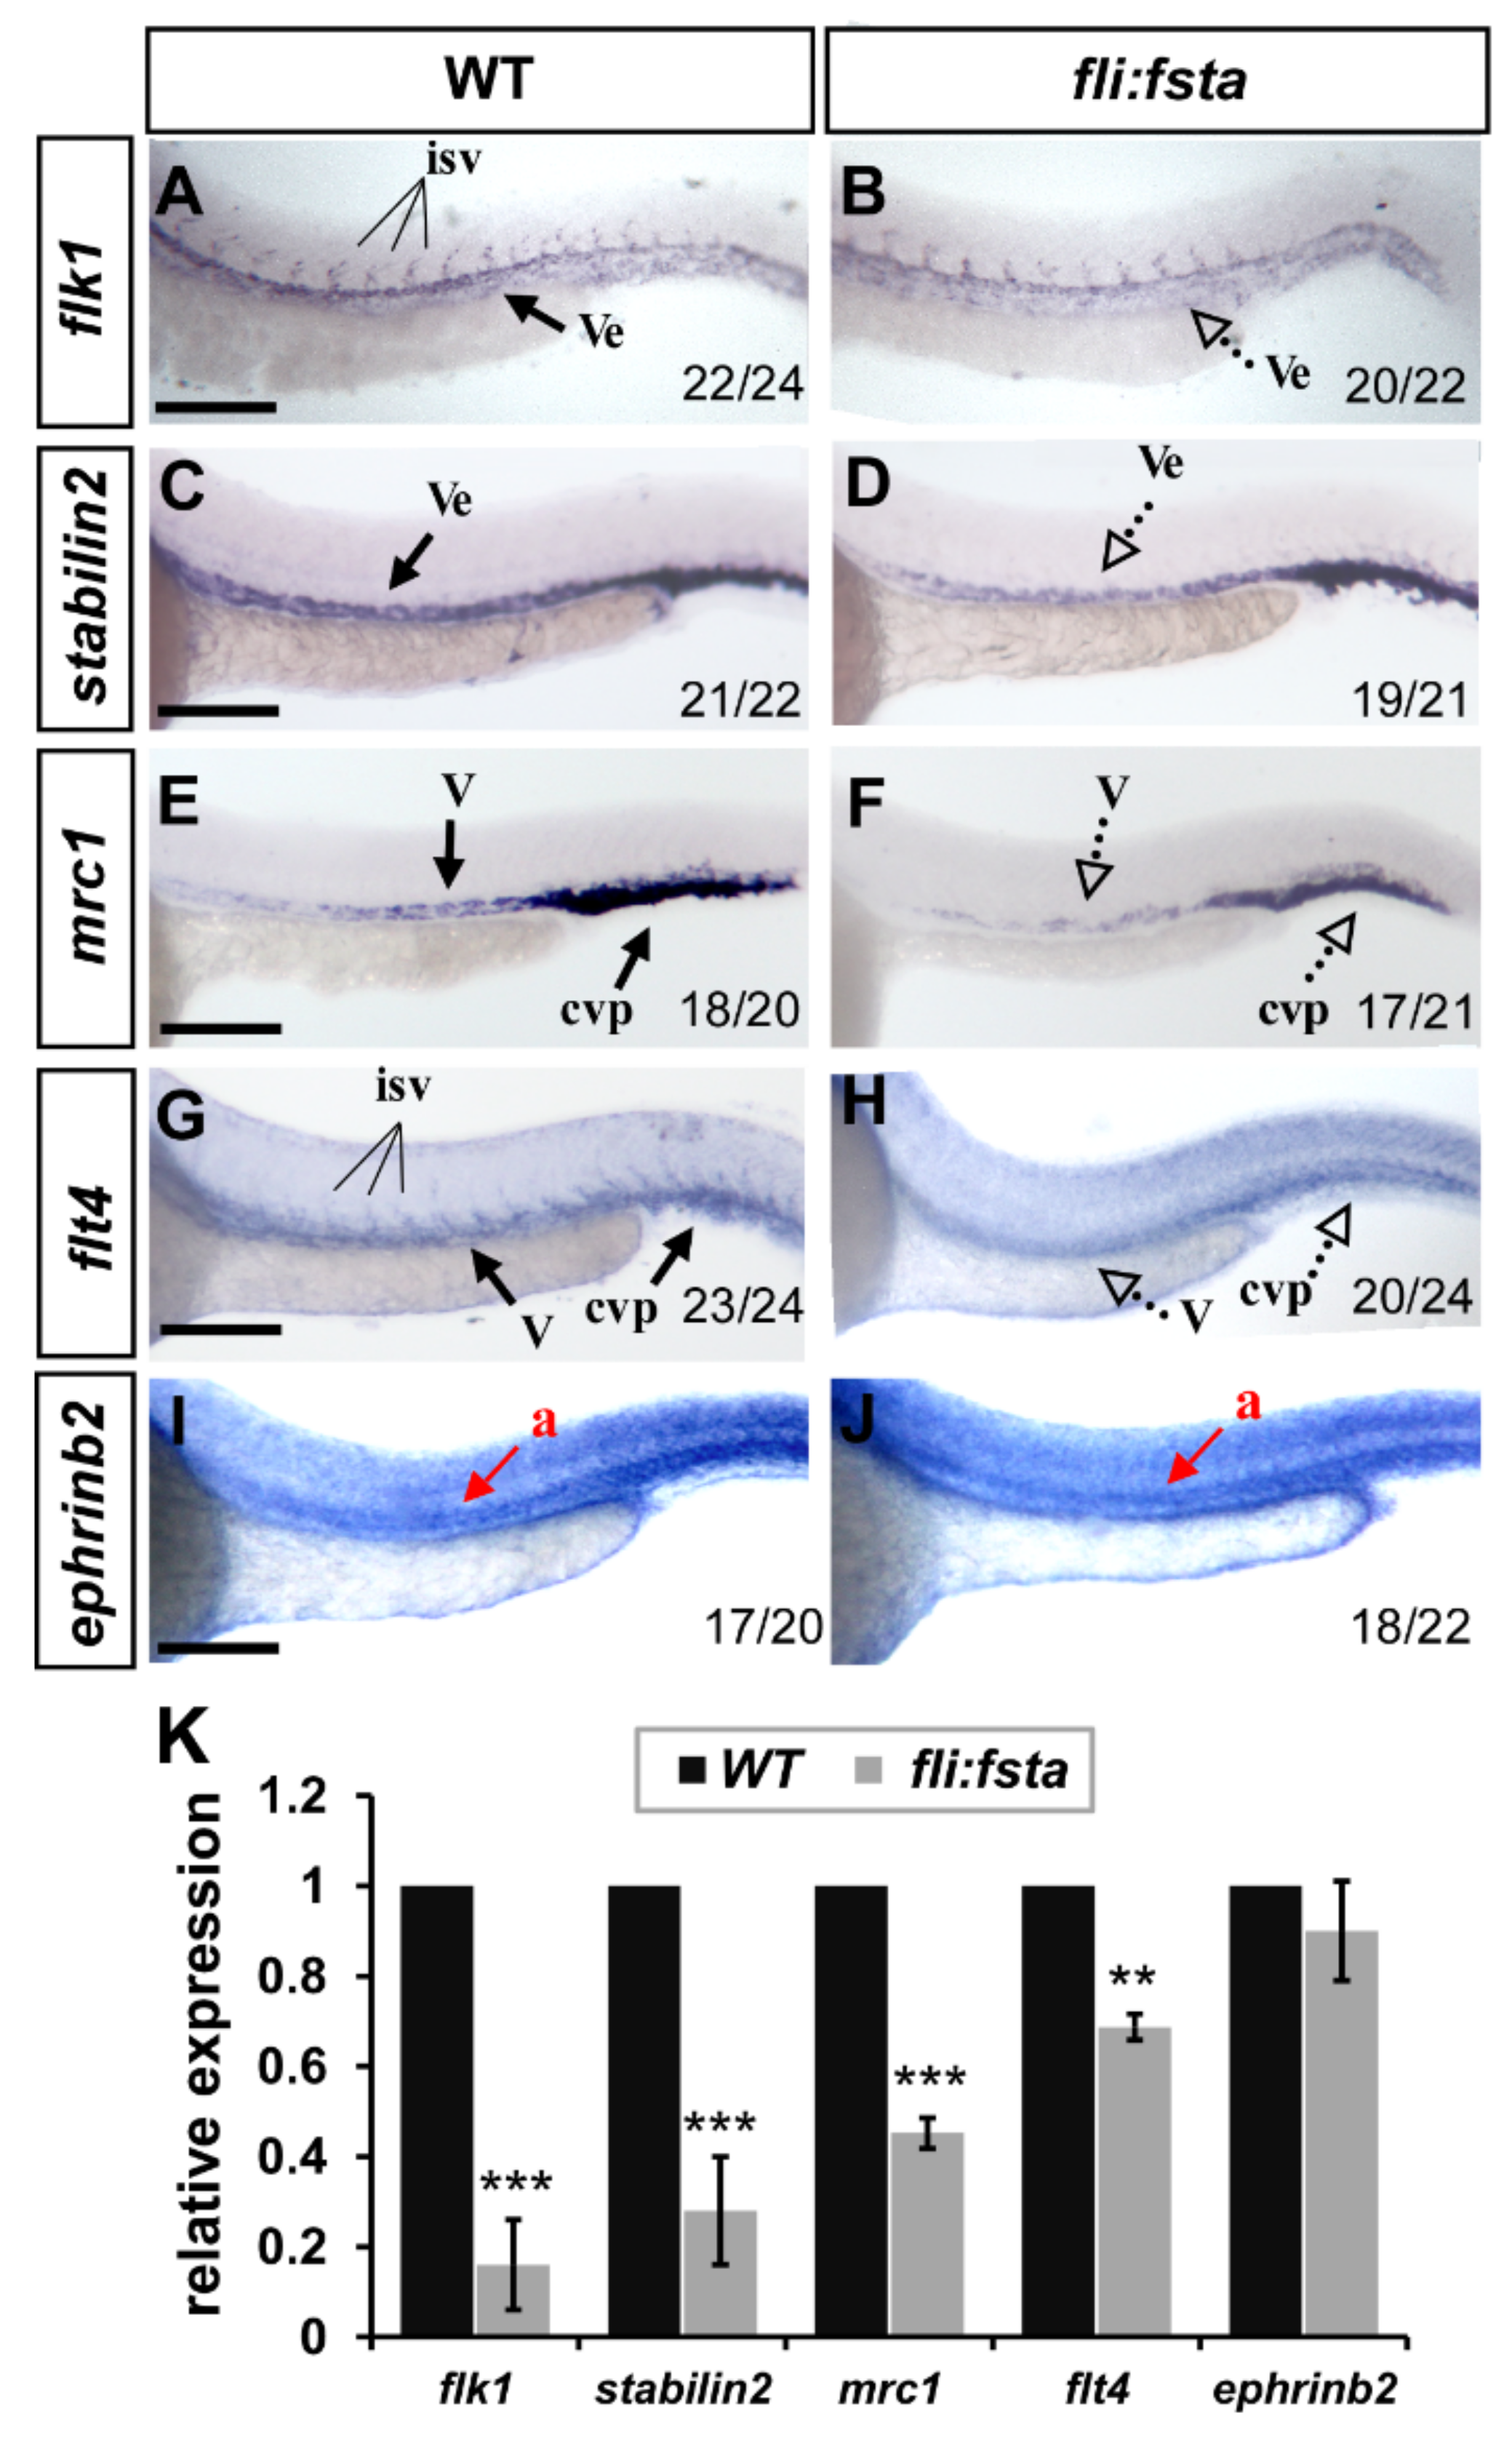
3.6. Overexpression of fsta Remodeled the Expression of Vascular Markers

The growth defects and mis-patterns of ISV and CVP in (fli:fsta) fish suggest that fsta is important for vessel formation and likely regulates vessel identity. To test this idea, we examined the expression levels of several vascular markers, including flk1, flt4, mrc1, stabilin2, and ephrinb2 by in situ hybridization and quantitative PCR. At 24 hpf, the expression of the pan-vascular markers flk1 and stabilin2 at the vessels and CVP were decreased in (fli:fsta)-overexpressing embryos; the expression of the venous/ISV markers flt4 and mrc1 was also reduced in overexpressed fsta fish when compared to the wild type controls. However, the expression level of the arterial marker ephrinb2 had not changed (Figure 5). The decreased level of the vascular marker expression was quantified by qPCR and was consistent with the changed expression in (fli:fsta) embryos (Figure 5K). These results suggest that the overexpression of fsta disrupts the expression of several vascular genes and impairs vessel formation.

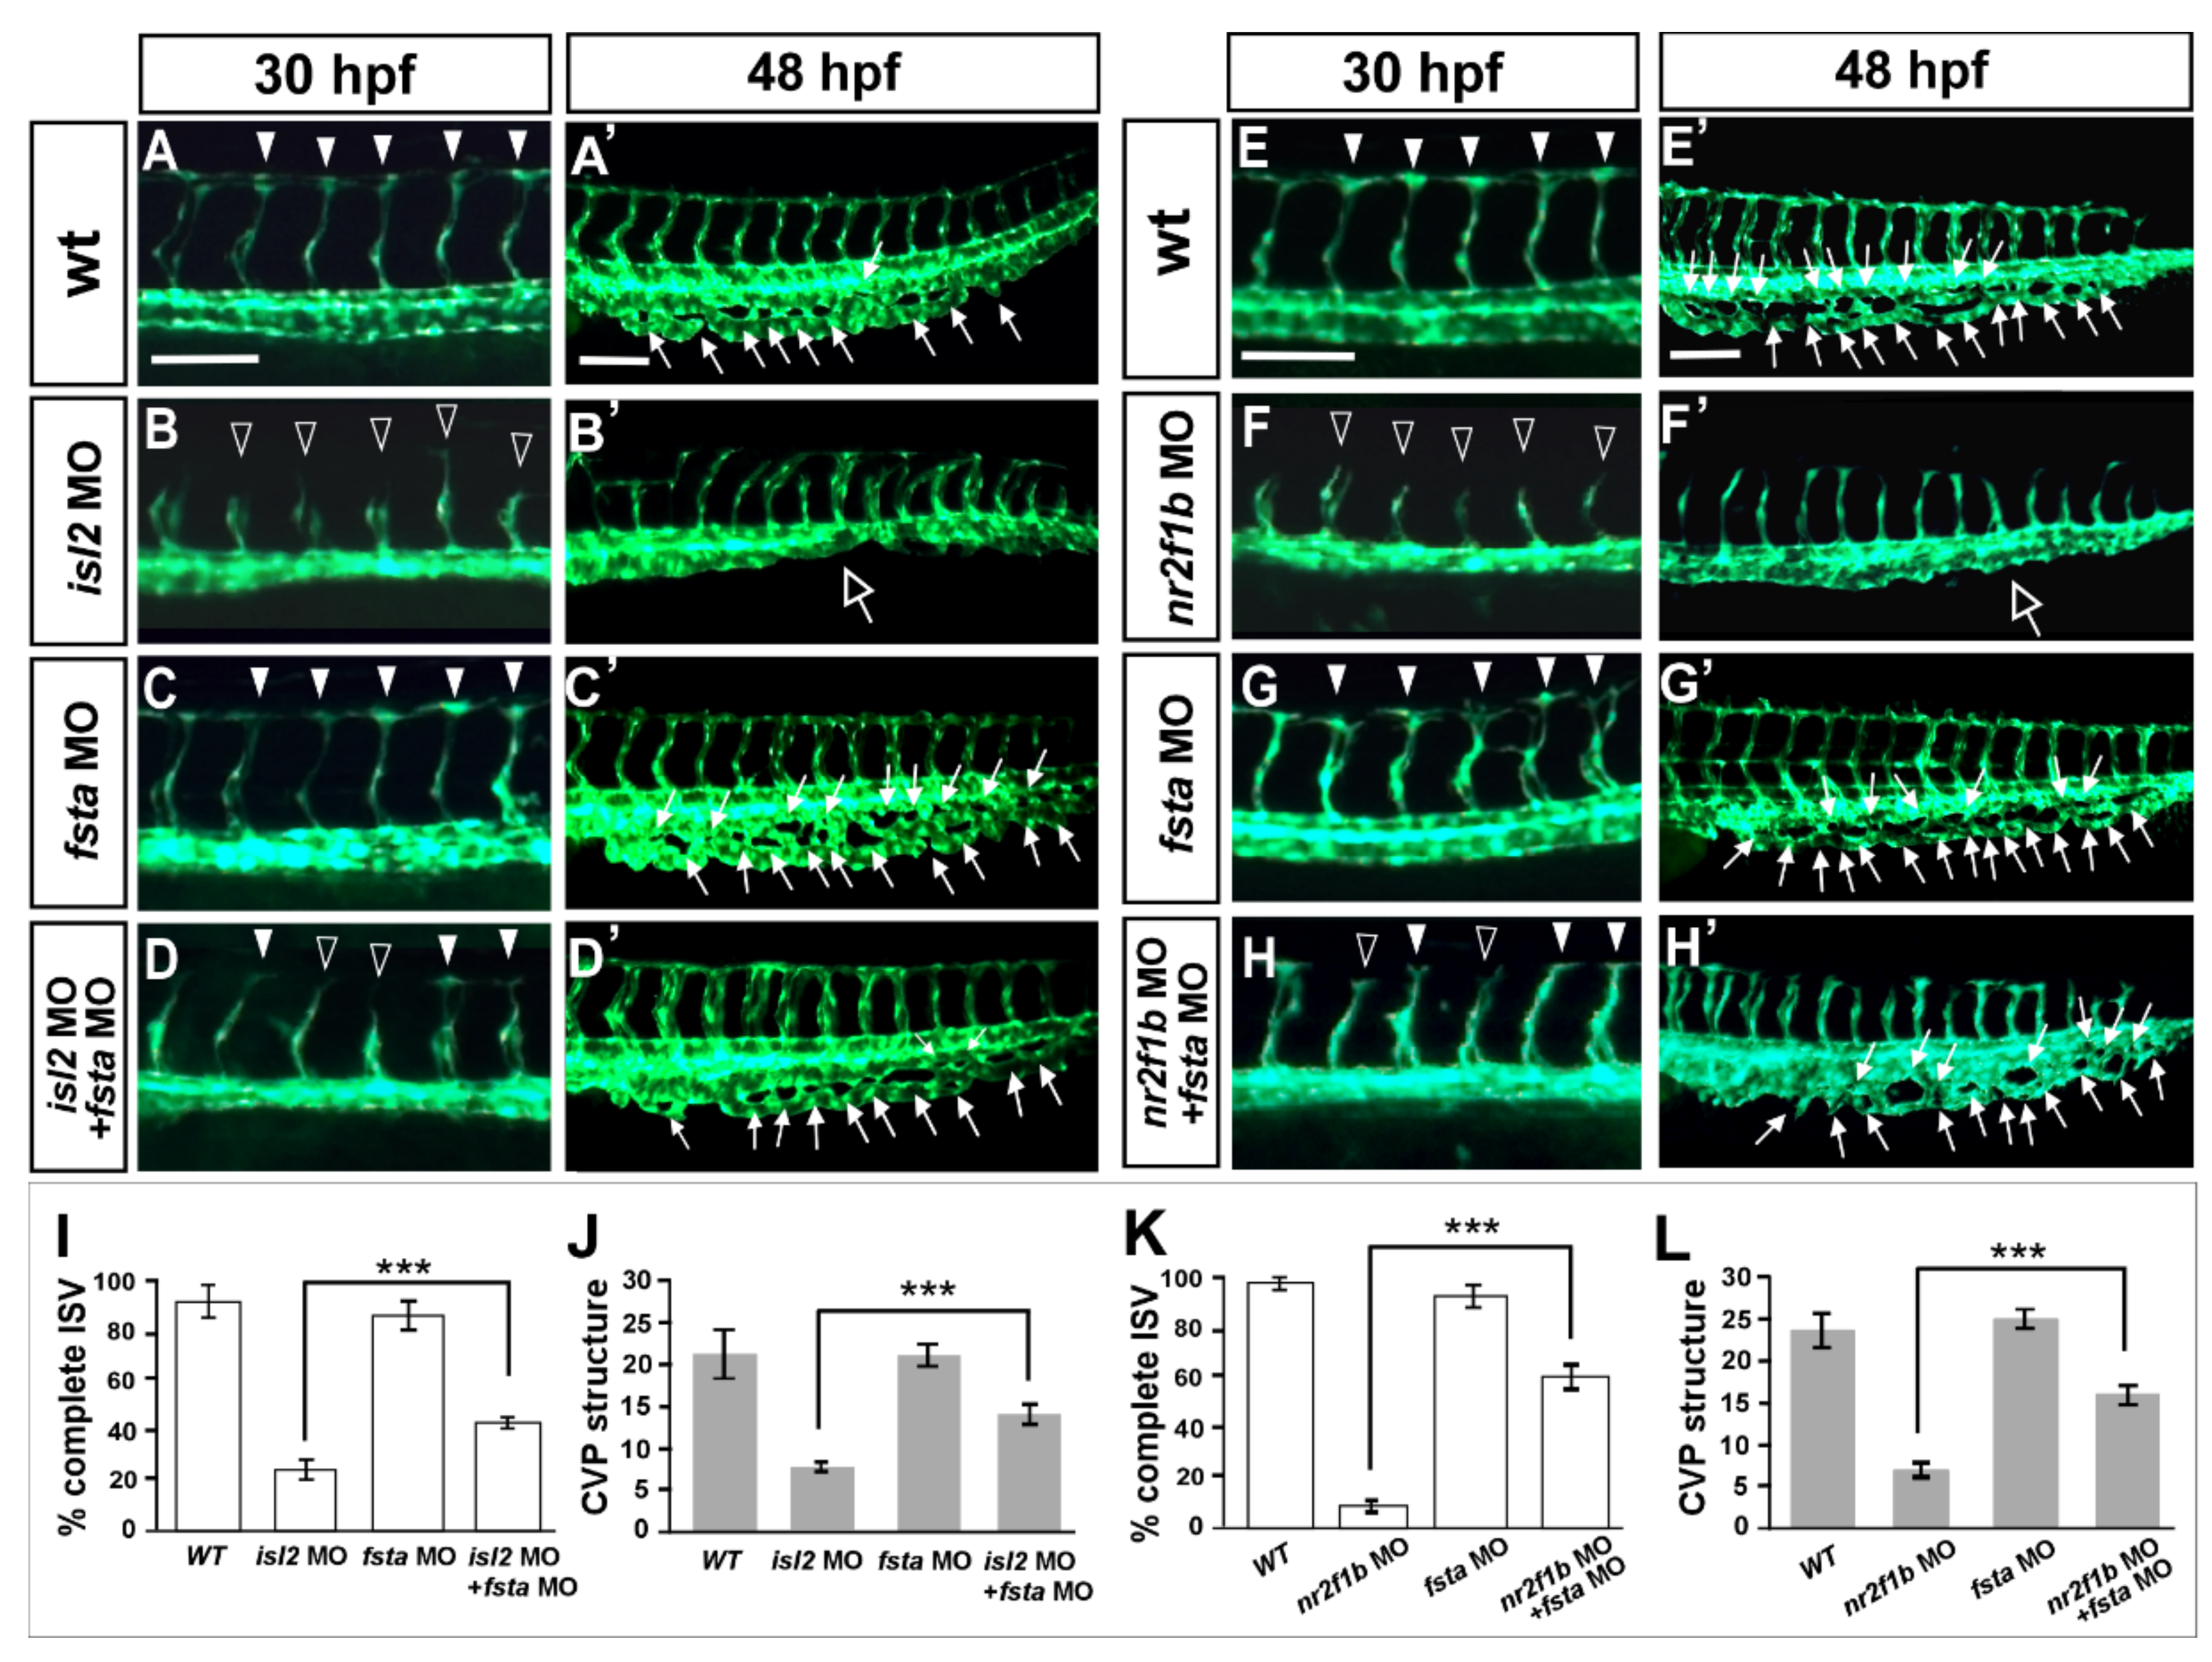
3.7. Knockdown of fsta Rescues the Vascular Defects in isl2 or nr2f1b Morphants

Overexpressing fsta gene phenocopy shows the loss of isl2/nr2f1b, which suggests that fsta is negatively regulated by isl2/nr2f1b. To confirm the genetic relation between fsta and isl2/nr2f1b, we hypothesized that if there was a reduction in the expression level of fsta in isl2 or nr2f1b morphants, we should see the rescue effects. Figure 6 shows that the loss of fsta does not cause obvious vascular defects (Figure 6C,C′), and the knockdown of isl2 shows growth defects in the ISV and CVP (Figure 6B,B′). The double knockdown of fsta and isl2 shows less ISV stalling and restored the CVP structure (Figure 6D,D′) when compared to the isl2 MO. Quantitative results showed the significant rescue effect of isl2 MO by fsta morpholino injection (Figure 6I,J). Similar rescue results and quantitative data are shown to restore vascular defects in nr2f1b morphants (Figure 6E–H,E′–H′,K,L). The data consistent were with our microarray results; isl2/nr2f1b negatively regulates fsta expression to control ISV/CVP development.

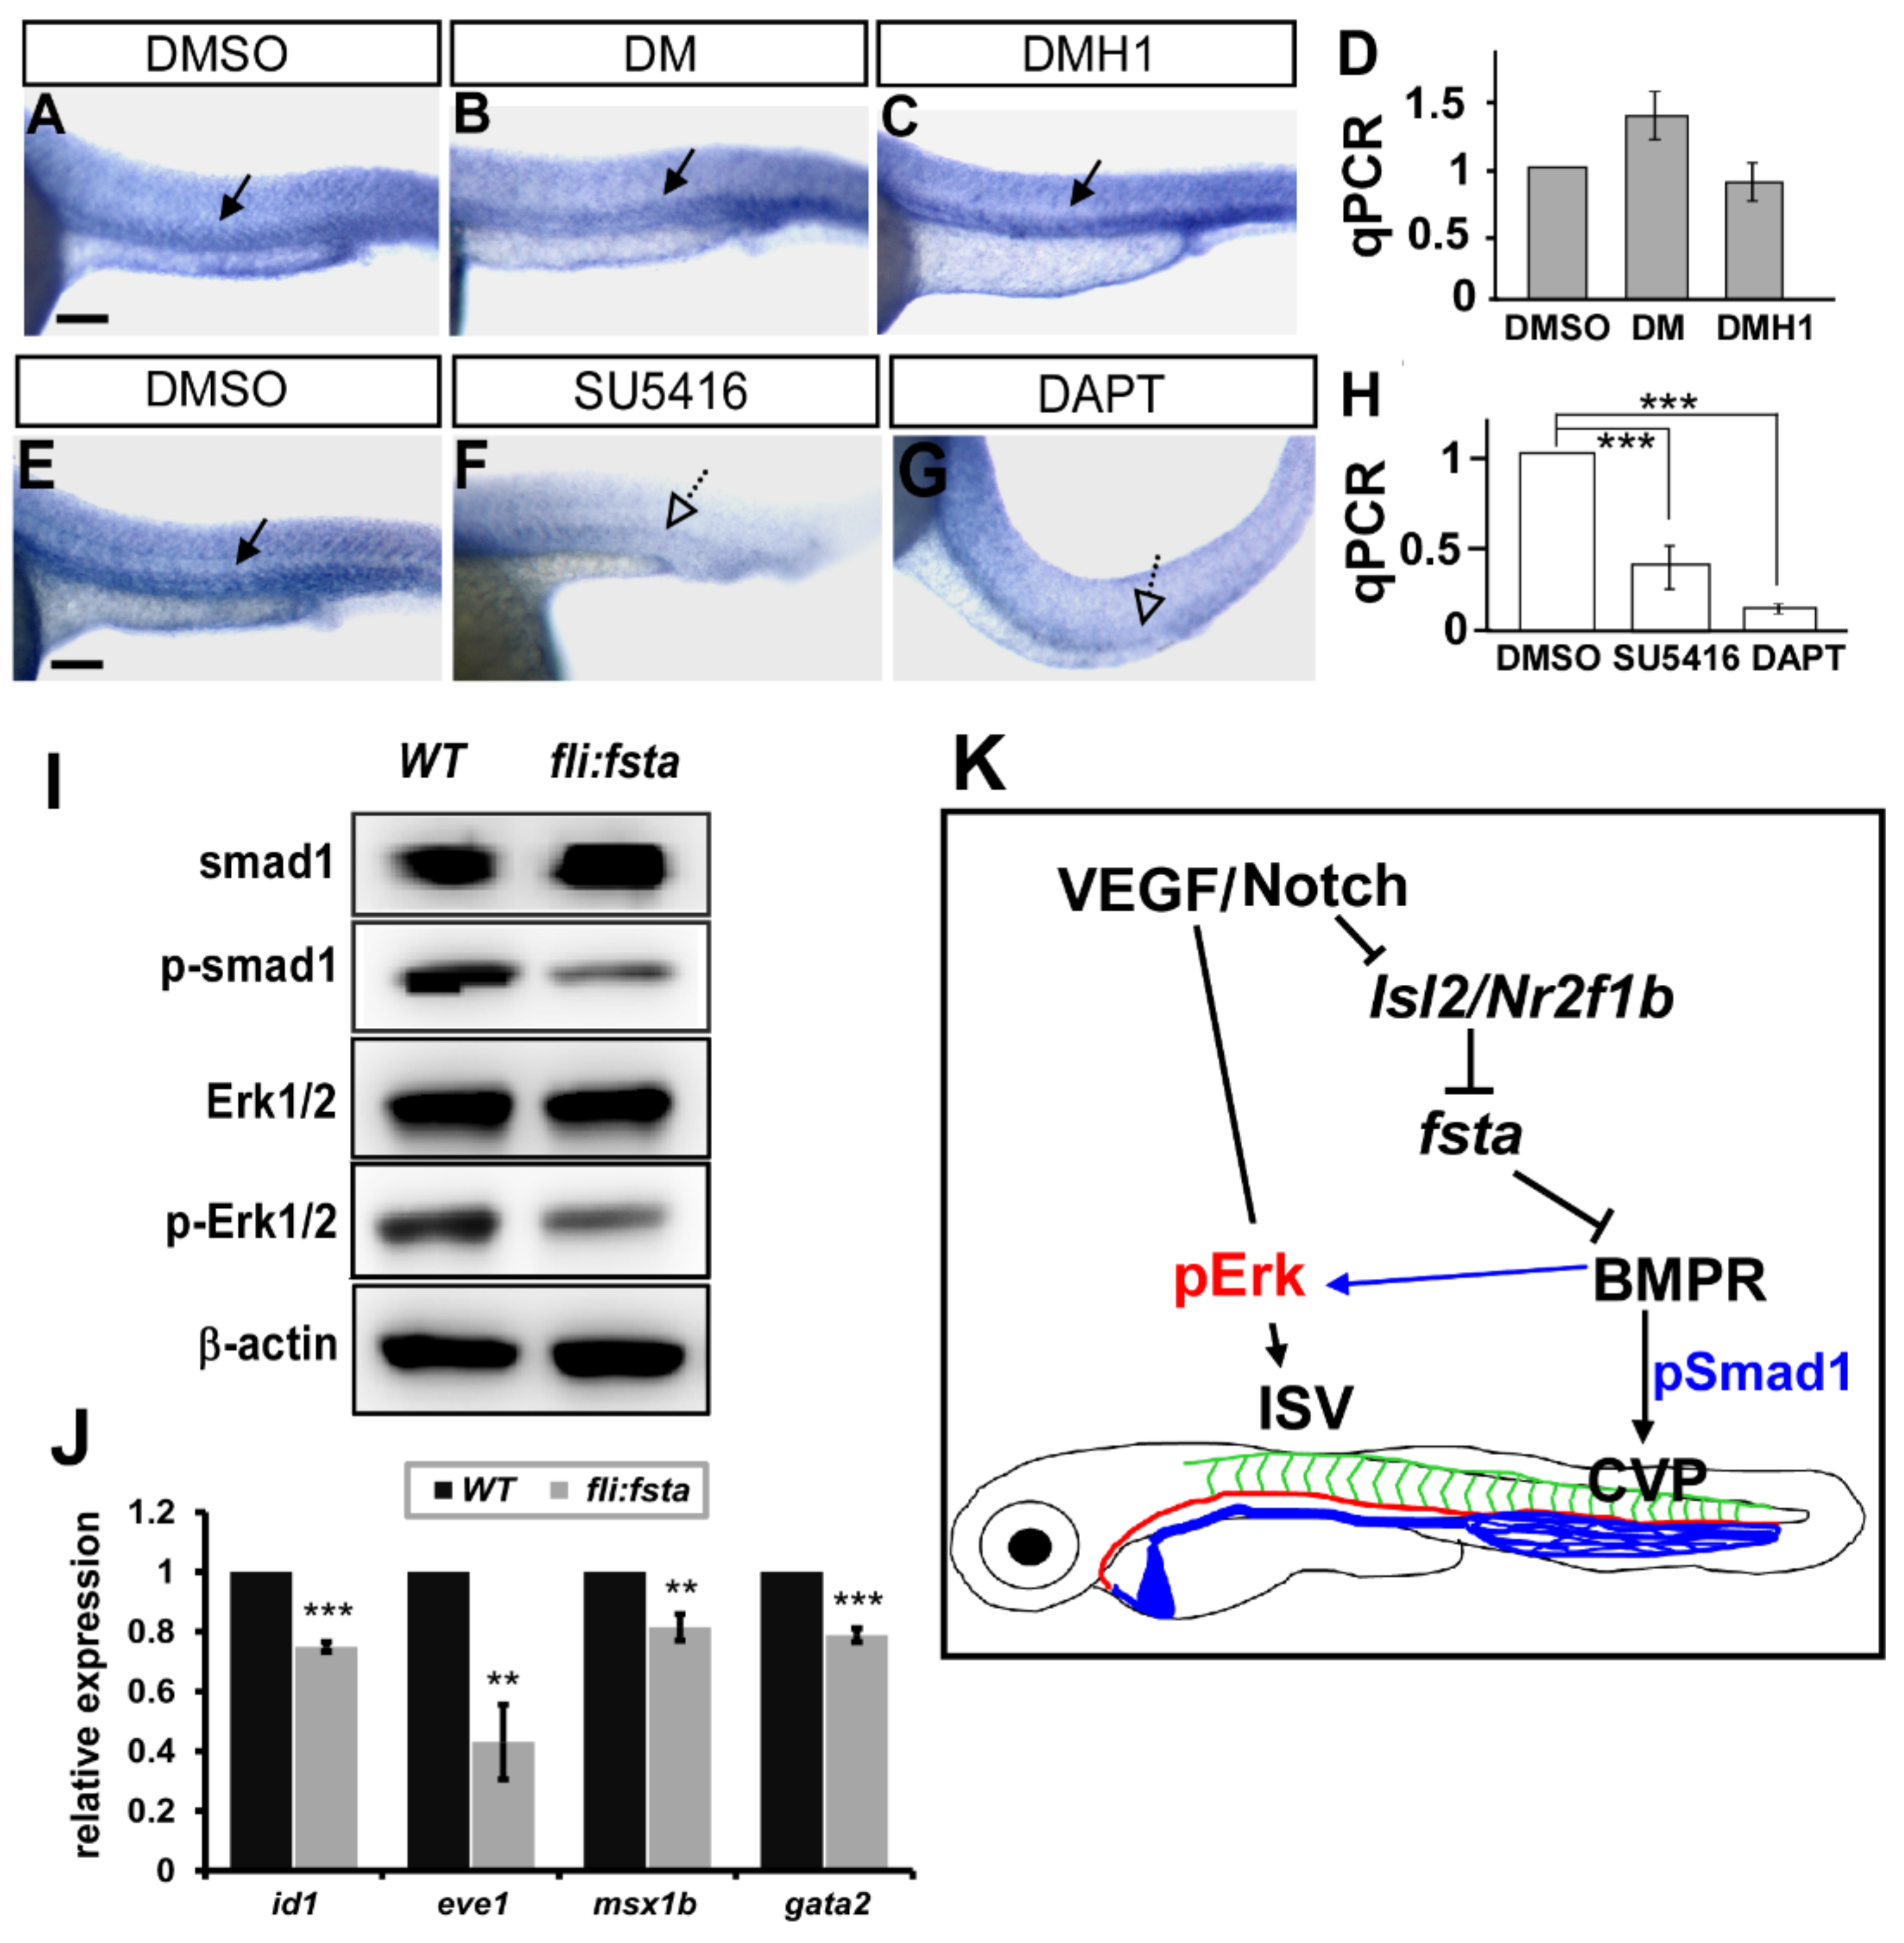
3.8. Follistatin a Regulates BMP Signals to Control Vascular Patterning

Vascular development in zebrafish is mainly mediated by VEGF/Notch and BMP signals. To reveal the genetic interaction between fsta and multiple signals, we analyzed the expression of fsta after the administration of chemicals. We inactivated Notch and VEGFR2 signaling by DAPT and SU5416 treatment, respectively, and showed that the expression of fsta is downregulated dramatically at the vessels and CVP (Figure 7E–H). The data suggest that a genetic interaction between fsta and VEGFR2–Notch signals exists. Fsta is a BMP antagonist related to axis formation during development, and BMP signaling has been shown to be involved in venous angiogenesis. To test whether Fsta regulates BMP signals to control vascular patterning, we used the small molecules DM or DMH1 to inhibit BMP signals. We showed that inhibition of BMP signals by DM or DMH1 treatments impaired the CVP structures similar to the (fli:fsta)-overexpressed embryos (data not shown). However, DM or DMH1 treatment did not reduce the expression of fsta in embryos (Figure 7A–D), suggesting it is upstream of the BMP signals. To test if overexpression of fsta disrupts BMP signals, we performed Western blot analysis to examine the signal molecules in the pathways. We showed the reduced phosphorylation level of SMAD1 and Erk1/2 in (fli:fsta) embryos (Figure 7I). Since BMP receptors also regulate ERK signals, our data suggest that fsta regulates CVP patterning via BMP–SMAD pathways and contributes to ISV growth mediated by BMP–ERK pathways (Figure 7J).

4. Discussion

The genetic networks that control vascular patterning during the development are not fully understood. We previously identified the transcription factors Isl2 and Nr2f1b, which are required for the specification of the vein and ISV growth, mediated by the Notch pathway in zebrafish. In this study, our microarray analysis suggested that nr2f1b and isl2 cooperatively regulate vascular development. We further analyzed the functional relevance of one potential target from array hits, fsta. We showed that fsta is highly conserved among vertebrates and its expression in developing vessels suggests its roles in the vasculature. We showed that fsta functions in vascular development downstream of isl2/nr2f1b, because of the following: a) overexpressing fsta in zebrafish embryos causes vascular defects in the growth of ISV and CVP, which mimics the phenotype of isl2/nr2f1b morphants; and b) the knockdown of fsta can partially rescue the vascular defects in isl2 or nr2f1b morphants. In addition, we showed that the vascular defects in (fli:fsta) embryos remodel the changed expression of vascular markers. Finally, our data indicated that Fsta–BMP signals control vascular patterning, mediated by the phosphorylation of SMAD and Erk. We conclude that Fsta–BMP signaling plays an important role in the regulation of vascular patterning, which interacts with isl2/nr2f1b and multiple signals. Our study also provides useful information for regulating networks in vascular development.
In this study, we used a genome-wide microarray analysis to identify potential gene functions in vascular development acting downstream of Isl2/Nr2f1b. We further characterized the role of fsta in the vasculature that has not been reported before, although many studies have shown that follistatin functions in skeletal muscle development and growth and even shows potential medical applications for muscle disorders. Our study demonstrated that isl2/nr2f1b regulates the growth of ISV and CVP formations, which are likely medicated by Fsta–BMP signals. Therefore, it may be possible to use fsta as a therapeutic agent in vascular-related diseases. Although our microarray suggests the expression changes of many genes in response to nr2f1b and/or isl2, whether they are regulated directly or indirectly by Isl2/Nr2f1b will be interesting to address. Promoter analysis of potential targets that contain Isl2 or Nr2f1b binding sites as well as luciferase analysis or chromatin immunoprecipitation (ChIP) are potential methods to examine whether those targets are controlled by Isl2/Nr2f1b directly.
Transcriptome analysis in zebrafish embryos has been shown as a powerful tool to identify many novel genes important for vascular development [53,54,55,56]. Our microarray strategies successfully allowed us to identify a genes’ potential function in the process of artery–vein specification and tip–stalk cell specification downstream of Isl2/Nr2f1b. In situ hybridization confirmed the expression pattern of several potential targets fsta, mmp2, foxo3b, lnx1, ftr82, cpn1, etc., in the vessels and suggests their role in the vasculature. Thus, many of the genes are novel and can be served as novel vascular markers and/or therapeutic targets. In addition to the characterization of fsta in this study, the Gtpbp1l (GTP-binding protein 1-like) gene encodes a putative GTPase and belongs to the GTP-binding protein superfamily. The deduced amino acid sequence exhibited the highest overall homology with human GTPBP1 [57]. GTPases are key proteins in many critical biological processes, including hormonal and sensory signals, ribosomal protein synthesis, cytoskeletal organization, and signal transduction cascades and motility [58]. Small GTPase Rap1 has been shown to promote VEGFR2 activation and angiogenesis [59]. Rho guanine exchange factors have reported functions in angiogenesis and the vasculature [60]. However, GTPBP groups are not known to function in vessels.
Mmp2 is a known metalloprotease involved in extracellular matrix integrity, which is important for angiogenesis and cell migration. In addition, Mmp2 acts to degrade collagen type IV and permits cell migration through tissues [61,62]. Interestingly, it has been shown that Mmp2 controls branching morphogenesis, mediated by FGF signaling [63], which extends our understanding of pathway networks in angiogenesis. Foxo3b (forkhead box O3b transcription factor) has been shown to function in angiogenesis and postnatal neovascularization by the inhibition of eNOs [64]. Cpn1-encoded carboxypeptidase N1 has been shown important for zebrafish liver development [65]. In addition, Davis et. al. showed carboxypeptidase N as an enzyme that is responsible for the C-terminal cleavage of SDF-1a (stromal cell-derived factor-1alpha) in circulation, which is important for hematopoiesis, lymphocyte homing, pre-B-cell growth, and angiogenesis [66]. Lnx1 is named as a ligand of numb-protein X1, and has been reported as an E3 ubiquitin ligase. The disruption of tfigurhe ligand of numb protein X expression can promote a TGF-β-induced epithelial-to-mesenchymal transition of epithelial cells [67], but no vascular functions have been reported yet. It is noteworthy that some interesting targets or their related family members shown in this list have recently been identified as being functional in the vascular development, such as mmp2, aqu12, foxo3b, cdkn1a, pik3r1, hdac4, igf2, halpn1b, etc., [68,69], suggesting that those target genes regulated by Isl2 and/or Nr2f1b are promising target genes that are important for vascular development.
Thus, our data provide useful information for the networks that regulate vascular development. Our data suggest that many novel genes, such as fsta, lnx1, ftr82, itm2bb, gtpbpl1, cpn1, stap2b, etc., have potential vascular functions that have not been previously described. In addition, many interesting signal pathways likely involved in those process have not been fully documented, such as PI3K/Akt signals, BMP signals, Wnt signals, and GTPase signals. Thus, our study expands the vascular fields of ISV and CVP patterning, as well as vein and tip identity.

5. Conclusions

We aimed to identify the potential downstream targets of Islet2 and Nr2f1b transcription factors, which are essential for vascular development. By employing microarray strategies, genetic manipulation, and biochemical assays in transgenic zebrafish, we have characterized the novel role of the follistatin a (fsta) gene for vessel formation downstream of isl2/nr2f1b. Besides, we revealed that Isl2/Nr2f1b regulate ISV growth and CVP formation medicated by Fsta–BMP signaling. To our knowledge, the novel function of fsta in the genetic network during vascular development has never been explored. Understanding the molecular mechanisms underlying the isl2/nr2f1b–mediated control of vascular development will also assist in the discovery of novel biomarkers and/or therapeutic targets for vascular diseases.

Supplementary Materials

The following supporting information be downloaded at: https://www.mdpi.com/article/10.3390/biomedicines10061261/s1, Table S1: Primer sequences for qPCR experiments; Table S2: Primer sequences used to generate in-situ hybridization probes; Figure S1: Sequence comparison and analysis of Fsta protein; Figure S2: Vascular defects in fsta overexpressed embryo is not due to apoptosis; Figure S3: Overexpression of fsta results in pericardial edema and circulation defect; Figure S4: Morpholino-knockdown efficiency of fsta in zebrafish embryos.

Author Contributions

C.-Y.W. conceived and designed experiments. R.-F.L., Y.-S.W., Y.-S.H. performed the experiments. R.-F.L., Y.-S.W., F.-I.L., C.-C.C. and C.-Y.W. analyzed results. M.-H.T. and C.-Y.W. carried out the confocal image processing and data analysis. R.-F.L., Y.-S.W. and C.-Y.W. drafted the manuscript. All authors have read and agreed to the published version of the manuscript.

Funding

This work was supported by grants from the Ministry of Science and Technology (MOST), Taiwan (MOST104-2311-B-110-001-MY3, MOST107-2311-B-110-002) and from the NSYSU-KMU Joint Research Project (#NSYSUKMU106-P019, 107-P002) to C.-Y.W. This work was also in part financially supported by the iEGG and Animal Biotechnology Center from The Feature Area Research Center Program within the framework of the Higher Education Sprout Project by the Ministry of Education in Taiwan (MOE-107-S-0023-F), and grants from MOST (MOST110-2311-B-006-008, MOST 110-2313-B-006-004-MY3) to F.-I.L.

Institutional Review Board Statement

The regulations of animal study were approved from the National Sun Yat-Sen University Animal Care Committee (approval reference #10231).

Informed Consent Statement

Not applicable.

Data Availability Statement

Not applicable.

Acknowledgments

We thank Taiwan Zebrafish Core Facility at the National Health Research Institutes (NHRI) and Academia Sinica (TZCAS) for providing TL, AB and transgenic flk/kdrl fish. We thank Sarah Childs and Ho Chi-Yip for providing the primers, plasmids, in-situ hybridization probes, microarray analysis tools and valuable comments.

Conflicts of Interest

The authors declare no conflict of interest.

References

  1. Zhong, T.P. Zebrafish genetics and formation of embryonic vasculature. Curr. Top. Dev. Biol. 2005, 71, 53–81. [Google Scholar] [CrossRef] [PubMed]
  2. Lamont, R.E.; Childs, S. MAPping out arteries and veins. Sci. STKE 2006, 2006, pe39. [Google Scholar] [CrossRef] [PubMed]
  3. Conway, E.M.; Collen, D.; Carmeliet, P. Molecular mechanisms of blood vessel growth. Cardiovasc. Res. 2001, 49, 507–521. [Google Scholar] [CrossRef] [Green Version]
  4. Adams, R.H.; Alitalo, K. Molecular regulation of angiogenesis and lymphangiogenesis. Nat. Rev. Mol. Cell Biol. 2007, 8, 464–478. [Google Scholar] [CrossRef] [PubMed]
  5. Herbert, S.P.; Stainier, D.Y. Molecular control of endothelial cell behaviour during blood vessel morphogenesis. Nat. Rev. Mol. Cell Biol. 2011, 12, 551–564. [Google Scholar] [CrossRef] [Green Version]
  6. Childs, S.; Chen, J.-N.; Garrity, D.; Fishman, M. Patterning of angiogenesis in the zebrafish embryo. Development 2002, 129, 973–982. [Google Scholar] [CrossRef]
  7. Lawson, N.D.; Weinstein, B.M. In vivo imaging of embryonic vascular development using transgenic zebrafish. Dev. Biol. 2002, 248, 307–318. [Google Scholar] [CrossRef] [Green Version]
  8. Ellertsdottir, E.; Lenard, A.; Blum, Y.; Krudewig, A.; Herwig, L.; Affolter, M.; Belting, H.G. Vascular morphogenesis in the zebrafish embryo. Dev. Biol. 2010, 341, 56–65. [Google Scholar] [CrossRef] [Green Version]
  9. Schuermann, A.; Helker, C.S.; Herzog, W. Angiogenesis in zebrafish. Semin. Cell Dev. Biol. 2014, 31, 106–114. [Google Scholar] [CrossRef]
  10. Goi, M.; Childs, S.J. Patterning mechanisms of the sub-intestinal venous plexus in zebrafish. Dev. Biol. 2016, 409, 114–128. [Google Scholar] [CrossRef] [Green Version]
  11. Herpers, R.; van de Kamp, E.; Duckers, H.J.; Schulte-Merker, S. Redundant roles for sox7 and sox18 in arteriovenous specification in zebrafish. Circ. Res. 2008, 102, 12–15. [Google Scholar] [CrossRef] [PubMed] [Green Version]
  12. Kume, T. Specification of arterial, venous, and lymphatic endothelial cells during embryonic development. Histol. Histopathol. 2010, 25, 637–646. [Google Scholar] [PubMed]
  13. Lawson, N.D.; Scheer, N.; Pham, V.N.; Kim, C.H.; Chitnis, A.B.; Campos-Ortega, J.A.; Weinstein, B.M. Notch signaling is required for arterial-venous differentiation during embryonic vascular development. Development 2001, 128, 3675–3683. [Google Scholar] [CrossRef] [PubMed]
  14. Zhong, T.; Childs, S.; Liu, J.; Fishman, M. Gridlock signaling pathway fashions the first embryonic artery. Nature 2001, 414, 216–220. [Google Scholar] [CrossRef]
  15. Lawson, N.D.; Vogel, A.M.; Weinstein, B.M. sonic hedgehog and vascular endothelial growth factor act upstream of the Notch pathway during arterial endothelial differentiation. Dev. Cell 2002, 3, 127–136. [Google Scholar] [CrossRef] [Green Version]
  16. Swift, M.R.; Weinstein, B.M. Arterial-venous specification during development. Circ. Res. 2009, 104, 576–588. [Google Scholar] [CrossRef] [Green Version]
  17. Torres-Vazquez, J.; Kamei, M.; Weinstein, B.M. Molecular distinction between arteries and veins. Cell Tissue Res. 2003, 314, 43–59. [Google Scholar] [CrossRef]
  18. You, L.R.; Lin, F.J.; Lee, C.T.; DeMayo, F.J.; Tsai, M.J.; Tsai, S.Y. Suppression of Notch signalling by the COUP-TFII transcription factor regulates vein identity. Nature 2005, 435, 98–104. [Google Scholar] [CrossRef]
  19. Gerhardt, H.; Golding, M.; Fruttiger, M.; Ruhrberg, C.; Lundkvist, A.; Abramsson, A.; Jeltsch, M.; Mitchell, C.; Alitalo, K.; Shima, D.; et al. VEGF guides angiogenic sprouting utilizing endothelial tip cell filopodia. J. Cell Biol. 2003, 161, 1163–1177. [Google Scholar] [CrossRef]
  20. Torres-Vazquez, J.; Gitler, A.D.; Fraser, S.D.; Berk, J.D.; Van, N.P.; Fishman, M.C.; Childs, S.; Epstein, J.A.; Weinstein, B.M. Semaphorin-plexin signaling guides patterning of the developing vasculature. Dev. Cell 2004, 7, 117–123. [Google Scholar] [CrossRef] [Green Version]
  21. Siekmann, A.F.; Lawson, N.D. Notch signalling limits angiogenic cell behaviour in developing zebrafish arteries. Nature 2007, 445, 781–784. [Google Scholar] [CrossRef] [PubMed]
  22. Wiley, D.; Kim, J.; Hao, J.; Hong, C.; Bautch, V.; Jin, S. Distinct signalling pathways regulate sprouting angiogenesis from the dorsal aorta and the axial vein. Nat. Cell Biol. 2011, 13, 686–692. [Google Scholar] [CrossRef] [PubMed] [Green Version]
  23. Hamik, A.; Wang, B.; Jain, M.K. Transcriptional regulators of angiogenesis. Arterioscler. Thromb. Vasc. Biol. 2006, 26, 1936–1947. [Google Scholar] [CrossRef] [PubMed] [Green Version]
  24. Park, C.; Kim, T.M.; Malik, A.B. Transcriptional regulation of endothelial cell and vascular development. Circ. Res. 2013, 112, 1380–1400. [Google Scholar] [CrossRef]
  25. Pereira, F.A.; Qiu, Y.; Zhou, G.; Tsai, M.J.; Tsai, S.Y. The orphan nuclear receptor COUP-TFII is required for angiogenesis and heart development. Genes Dev. 1999, 13, 1037–1049. [Google Scholar] [CrossRef] [PubMed] [Green Version]
  26. Aranguren, X.L.; Beerens, M.; Vandevelde, W.; Dewerchin, M.; Carmeliet, P.; Luttun, A. Transcription factor COUP-TFII is indispensable for venous and lymphatic development in zebrafish and Xenopus laevis. Biochem. Biophys. Res. Commun. 2011, 410, 121–126. [Google Scholar] [CrossRef]
  27. Swift, M.R.; Pham, V.N.; Castranova, D.; Bell, K.; Poole, R.J.; Weinstein, B.M. SoxF factors and Notch regulate nr2f2 gene expression during venous differentiation in zebrafish. Dev. Biol. 2014, 390, 116–125. [Google Scholar] [CrossRef] [Green Version]
  28. Li, R.F.; Wu, T.Y.; Mou, Y.Z.; Wang, Y.S.; Chen, C.L.; Wu, C.Y. Nr2f1b control venous specification and angiogenic patterning during zebrafish vascular development. J. Biomed. Sci. 2015, 22, 104. [Google Scholar] [CrossRef] [Green Version]
  29. Lamont, R.E.; Wu, C.Y.; Ryu, J.R.; Vu, W.; Davari, P.; Sobering, R.E.; Kennedy, R.M.; Munsie, N.M.; Childs, S.J. The LIM-homeodomain transcription factor Islet2a promotes angioblast migration. Dev. Biol. 2016, 414, 181–192. [Google Scholar] [CrossRef]
  30. Iemura, S.; Yamamoto, T.S.; Takagi, C.; Uchiyama, H.; Natsume, T.; Shimasaki, S.; Sugino, H.; Ueno, N. Direct binding of follistatin to a complex of bone-morphogenetic protein and its receptor inhibits ventral and epidermal cell fates in early Xenopus embryo. Proc. Natl. Acad. Sci. USA 1998, 95, 9337–9342. [Google Scholar] [CrossRef] [Green Version]
  31. Jiang, N.; Jin, X.; He, J.; Yin, Z. The roles of follistatin 1 in regulation of zebrafish fecundity and sexual differentiation. Biol. Reprod. 2012, 87, 54. [Google Scholar] [CrossRef] [PubMed]
  32. Winbanks, C.E.; Weeks, K.L.; Thomson, R.E.; Sepulveda, P.V.; Beyer, C.; Qian, H.; Chen, J.L.; Allen, J.M.; Lancaster, G.I.; Febbraio, M.A.; et al. Follistatin-mediated skeletal muscle hypertrophy is regulated by Smad3 and mTOR independently of myostatin. J. Cell Biol. 2012, 197, 997–1008. [Google Scholar] [CrossRef] [PubMed]
  33. Zhu, J.; Li, Y.; Lu, A.; Gharaibeh, B.; Ma, J.; Kobayashi, T.; Quintero, A.J.; Huard, J. Follistatin improves skeletal muscle healing after injury and disease through an interaction with muscle regeneration, angiogenesis, and fibrosis. Am. J. Pathol. 2011, 179, 915–930. [Google Scholar] [CrossRef] [PubMed]
  34. Moser, M.; Patterson, C. Bone morphogenetic proteins and vascular differentiation: BMPing up vasculogenesis. Thromb. Haemost. 2005, 94, 713–718. [Google Scholar] [CrossRef] [PubMed]
  35. Moreno-Miralles, I.; Schisler, J.C.; Patterson, C. New insights into bone morphogenetic protein signaling: Focus on angiogenesis. Curr. Opin. Hematol. 2009, 16, 195–201. [Google Scholar] [CrossRef] [Green Version]
  36. Cai, J.; Pardali, E.; Sanchez-Duffhues, G.; ten Dijke, P. BMP signaling in vascular diseases. FEBS Lett. 2012, 586, 1993–2002. [Google Scholar] [CrossRef]
  37. Kim, J.D.; Kang, H.; Larrivee, B.; Lee, M.Y.; Mettlen, M.; Schmid, S.L.; Roman, B.L.; Qyang, Y.; Eichmann, A.; Jin, S.W. Context-dependent proangiogenic function of bone morphogenetic protein signaling is mediated by disabled homolog 2. Dev. Cell 2012, 23, 441–448. [Google Scholar] [CrossRef] [Green Version]
  38. Kashiwada, T.; Fukuhara, S.; Terai, K.; Tanaka, T.; Wakayama, Y.; Ando, K.; Nakajima, H.; Fukui, H.; Yuge, S.; Saito, Y.; et al. beta-Catenin-dependent transcription is central to Bmp-mediated formation of venous vessels. Development 2015, 142, 497–509. [Google Scholar] [CrossRef] [Green Version]
  39. Westerfield, M. The Zebrafish Book: A Guide for the Laboratory Use of Zebrafish (Danio Rerio); Institute of Neuroscience, University of Oregon: Eugene, OR, USA, 1995. [Google Scholar]
  40. Roman, B.L.; Pham, V.N.; Lawson, N.D.; Kulik, M.; Childs, S.; Lekven, A.C.; Garrity, D.M.; Moon, R.T.; Fishman, M.C.; Lechleider, R.J.; et al. Disruption of acvrl1 increases endothelial cell number in zebrafish cranial vessels. Development 2002, 129, 3009–3019. [Google Scholar] [CrossRef]
  41. Choi, J.; Dong, L.; Ahn, J.; Dao, D.; Hammerschmidt, M.; Chen, J.N. FoxH1 negatively modulates flk1 gene expression and vascular formation in zebrafish. Dev. Biol. 2007, 304, 735–744. [Google Scholar] [CrossRef] [Green Version]
  42. Proulx, K.; Lu, A.; Sumanas, S. Cranial vasculature in zebrafish forms by angioblast cluster-derived angiogenesis. Dev. Biol. 2010, 348, 34–46. [Google Scholar] [CrossRef] [PubMed]
  43. Erickson, T.; French, C.R.; Waskiewicz, A.J. Meis1 specifies positional information in the retina and tectum to organize the zebrafish visual system. Neural Dev. 2010, 5, 22. [Google Scholar] [CrossRef] [PubMed] [Green Version]
  44. Wu, B.J.; Chiu, C.C.; Chen, C.L.; Wang, W.D.; Wang, J.H.; Wen, Z.H.; Liu, W.; Chang, H.W.; Wu, C.Y. Nuclear receptor subfamily 2 group F member 1a (nr2f1a) is required for vascular development in zebrafish. PLoS ONE 2014, 9, e105939. [Google Scholar] [CrossRef] [PubMed] [Green Version]
  45. Bolstad, B.M.; Irizarry, R.A.; Astrand, M.; Speed, T.P. A comparison of normalization methods for high density oligonucleotide array data based on variance and bias. Bioinformatics 2003, 19, 185–193. [Google Scholar] [CrossRef] [Green Version]
  46. Irizarry, R.A.; Bolstad, B.M.; Collin, F.; Cope, L.M.; Hobbs, B.; Speed, T.P. Summaries of Affymetrix GeneChip probe level data. Nucleic Acids Res. 2003, 31, e15. [Google Scholar] [CrossRef]
  47. Irizarry, R.A.; Hobbs, B.; Collin, F.; Beazer-Barclay, Y.D.; Antonellis, K.J.; Scherf, U.; Speed, T.P. Exploration, normalization, and summaries of high density oligonucleotide array probe level data. Biostatistics 2003, 4, 249–264. [Google Scholar] [CrossRef] [Green Version]
  48. Smyth, G.K.; Michaud, J.; Scott, H.S. Use of within-array replicate spots for assessing differential expression in microarray experiments. Bioinformatics 2005, 21, 2067–2075. [Google Scholar] [CrossRef]
  49. Benjamini, Y.; Drai, D.; Elmer, G.; Kafkafi, N.; Golani, I. Controlling the false discovery rate in behavior genetics research. Behav. Brain Res. 2001, 125, 279–284. [Google Scholar] [CrossRef] [Green Version]
  50. Thisse, C.; Thisse, B. High-resolution in situ hybridization to whole-mount zebrafish embryos. Nat. Protoc. 2008, 3, 59–69. [Google Scholar] [CrossRef]
  51. Fukuhara, S.; Fukui, H.; Wakayama, Y.; Ando, K.; Nakajima, H.; Mochizuki, N. Looking back and moving forward: Recent advances in understanding of cardiovascular development by imaging of zebrafish. Dev. Growth Differ. 2015, 57, 333–340. [Google Scholar] [CrossRef] [Green Version]
  52. Betz, C.; Lenard, A.; Belting, H.G.; Affolter, M. Cell behaviors and dynamics during angiogenesis. Development 2016, 143, 2249–2260. [Google Scholar] [CrossRef] [PubMed] [Green Version]
  53. Sumanas, S.; Jorniak, T.; Lin, S. Identification of novel vascular endothelial-specific genes by the microarray analysis of the zebrafish cloche mutants. Blood 2005, 106, 534–541. [Google Scholar] [CrossRef] [PubMed] [Green Version]
  54. Gomez, G.A.; Veldman, M.B.; Zhao, Y.; Burgess, S.; Lin, S. Discovery and characterization of novel vascular and hematopoietic genes downstream of etsrp in zebrafish. PLoS ONE 2009, 4, e4994. [Google Scholar] [CrossRef] [PubMed] [Green Version]
  55. Wong, K.S.; Proulx, K.; Rost, M.S.; Sumanas, S. Identification of vasculature-specific genes by microarray analysis of Etsrp/Etv2 overexpressing zebrafish embryos. Dev. Dyn. Off. Publ. Am. Assoc. Anat. 2009, 238, 1836–1850. [Google Scholar] [CrossRef]
  56. Arnold, C.R.; Lamont, R.E.; Walker, J.T.; Spice, P.J.; Chan, C.K.; Ho, C.Y.; Childs, S.J. Comparative analysis of genes regulated by Dzip1/iguana and hedgehog in zebrafish. Dev. Dyn. Off. Publ. Am. Assoc. Anat. 2015, 244, 211–223. [Google Scholar] [CrossRef]
  57. Watanabe, M.; Yoshida, K.; Hida, M.; Kato, H.; Uchida, K.; Yamaguchi, R.; Tateyama, S.; Sugano, S. Cloning, expression analysis, and chromosomal mapping of GTPBP2, a novel member of the G protein family. Gene 2000, 256, 51–58. [Google Scholar] [CrossRef]
  58. Takai, Y.; Sasaki, T.; Matozaki, T. Small GTP-binding proteins. Physiol. Rev. 2001, 81, 153–208. [Google Scholar] [CrossRef] [PubMed]
  59. Lakshmikanthan, S.; Sobczak, M.; Chun, C.; Henschel, A.; Dargatz, J.; Ramchandran, R.; Chrzanowska-Wodnicka, M. Rap1 promotes VEGFR2 activation and angiogenesis by a mechanism involving integrin alphavbeta(3). Blood 2011, 118, 2015–2026. [Google Scholar] [CrossRef] [PubMed] [Green Version]
  60. Kather, J.N.; Kroll, J. Rho guanine exchange factors in blood vessels: Fine-tuners of angiogenesis and vascular function. Exp. Cell Res. 2013, 319, 1289–1297. [Google Scholar] [CrossRef] [PubMed]
  61. Chetty, C.; Lakka, S.S.; Bhoopathi, P.; Rao, J.S. MMP-2 alters VEGF expression via alphaVbeta3 integrin-mediated PI3K/AKT signaling in A549 lung cancer cells. Int. J. Cancer 2010, 127, 1081–1095. [Google Scholar] [CrossRef] [Green Version]
  62. Ma, Y.L.; Lin, S.W.; Fang, H.C.; Chou, K.J.; Bee, Y.S.; Chu, T.H.; Chang, M.C.; Weng, W.T.; Wu, C.Y.; Cho, C.L.; et al. A novel poly-naphthol compound ST104P suppresses angiogenesis by attenuating matrix metalloproteinase-2 expression in endothelial cells. Int. J. Mol. Sci. 2014, 15, 16611–16627. [Google Scholar] [CrossRef] [PubMed] [Green Version]
  63. Wang, Q.; Uhlirova, M.; Bohmann, D. Spatial restriction of FGF signaling by a matrix metalloprotease controls branching morphogenesis. Dev Cell 2010, 18, 157–164. [Google Scholar] [CrossRef] [PubMed] [Green Version]
  64. Potente, M.; Urbich, C.; Sasaki, K.; Hofmann, W.K.; Heeschen, C.; Aicher, A.; Kollipara, R.; DePinho, R.A.; Zeiher, A.M.; Dimmeler, S. Involvement of Foxo transcription factors in angiogenesis and postnatal neovascularization. J. Clin. Investig. 2005, 115, 2382–2392. [Google Scholar] [CrossRef] [PubMed] [Green Version]
  65. Liu, L.Y.; Fox, C.S.; North, T.E.; Goessling, W. Functional validation of GWAS gene candidates for abnormal liver function during zebrafish liver development. Dis. Models Mech. 2013, 6, 1271–1278. [Google Scholar] [CrossRef] [Green Version]
  66. Davis, D.A.; Singer, K.E.; De La Luz Sierra, M.; Narazaki, M.; Yang, F.; Fales, H.M.; Yarchoan, R.; Tosato, G. Identification of carboxypeptidase N as an enzyme responsible for C-terminal cleavage of stromal cell-derived factor-1alpha in the circulation. Blood 2005, 105, 4561–4568. [Google Scholar] [CrossRef]
  67. Weiss, A.; Baumgartner, M.; Radziwill, G.; Dennler, J.; Moelling, K. c-Src is a PDZ interaction partner and substrate of the E3 ubiquitin ligase Ligand-of-Numb protein X1. FEBS Lett. 2007, 581, 5131–5136. [Google Scholar] [CrossRef] [Green Version]
  68. Rehn, K.; Wong, K.S.; Balciunas, D.; Sumanas, S. Zebrafish enhancer trap line recapitulates embryonic aquaporin 1a expression pattern in vascular endothelial cells. Int. J. Dev. Biol. 2011, 55, 613–618. [Google Scholar] [CrossRef]
  69. Nicoli, S.; Knyphausen, C.P.; Zhu, L.J.; Lakshmanan, A.; Lawson, N.D. miR-221 is required for endothelial tip cell behaviors during vascular development. Dev. Cell 2012, 22, 418–429. [Google Scholar] [CrossRef] [Green Version]
Figure 1. Loss of nr2f1b and isl2 causes vascular defects, and transcriptome analysis identified genes regulated by Nr2f1b and/or Isl2. (AC,AC) knockdown of isl2 or nr2f1b causes ISV growth stalling in the middle line of the somite, a reduction of the ISV endothelial cells, (B,C) and a mis-patterned vessel plexus at the CVP (B,C) at 30–32 hpf when compared to wt controls (A,A). (D,E) Microarray data analysis in Venn diagrams show that there were 308 and 168 genes upregulated at isl2 MO and nr2f1b MO, respectively, compared to wt, as well as 121 overlapping genes in both isl2 MO and nr2f1b MO when compared to the wild type (D). (E) For the repression targets, 108 and 89 genes are downregulated at isl2 MO and nr2f1b MO, respectively, compared to wt, and 23 genes are overlapped. (F) Functional analysis showed many genes involved in cell cycle regulation, signaling, transporter/channels, transcription, cell communication and protein–protein interactions. (ISV, intersegmental vessel; DLAV, dorsal longitudinal anastomotic vessel; DA, dorsal aorta; PCV, posterior cardinal vein; CVP, caudal vein plexus). Scale bars represent 100 μm.
Biomedicines 10 01261 g001
Figure 2. Verification of vascular-specific expression of potential targets in wt and double knockdown isl2/nr2f1b MOs by in situ hybridization. Embryos were injected with a combination of isl2 and nr2f1b morpholinos (8 and 1.7 ng each) and gene expression was examined by in situ hybridization at 24 h post-fertilization. Representative wt control embryos are on the left of each panel and isl2/nr2f1b morpholino (MO)-injected embryos are on the right. ((AJ,AJ) red bar aside) The increased expression of (A) cpn1, (B) foxo3b, (C) fsta, (D) scarb2, (E) cx32.2, (F) lnx1, (G) mmp2, (H) ftr82, (I) gtpbp1l, and (J) itm2bb in the vasculature in isl2/nr2f1b morphants (thick arrows) compared to wild-type embryos (AJ). (KN,KN green bar aside) The reduced expression of (K) stap2b, (L) WASF1, (M) sfrp1a, and (N) nsdhl in the vessels in isl2/nr2f1b morphants (dash arrows) compared to wild-type embryos (KN). These data consist of the transcriptome results. Values on the bottom indicate the number of embryos exhibiting a phenotype per the total number of embryos analyzed. Scale bar is 200 μm for all figures.
Biomedicines 10 01261 g002
Figure 3. Expression pattern of fsta during zebrafish embryogenesis. (A) The expression of fsta is observed in the lateral plate mesoderm (lpm), the telencephalon (t), diencephalon (d), and hindbrain (h) at the 15S stage embryo. (B,B) At 24 hpf, fsta is expressed in the head, as well as in vessels (v), and caudal vein plexus (cvp) of the trunk. (B) is an enlargement of (B). (C,C) At 30 hpf, fsta expression continues in the head, vessels (v), and CVP of the trunk. (C) is an enlargement of (C). (C″) Cross sections of embryos from (C′) show that fsta is expressed in the posterior cardinal vein (pcv), and CVP. (D,D′) At 48 hpf, fsta expression in the head, vessels (v), DLAV, and CVP of the trunk. (D′) is an enlargement of (D). Scale bars in all figures represent 200 μm.
Biomedicines 10 01261 g003
Figure 4. The overexpression of the fsta gene causes defects in vascular development. In uninjected control embryos, intersegmental vessels (ISV) reached the DLAV at the dorsal region from 24–30 hpf ((A), arrowheads) and the caudal vein plexus (CVP) formed honeycomb-like structures at the tail region from about 36–48 hpf ((A′), arrows). At the same stage, the overexpression of fsta driven by the fli promoter caused ISVs’ stalling at the mid-somite ((B), hollow arrowheads) and less/no honeycomb structure formation at the CVP (B′) Knockdown of fsta by morpholino had no obvious defect in the vasculature (C,C′), but rescued the defect of ISV stalling (solid arrowhead) (D) and restored the honeycomb structure at the CVP (D′). (E) The quantification of the percentage of completed ISV at 30 hpf in wild-type embryos (97 ± 2, n = 31), (fli:fsta)-overexpressing embryos (54 ± 8, n = 24), fsta MO (97 ± 3, n = 15), and rescued embryos (84 ± 6, n = 13). (F) Quantification of loop formation (loops and sprouts) at the CVP at 36 hpf showed an 8-fold increase in the rescued embryos (23 ± 3, n = 16) when compared to (fli:fsta) embryos (3 ± 1, n = 21); fsta MO (28 ± 4, n = 14) has no difference when compared to wild-type embryos (30 ± 2, n = 15). (G,H) Imaging of endothelial nuclei in green and vessels in red at 30 hpf in wild-type controls and (fli:fsta)-overexpressing embryos using Tg(kdrl:mCherryci5; fli1a:nEGFP y7) double transgenic line. (fli:fsta) embryos showed reduced ISV nuclei numbers (H). (I) Quantification of ISV nuclei number in (fli:fsta) embryos (n = 25) when compared to wild-type controls (n = 18). Data are represented as means ± S.E. *** refers to p< 0.0001 by an unpaired Student’s t-test. Scale bars are 100 μm for (AD,A′D′,G,H).
Biomedicines 10 01261 g004
Figure 5. fli, driving fsta-overexpressing (fli:fsta) fish, remodeled the expression of vascular markers. (AJ) When compared to wild type controls (A,C,E,G,I), the expression of the pan-vascular markers flk1 and stabilin2 at the vessels (ve) and caudal vein plexus (cvp) were decreased in (fli:fsta)-overexpressed fish at 24 hpf (AD). In addition, the expression of venous markers mrc1 (E,F) and flt4 (G,H) were reduced in the posterior cardinal vein (v) and caudal vein plexus (cvp) in (fli:fsta)-overexpressed fish at 24 hpf. The expression of the arterial marker ephrinb2 (I,J) is not changed. Values on the bottom indicate the number of embryos exhibiting a phenotype per the total number of embryos analyzed. Scale bars represent 200 μm in (AJ). (K) Quantification of the relative expression level by qPCR assay showed a ~50 to 80% reduced expression in the vascular markers flk1 (0.16 ± 0.1), stabilin2 (0.28 ± 0.12), mrc1 (0.45 ± 0.03), and flt4 (0.69 ± 0.03) in (fli:fsta) embryos; the expression of ephrinb2 (0.9 ± 0.11) in (fli:fsta) embryos is unchanged when compared to wild-type. qPCR data are presented as the mean ± S.D. *** Refers to p < 0.0001 and ** refers to p < 0.001 by an unpaired Student’s t test.
Biomedicines 10 01261 g005
Figure 6. Knockdown of fsta rescues the vascular defects in isl2 and nr2f1b morphants. When compared to vascular patterns in wild type embryos (A,A′,E,E′,), the loss of fsta by morpholino injection does not cause obvious vascular defects (C,C’,G,G’), and the knockdown of isl2 or nr2f1b showed ISV growth defects at 30 hpf (B,F) and CVP mis-patterning (hollow arrows in (B′,F′)). Double knockdown of fsta and isl2 (fsta MO + isl2 MO) or fsta and nr2f1b (fsta MO + nr2f1b MO) showed less ISV stalling (D,H) when compared to isl2 MO or nr2f1b MO. (IL) Quantitative results showed the significant rescue effect of isl2 MO or nr2f1b MO by fsta morpholino injection. Quantitated results for isl2 MO rescue experiments in wt (n = 10), fsta MO (n = 18), isl2 MO (n = 13), and fsta MO + isl2 MO (n = 15). For the quantification of nr2f1b MO rescue experiment: wt (n = 10), fsta MO (n = 18), nr2f1b MO (n = 15), fsta MO + nr2f1b MO (n = 13). These data are consistent with our microarray results; isl2 and nr2f1b negatively regulate fsta expression to control ISV/vein development. Data are represented as means ± S.E. *** refers to p < 0.0001 by an unpaired Student’s t-test. Scale bars represent 100 μm in (AH,A′H′).
Biomedicines 10 01261 g006
Figure 7. Fsta regulates BMP signals to control vascular patterning. (AD) Inhibition of VEGF or Notch signals by SU5416 or DAPT treatment reduced the expression of fsta compared to DMSO-treated control. (EH) Inhibition of BMP signals by DM or DMH1 treatment did not reduce the expression of fsta in embryos by in-situ hybridization and qPCR analysis. (I) Representative western blot assays showed the reduced phosphorylation of smad1 and ERK1/2 in (fli:fsta) embryos. β-actin serves as loading controls. (J) The decreased expression of BMP regulated genes id1, eve1, msx1b and gata2. qPCR data are presented as the mean ± S.D. *** refers to p < 0.0001 and ** refers to p < 0.001 by an unpaired Student’s t-test. Scale bar represents 200 μm in (AC,EG). (K) Schematic drawing shows the genetic regulation of fsta, isl2/nr2f1b, and multiply signals. Our data suggest that fsta functions in ISV growth and CVP patterning mediated by BMP signal pathways.
Biomedicines 10 01261 g007
Publisher’s Note: MDPI stays neutral with regard to jurisdictional claims in published maps and institutional affiliations.

