Article

Mitochondrial Genetics Reinforces Multiple Layers of Interaction in Alzheimer’s Disease

by
Giovanna Chaves Cavalcante
,
Leonardo Miranda Brito
,
Ana Paula Schaan
,
Ândrea Ribeiro-dos-Santos
,
Gilderlanio Santana de Araújo
* and
on behalf of Alzheimer’s Disease Neuroimaging Initiative
Laboratory of Human and Medical Genetics, Graduate Program in Genetics and Molecular Biology, Institute of Biological Sciences, Federal University of Pará, Belém 66075-110, Brazil
*
Author to whom correspondence should be addressed.
Data used in preparation of this article were obtained from the Alzheimer’s Disease Neuroimaging Initiative (ADNI) database (adni.loni.ucla.edu). As such, the investigators within the ADNI contributed to the design and implementation of ADNI and/or provided data, but did not participate in analysis or writing of this report. A complete listing of ADNI investigators can be found at: http://adni.loni.ucla.edu/wp-content/uploads/how_to_apply/ADNI_Acknowledgement_List.pdf.
Biomedicines 2022, 10(4), 880; https://doi.org/10.3390/biomedicines10040880
Submission received: 8 February 2022 / Revised: 5 March 2022 / Accepted: 7 March 2022 / Published: 12 April 2022
(This article belongs to the Special Issue Biomarkers for Parkinson’s Disease and Alzheimer’s Disease)

Abstract

:

Simple Summary

Nuclear DNA remains the main source of genome-wide loci association in neurodegenerative diseases, only partially accounting for the heritability of Alzheimer’s Disease (AD). In this context, mitochondrial DNA (mtDNA) is gaining more attention. Here, we investigated mitochondrial genes and genetic variants that may influence mild cognitive impairment and AD, through an integrative analysis including both differential gene expression and mitochondrial genome-wide epistasis analysis. Our results highlight important layers of interactions involving mitochondrial genetics and suggest specific molecular alterations as potential biomarkers for AD.

Abstract

Nuclear DNA has been the main source of genome-wide loci association in neurodegenerative diseases, only partially accounting for the heritability of Alzheimer’s Disease (AD). In this context, mitochondrial DNA (mtDNA) is gaining more attention. Here, we investigated mitochondrial genes and genetic variants that may influence mild cognitive impairment and AD, through an integrative analysis including differential gene expression and mitochondrial genome-wide epistasis. We assessed the expression of mitochondrial genes in different brain tissues from two public RNA-Seq databases (GEO and GTEx). Then, we analyzed mtDNA from the ADNI Cohort and investigated epistasis regarding mitochondrial variants and levels of A β 1 42 , TAU, and Phosphorylated TAU (PTAU) from cognitively healthy controls, and both mild cognitive impairment (MCI) and AD cases. We identified multiple differentially expressed mitochondrial genes in the comparisons between cognitively healthy individuals and AD patients. We also found increased protein levels in MCI and AD patients when compared to healthy controls, as well as novel candidate networks of mtDNA epistasis, which included variants in all mitochondrially-encoded oxidative phosphorylation complexes, 12S rRNA and MT-DLOOP. Our results highlight layers of potential interactions involving mitochondrial genetics and suggest specific molecular alterations as potential biomarkers for AD.

1. Introduction

Alzheimer’s Disease (AD) is a progressive neurodegenerative condition with a complex origin that leads to a myriad of symptoms, such as severe memory loss, confusion, multiple cognitive deficiencies and personality changes. AD is the most common cause of dementia, responsible for 60–80% of cases worldwide [1]. AD progression is slow—gradually worsening over years or even decades—and a final diagnosis is commonly reached in moderate to severe stages due to unspecific traits of cognitive symptoms during early stages [2]. AD occurs in a late-onset sporadic form (at least 65 years of age, representing 95% of the cases) or in an early-onset familial form (under 65 years of age, representing 5% of the cases) [1,3]. According to the 2020 report by the Alzheimer’s Association, most patients live 4–8 years after diagnosis and deaths officially related to AD increased by 146.2% from 2000 to 2018 [4]. This report also highlights that molecular changes may begin over 20 years before AD symptoms arise, which represents a window of opportunity for early interventions during disease development and progression.
Notably, AD presents heterogeneity regarding etiology, symptomatology, age of onset and rates of progression, but the mechanisms involved in this diversity of disease presentation are still not fully comprehended [5]. The heterogeneous nature of AD also poses an obstacle towards developing standard treatments [6]. Currently, there are treatments that may help to slow some of the symptoms, but there is no cure for the disease [3]. Thus, genetic, epigenetic and environmental factors have been explored in an effort to elucidate the neurodegenerative process through a holistic perspective [7,8,9].
Histopathologically, AD cases show an accumulation of intraneuronal hyperphosphorylated TAU protein (PTAU) and extracellular plaques of amyloid- β (A β or AB) in the brain [1]. These molecular changes are related to different genetic and epigenetic factors, including those involved in mitochondrial activity, particularly in energy generation. Indeed, mitochondria have been increasingly associated with neurological diseases, including AD, although it is still unclear whether mitochondrial alterations are a primary or a secondary event in this disease [10]. Mitochondrial alterations have also been found in mild cognitive impairment (MCI), a state that frequently progresses to AD [11,12].
In the last few decades, a link between the mitochondrial DNA (mtDNA) and MCI and AD has been strongly suggested, but variants of interest in regions of mtDNA origin and their biological functions remain poorly understood. Additionally, epistasis—the dependent effect that multiple genetic variants have on a trait, i.e., the occurrence of at least two genetic variants with a different effect on a specific trait [13]—has been pointed out as an important and neglected factor in the heritability of AD [14]. In this context, recent studies have highlighted the need for investigating rare and/or overlooked variants that may interact and influence the risk of neurodegeneration in AD development [15,16].
Therefore, in this study, we aimed to identify mitochondrial genes and genetic variants that may have a role in the development of AD, by performing an integrative data analysis from independent sources. First, we conducted a prospective study on the differential expression of mitochondrial genes in various brain tissues. Then, we analyzed epistatic mtDNA genetic associations with cerebrospinal fluid (CSF) levels of A β 1 42 , TAU and PTAU based on public datasets, as well as the private cohort of the Alzheimer’s Disease Neuroimaging Initiative (ADNI) [17,18]. Here, we show differential expression between mtDNA genes and pseudogenes in AD patients as well as candidate mtDNA genotype interactions that may influence TAU and PTAU levels in CSF from MCI and AD patients.

2. Materials and Methods

Our methodology consisted of different approaches to analyzing gene regulation and genomics from mtDNA data. First, differential expression (DE) analyses of mitochondrial genes were performed. DE analyses were based on RNA-seq data from brain tissues sampled from healthy young adults (HYA), healthy elderly adults (HEA) and Alzheimer’s Disease cases (AD). Next, we investigated epistasis of mitochondrial genome variants genotyped for AD, MCI and healthy individuals from the ADNI Cohort. Then, genome-wide association analyses were performed based on mitochondrial data. SNP-SNP interaction analyses were performed for mtDNA variants in a quantitative design to investigate candidate associations with cerebrospinal levels of A β 1 42 , TAU and PTAU.

2.1. RNA-seq Transcriptome Data from Brain Tissues

First, we processed two available RNA-seq experiments found in the Gene Expression Omnibus (GEO) for brain tissues. Transcriptome data were generated for lateral temporal lobe and fusiform gyrus tissues by third parties and both experiments are stored in GEO under accession numbers GSE104704 and GSE125583, respectively. Sample numbers and age ranges of the individuals included in these experiments are presented in Table 1.
In addition to the aforementioned brain tissues, we extracted RNA-seq data from the Genotype Tissue Expression database (GTEx, v.8), which provides genome-wide data and a summary of expression quantitative trait loci analysis for a large set of tissue donors [18]. This allowed us to extract transcriptome data from 54 tissues, from 948 donors and a total of 17,382 samples. Around 50% of the donors presented ages ranging from 60 to 70 years old. Out of GTEx large data, we extracted expression data for 13 different brain tissues. For further analyses, these data were used to explore gene expression patterns in healthy brains, which allowed us to investigate how different genes and pseudogenes are expressed at baseline.

2.2. ADNI Cohort Data: mtDNA Sequence Data and Biomarkers

Mitochondrial genomes were sequenced for 809 individuals according to the protocol previously described in [19]. According to [20,21], the individuals included in this cohort are mainly of mitochondrial European ancestry, mostly belonging to haplogroups H, I, J and K, widely present throughout the European continent; by protocol, individuals were clinically analyzed using medical resonance imaging, cognition measurement scores, APOE genotyping and a series of biomarkers extracted from plasma and CSF.
The ADNI longitudinal database stores CSF data from A β 1 42 , total TAU (TTAU or TAU) and phosphorylated TAU at threonine 181 (PTAU) levels collected at baseline (N = 475) after diagnostic examinations for healthy (N = 166), MCI patients (N = 268) and AD cases (N = 41). Measurements of these biomarker levels met all quality control (QC) requirements as described in [22]. At baseline, individuals were, on average, 73 years old (+/−7.18). Of these, 253 were male and 222 were females.

2.3. Differential Gene Expression Analysis in Brain Tissues

In order to process the RNA-seq experiments, we downloaded .sra files and converted them to .fastq files using the SRA-Toolkit [23]. QC was assessed by FastQC and MultiQC [24,25]. Trimmomatic was performed for read cleaning and a second round of QC [26].
After QC, reads were aligned to the UCSC reference genome (University of California Santa Cruz), version hg19 (http://hgdownload.soe.ucsc.edu/downloads.html, accessed on 4 August 2021), using the STAR tool [27], and annotated following the coordinate regions of the Gencode genome (v19) (https://www.gencodegenes.org/human/release_19.html, accessed on 4 August 2021). Finally, read counting was performed using the HTseq library [28], implemented in the Python programming language, using the function scripts.count, thus generating files with the abundance of each gene per sample.
DE analyses of the three experiments were performed with the edgeR package in R version 3.5.2 [29]. In this analysis, the gene count matrix was filtered for reads with more than 10 counts. The resulting matrices were normalized, thereby converting expression values to a scale that allows adequate data comparisons. Lastly, we adjusted the gene counts to a generalized negative binomial log-linear model and controlled for multiple testing with False Discovery Rate (FDR ≤ 0.05).

2.4. Gene–Gene Interaction Network Analysis

GeneMANIA (www.genemania.org, accessed on 4 August 2021) is a user-friendly web tool for generating hypotheses about gene function and gene prioritization support [30]. GeneMANIA finds similar genes using functional genomics, transcriptomics and proteomics data given a seed gene list. The tool receives as input a list of genes to build a gene–gene interaction network, which is based on extensive biological datasets for functional similarity analysis, co-expression or even interactions at protein level. Here, we employed GeneMANIA to analyze whether seed mtDNA genes and their interactions could be involved in the development of AD or interact with other nuclear genes related to neurogenerative processes.

2.5. Epistasis between mtDNA Variants with an Impact on CSF Biomarker Levels

Epistasis analyses were performed with multiple linear regression for quantitative traits. The linear model is based on the allele dosage for each mtDNA variant, A and B, and fits the following model, in which the interaction test is based on the b 3 coefficient:
Y = b 0 + b 1 · A + b 2 · B + b 3 · A B + e
The mtDNA variants were filtered for minor allele frequency (MAF) greater than 0.01 and 99% genotyping rate; monomorfic SNPs were removed. MAF threshold was used to exclude rare SNPs from our analysis. Then, epistasis analyses were performed in the context of AD considering the ADNI groups (AD, MCI and healthy subjects, N = 475) and association analyses with AB, PTAU and TAU levels. Next, we conducted a mitochondrial genome-wide epistasis analysis using a linear regression model for quantitative trait analysis association. The linear regression was implemented in PLINK software and was executed with the –epistasis command, release v1.9 [31]. Association hits with a p-value ≤ 5.0 × 10 5 were considered statistically significant.

3. Results

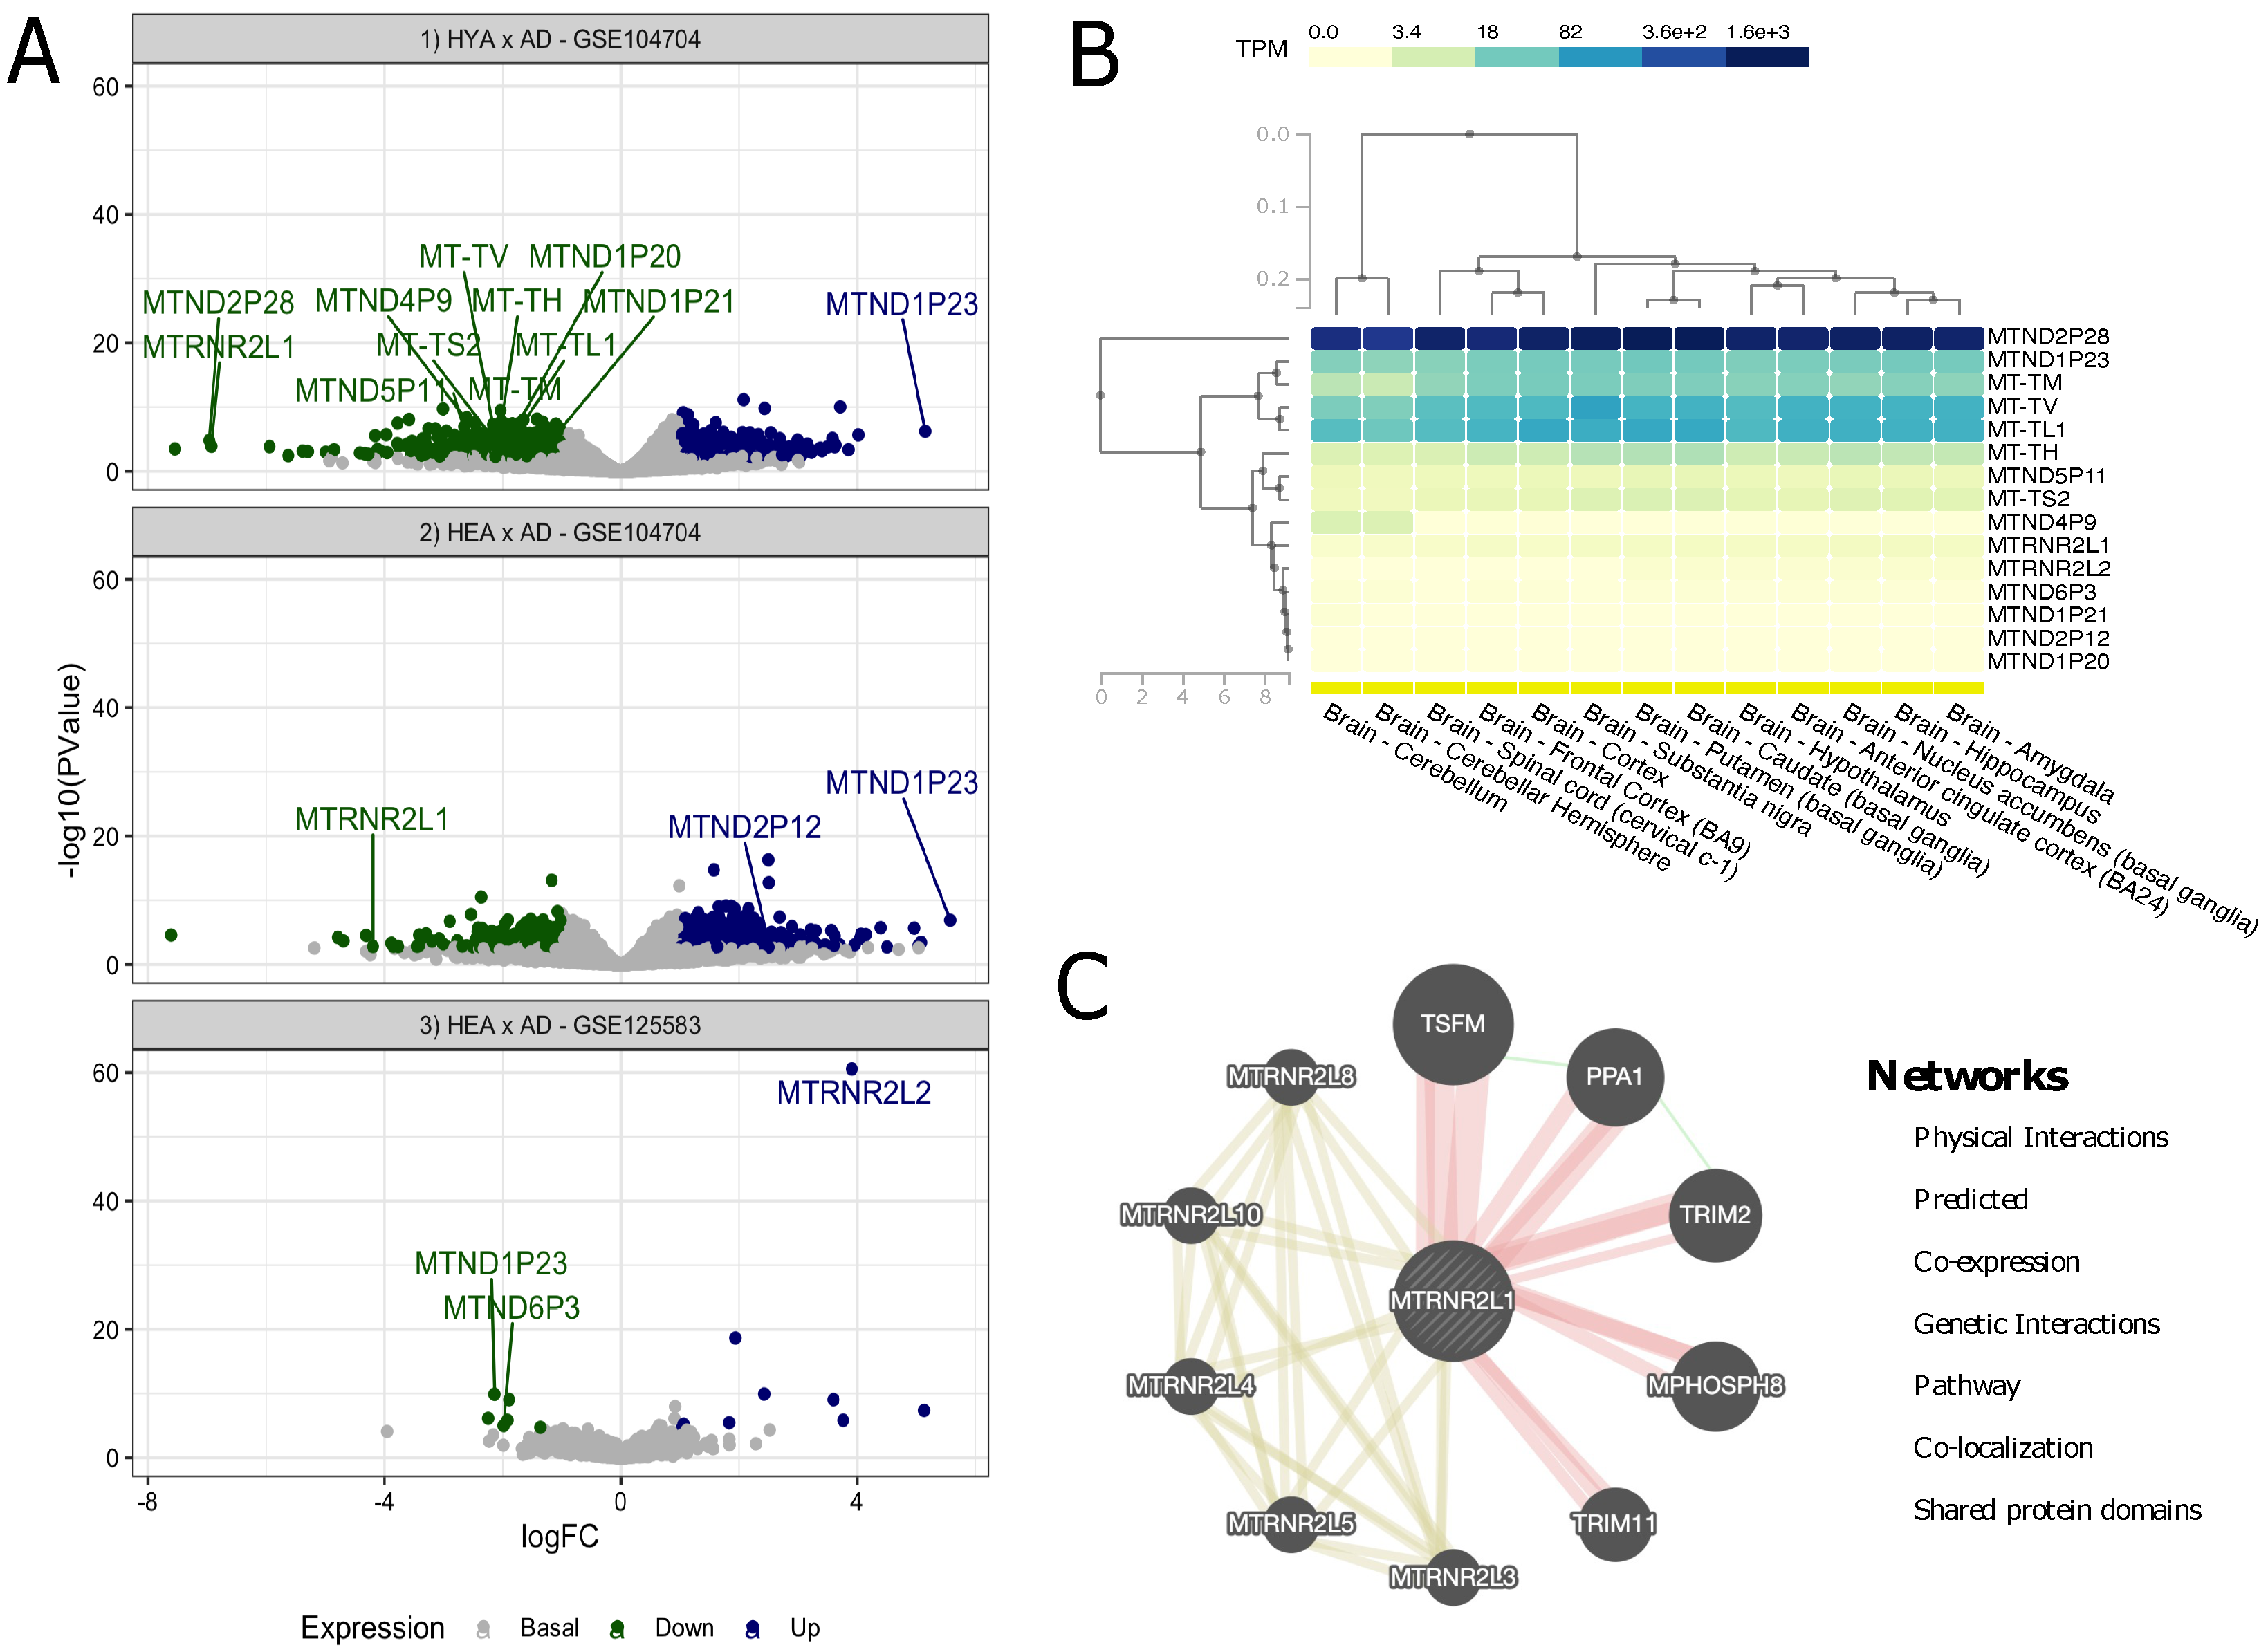
3.1. Screening for Differential Expression of mtDNA Genes and Pseudogenes

Three comparative analyses of gene expression were performed for the two datasets: HYA vs. AD (GSE104704), HEA vs. AD (GSE104704) and HEA vs. AD (GSE125583). When comparing HYA vs. AD (lateral temporal lobe), 12 genes were found to be DE, while three were DE in HEA vs. AD comparisons (lateral temporal lobe and fusiform gyrus). Considering them individually, there were 15 DE genes in total: five tRNA genes, eight pseudogenes and two isoforms.
As seen in Table 2, the following genes were differentially expressed in the investigated tissues: MT-TL1 (Mitochondrially Encoded TRNA-Leu 1), MT-TV (Mitochondrially Encoded TRNA-Val), MT-TM (Mitochondrially Encoded TRNA-Met), MT-TH (Mitochondrially Encoded TRNA-His), MT-TS2 (Mitochondrially Encoded TRNA-Ser 2), MTND2P28 (MT-ND2 pseudogene 28), MTND1P23 (MT-ND1 pseudogene 23), MTND1P20 (MT-ND1 pseudogene 20), MTND1P21 (MT-ND1 pseudogene 21), MTND5P11 (MT-ND5 pseudogene 11), MTND4P9 (MT-ND4 pseudogene 9), MTND2P12 (MT-ND2 pseudogene 2), MTRNR2L1 (MT-RNR2 like 1), MTND6P3 (MT-ND6 pseudogene 3) and MTRNR2L2 (MT-RNR2 like 2).
Notably, MTRNR2L1 and MTND1P23 appeared in the results of more than one analysis: MTRNR2L1 was DE in two (with downregulated expression in both lateral temporal lobe tissues) and MTND1P23 was DE in all three analyses (with upregulated expression in both lateral temporal lobe tissues, while downregulated in the fusiform gyrus tissue). This pattern suggests a tissue-specific regulation of such genes in AD. The other DE genes presented individual patterns in the investigated tissues, i.e., only appeared once.
In addition to Table 2, we plotted the results from the previous analysis for all three experiments (HYA vs. AD in lateral temporal lobe, HEA vs. AD in lateral temporal lobe and HEA vs. AD in fusiform gyrus), as a clear representation of the DE genes, as shown in Figure 1A. To gain insight into the expression of such genes, we performed a comparative expression analysis of all 15 genes in 13 healthy brain tissues with data extracted from the GTEx portal, which did not include fusiform gyrus or lateral temporal lobe tissues specifically (Figure 1B). From these results, interaction networks were searched for each gene in GeneMANIA, but were only found for MTRNR2L1 (Figure 1C).
As seen in Figure 1B, out of the 15 genes, five were highly overexpressed in all of the investigated tissues (MTND2P28, MTND1P23, MT-TM, MT-TV and MT-TL1), with two exceptions (MT-TM was mildly overexpressed in the cerebellum and cerebellar hemisphere). It should be noted that MTND2P28 presented much higher levels of expression than others. Other mildly overexpressed genes in all tissues included MT-TH, MTND5P11 and MT-TS2. All other genes showed similar underexpression patterns and, to some extent, were grouped together. As for the tissues, it is noteworthy that, based on gene expression patterns, the group formed by the amygdala and hippocampus was similar to nucleus accumbens (basal ganglia) and that this cluster was also similar to another, formed by the anterior cingulate cortex and hypothalamus; these tissues also presented great similarity with the caudate and putamen, both basal ganglia regions and, to a lesser extent, substantia nigra (also part of the basal ganglia). Cortex and frontal cortex were also grouped together, and these tissues were close to the spinal cord. Lastly, the cerebellum and cerebellar hemisphere formed a cluster that, although still similar, was the most separated from the others.
In the interaction network for MTRNR2L1 shown in Figure 1C, we found 10 strongly linked genes, of which five seemed to present physical interactions (MPHOSPH8, PPA1, TRIM2, TRIM11 and TSFM) and the other five shared protein domains not only with MTRNR2L1 but also with each other (MTRNR2L3, MTRNR2L4, MTRNR2L5, MTRNR2L8 and MTRNR2L10). In addition, PPA1 (Inorganic Pyrophosphatase 1) presented genetic interactions with TSFM (Ts Translation Elongation Factor, Mitochondrial) and TRIM2 (Tripartite Motif Containing 2).

3.2. Epistasis between mtDNA and CSF PTAU and TAU Levels

Then, we hypothesized that some patterns of differential expression observed in the previous analysis could result from the effects caused by the presence of mtDNA variants, so we searched the ADNI data for epistasis between mtDNA genes related to A β 1 42 , PTAU and TAU levels extracted from CSF. Interestingly, linear regression results revealed epistatic interactions among mtDNA variants and PTAU and TAU levels, but not for A β 1 42 .
For PTAU levels, we identified a significant gene network between MT-RNR1(709) and two variants, namely MT-ATP6(9632) and MT-ND4(12083) (Figure 2); however, we did not find statistically significant differences between groups of genotype pairs when analyzing PTAU levels within each sample group (see Figure 2A,B).
As for CSF TAU levels, AD presented higher levels when compared to healthy and MCI groups. In addition, there were three networks of gene interactions, which involved the mitochondrial regions MT-ND5(13135), MT-DLOOP(194) and MT-DLOOP(152) (Figure 3). For MT-ND5(13135), we found negative epistasis with five genes: MT-COX1(7476), MT-ND3(10172), MT-CYB(15257), MT-CYB(15812), MT-ND5(5633). Results for MT-DLOOP(194) returned positive epistasis with four genes, namely MT-ATP6(8701), MT-COX3(9540), MT-ND4(10873), MT-CYB(15301). Lastly, two positive and one negative epistatic interactions were identified for MT-DLOOP(152). The positive interactions involved MT-COX1(6261) and MT-ND4(10822) and the negative interaction involved MT-CYB(14831).
We also carried out a sex-specific analysis to investigate epistasis between males and females. For PTAU levels, the entire epistasis network was replicated only for female samples, resulting in both interactions MT-RNR1(709) × MT-ATP6(9632) and MT-RNR1(709) × MT-ND4(12083) (p-value = 7.9 × 10 9 ). Considering TAU levels, we did not observe specific effects for females. However, epistasis was observed specifically in men between the pair of variants MT-DLOOP(239) × MT-ND2(4917) (p-value = 8.5 × 10 5 ).
When analyzing CSF TAU levels among sample groups in relation to the genotypes of these three variants, we found statistically significant associations for MT-DLOOP(194) and MT-ND5(13135), but not for MT-DLOOP(152) (Figure 3A–C). For instance, for MT-DLOOP(194), we found that individuals with MCI carrying CC/AA genotypes in this variant and MT-ATP8(8701), respectively, had significantly higher CSF TAU levels when compared to CC/GG genotype carriers (Figure 3D). Data for CC/GG individuals with AD were not available for comparison. This same pattern was observed for CC/TT carriers when analyzing the MT-DLOOP(194) ×MT-COX3(9540) and MT-DLOOP(194) × MT-ND4(10873) epistatic interactions (Figure 3E,F). Lastly, for MT-DLOOP(194), we found significantly higher levels of CSF TAU in MCI patients with CC/GG genotypes for MT-DLOOP(194) and MT-CYB(15301) (Figure 3G).
Regarding the epistatic interactions with MT-ND5(13135), there was no statistical significance in the comparison of carriers of MT-ND2(5633) and MT-ND5(13135) (Figure 3H), but we found higher levels of CSF TAU in healthy and AD individuals with the TT/GG genotype for MT-COX1(7476) and MT-ND5(13135) in comparison to the analyzed pair for these variants (Figure 3I). Carriers of GG/GG for MT-ND3(10172) and MT-ND5(13135) with MCI had lower TAU levels and this same pattern was also seen for carriers of GG/GG in MT-ND5(13135) and MT-CYB(15257) among healthy and AD individuals (Figure 3J,K). No statistical significance was observed in the comparisons for MT-ND5(13135) and MT-CYB(15812) (Figure 3L).

4. Discussion

Mitochondria are organelles crucial for cellular balance and function, being responsible for several pathways and standing out for their role in energy generation through aerobic respiration—the tricarboxylic acid (TCA) cycle and, particularly, oxidative phosphorylation (OXPHOS) [32]. This function is so vital that the human mitochondrial genome (mtgenome or mitogenome) is highly specialized: it contains only 37 genes: 13 encoding proteins, all of which are subunits of the electron transport chain (ETC) complexes where OXPHOS occurs, and the remaining are part of the RNA machinery (22 tRNAs and 2 rRNAs), in addition to non-coding regions, so that all other mitochondrial proteins (over 1000) are encoded by the nucleus [33]. Hence, alterations in these mitochondrial or nuclear genes lead to mitochondrial dysfunction, affecting cellular homeostasis to promote the development of diseases. In this context, neurons would be specially affected, as they consume a large amount of energy, thus being especially dependent on mitochondrial metabolism for energy generation and other functions, such as neurotransmission and neuroplasticity [34,35].
In 2004, a mitochondrial cascade hypothesis was first proposed for late-onset sporadic AD considering that: (i) mitochondrial function decreases with age; (ii) mtDNA damage may be triggered by excessive reactive oxygen species (ROS), which are produced during OXPHOS; and (iii) alterations in mtDNA might reduce ETC efficiency from a basal inherited level [36]. Once the mitochondrial dysfunction reaches a certain threshold, a compensatory response would be induced and some histopathological characteristics of AD would arise as a consequence of this response [37]. Although AD is considered a multifactorial disease, this hypothesis stands out for emphasizing the importance of mtDNA to the development of this type of AD, placing mitochondria in a central position in this process. In addition, as genomic ancestry may play important roles in the development of different diseases, multiple mitochondrial haplogroups have been related to AD in independent studies [38,39].
Notably, in AD, atrophy may occur in the different areas of the brain, but atrophy of the hippocampus (located in the medial temporal lobe) has been traditionally considered a core feature of the disease [40]. In fact, researchers have observed an early divergence of the AD brain model from the normal aging trajectory in the hippocampus, lateral ventricles and amygdala [41]. Interestingly, it has also been demonstrated that volume reduction in AD may start in the medial temporal lobes (although not necessarily the hippocampus) and in the fusiform gyrus at least three years prior to AD progression, spreading to the other lobes before diagnosis [42]. Recently, a study highlighted differences across typical and atypical AD phenotypes in TAU accumulation and atrophy regions, including the lateral temporal lobe [43]. Therefore, the heterogeneous course of this disease should be further explored.
Here, we found DE mitochondrial genes when analyzing RNA-seq data from AD lateral temporal lobe and fusiform gyrus tissues. The lateral temporal lobe (or the lateral surface of the temporal lobe), delimited by superior and inferior temporal sulci and composed of three gyri (superior, middle and inferior temporal gyrus), is responsible for different visual and auditory functions, such as facial recognition, language comprehension and hearing [44,45]. The fusiform gyrus (or occipitotemporal gyrus) is located in the inferior region of the temporal and occipital lobes, being associated with high-level vision functions such as the recognition of faces, bodies and objects, as well as reading [46,47]. In AD, face–name memory—the ability to recognize faces and recall names—is markedly impaired, which could be related to degeneration in such brain regions [48]. This, in turn, could be due to molecular alterations such as genetic mutations and different gene expression levels.
Among the DE genes in the studied tissues, five are transfer RNA (tRNA) genes (MT-TH, MT-TL1, MT-TM, MT-TS2 and MT-TV), which are crucial parts of the mitochondrial translational machinery [49]. Considering that the presence of mutations and the altered expression of mitochondrial genes may affect the functioning of mitochondria, especially in muscular and neuronal tissues, and lead to the onset and progress of different diseases [50], the alteration of tRNA genes is of great interest. The downregulated expression of tRNA genes can reduce translation efficiency and is likely to be associated with protein deficiency, which may be linked to the pathogenesis of AD.
Moreover, in our analyses, 10 of the 15 genes found to be DE in the studied tissues are classified as pseudogenes or isoforms of the following mitochondrial genes: MT-ND1 (MTND1P20, MTND1P21 and MTND1P23), MT-ND2 (MTND2P12 and MTND2P28), MT-ND4 (MTND4P9), MT-ND5 (MTND5P11), MT-ND6 (MTND6P3) and MT-RNR2 (MTRNR2L1 and MTRNR2L2). To date, there are not many studies investigating these specific pseudogenes and isoforms in the global literature. In fact, to the best of our knowledge, this is the first study to explore their expression, with the exception of the MT-RNR2 isoforms MTRNR2L1 and MTRNR2L2—and no previous studies were found on the involvement of MTRNR2L1 with any of these genes or the other genetic interactions shown here. Curiously, the isoform MTRNR2L12 has been suggested as a potential biomarker for early AD-like dementia in individuals with Down Syndrome [51], but it was not DE in our study. Regardless, this highlights the potential role mitochondrial that isoforms might have in AD and other types of dementia.
The MT-RNR2 gene encodes the mitochondrial 16S ribosomal RNA (rRNA), and it is also associated with the production of humanin (HN), a peptide that has been shown to be a neuroprotective factor for AD through the suppression of apoptotic cell death when discovered [52] and that, since then, has been associated with different processes and age-related diseases [53]. Humanin presents 13 isoforms encoded by nuclear MT-RNR2-like genes, such as MTRNR2L1 (HN1) and MTRNR2L2 (HN2) [54]. In the last decade, both of these isoforms have been investigated in different multifactorial diseases, although there are few studies so far.
For instance, a genome-wide association study showed a statistically significant relation of MTRNR2L2 with the progression of Huntington’s Disease, so the role of this humanin isoform may vary among various diseases [55]. In fact, a recent review on humanin by Hazafa et al. [56] reinforced the importance of this mitochondrial-derived peptide and its isoforms in cytoprotection through the regulation of different mechanisms, including mitochondrial pathways, with a potential influence on the development and treatment of multifactorial diseases related to oxidative stress and apoptosis, which comprise neurodegenerative diseases such as AD.
Here, we found MTRNR2L1 to be underexpressed in both lateral temporal lobe experiments and MTRNR2L2 to be overexpressed in the fusiform gyrus of AD patients. Considering the established neuroprotective function of these humanin isoforms, these results suggest a progression of the disease in the lateral temporal lobe, but not in the fusiform gyrus. Notably, we found MTND1P23 to be DE in all three experiments, being overexpressed in both lateral temporal lobe experiments and underexpressed in the fusiform gyrus, which suggests that MTND1P23 might play an important role in the evolution of AD. This is particularly interesting given that all other genes in the lateral temporal lobe of AD patients in the HYA vs. AD analysis were underexpressed, possibly being protective factors for AD. Similarly, it is also possible to hypothesize, for instance, that the overexpression of MTND2P12 may be indicative of AD progression and that the underexpression of MTND6P3 may be a protective factor against neurodegeneration in AD. However, in the GTEx analysis with healthy brain tissues that did not include the lateral temporal lobe or fusiform gyrus, MTND1P23 was overexpressed in all of the explored tissues. Hence, more studies are needed to clarify the possibilities involving these genes.
To further explore the influence of mitochondrial genetics for AD progression, particularly the occurrence of epistasis, we analyzed the ADNI database with whole mtgenome sequencing of AD, MCI and cognitively healthy subjects, as well as AB, PTAU and TAU levels in CSF from these groups.
Interestingly, we found differences in the CSF levels for the three proteins and epistatic interactions between multiple mtDNA variants for PTAU and TAU. For PTAU, the variant is located in the 12S rRNA gene (MT-RNR1) and interacts with variants in Complex I (MT-ND4) and Complex V (MT-ATP6) genes; however, these interactions do not seem to affect PTAU levels in CSF.
For TAU, two variants are located in MT-DLOOP and one variant is located in a Complex I gene (MT-ND5). Of the MT-DLOOP variants, one (152) interacts with variants in genes of Complexes I, III and IV (MT-ND4, MT-CYB and MT-COX1, respectively), but these interactions do not seem to affect TAU levels in CSF. The other MT-DLOOP variant (194) showed interactions with variants in genes of Complexes I, III, IV and V (MT-ND4, MT-CYB, MT-COX3 and MT-ATP8, respectively); the joint presence of certain genotypes of these variants may affect the levels of TAU in CSF for individuals with MCI, increasing these levels, a trend seen for the investigated AD cases. As for the variant located in the Complex I gene, MT-ND5(13135), it presented interactions with variants in genes encoding Complexes I (one variant in MT-ND2 and one in MT-ND3), III (two variants in MT-CYB) and IV (one variant in MT-COX1; notably, specific genotypes of MT-COX1(7476) and MT-CYB(15257) jointly with the GG genotype for MT-ND5(13135) may affect TAU levels in both cognitively healthy and AD individuals, and the same pattern was observed for MT-ND3(10172) in MCI patients. These findings reflect the intricate network of mtDNA epistasis in the progression of AD.
Currently, only a few studies are found in the global literature on mtDNA epistasis in diseases, and most of them focus on mitonuclear interactions, reinforcing the need for a closer look at this phenomenon specifically within the mitochondrial genome. For instance, a recent study by Duarte-Guterman et al. [57] found sex differences in hippocampal volume and greater memory decline in females compared to males, due to CSF tau-pathology being elevated in female carriers of APOE ϵ 4 in the ADNI cohort, corroborating our findings in the sex analysis for the mtDNA epistasis.
Furthermore, a study by Andrews et al. [58] investigated mitonuclear interactions in AD, analyzing associations between mtDNA haplogroups and nuclear-encoded mitochondrial genes for polygenic risk scores of this neurodegenerative disease, and reported both positive and negative epistatic interactions, indicating that epistasis between nuclear and mitochondrial genomes may influence the risk and the age of onset of AD. In this context, to the best of our knowledge, our study is the first to explore epistasis within the mitochondrial genome in AD.

Limitations

We considered p≤ 0.05 as statistically significant after FDR correction, but we acknowledge the recent movement in the scientific community to lower this traditional threshold to 0.005. Thus, we encourage readers to take this into consideration when interpreting our results. In addition, future studies with an increased sample size and/or functional approaches are needed to further validate the associations suggested here.

5. Conclusions

In this exploratory study, by employing an integrative analysis with mitochondrial gene expression and genome-wide epistasis approaches, we identified differentially expressed genes in brain tissues from AD patients and epistatic interactions within the mitochondrial genome with a potential influence on the CSF levels of AD-related proteins, revealing important layers of interactions involving the mitochondrial genetics and molecular alterations with a potential impact on the development and progression of AD. Future investigations with larger cohorts or with functional approaches are encouraged to strengthen these findings.

Author Contributions

Conceptualization, G.C.C. and G.S.d.A.; Data curation, G.C.C. and G.S.d.A.; Formal analysis, G.C.C. and G.S.d.A.; Funding acquisition, Â.R.-d.-S. and G.S.d.A.; Methodology, G.C.C., L.M.B., A.P.S. and G.S.d.A.; Supervision, Â.R.-d.-S. and G.S.d.A.; Writing original draft, G.C.C., A.P.S., Â.R.-d.-S. and G.S.d.A.; Writing review and editing, G.C.C., Â.R.-d.-S. and G.S.d.A. All authors have read and agreed to the published version of the manuscript.

Funding

This research was funded by Rede de Pesquisa em Genômica Populacional Humana (Biocomputacional – Protocol no. 3381/2013/CAPES/Brazil), Coordenação de Aperfeiçoamento de Pessoal de Nível Superior (CAPES/Brazil), Conselho Nacional do Desenvolvimento Científico e Tecnológico (CNPq/Brazil) and Pró-Reitoria de Pesquisa e Pós-Graduação da Universidade Federal do Pará (PROPESP-UFPA/Brazil). Â.R.-d-.S. was supported by CNPq/Productivity: 304413/2015–1); G.S.d.A was supported by Fundação Amazônia Paraense de Amparo à Pesquisa—FAPESPA (No. BJT—2021/658671); G.C.C. was supported by Hydro (Project 4227 Hydro/UFPA/FADESP/Brazil). The funders had no role in the design of the study, collection, analysis, interpretation of the data or writing of the manuscript.

Institutional Review Board Statement

Not applicable.

Informed Consent Statement

Not applicable.

Data Availability Statement

The data from the RNA-Seq experiments are publicly available at Gene Expression Omnibus under accession numbers GSE104704 and GSE125583. The mtDNA data were obtained from the ADNI database (https://adni.loni.usc.edu, accessed on 4 August 2021). The ADNI was launched in 2003 as a public–private partnership, led by Principal Investigator Michael W. Weiner, MD. The primary goal of ADNI has been to test whether serial magnetic resonance imaging (MRI), positron emission tomography (PET), other biological markers and clinical and neuropsychological assessment can be combined to measure the progression of mild cognitive impairment (MCI) and early Alzheimer’s disease (AD). The Principal Investigator of this initiative is Michael W. Weiner, MD, VA Medical Center and University of California—San Francisco. ADNI is a global research effort that actively supports the investigation and development of treatments that slow or stop the progression of AD and subjects have been recruited from over 50 sites across the US and Canada. The overall goal of ADNI is to determine biomarkers for use in Alzheimer’s disease clinical treatment trials. To date, it has three phases: ADNI-1, ADNI-GO and ADNI-2, consisting of cognitively normal (CN) individuals, early mild cognitive impairment (EMCI) to late mild cognitive impairment (LMCI) and dementia or AD. For more information, see http://www.adni-info.org, accessed on 4 August 2021. Institutional review board approval was conducted at each ADNI site. Written informed consent was obtained from all participants or authorized representative.

Acknowledgments

Data collection and sharing for this project was funded by the Alzheimer’s Disease Neuroimaging Initiative (ADNI) (National Institutes of Health Grant U01 AG024904) and DOD ADNI (Department of Defense award number W81XWH-12-2-0012). ADNI is funded by the National Institute on Aging, the National Institute of Biomedical Imaging and Bioengineering and through generous contributions from the following: AbbVie, Alzheimer’s Association; Alzheimer’s Drug Discovery Foundation; Araclon Biotech; BioClinica, Inc.; Biogen; Bristol-Myers Squibb Company; CereSpir, Inc.; Cogstate; Eisai Inc.; Elan Pharmaceuticals, Inc.; Eli Lilly and Company; EuroImmun; F. Hoffmann-La Roche Ltd and its affiliated company Genentech, Inc.; Fujirebio; GE Healthcare; IXICO Ltd.; Janssen Alzheimer Immunotherapy Research & Development, LLC.; Johnson & Johnson Pharmaceutical Research & Development LLC.; Lumosity; Lundbeck; Merck & Co., Inc.; Meso Scale Diagnostics, LLC.; NeuroRx Research; Neurotrack Technologies; Novartis Pharmaceuticals Corporation; Pfizer Inc.; Piramal Imaging; Servier; Takeda Pharmaceutical Company; and Transition Therapeutics. The Canadian Institutes of Health Research is providing funds to support ADNI clinical sites in Canada. Private sector contributions are facilitated by the Foundation for the National Institutes of Health (http://www.fnih.org, accessed on 4 August 2021). The grantee organization is the Northern California Institute for Research and Education, and the study is coordinated by the Alzheimer’s Therapeutic Research Institute at the University of Southern California. ADNI data are disseminated by the Laboratory for Neuroimaging at the University of Southern California.

Conflicts of Interest

The authors declare that they have no competing interests.

References

  1. Oliver, D.; Reddy, P.H. Molecular basis of Alzheimer’s disease: Focus on mitochondria. J. Alzheimer’s Dis. 2019, 72, S95–S116. [Google Scholar] [CrossRef] [PubMed]
  2. Bäckman, L.; Jones, S.; Berger, A.K.; Laukka, E.J.; Small, B. Multiple cognitive deficits during the transition to Alzheimer’s disease. J. Intern. Med. 2004, 256, 195–204. [Google Scholar] [CrossRef] [PubMed]
  3. Bistaffa, E.; Tagliavini, F.; Matteini, P.; Moda, F. Contributions of Molecular and Optical Techniques to the Clinical Diagnosis of Alzheimer’s Disease. Brain Sci. 2020, 10, 815. [Google Scholar] [CrossRef] [PubMed]
  4. 2020 Alzheimer’s disease facts and figures. Alzheimer’s Dement. 2020, 16, 391–460. [CrossRef]
  5. Podlesniy, P.; Llorens, F.; Puigròs, M.; Serra, N.; Sepúlveda-Falla, D.; Schmidt, C.; Hermann, P.; Zerr, I.; Trullas, R. Cerebrospinal Fluid Mitochondrial DNA in Rapid and Slow Progressive Forms of Alzheimer’s Disease. Int. J. Mol. Sci. 2020, 21, 6298. [Google Scholar] [CrossRef]
  6. Tanaka, M.; Török, N.; Vécsei, L. Novel Pharmaceutical Approaches in Dementia. In NeuroPsychopharmacotherapy; Riederer, P., Laux, G., Nagatsu, T., Le, W., Riederer, C., Eds.; Springer International Publishing: Cham, Switzerland, 2020; pp. 1–18. [Google Scholar]
  7. Araújo, G.S.; Souza, M.R.; Oliveira, J.R.M.; Costa, I.G. Random Forest and Gene Networks for Association of SNPs to Alzheimer’s Disease. In Proceedings of the Brazilian Symposium on Bioinformatics, Recife, Brazil, 3–7 November 2013; Springer: Cham, Switzerland, 2013; pp. 104–115. [Google Scholar]
  8. Souza, M.B.R.; Araújo, G.S.; Costa, I.G.; Oliveira, J.R.M. Combined genome-wide CSF Aβ-42’s associations and simple network properties highlight new risk factors for Alzheimer’s disease. J. Mol. Neurosci. 2016, 58, 120–128. [Google Scholar] [CrossRef]
  9. Brito, L.M.; Ribeiro-dos Santos, Â.; Vidal, A.F.; de Araújo, G.S. Differential expression and mirna–gene interactions in early and late mild cognitive impairment. Biology 2020, 9, 251. [Google Scholar] [CrossRef]
  10. Cenini, G.; Voos, W. Mitochondria as potential targets in Alzheimer disease therapy: An update. Front. Pharmacol. 2019, 10, 902. [Google Scholar] [CrossRef]
  11. Delbarba, A.; Abate, G.; Prandelli, C.; Marziano, M.; Buizza, L.; Arce Varas, N.; Novelli, A.; Cuetos, F.; Martínez, C.; Lanni, C.; et al. Mitochondrial alterations in peripheral mononuclear blood cells from Alzheimer’s disease and mild cognitive impairment patients. Oxid. Med. Cell. Longev. 2016, 2016, 5923938. [Google Scholar] [CrossRef] [Green Version]
  12. Zou, T.; Chen, W.; Zhou, X.; Duan, Y.; Ying, X.; Liu, G.; Zhu, M.; Pari, A.; Alimu, K.; Miao, H.; et al. Association of multiple candidate genes with mild cognitive impairment in an elderly Chinese Uygur population in Xinjiang. Psychogeriatrics 2019, 19, 574–583. [Google Scholar] [CrossRef] [Green Version]
  13. Miton, C.M.; Buda, K.; Tokuriki, N. Epistasis and intramolecular networks in protein evolution. Curr. Opin. Struct. Biol. 2021, 69, 160–168. [Google Scholar] [CrossRef] [PubMed]
  14. Wang, H.; Bennett, D.A.; De Jager, P.L.; Zhang, Q.Y.; Zhang, H.Y. Genome-wide epistasis analysis for Alzheimer’s disease and implications for genetic risk prediction. Alzheimer’s Res. Ther. 2021, 13, 1–13. [Google Scholar] [CrossRef] [PubMed]
  15. Escott-Price, V.; Schmidt, K.M. Probability of the Alzheimer’s disease based on common and rare genetic variants. Alzheimer’s Res. Ther. 2021, 13, 140. [Google Scholar] [CrossRef]
  16. Tan, M.S.; Yang, Y.X.; Xu, W.; Wang, H.F.; Tan, L.; Zuo, C.T.; Dong, Q.; Tan, L.; Suckling, J.; Yu, J.T. Associations of Alzheimer’s disease risk variants with gene expression, amyloidosis, tauopathy, and neurodegeneration. Alzheimer’s Res. Ther. 2021, 13, 15. [Google Scholar] [CrossRef] [PubMed]
  17. Barrett, T.; Wilhite, S.E.; Ledoux, P.; Evangelista, C.; Kim, I.F.; Tomashevsky, M.; Marshall, K.A.; Phillippy, K.H.; Sherman, P.M.; Holko, M.; et al. NCBI GEO: Archive for functional genomics data sets—Update. Nucleic Acids Res. 2012, 41, D991–D995. [Google Scholar] [CrossRef] [PubMed] [Green Version]
  18. Lonsdale, J.; Thomas, J.; Salvatore, M.; Phillips, R.; Lo, E.; Shad, S.; Hasz, R.; Walters, G.; Garcia, F.; Young, N.; et al. The genotype-tissue expression (GTEx) project. Nat. Genet. 2013, 45, 580. [Google Scholar] [CrossRef] [PubMed]
  19. Ridge, P.G.; Wadsworth, M.E.; Miller, J.B.; Saykin, A.J.; Green, R.C.; The Alzheimer’s Disease Neuroimaging Initiative; Kauwe, J.S. Assembly of 809 whole mitochondrial genomes with clinical, imaging, and fluid biomarker phenotyping. Alzheimer’s Dement. 2018, 14, 514–519. [Google Scholar] [CrossRef]
  20. Lakatos, A.; Derbeneva, O.; Younes, D.; Keator, D.; Bakken, T.; Lvova, M.; Brandon, M.; Guffanti, G.; Reglodi, D.; Saykin, A.; et al. Association between mitochondrial DNA variations and Alzheimer’s disease in the ADNI cohort. Neurobiol. Aging 2010, 31, 1355–1363. [Google Scholar] [CrossRef] [Green Version]
  21. Swerdlow, R.H.; Hui, D.; Chalise, P.; Sharma, P.; Wang, X.; Andrews, S.J.; Pa, J.; Mahnken, J.D.; Morris, J.; Wilkins, H.M.; et al. Exploratory analysis of mtDNA haplogroups in two Alzheimer’s longitudinal cohorts. Alzheimer’s Dement. 2020, 16, 1164–1172. [Google Scholar] [CrossRef]
  22. Trojanowski, J.Q.; Vandeerstichele, H.; Korecka, M.; Clark, C.M.; Aisen, P.S.; Petersen, R.C.; Blennow, K.; Soares, H.; Simon, A.; Lewczuk, P.; et al. Update on the biomarker core of the Alzheimer’s Disease Neuroimaging Initiative subjects. Alzheimer’s Dement. 2010, 6, 230–238. [Google Scholar] [CrossRef] [Green Version]
  23. Leinonen, R.; Sugawara, H.; Shumway, M.; International Nucleotide Sequence Database Collaboration. The sequence read archive. Nucleic Acids Res. 2010, 39, D19–D21. [Google Scholar] [CrossRef] [PubMed] [Green Version]
  24. Gordon, A.; Hannon, G. Fastx-Toolkit. FASTQ/A Short-Reads Pre-Processing Tools. 2017. Available online: http://hannonlab.cshl.edu/fastx_toolkit (accessed on 4 August 2021).
  25. Ewels, P.; Magnusson, M.; Lundin, S.; Käller, M. MultiQC: Summarize analysis results for multiple tools and samples in a single report. Bioinformatics 2016, 32, 3047–3048. [Google Scholar] [CrossRef] [PubMed] [Green Version]
  26. Bolger, A.M.; Lohse, M.; Usadel, B. Trimmomatic: A flexible trimmer for Illumina sequence data. Bioinformatics 2014, 30, 2114–2120. [Google Scholar] [CrossRef] [PubMed] [Green Version]
  27. Dobin, A.; Davis, C.A.; Schlesinger, F.; Drenkow, J.; Zaleski, C.; Jha, S.; Batut, P.; Chaisson, M.; Gingeras, T.R. STAR: Ultrafast universal RNA-seq aligner. Bioinformatics 2013, 29, 15–21. [Google Scholar] [CrossRef]
  28. Anders, S.; Pyl, P.T.; Huber, W. HTSeq—A Python framework to work with high-throughput sequencing data. Bioinformatics 2015, 31, 166–169. [Google Scholar] [CrossRef]
  29. Robinson, M.D.; McCarthy, D.J.; Smyth, G.K. edgeR: A Bioconductor package for differential expression analysis of digital gene expression data. Bioinformatics 2010, 26, 139–140. [Google Scholar] [CrossRef] [Green Version]
  30. Warde-Farley, D.; Donaldson, S.L.; Comes, O.; Zuberi, K.; Badrawi, R.; Chao, P.; Franz, M.; Grouios, C.; Kazi, F.; Lopes, C.T.; et al. The GeneMANIA prediction server: Biological network integration for gene prioritization and predicting gene function. Nucleic Acids Res. 2010, 38, W214–W220. [Google Scholar] [CrossRef]
  31. Purcell, S.; Neale, B.; Todd-Brown, K.; Thomas, L.; Ferreira, M.A.; Bender, D.; Maller, J.; Sklar, P.; De Bakker, P.I.; Daly, M.J.; et al. PLINK: A tool set for whole-genome association and population-based linkage analyses. Am. J. Hum. Genet. 2007, 81, 559–575. [Google Scholar] [CrossRef] [Green Version]
  32. Cavalcante, G.C.; Magalhães, L.; Ribeiro-dos Santos, Â.; Vidal, A.F. Mitochondrial Epigenetics: Non-Coding RNAs as a Novel Layer of Complexity. Int. J. Mol. Sci. 2020, 21, 1838. [Google Scholar] [CrossRef] [Green Version]
  33. Gammage, P.A.; Frezza, C. Mitochondrial DNA: The overlooked oncogenome? BMC Biol. 2019, 17, 53. [Google Scholar] [CrossRef] [Green Version]
  34. Streck, E.L.; Gonçalves, C.L.; Furlanetto, C.B.; Scaini, G.; Dal-Pizzol, F.; Quevedo, J. Mitochondria and the central nervous system: Searching for a pathophysiological basis of psychiatric disorders. Braz. J. Psychiatry 2014, 36, 156–167. [Google Scholar] [CrossRef] [PubMed] [Green Version]
  35. Cabral-Costa, J.; Kowaltowski, A. Neurological disorders and mitochondria. Mol. Asp. Med. 2020, 71, 100826. [Google Scholar] [CrossRef] [PubMed]
  36. Swerdlow, R.H.; Khan, S.M. A “mitochondrial cascade hypothesis” for sporadic Alzheimer’s disease. Med. Hypotheses 2004, 63, 8–20. [Google Scholar] [CrossRef] [PubMed]
  37. Swerdlow, R.H.; Burns, J.M.; Khan, S.M. The Alzheimer’s disease mitochondrial cascade hypothesis. J. Alzheimer’s Dis. 2010, 20, S265–S279. [Google Scholar] [CrossRef] [PubMed] [Green Version]
  38. Ridge, P.G.; Kauwe, J.S. Mitochondria and Alzheimer’s disease: The role of mitochondrial genetic variation. Curr. Genet. Med. Rep. 2018, 6, 1–10. [Google Scholar] [CrossRef] [PubMed] [Green Version]
  39. Compagnoni, G.M.; Di Fonzo, A.; Corti, S.; Comi, G.P.; Bresolin, N.; Masliah, E. The Role of Mitochondria in Neurodegenerative Diseases: The Lesson from Alzheimer’s Disease and Parkinson’s Disease. Mol. Neurobiol. 2020, 57, 2959–2980. [Google Scholar] [CrossRef] [PubMed]
  40. Halliday, G. Pathology and hippocampal atrophy in Alzheimer’s disease. Lancet Neurol. 2017, 16, 862–864. [Google Scholar] [CrossRef]
  41. Pierrick, C.; Manjón, J.V.; Enrique, L.; Gwenaelle, C. Lifespan Changes of the Human Brain In Alzheimer’s Disease. Sci. Rep. 2019, 9, 3998. [Google Scholar]
  42. Whitwell, J.L. Progression of atrophy in Alzheimer’s disease and related disorders. Neurotox. Res. 2010, 18, 339–346. [Google Scholar] [CrossRef]
  43. Sintini, I.; Graff-Radford, J.; Senjem, M.L.; Schwarz, C.G.; Machulda, M.M.; Martin, P.R.; Jones, D.T.; Boeve, B.F.; Knopman, D.S.; Kantarci, K.; et al. Longitudinal neuroimaging biomarkers differ across Alzheimer’s disease phenotypes. Brain 2020, 143, 2281–2294. [Google Scholar] [CrossRef]
  44. Kiernan, J. Anatomy of the temporal lobe. Epilepsy Res. Treat. 2012, 2012, 176157. [Google Scholar] [CrossRef] [PubMed]
  45. Goldstein, I.S.; Erickson, D.J.; Sleeper, L.A.; Haynes, R.L.; Kinney, H.C. The lateral temporal lobe in early human life. J. Neuropathol. Exp. Neurol. 2017, 76, 424–438. [Google Scholar] [CrossRef] [PubMed] [Green Version]
  46. Palejwala, A.H.; O’Connor, K.P.; Milton, C.K.; Anderson, C.; Pelargos, P.; Briggs, R.G.; Conner, A.K.; O’Donoghue, D.L.; Glenn, C.A.; Sughrue, M.E. Anatomy and white matter connections of the fusiform gyrus. Sci. Rep. 2020, 10, 13489. [Google Scholar] [CrossRef] [PubMed]
  47. Weiner, K.S.; Zilles, K. The anatomical and functional specialization of the fusiform gyrus. Neuropsychologia 2016, 83, 48–62. [Google Scholar] [CrossRef] [PubMed] [Green Version]
  48. Tak, S.H.; Hong, S.H. Face-name memory in Alzheimer’s disease. Geriatr. Nurs. 2014, 35, 290–294. [Google Scholar] [CrossRef] [PubMed]
  49. Salinas-Giegé, T.; Giegé, R.; Giegé, P. tRNA biology in mitochondria. Int. J. Mol. Sci. 2015, 16, 4518–4559. [Google Scholar] [CrossRef] [Green Version]
  50. Garone, C.; Minczuk, M.; D’Souza, A.R. Mitochondrial transcription and translation: Overview. Essays Biochem. 2018, 62, 309–320. [Google Scholar] [CrossRef] [Green Version]
  51. Bik-Multanowski, M.; Pietrzyk, J.J.; Midro, A. MTRNR2L12: A candidate blood marker of early Alzheimer’s disease-like dementia in adults with down syndrome. J. Alzheimer’s Dis. 2015, 46, 145–150. [Google Scholar] [CrossRef] [Green Version]
  52. Hashimoto, Y.; Niikura, T.; Tajima, H.; Yasukawa, T.; Sudo, H.; Ito, Y.; Kita, Y.; Kawasumi, M.; Kouyama, K.; Doyu, M.; et al. A rescue factor abolishing neuronal cell death by a wide spectrum of familial Alzheimer’s disease genes and Aβ. Proc. Natl. Acad. Sci. USA 2001, 98, 6336–6341. [Google Scholar] [CrossRef] [Green Version]
  53. Gong, Z.; Tas, E.; Muzumdar, R. Humanin and age-related diseases: A new link? Front. Endocrinol. 2014, 5, 210. [Google Scholar] [CrossRef] [Green Version]
  54. Bodzioch, M.; Lapicka-Bodzioch, K.; Zapala, B.; Kamysz, W.; Kiec-Wilk, B.; Dembinska-Kiec, A. Evidence for potential functionality of nuclearly-encoded humanin isoforms. Genomics 2009, 94, 247–256. [Google Scholar] [CrossRef] [PubMed] [Green Version]
  55. Moss, D.J.H.; Pardiñas, A.F.; Langbehn, D.; Lo, K.; Leavitt, B.R.; Roos, R.; Durr, A.; Mead, S.; Coleman, A.; Santos, R.D.; et al. Identification of genetic variants associated with Huntington’s disease progression: A genome-wide association study. Lancet Neurol. 2017, 16, 701–711. [Google Scholar] [CrossRef]
  56. Hazafa, A.; Batool, A.; Ahmad, S.; Amjad, M.; Chaudhry, S.N.; Asad, J.; Ghuman, H.F.; Khan, H.M.; Naeem, M.; Ghani, U. Humanin: A mitochondrial-derived peptide in the treatment of apoptosis-related diseases. Life Sci. 2021, 264, 118679. [Google Scholar] [CrossRef] [PubMed]
  57. Duarte-Guterman, P.; Albert, A.Y.; Barha, C.K.; Galea, L.A.M.; on behalf of the Alzheimer’s Disease Neuroimaging Initiative. Sex influences the effects of APOE genotype and Alzheimer’s diagnosis on neuropathology and memory. Psychoneuroendocrinology 2021, 129, 105248. [Google Scholar] [CrossRef] [PubMed]
  58. Andrews, S.J.; Fulton-Howard, B.; Patterson, C.; McFall, G.P.; Gross, A.; Michaelis, E.K.; Goate, A.; Swerdlow, R.H.; Pa, J.; Initiative, A.D.N.; et al. Mitonuclear interactions influence Alzheimer’s disease risk. Neurobiol. Aging 2020, 87, 138.e7–138.e14. [Google Scholar] [CrossRef] [PubMed]
Figure 1. Analyses of the GEO and GTEx samples. (A) Volcano plot of DE analysis for Alzheimer’s disease; the marked dots are differentially expressed mitochondrial DNA genes, while all others are nuclear genes; (B) GTEx biclustering for mtDNA genes in 13 brain tissues; (C) gene–gene interaction network of MTRNR2L1.
Biomedicines 10 00880 g001
Figure 2. Analyses of the CSF PTAU levels and mtDNA variants. On the top left, we show the CSF PTAU levels at baseline for the ADNI cohort. On the top right, we show the epistasis network with statistical significance between mtDNA variants and PTAU CSF levels. The network was made from linear model analysis (p-value ≤ 1.0 × 10 9 ). Wilcoxon test results and distribution of mtDNA genotype pairs in relation to PTAU levels.
Biomedicines 10 00880 g002
Figure 3. Analyses of the CSF TAU levels and mtDNA variants. On the top left, we show the CSF TAU levels at baseline for the ADNI Cohort. On the top right, we show the epistasis interactions between mtDNA variants and TAU levels that reached a linear model (p-value ≤ 1.0 × 10 5 ). Wilcoxon test results and distribution of mtDNA genotype pairs in relation to TAU levels.
Biomedicines 10 00880 g003
Table 1. RNA-seq experiments: number of samples (N) and age range in years.
GEO AccessionBrain TissueGroup/Samples/Age
GSE104704Lateral temporal lobeHealthy young adults8/(42–59)
Healthy elderly adults10/(61–77)
AD cases12/(61–79)
GSE125583Fusiform gyrusHealthy elderly adults70/(71–103)
AD cases219/(60–103)
Table 2. Statistical summary of tissue-specific differential expression analysis of mtDNA genes.
(1) Healthy Young Adults vs. AD Cases—GSE104704
HGNC SymbolGenelogFCFDRExpressionBiotype
MT-TL1ENSG00000209082.1−1.840.0014DowntRNA
MT-TVENSG00000210077.1−2.166.38 × 10 5 DowntRNA
MT-TMENSG00000210112.1−1.930.0002DowntRNA
MT-THENSG00000210176.1−2.070.0025DowntRNA
MT-TS2ENSG00000210184.1−2.120.0018DowntRNA
MTND2P28ENSG00000225630.1−6.960.0014Downpseudogene
MTND1P23ENSG00000225972.15.140.0002Uppseudogene
MTND1P20ENSG00000226794.1−2.040.0481Downpseudogene
MTND1P21ENSG00000235940.1−1.320.0151Downpseudogene
MTND5P11ENSG00000248923.1−2.520.0419Downpseudogene
MTND4P9ENSG00000250050.1−2.180.0302Downpseudogene
MTRNR2L1ENSG00000256618.1−6.920.0050Downprotein coding
(2) Health Elderly Adults vs. AD Cases—GSE104704
HGNC SymbolGenelogFCFDRExpressionBiotype
MTND1P23ENSG00000225972.15.570.0001Uppseudogene
MTND2P12ENSG00000228725.32.490.0158Uppseudogene
MTRNR2L1ENSG00000256618.1−4.190.0430Downprotein coding
(3) Health Elderly Adults vs. AD Cases—GSE125583
HGNC SymbolGenelogFCFDRExpressionBiotype
MTND1P23ENSG00000225972.1−2.131.36 × 10 6 Downpseudogene
MTND6P3ENSG00000254132.1−1.980.02653Downpseudogene
MTRNR2L2ENSG00000271043.13.901.13 × 10 56 Upprotein coding
Publisher’s Note: MDPI stays neutral with regard to jurisdictional claims in published maps and institutional affiliations.

