Abstract
Based on our original RNA sequence-based microRNA (miRNA) signatures of head and neck squamous cell carcinoma (HNSCC), it was revealed that the expression levels of miR-1-3p, miR-206, miR-133a-3p, and miR-133b were significantly suppressed in cancer specimens. Seed sequences of miR-1-3p/miR-206 and miR-133a-3p/miR-133b are identical. Interestingly, miR-1-3p/miR-133a-3p and miR-206/miR-133b are clustered in the human genome. We hypothesized that the genes coordinately controlled by these miRNAs are closely involved in the malignant transformation of HNSCC. Our in silico analysis identified a total of 28 genes that had putative miR-1-3p/miR-133a-3p and miR-206/miR-133b binding sites. Moreover, their expression levels were upregulated in HNSCC tissues. Multivariate Cox regression analyses showed that expression of PFN2 and PSEN1 were independent prognostic factors for patients with HNSCC (p < 0.05). Notably, four miRNAs (i.e., miR-1-3p, miR-206, miR-133a-3p, and miR-133b) directly bound the 3′untranslated region of PFN2 and controlled expression of the gene in HNSCC cells. Overexpression of PFN2 was confirmed in clinical specimens, and its aberrant expression facilitated cancer cell migration and invasion abilities. Our miRNA-based strategy continues to uncover novel genes closely involved in the oncogenesis of HNSCC.
1. Introduction
Head and neck squamous cell carcinoma (HNSCC) is a malignant neoplasm that arises mainly from the mucosa of the oral cavity, pharynx, and larynx [1]. HNSCC is the sixth most common cancer worldwide, with 890,000 new cases and 450,000 deaths in 2018 [2]. Epidemiological studies have shown several risk factors for HNSCC such as consumption of tobacco and alcohol, exposure to environmental pollutants, and infection with human papillomavirus or Epstein–Barr virus [3]. With an increase in the number of HPV-related HNSCC with favorable prognosis, the overall survival rate of HNSCC is improving [4]. However, the prognosis of HPV-negative HNSCC has not improved, even with multidisciplinary treatments combining surgery, irradiation, chemotherapy, molecular targeted agents, and immunotherapy [3,5]. More than 60% of HNSCC cases are at an advanced stage at the time of the first diagnosis [1]. Treatment that combines chemotherapy with radiation therapy or surgical resection is the first option for locally advanced HNSCC patients [6]. Due to the anatomical characteristics of HNSCC, these treatments have a significant impact on the quality of life. Despite the use of invasive procedures, there are many cases resistant to treatment and recurrence or metastasis after treatment is not uncommon [7]. To further improve treatment outcomes, it is necessary to elucidate the molecular biological mechanisms that underlie recurrence and metastasis of HNSCC.
MicroRNA (miRNA) is a type of single-strand, noncoding RNA, and its length is only 18–25 nucleotides [8]. miRNA acts as a negative controller of gene expression in a sequence-dependent manner [8,9]. In human cells, a single species of miRNA can control a vast number of genes, and the expression of a single mRNA is subject to numerous miRNAs [8,10]. Bioinformatic analysis suggested that more than 60% of protein-coding genes are controlled by miRNAs [8,11]. Therefore, aberrant expression of miRNAs likely disrupts intracellular RNA networks. In fact, numerous studies have demonstrated that aberrantly expressed miRNAs are involved in human diseases including various types of cancer [12,13].
Recent advances in nanotechnology have led to the development of drug delivery systems that deliver various drugs to target cancer cells [14]. Many attempts to use miRNAs as pharmaceuticals have been reported so far [15,16]. The advantage of miRNAs as drugs is that one type of miRNA has the potential to control many target genes [15]. Recently, exosomes have been attracting attention as a drug delivery system. Exosomes are a type of cell-derived vesicle characterized as extracellular vesicles. Of particular note, some miRNAs are contained within exosomes and migrate between cells through exosomes [14,17]. The development of new therapies that embed tumor-suppressive miRNAs in exosomes and deliver them to cancer cells is very attractive.
Interestingly, some miRNAs are in close proximity within the human genome. These miRNAs are called clustered miRNAs [18,19]. The clustered miRNAs share a number of properties: (a) they are composed of physically adjacent miRNA genes that are transcribed together in the same orientation, (b) no separate transcriptional units exist between the members of the cluster, and (c) there are no miRNAs in opposite directions [19]. Members of miRNA clusters have been shown to exhibit similar expression levels and often regulate genes and biological functions belonging to the same signaling pathway [20]. Clustered miRNAs work more efficiently than single miRNA genes, because they include numerous miRNA-coding genes [19]. Detailed analysis of clustered miRNAs will be an important topic in future miRNA research.
We have created several miRNA expression signatures of HNSCC that originated in several regions, e.g., maxillary sinus, oral cavity, and hypopharynx [21,22,23]. Analysis of our miRNA signatures of HNSCC revealed that the expression levels of miR-1-3p, miR-206, miR-133a-3p, and miR-133b were significantly downregulated in cancer tissues. Interestingly, miR-1-1-3p/miR-133a-2, miR-133a-1/miR-1-2-3p, and miR-206/miR-133b are clustered miRNAs in the human genome, specifically, 20q13.33, 18q11.2, and 6p12, respectively [24]. Moreover, the seed sequences of miR-1-3p/miR-206 and miR-133a-3p/miR-133b are identical [25]. We hypothesized that searching for genes/molecular pathways commonly controlled by these clustered miRNAs would enhance our understanding of the molecular pathogenesis of HNSCC.
Our analysis revealed that Profilin 2 (PFN2) was directly controlled by miR-1-3p, miR-206, miR-133a-3p, and miR-133b, and its expression was involved in HNSCC pathogenesis. Functional studies demonstrated that aberrant expression of PFN2 facilitated the migratory and invasive abilities in HNSCC cells. Searching for antitumor miRNAs and the target molecules that these miRNAs coordinately control will improve our understanding of HNSCC.
2. Materials and Methods
2.1. Analysis of miRNA Expression in HNSCC
Expression levels of each miRNA in HNSCC clinical specimens was examined based on the miRNA expression signature (GSE184991) and TCGA–HNSC data (TCGA, Firehose Legacy).
Six cDNA libraries obtained from three paired of cancer and normal tissues were sequenced by Next Seq500 (Illumina, San Diego, CA, USA) for miRNA expression signature. The clinical information of three HNSCC patients used for miRNA sequencing are shown in Table S1. All specimens used for our miRNA signature were derived from surgical resection at Chiba University Hospital. Cancer tissues were collected from each primary tumor, and normal tissues were collected from normal mucosa at least 1 cm away from the margins of the primary tumor.
The TCGA–HNSC miRNA sequence expression data were downloaded from cBioportal (https://www.cbioportal.org), accessed on 10 April 2020 [26,27].
2.2. HNSCC Cell Lines and Cell Culture
SAS and Sa3 were purchased originally from the RIKEN BioResource Center (Tsukuba, Ibaraki, Japan). These cell lines were cultured in DMEM medium with 10% fetal bovine serum and antibiotics (i.e., penicillin/streptomycin) The cells were grown in a humidified atmosphere of 5% CO2 and 95% air at 37 °C. The features of the cell lines are shown in Table S2.
2.3. Transfection of Mature miRNAs and siRNAs
The protocol used for transient transfection of miRNAs and siRNAs were described in our previous studies [22,28,29]. All miRNA precursors were transfected at 10 nM, and siRNAs were transfected at 5nM into HNSCC cell lines using RNAiMAX (Invitrogen, Carlsbad, CA, USA). Mock was a group without precursors or siRNAs. Control groups were transfected with the negative control precursor. The reagents used in the analysis are shown in Table S3.
2.4. Functional Assays (Cell Proliferation, Migration, and Invasion) Conducted in HNSCC Cells
The procedures for functional assays (cell proliferation, migration, and invasion assays) in HNSCC cells have been described previously [22,28,29]. Briefly, in proliferation assay, SAS or Sa3 cells were plated at 3.0 × 10³ cells per well in 96-well plates. Cell proliferation was examined by XTT assays (Sigma–Aldrich, St. Louis, MO, USA) 72 h after miRNA/siRNA transfection. For migration and invasion assays, SAS or Sa3 cells at 2.5 × 10⁵ cells per well were transfected in 6-well plates. After 48 h transfection, SAS or Sa3 at 1.0 × 10⁵ cell per well were added into the Corning BioCoatTM cell culture chamber (Corning, Corning, NY, USA) for migration assays or into the Corning BioCoat Matrigel Invasion Chamber for invasion assays. After 48 h, the cells at the bottom of the chamber were counted and analyzed.
2.5. Identification of Putative Targets Controlled by miR-1/miR-133 Clustered miRNAs in HNSCC Cells
The seed sequences of miR-133a/miR-133b and miR-1-3p/miR-206 were confirmed based on miRbase v.22.1 (https://www.mirbase.org, accessed on 10 April 2020) [30].
We selected putative target genes that had both miR-133a/miR-133b- and miR-1-3p/miR-206-binding sites based on TargetScanHuman v.7.2 (http://www.targetscan.org/vert_72/; data downloaded on 10 July 2020) [31]. The clinicopathological analysis of candidate genes were performed using clinical information of TCGA–HNSC obtained from cBioportal (https://www.cbioportal.org), accessed on 10 April 2020 [26,27].
Five-year overall survival rates between the groups were analyzed by log-rank test. In addition, the multivariate statistical technique was performed using Cox’s proportional hazards model. The ç cases were divided into two groups according to the median value of each gene in OncoLnc (http://www.oncolnc.org; accessed on 20 April 2021) [32].
2.6. RNA Extraction and Quantitative Reverse-Transcription PCR (qRT-PCR)
Total RNA was isolated using TRIzol reagent and the PureLink™ RNA Mini Kit (Invitrogen/Thermo Fisher Scientific (Waltham, MA, USA)). Reverse transcription was achieved with the High Capacity cDNA Reverse Transcription Kit (Applied Biosystems, Waltham, MA, USA). We performed qRT-PCR using the StepOnePlus™ Real-Time PCR System (Applied Biosystems). GAPDH was used as the normalized control. Taqman assays (Applied Biosystems) used in this report are shown in Table S3.
2.7. Western Blotting
The procedures for Western blotting have been described previously [22,29,33]. We incubated the membranes with the anti-PFN2 antibody (1:500) overnight at 4 °C and with the secondary antibody for 1 h at room temperature. GAPDH was used as an internal control. The reagents used in the analysis are shown in Table S3. Full blots are shown in Figures S1 and S2.
2.8. Immunostaining
Paraffin sections were obtained from HNSCC cases who received surgical treatment at Chiba University Hospital. The clinical features are shown in Table S4. Specimens were incubated with anti-PFN2 antibody (1:1000) overnight at 4 °C. We incubated samples with secondary antibody for 30 min at room temperature and counterstained them with hematoxylin. The reagents used in the analysis are shown in Table S3.
2.9. Dual Luciferase Reporter Assays
PFN2 DNA sequences including or lacking predicted miRNA-binding sequence were inserted into the psiCHECK-2 vector (C8021; Promega, Madison, WI, USA). Transfection of the purified plasmid vectors into HNSCC cells were performed using Lipofectamine 2000 (Invitrogen) at 50 ng/well. After 48 h of transfection, we conducted dual luciferase reporter assays using the Dual Luciferase Reporter Assay System (Promega). Luminescence data are presented as the Renilla/Firefly luciferase activity ratio.
2.10. Gene Set Enrichment Analysis (GSEA)
To investigate the molecular pathways in HNSCC, GSEA was performed. TCGA–HNSC data were divided into high- and low-expression groups according to the Z-score of the PFN2 expression level. We generated a ranked list of genes by the log2 ratio comparing the expression levels of each gene between the two groups. We uploaded the resultant gene lists into GSEA software [34,35] and applied the Hallmark gene set in The Molecular Signatures Database [34,36].
2.11. Statistical Analysis
JMP Pro 15 (SAS Institute Inc., Cary, NC, USA) was used for statistical analyses. Comparisons between the two groups were assessed by Welch’s t-test. Differences between multiple groups were assessed by Dunnett’s test compared to control group. A p-value < 0.05 was considered statistically significant. Significant differences within the figures are expressed as follows: * p < 0.05, ** p < 0.01, *** p < 0.001, N.S.: not significant. Quantitative data are presented as the means and standard errors.
3. Results
3.1. Expression Levels of miR-1/miR-133 Clustered miRNAs in HNSCC Clinical Specimens
In the human genome, miR-1-1 and miR-133a-2 are located on chromosome 20q13.33, whereas miR-133a-1 and miR-1-2 are located on chromosome 18q11.2, while miR-206 and miR-133b are located on chromosome 6p12.2 (Figure 1A). Throughout the maturation process, miR-133a-3p/miR-133b and miR-1-3p/miR-206 are formed from pre-miRNAs. The seed sequences of miR-133a-3p/miR-133b are identical and the seed sequences of miR-1-3p/miR-206 are identical (Figure 1A).
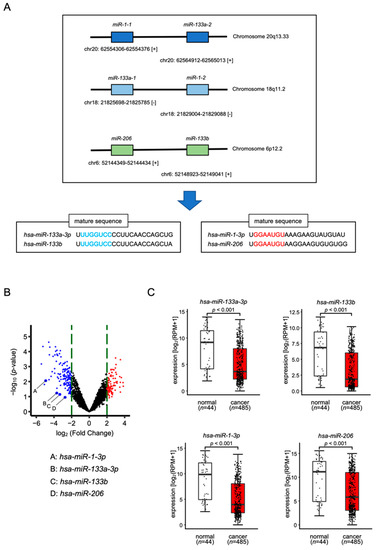
Figure 1.
Expression levels of miR-1/miR-133 clustered miRNAs in HNSCC clinical specimens. (A) The chromosomal location of each microRNA. Mature seed sequences of miR-133a-3p/miR-133b were identical. Mature seed sequences of miR-1-3p/miR-206 were identical. (B) Volcano plot of the miRNA expression signature determined through small RNA sequencing. The log2-fold change (FC) is plotted on the x-axis, and the log10 (p-value) is plotted on the y-axis. The blue points represent the downregulated miRNAs with an absolute log2 FC < −2.0. The red points represent the downregulated miRNAs with an absolute log2 FC > 2.0. (C) The expression levels of miR-133a-3p/miR-133b and miR-1-3p/miR-206 were evaluated in an HNSCC data set from TCGA.
To confirm the expression levels of miR-133a-3p/miR-133b and miR-1-3p/miR-206, we used our HNSCC miRNA expression signature (GSE184991). All were downregulated (the log2 fold-change < −2.0) in HNSCC clinical tissues (Figure 1B). We validated aberrant expression of these miRNAs using the TCGA–HNSC data set. TCGA database analysis showed that all these miRNAs were significantly downregulated in cancer tissues (n = 485) compared with normal tissues (n = 44) (Figure 1C).
3.2. Tumor-Suppressive Functions of miR-1/miR-133 Clustered miRNAs Assessed by Ectopic Expression Assays
To assess the effects of the ectopic expression of miR-133a-3p/miR-133b and miR-1-3p/miR-206, functional assays were performed in two HNSCC cell lines (i.e., SAS and Sa3). The results revealed that transfection of miR-133a-3p/miR-133b and miR-1-3p/miR-206 into HNSCC cell lines significantly suppressed cancer cell proliferation, migration, and invasion (Figure 2A–C). Typical images of cells in migration and invasion assays following miR-133a-3p/miR-133b and miR-1-3p/miR-206 transfection are shown in Figures S3 and S4.
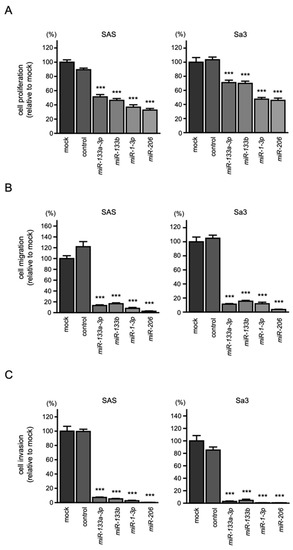
Figure 2.
Tumor-suppressive functions of miR-1/miR-133 clustered miRNAs in HNSCC cells, SAS, and Sa3: (A) cell proliferation assays; (B) cell migration assays; (C) cell invasion assays. (*** p < 0.001).
These findings showed tumor suppressive functions of miR-133a-3p/miR-133b and miR-1-3p/miR-206 in HNSCC.
3.3. Screening for Common Oncogenic Targets of Clustered miR-1/miR-133 miRNAs in HNSCC Cells
We focused on target genes coordinately regulated by tumor suppressive clustered miRNAs (miR-133a-3p/miR-133b and miR-1-3p/miR-206) that were involved in HNSCC molecular pathogenesis and clinical prognosis.
Our strategy for searching for common putative target genes is shown in Figure 3. Based on the TargetScan Human database (release 7.2), we identified a total of 896 genes that had putative miR-133a-3p/miR-133b-binding sites in the 3′-UTR, and a total of 711 genes that had putative miR-1-3p/miR-206-binding sites in the 3′-UTR. Ninety-five of these genes were common putative targets of clustered miRNAs.
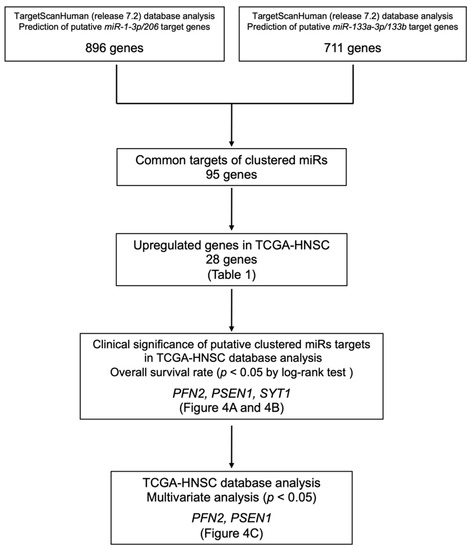
Figure 3.
Our strategy of identification of miR-1/miR-133 clustered miRNAs targets in HNSCC cells.
Next, we confirmed the expression levels of these genes in HNSCC using TCGA–HNSC data. Among these genes, 28 were upregulated in cancer tissues (n = 518) compared to normal tissues (n = 44). We further analyzed these 28 genes as candidates for common oncogenic targets (Table 1).

Table 1.
Twenty-eight candidate target genes regulated by both miR-133a-3p/miR-133b and miR-1-3p/miR-206.
3.4. Clinical Significance of miR-1/miR-133 Clustered miRNAs Targets by TCGA Analysis
We investigated the clinical significance of the 28 common putative targets controlled by miR-133a-3p/miR-133b and miR-1-3p/miR-206 in HNSCC. The expression and 5-year overall survival analysis showed that three genes (PFN2, PSEN1, and SYT1) were significantly upregulated in cancer tissues (Figure 4A), and increased expression levels of each gene were associated with a poorer prognosis in HNSCC patients (log rank test; p < 0.05 and false discovery rate < 0.05; Figure 4B and Table 1).
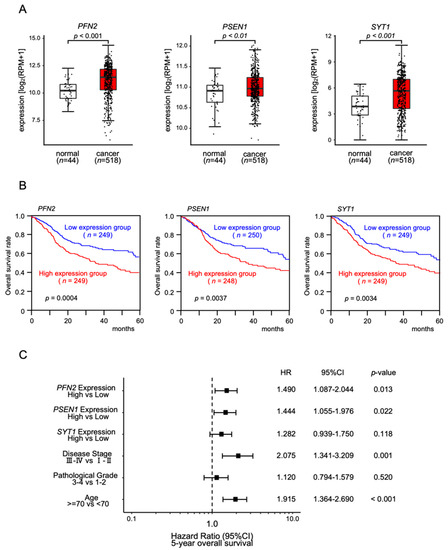
Figure 4.
Clinical significance of PFN2, PSEN1, and SYT1 in HNSCC clinical specimens determined by TCGA–HNSC analysis: (A) comparisons of expression levels of three genes between normal and cancer tissues in TCGA–HNSC; (B) Kaplan–Meier curves of the 5 year overall survival frequencies according to the expression of each gene; (C) forest plot showing the multivariate analysis results for the three target genes (i.e., PFN2, PSEN1, and SYT1) identified by the analysis of the TCGA–HNSC data (HR: hazard ratio; CI: confidence interval).
In addition, Cox proportional hazards regression analysis was performed for 5-year overall survival rates, using each gene expression level (i.e., PFN2, PSEN1, and SYT1), tumor stage, pathological grade, and age as covariates. The multivariate analysis showed that the expression levels of PFN2 and PSEN1 were independent prognostic factors (PFN2: HR 1.490, p < 0.05; PSEN1: HR 1.444, p < 0,05; Figure 4C). These results suggested that PFN2 and PSEN1 were oncogenes related to molecular pathogenesis and clinical prognosis in HNSCC patients.
3.5. Direct Control of PFN2 Expression by All Members of the miR-1/miR-133 Clustered miRNAs in HNSCC Cells
First, qRT-PCR was performed to evaluate whether expression of PFN2 and PSEN1 was controlled by clustered miRNAs (miR-133a-3p/miR-133b and miR-1-3p/miR-206) in HNSCC cells (Figure 5A,B). We found that the expression levels of PFN2 were significantly suppressed by miR-133a-3p/miR-133b and miR-1-3p/miR-206 in HNSCC cells (Figure 5A). On the other hand, transfection of miR-133a-3p/miR-133b reduced the expression level of PSEN1, whereas transfection of miR-1-3p/miR-206 did not significantly suppress the expression (Figure 5B). According to these results, we focused on PFN2 as a common oncogenic target of miR-133a-3p/miR-133b and miR-1-3p/miR-206 in HNSCC.
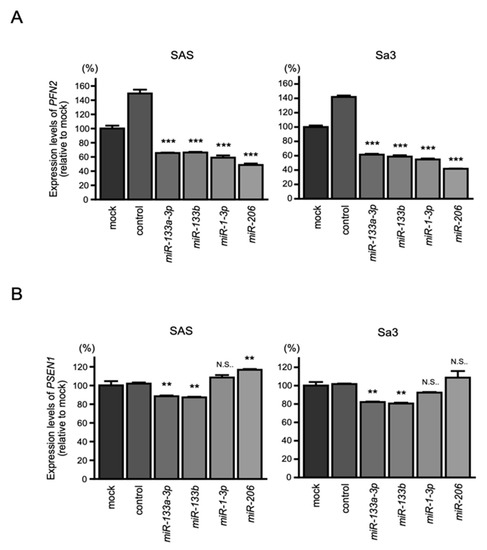
Figure 5.
Expression of PFN2 and PSEN1 controlled by miR-1/miR-133 clustered miRNAs in HNSCC cells: (A) real-time PCR showed significantly reduced expression of PFN2 mRNA 48 h after transfection of each miR-133a-3p/miR-133b and miR-1-3p/miR-206; (B) PSEN1 expression was not repressed by miR-1-3p/miR-206. (** p < 0.01, *** p < 0.001, N.S.: not significant).
Western blotting revealed that the protein levels of PFN2 were reduced by clustered miRNA transfection (Figure 6A). To prove that direct binding between PFN2 and clustered miRNAs was sequence dependent, a dual-luciferase reporter assay was conducted. The luciferase activity was significantly reduced following co-transfection with miR-133a-3p/miR-133b and a vector containing the miR-133a-3p/miR-133b-binding site in the 3′-UTR of PFN2 (Figure 6B). On the other hand, co-transfection with a vector that lacked the sequence of the miR-133a-3p/miR-133b site showed no change in luciferase activity (Figure 6B). Co-transfection with miR-1-3p/miR-206 and a vector containing the miR-1-3p/miR-206-binding site reduced the luciferase activity, but co-transfection with miR-1-3p/miR-206 and a vector lacking the miR-1-3p/miR-206-binding site did not inhibit luciferase activity (Figure 6C).
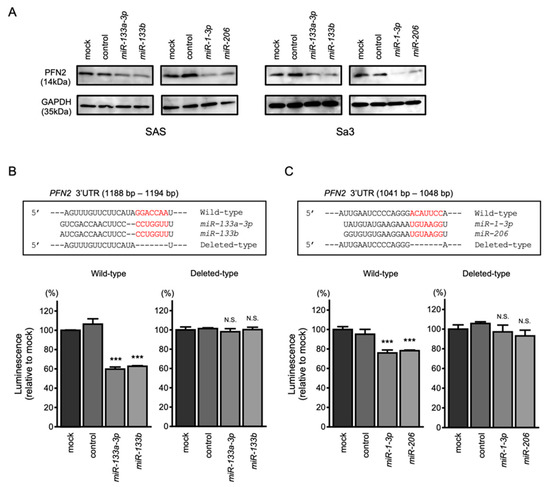
Figure 6.
Direct regulation of PFN2 by miR-1/miR-133 clustered miRNAs in HNSCC cells. (A) Western blot of PFN2 protein 48 h after miR-133a-3p/miR-133b and miR-1-3p/miR-206 transfection of SAS and Sa3 cells. (B) The TargetScan database shows that a single putative miR-133a-3p/miR-133b binding site predicts the 3′-UTR of the PFN2 sequence (upper panel). Dual-luciferase reporter assays after co-transfection of the wild-type or deleted-type vector and miR-133a-3p/miR-133b in Sa3 cells (lower panel). (C) The TargetScan database shows that a single putative miR-1-3p/miR-206 binding site predicts the 3′-UTR in the PFN2 sequence (upper panel). Dual-luciferase reporter assays after co-transfection of the wild-type vector or deleted-type vector and miR-133a-3p/miR-133b in Sa3 cells (lower panel). (*** p < 0.001, N.S.: not significant).
3.6. Overexpression of PFN2 in HNSCC Clinical Specimens
To confirm expression of the PFN2 protein in HNSCC clinical specimens, immunohistochemical staining was performed. Clinical features of four HNSCC cases used for immunostaining are summarized in Table S1. Whereas there was almost no PFN2 expression in the normal epithelium, high expression of PFN2 was detected in cancer lesions in HNSCC (Figure 7).
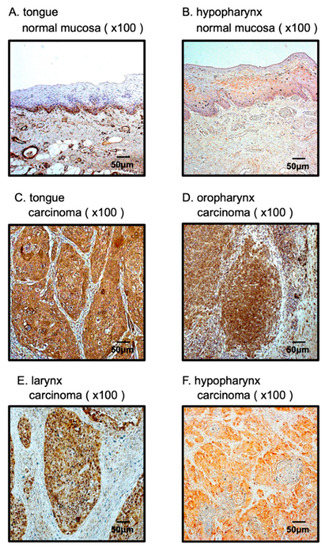
Figure 7.
Overexpression of PFN2 in HNSCC clinical specimens. (A,B) Weak expression was detected in the normal mucosa. (C–F) High expression of PFN2 was detected in the nuclei and/or cytoplasm of HNSCC cancer cells.
3.7. Effects of PFN2 Knockdown on the Proliferation, Migration, and Invasion of HNSCC Cells
To assess the role of PFN2 as an oncogene in HNSCC cells, functional knockdown assays using siRNA were performed. First, we confirmed the inhibitory effects of siRNA by performing qRT-PCR and Western blotting. Two different siRNAs targeting PFN2 (i.e., siPFN2-1 and siPFN2-2) were used for this study. The mRNA and protein levels of PFN2 were significantly inhibited after transfection of siRNAs into HNSCC cell lines (Figure 8A,B).
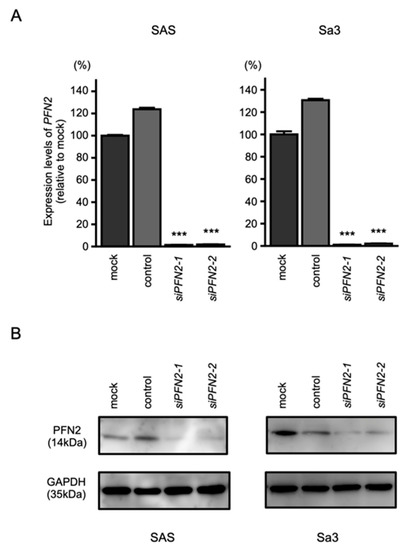
Figure 8.
Knockdown efficiencies of siRNAs targeting PNF2 in HNSCC cell lines. Knockdown efficiencies of PFN2 expression by siPFN2-1 and siPFN2-2 were evaluated by real-time PCR (A) and Western blotting (B) in SAS and Sa3 cells. Expression data for PFN2 (mRNA) and PFN2 (protein) were collected 48 h after siRNAs transfection. (*** p < 0.001).
Then, functional assays using these siRNAs were performed. Knockdown of PFN2 had little effect on cell proliferation in HNSCC cells (Figure 9A). However, cell migration and invasion were significantly suppressed after transfection of siPFN2 in SAS and Sa3 cells (Figure 9B,C). Typical images of cells in migration and invasion assays following siPFN2 transfection are shown in Figures S5 and S6.
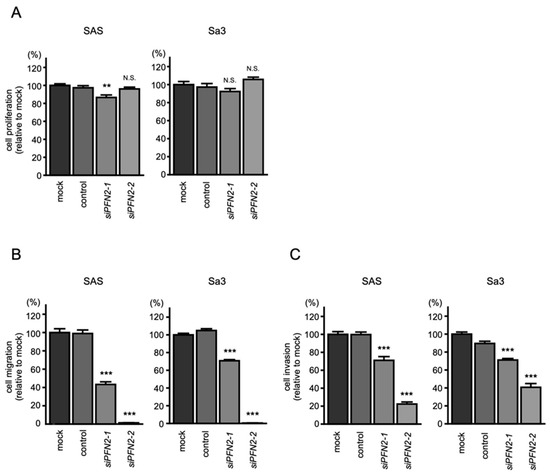
Figure 9.
Functional assays after knockdown of PFN2 in HNSCC cell lines (SAS and Sa3): (A) cell proliferation assays; (B) cell migration assays; (C) cell invasion assays. (** p < 0.01, *** p < 0.001, N.S.: not significant).
3.8. PFN2-Mediated Molecular Pathways in HNSCC Cells
To identify the molecular pathways involving PFN2 in HNSCC, we performed gene set enrichment analysis (GSEA) using TCGA–HNSC RNA-seq data. GSEA analysis revealed that “epithelial–mesenchymal transition” was the most enriched pathway in the PFN2 high expression group (Figure 10 and Table 2). These results suggest that aberrant expression of PFN2 contributes to the malignant phenotype, including migration and/or invasion of HNSCC, through the epithelial–mesenchymal transition pathway.
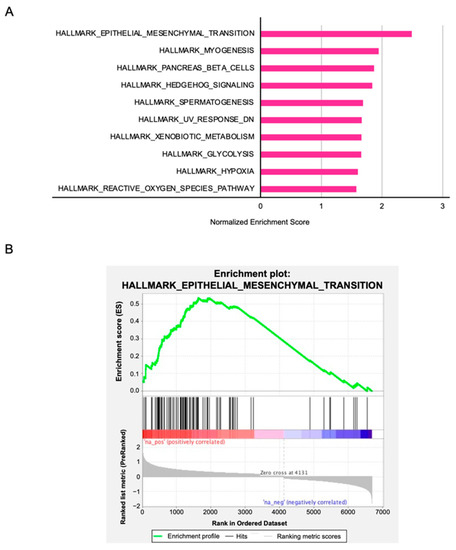
Figure 10.
PFN2-mediated pathways identified by gene set enrichment analysis: (A) the top 10 enriched gene sets in the high PFN2 expression group; (B) enrichment plot of “epithelial–mesenchymal transition”.
Table 2.
The top 10 enriched gene sets in the high PFN2 expression group.
4. Discussion
Even when various strategies are used to treat HNSCC patients, their prognosis is still poor due to the high rate of recurrence and metastasis [3,7]. Unfortunately, combination therapy with EGFR inhibitor or PD-L1 inhibitor has not achieved satisfactory therapeutic results [37,38]. With the advent of immune checkpoint inhibitors, treatment options for recurrent or metastatic cases have increased, but their efficacy is limited [39,40]. Despite vigorous RNA sequence analysis using samples from patients with HNSCC, the search for therapeutic target molecules for HNSCC has not fully succeeded [41], with a few exceptions [42,43].
We are continuing tumor-suppressive miRNA-based analysis to explore prognostic markers and therapeutic targets in HNSCC [21,23,29,44]. Our previous studies showed that miR-143 and miR-145 functioned as tumor-suppressive miRNAs in a wide range of cancers [45,46,47,48]. Notably, they are clustered miRNAs on the human chromosome at region 5q31 [45,46]. Our studies demonstrated that Golgi membrane protein 1 (GOLM1) and hexokinase-2 (HK2) were directly controlled by miR-143-3p and miR-145-5p in prostate cancer and renal cell carcinoma, respectively [45,46]. Further study showed that the MET proto-oncogene was coordinately regulated by miR-23b and miR-27b clustered miRNAs in HNSCC cells [49]. Clustered miRNAs regulate one gene through different seed sequences. Continuous and genome-wide analyses of clustered miRNAs are essential to explain the biological implications of clustered miRNAs on the human genome.
Analysis of our original miRNA expression signatures in several cancers, including HNSCC showed that members of the miR-1/133 clustered miRNAs were downregulated in cancer tissues [21,23,50]. Downregulation of each miRNA in the miR-1/miR-133 cluster was confirmed by TCGA–HNSC database analysis. Originally, miR-1/miR-133 clustered miRNAs were discovered through their roles involved in the development of skeletal and cardiac muscles, called “myomiR” [51]. In cancer research, downregulation of miR-1/miR-133 clustered miRNAs were reported in a wide range of cancers, and their functional analyses showed that these miRNAs acted as tumor-suppressive miRNAs [21]. Therefore, the search for oncogenes and oncogenic pathways controlled by each miRNA is being vigorously carried out [52,53,54].
In this study, a total of 28 genes were identified as putative targets of miR-1/miR-133 clustered miRNAs. Among these targets, we identified PFN2 as a gene directly controlled by all members of miR-1/miR-133 clustered miRNAs in HNSCC cells. Our present analysis showed that aberrantly expressed PFN2 facilitated cancer cell migration and invasion and was closely involved in the malignant phenotypes of HNSCC.
Profilin is an actin-binding protein that forms an ATP-actin-PFN complex. It recruits monomeric actin to the barbed end of actin filaments and it contributes to elongation [55]. In mammals, profilin is constituted by four members (e.g., PFN1, PFN2, PFN3, and PFN4); PFN1 and PFN2 are the most common types of profilins [56].
Several studies have reported that PFN2 expression is involved in malignant transformation of cancer cells [57,58,59]. In triple-negative breast cancer (TNBC), high expression of PFN2 was related to a poorer prognosis (10-year overall survival and relapse-free survival) [58]. In esophageal squamous cell carcinoma (ESCC), PFN2 protein expression was markedly increased gradually from low-grade intraepithelial neoplasia to ESCC, and high expression was positively correlated with the depth of invasion and lymph node metastasis [57]. A recent study reported that PFN2 is involved in small cell lung cancer metastasis and angiogenesis through exosomes [60].
Transforming growth factor-β (TGF-β) signaling induces cancer cell development and progression [61]. Expression of PFN2 induced the transactivation of Smad2 and Smad3, and these transmission factors enhanced TGF-β-induced EMT and angiogenesis in lung cancer [59]. PFN2 overexpression reduced epithelial markers and increased mesenchymal markers in several cancers [57,58]. These results suggest that PFN2 promotes tumor aggressiveness via EMT. Our present study showed that PFN2 contributes to the malignant phenotype in HNSCC through the EMT pathway, and these results are consistent with previous reports.
There are other reports that miRNAs control the expression of PFN2 [62,63,64]. In lung cancer cells, miR-30a-5p negatively regulates PFN2 and inhibited EMT and invasion [62]. In breast cancer, miR-150-5p suppressed PFN2 in a sequence-dependent manner, and the long non-coding RNA FOXD2 adjacent the opposite strand of RNA1 (FOXD2-AS1)/miR-150-5p/PFN2 axis regulated malignancy and tumorigenesis [63]. In osteosarcoma cell lines, miR-140-5p repressed PFN2 [64]. lncRNA TUG1 was a sponge for miR-140-5p to isolate PFN2, inducing cell progression and metastasis [64]. Interestingly, these miRNAs were downregulated in HNSCC tissues [65,66,67], and these events might coordinately enhance expression of PFN2 in HNSCC cells. The finding in this report that the tumor-suppressive clustered miRNAs, miR-1/133 cluster, directly regulated PFN2 in HNSCC cells is attractive and novel. In this study, two cell lines were used to verify the importance of miR-1/miR-133 clustered miRNAs/PFN2 axes for malignant transformation of HNSCC. In order to test our hypothesis, in vivo (mouse model) experiments are indispensable.
5. Conclusions
Analysis of miRNA expression signatures of HNSCC showed that all members of the miR-1/miR-133 miRNA cluster (e.g., miR-1-3p, miR-206, miR-133a-3p, and miR-133b) were frequently downregulated in cancer tissues. TCGA database analysis confirmed that these miRNAs were significantly reduced in cancer tissues. Ectopic expression assays demonstrated that these miRNAs acted as antitumor miRNAs in HNSCC cells. A combination of in silico analyses and luciferase reporter assays revealed that PFN2 was directly controlled by all members of the miR-1/miR-133 cluster in HNSCC cells. Expression of PFN2 was closely involved in the prognosis of patients with HNSCC. Moreover, aberrant expression of PFN2 facilitated cancer cell migration and invasion. Those abilities might be controlled by EMT pathways. Our tumor-suppressive miRNA-based strategy thus provides novel insights, contributing to our overall understanding of the molecular pathogenesis of HNSCC.
Supplementary Materials
The following supporting information can be downloaded at: https://www.mdpi.com/article/10.3390/biomedicines10030663/s1, Figure S1: Full blots of Figure 6A; Figure S2: Full blots of Figure 8B; Figure S3: Photomicrographs of cells in migration assays following miR-133a-3p/miR-133b or miR-1-3p/miR-206 transfection of HNSCC cells; Figure S4: Photomicrographs of cells in invasion assays following miR-133a-3p/miR-133b or miR-1-3p/miR-206 transfection of HNSCC cells; Figure S5: Photomicrographs of cells in migration assays following siPFN2 transfection of HNSCC cells; Figure S6: Photomicrographs of cells in invasion assays following siPFN2 transfection of HNSCC cells; Table S1: Clinical features of three HNSCC patients for miRNA expression signature; Table S2: Features of HNSCC cell lines; Table S3: Reagents used in this study; Table S4: Clinical features of four HNSCC cases used for immunohistochemical staining.
Author Contributions
Conceptualization, N.S. and S.A.; methodology, N.S., S.A. and N.N.; formal analysis, S.A. and N.N.; investigation, S.A., A.K. and C.M.; resources, T.K., N.K. and M.K.; data curation, S.A. and A.K.; writing—original draft preparation, N.S. and S.A.; writing—review and editing, N.N., K.U. and T.H.; visualization, S.A. and A.K.; supervision, K.U. and T.H.; project administration, N.S.; funding acquisition, T.K., N.K. and M.K. All authors have read and agreed to the published version of the manuscript.
Funding
This study was supported by JSPS KAKENHI (grant numbers: 19K09863, 19K18759, and 21K09577).
Institutional Review Board Statement
The study was conducted according to the Declaration of Helsinki and approved by the Bioethics Committee of Chiba University (approval number: 915, 11 July 2021).
Informed Consent Statement
Informed consent was obtained from all subjects involved in the study.
Data Availability Statement
Our expression data were deposited in the GEO database (accession number: GSE189290).
Acknowledgments
The results shown here are in part based upon data generated by the TCGA Research Network: https://www.cancer.gov/tcga (accessed on 10 April 2020).
Conflicts of Interest
N.N. is an employee of MSD K.K., a subsidiary of Merck & Co., Inc., and reports personal fees from MSD K.K. outside of this study.
References
- Chow, L.Q.M. Head and Neck Cancer. N. Engl. J. Med. 2020, 382, 60–72. [Google Scholar] [CrossRef] [PubMed]
- Ferlay, J.; Colombet, M.; Soerjomataram, I.; Mathers, C.; Parkin, D.M.; Piñeros, M.; Znaor, A.; Bray, F. Estimating the global cancer incidence and mortality in 2018: GLOBOCAN sources and methods. Int. J. Cancer 2019, 144, 1941–1953. [Google Scholar] [CrossRef] [PubMed]
- Johnson, D.E.; Burtness, B.; Leemans, C.R.; Lui, V.W.Y.; Bauman, J.E.; Grandis, J.R. Head and neck squamous cell carcinoma. Nat. Rev. Dis. Primers 2020, 6, 92. [Google Scholar] [CrossRef] [PubMed]
- Pulte, D.; Brenner, H. Changes in survival in head and neck cancers in the late 20th and early 21st century: A period analysis. Oncologist 2010, 15, 994–1001. [Google Scholar] [CrossRef] [PubMed]
- Chaturvedi, A.K.; Engels, E.A.; Pfeiffer, R.M.; Hernandez, B.Y.; Xiao, W.; Kim, E.; Jiang, B.; Goodman, M.T.; Sibug-Saber, M.; Cozen, W.; et al. Human papillomavirus and rising oropharyngeal cancer incidence in the United States. J. Clin. Oncol. 2011, 29, 4294–4301. [Google Scholar] [CrossRef]
- National Comprehensive Cancer Network. Head and Neck Cancers (Version 1.2022). Available online: https://www.nccn.org/professionals/physician_gls/pdf/head-and-neck.pdf (accessed on 1 February 2022).
- Braakhuis, B.J.; Brakenhoff, R.H.; Leemans, C.R. Treatment choice for locally advanced head and neck cancers on the basis of risk factors: Biological risk factors. Ann. Oncol. 2012, 23 (Suppl. S10), x173–x177. [Google Scholar] [CrossRef] [PubMed]
- Ha, M.; Kim, V.N. Regulation of microRNA biogenesis. Nat. Rev. Mol. Cell Biol. 2014, 15, 509–524. [Google Scholar] [CrossRef] [PubMed]
- Gebert, L.F.R.; MacRae, I.J. Regulation of microRNA function in animals. Nat. Rev. Mol. Cell Biol. 2019, 20, 21–37. [Google Scholar] [CrossRef]
- He, L.; Hannon, G.J. MicroRNAs: Small RNAs with a big role in gene regulation. Nat. Rev. Genet 2004, 5, 522–531. [Google Scholar] [CrossRef] [PubMed]
- Friedman, R.C.; Farh, K.K.; Burge, C.B.; Bartel, D.P. Most mammalian mRNAs are conserved targets of microRNAs. Genome Res. 2009, 19, 92–105. [Google Scholar] [CrossRef]
- Lin, S.; Gregory, R.I. MicroRNA biogenesis pathways in cancer. Nat. Rev. Cancer 2015, 15, 321–333. [Google Scholar] [CrossRef] [PubMed]
- Rupaimoole, R.; Slack, F.J. MicroRNA therapeutics: Towards a new era for the management of cancer and other diseases. Nat. Rev. Drug Discov. 2017, 16, 203–222. [Google Scholar] [CrossRef] [PubMed]
- Moon, B.; Chang, S. Exosome as a Delivery Vehicle for Cancer Therapy. Cells 2022, 11, 316. [Google Scholar] [CrossRef] [PubMed]
- Lai, X.; Eberhardt, M.; Schmitz, U.; Vera, J. Systems biology-based investigation of cooperating microRNAs as monotherapy or adjuvant therapy in cancer. Nucleic Acids Res. 2019, 47, 7753–7766. [Google Scholar] [CrossRef] [PubMed]
- Zhang, Z.; Huang, Q.; Yu, L.; Zhu, D.; Li, Y.; Xue, Z.; Hua, Z.; Luo, X.; Song, Z.; Lu, C.; et al. The Role of miRNA in Tumor Immune Escape and miRNA-Based Therapeutic Strategies. Front. Immunol. 2021, 12, 807895. [Google Scholar] [CrossRef] [PubMed]
- Sun, Z.; Shi, K.; Yang, S.; Liu, J.; Zhou, Q.; Wang, G.; Song, J.; Li, Z.; Zhang, Z.; Yuan, W. Effect of exosomal miRNA on cancer biology and clinical applications. Mol. Cancer 2018, 17, 147. [Google Scholar] [CrossRef] [PubMed]
- Kabekkodu, S.P.; Shukla, V.; Varghese, V.K.; Souza, J.D.; Chakrabarty, S.; Satyamoorthy, K. Clustered miRNAs and their role in biological functions and diseases. Biol. Rev. Camb. Philos. Soc. 2018, 93, 1955–1986. [Google Scholar] [CrossRef] [PubMed]
- Kabekkodu, S.P.; Shukla, V.; Varghese, V.K.; Adiga, D.; Vethil Jishnu, P.; Chakrabarty, S.; Satyamoorthy, K. Cluster miRNAs and cancer: Diagnostic, prognostic and therapeutic opportunities. Wiley Interdiscip. Rev. RNA 2020, 11, e1563. [Google Scholar] [CrossRef] [PubMed]
- Mendes, N.D.; Freitas, A.T.; Sagot, M.F. Current tools for the identification of miRNA genes and their targets. Nucleic Acids Res. 2009, 37, 2419–2433. [Google Scholar] [CrossRef] [PubMed]
- Nohata, N.; Hanazawa, T.; Kikkawa, N.; Sakurai, D.; Sasaki, K.; Chiyomaru, T.; Kawakami, K.; Yoshino, H.; Enokida, H.; Nakagawa, M.; et al. Identification of novel molecular targets regulated by tumor suppressive miR-1/miR-133a in maxillary sinus squamous cell carcinoma. Int. J. Oncol. 2011, 39, 1099–1107. [Google Scholar] [CrossRef] [PubMed]
- Oshima, S.; Asai, S.; Seki, N.; Minemura, C.; Kinoshita, T.; Goto, Y.; Kikkawa, N.; Moriya, S.; Kasamatsu, A.; Hanazawa, T.; et al. Identification of Tumor Suppressive Genes Regulated by miR-31-5p and miR-31-3p in Head and Neck Squamous Cell Carcinoma. Int. J. Mol. Sci. 2021, 22, 6199. [Google Scholar] [CrossRef] [PubMed]
- Fukumoto, I.; Kinoshita, T.; Hanazawa, T.; Kikkawa, N.; Chiyomaru, T.; Enokida, H.; Yamamoto, N.; Goto, Y.; Nishikawa, R.; Nakagawa, M.; et al. Identification of tumour suppressive microRNA-451a in hypopharyngeal squamous cell carcinoma based on microRNA expression signature. Br. J. Cancer 2014, 111, 386–394. [Google Scholar] [CrossRef] [PubMed]
- Nohata, N.; Hanazawa, T.; Enokida, H.; Seki, N. microRNA-1/133a and microRNA-206/133b clusters: Dysregulation and functional roles in human cancers. Oncotarget 2012, 3, 9–21. [Google Scholar] [CrossRef] [PubMed]
- Chen, J.F.; Mandel, E.M.; Thomson, J.M.; Wu, Q.; Callis, T.E.; Hammond, S.M.; Conlon, F.L.; Wang, D.Z. The role of microRNA-1 and microRNA-133 in skeletal muscle proliferation and differentiation. Nat. Genet. 2006, 38, 228–233. [Google Scholar] [CrossRef] [PubMed]
- Cerami, E.; Gao, J.; Dogrusoz, U.; Gross, B.E.; Sumer, S.O.; Aksoy, B.A.; Jacobsen, A.; Byrne, C.J.; Heuer, M.L.; Larsson, E.; et al. The cBio cancer genomics portal: An open platform for exploring multidimensional cancer genomics data. Cancer Discov. 2012, 2, 401–404. [Google Scholar] [CrossRef] [PubMed]
- Gao, J.; Aksoy, B.A.; Dogrusoz, U.; Dresdner, G.; Gross, B.; Sumer, S.O.; Sun, Y.; Jacobsen, A.; Sinha, R.; Larsson, E.; et al. Integrative analysis of complex cancer genomics and clinical profiles using the cBioPortal. Sci. Signal. 2013, 6, pl1. [Google Scholar] [CrossRef] [PubMed]
- Hozaka, Y.; Seki, N.; Tanaka, T.; Asai, S.; Moriya, S.; Idichi, T.; Wada, M.; Tanoue, K.; Kawasaki, Y.; Mataki, Y.; et al. Molecular Pathogenesis and Regulation of the miR-29-3p-Family: Involvement of ITGA6 and ITGB1 in Intra-Hepatic Cholangiocarcinoma. Cancers 2021, 13, 2804. [Google Scholar] [CrossRef] [PubMed]
- Koma, A.; Asai, S.; Minemura, C.; Oshima, S.; Kinoshita, T.; Kikkawa, N.; Koshizuka, K.; Moriya, S.; Kasamatsu, A.; Hanazawa, T.; et al. Impact of Oncogenic Targets by Tumor-Suppressive miR-139-5p and miR-139-3p Regulation in Head and Neck Squamous Cell Carcinoma. Int. J. Mol. Sci. 2021, 22, 9947. [Google Scholar] [CrossRef]
- Kozomara, A.; Birgaoanu, M.; Griffiths-Jones, S. miRBase: From microRNA sequences to function. Nucleic Acids Res. 2019, 47, D155–D162. [Google Scholar] [CrossRef] [PubMed]
- Agarwal, V.; Bell, G.W.; Nam, J.W.; Bartel, D.P. Predicting effective microRNA target sites in mammalian mRNAs. Elife 2015, 4, e05005. [Google Scholar] [CrossRef] [PubMed]
- Anaya, J. OncoLnc: Linking TCGA survival data to mRNAs, miRNAs, and lncRNAs. PeerJ. Comput. Sci. 2016, 2, e67. [Google Scholar] [CrossRef]
- Hozaka, Y.; Kita, Y.; Yasudome, R.; Tanaka, T.; Wada, M.; Idichi, T.; Tanabe, K.; Asai, S.; Moriya, S.; Toda, H.; et al. RNA-Sequencing Based microRNA Expression Signature of Colorectal Cancer: The Impact of Oncogenic Targets Regulated by miR-490-3p. Int. J. Mol. Sci. 2021, 22, 9876. [Google Scholar] [CrossRef]
- Subramanian, A.; Tamayo, P.; Mootha, V.K.; Mukherjee, S.; Ebert, B.L.; Gillette, M.A.; Paulovich, A.; Pomeroy, S.L.; Golub, T.R.; Lander, E.S.; et al. Gene set enrichment analysis: A knowledge-based approach for interpreting genome-wide expression profiles. Proc. Natl. Acad. Sci. USA 2005, 102, 15545–15550. [Google Scholar] [CrossRef]
- Mootha, V.K.; Lindgren, C.M.; Eriksson, K.F.; Subramanian, A.; Sihag, S.; Lehar, J.; Puigserver, P.; Carlsson, E.; Ridderstråle, M.; Laurila, E.; et al. PGC-1alpha-responsive genes involved in oxidative phosphorylation are coordinately downregulated in human diabetes. Nat. Genet. 2003, 34, 267–273. [Google Scholar] [CrossRef] [PubMed]
- Liberzon, A.; Subramanian, A.; Pinchback, R.; Thorvaldsdóttir, H.; Tamayo, P.; Mesirov, J.P. Molecular signatures database (MSigDB) 3.0. Bioinformatics 2011, 27, 1739–1740. [Google Scholar] [CrossRef]
- Gillison, M.L.; Trotti, A.M.; Harris, J.; Eisbruch, A.; Harari, P.M.; Adelstein, D.J.; Jordan, R.C.K.; Zhao, W.; Sturgis, E.M.; Burtness, B.; et al. Radiotherapy plus cetuximab or cisplatin in human papillomavirus-positive oropharyngeal cancer (NRG Oncology RTOG 1016): A randomised, multicentre, non-inferiority trial. Lancet 2019, 393, 40–50. [Google Scholar] [CrossRef]
- Cohen, E.; Ferris, R.; Psyrri, A.; Haddad, R.; Tahara, M.; Bourhis, J.; Harrington, K.; Chang, P.-H.; Lin, J.-C.; Razaq, M.; et al. Primary results of the phase III JAVELIN head & neck 100 trial: Avelumab plus chemoradiotherapy (CRT) followed by avelumab maintenance vs CRT in patients with locally advanced squamous cell carcinoma of the head and neck (LA SCCHN). Ann. Oncol. 2020, 31 (Suppl. S4), S599–S628. [Google Scholar]
- Ferris, R.L.; Blumenschein, G., Jr.; Fayette, J.; Guigay, J.; Colevas, A.D.; Licitra, L.; Harrington, K.; Kasper, S.; Vokes, E.E.; Even, C.; et al. Nivolumab for Recurrent Squamous-Cell Carcinoma of the Head and Neck. N. Engl. J. Med. 2016, 375, 1856–1867. [Google Scholar] [CrossRef] [PubMed]
- Burtness, B.; Harrington, K.J.; Greil, R.; Soulières, D.; Tahara, M.; de Castro, G., Jr.; Psyrri, A.; Basté, N.; Neupane, P.; Bratland, Å.; et al. Pembrolizumab alone or with chemotherapy versus cetuximab with chemotherapy for recurrent or metastatic squamous cell carcinoma of the head and neck (KEYNOTE-048): A randomised, open-label, phase 3 study. Lancet 2019, 394, 1915–1928. [Google Scholar] [CrossRef]
- Comprehensive genomic characterization of head and neck squamous cell carcinomas. Nature 2015, 517, 576–582. [CrossRef]
- Ho, A.L.; Brana, I.; Haddad, R.; Bauman, J.; Bible, K.; Oosting, S.; Wong, D.J.; Ahn, M.J.; Boni, V.; Even, C.; et al. Tipifarnib in Head and Neck Squamous Cell Carcinoma With HRAS Mutations. J. Clin. Oncol. 2021, 39, 1856–1864. [Google Scholar] [CrossRef]
- Soulières, D.; Faivre, S.; Mesía, R.; Remenár, É.; Li, S.H.; Karpenko, A.; Dechaphunkul, A.; Ochsenreither, S.; Kiss, L.A.; Lin, J.C.; et al. Buparlisib and paclitaxel in patients with platinum-pretreated recurrent or metastatic squamous cell carcinoma of the head and neck (BERIL-1): A randomised, double-blind, placebo-controlled phase 2 trial. Lancet Oncol. 2017, 18, 323–335. [Google Scholar] [CrossRef]
- Koshizuka, K.; Hanazawa, T.; Kikkawa, N.; Arai, T.; Okato, A.; Kurozumi, A.; Kato, M.; Katada, K.; Okamoto, Y.; Seki, N. Regulation of ITGA3 by the anti-tumor miR-199 family inhibits cancer cell migration and invasion in head and neck cancer. Cancer Sci. 2017, 108, 1681–1692. [Google Scholar] [CrossRef]
- Yoshino, H.; Enokida, H.; Itesako, T.; Kojima, S.; Kinoshita, T.; Tatarano, S.; Chiyomaru, T.; Nakagawa, M.; Seki, N. Tumor-suppressive microRNA-143/145 cluster targets hexokinase-2 in renal cell carcinoma. Cancer Sci. 2013, 104, 1567–1574. [Google Scholar] [CrossRef]
- Kojima, S.; Enokida, H.; Yoshino, H.; Itesako, T.; Chiyomaru, T.; Kinoshita, T.; Fuse, M.; Nishikawa, R.; Goto, Y.; Naya, Y.; et al. The tumor-suppressive microRNA-143/145 cluster inhibits cell migration and invasion by targeting GOLM1 in prostate cancer. J. Hum. Genet. 2014, 59, 78–87. [Google Scholar] [CrossRef]
- Yamada, Y.; Koshizuka, K.; Hanazawa, T.; Kikkawa, N.; Okato, A.; Idichi, T.; Arai, T.; Sugawara, S.; Katada, K.; Okamoto, Y.; et al. Passenger strand of miR-145-3p acts as a tumor-suppressor by targeting MYO1B in head and neck squamous cell carcinoma. Int. J. Oncol. 2018, 52, 166–178. [Google Scholar] [CrossRef]
- Sanada, H.; Seki, N.; Mizuno, K.; Misono, S.; Uchida, A.; Yamada, Y.; Moriya, S.; Kikkawa, N.; Machida, K.; Kumamoto, T.; et al. Involvement of Dual Strands of miR-143 (miR-143-5p and miR-143-3p) and Their Target Oncogenes in the Molecular Pathogenesis of Lung Adenocarcinoma. Int. J. Mol. Sci. 2019, 20, 4482. [Google Scholar] [CrossRef]
- Fukumoto, I.; Koshizuka, K.; Hanazawa, T.; Kikkawa, N.; Matsushita, R.; Kurozumi, A.; Kato, M.; Okato, A.; Okamoto, Y.; Seki, N. The tumor-suppressive microRNA-23b/27b cluster regulates the MET oncogene in oral squamous cell carcinoma. Int. J. Oncol. 2016, 49, 1119–1129. [Google Scholar] [CrossRef]
- Yoshino, H.; Chiyomaru, T.; Enokida, H.; Kawakami, K.; Tatarano, S.; Nishiyama, K.; Nohata, N.; Seki, N.; Nakagawa, M. The tumour-suppressive function of miR-1 and miR-133a targeting TAGLN2 in bladder cancer. Br. J. Cancer 2011, 104, 808–818. [Google Scholar] [CrossRef]
- Townley-Tilson, W.H.; Callis, T.E.; Wang, D. MicroRNAs 1, 133, and 206: Critical factors of skeletal and cardiac muscle development, function, and disease. Int. J. Biochem. Cell Biol. 2010, 42, 1252–1255. [Google Scholar] [CrossRef]
- Kojima, S.; Chiyomaru, T.; Kawakami, K.; Yoshino, H.; Enokida, H.; Nohata, N.; Fuse, M.; Ichikawa, T.; Naya, Y.; Nakagawa, M.; et al. Tumour suppressors miR-1 and miR-133a target the oncogenic function of purine nucleoside phosphorylase (PNP) in prostate cancer. Br. J. Cancer 2012, 106, 405–413. [Google Scholar] [CrossRef]
- Yamamoto, N.; Nishikawa, R.; Chiyomaru, T.; Goto, Y.; Fukumoto, I.; Usui, H.; Mitsuhashi, A.; Enokida, H.; Nakagawa, M.; Shozu, M.; et al. The tumor-suppressive microRNA-1/133a cluster targets PDE7A and inhibits cancer cell migration and invasion in endometrial cancer. Int. J. Oncol. 2015, 47, 325–334. [Google Scholar] [CrossRef]
- Kawakami, K.; Enokida, H.; Chiyomaru, T.; Tatarano, S.; Yoshino, H.; Kagara, I.; Gotanda, T.; Tachiwada, T.; Nishiyama, K.; Nohata, N.; et al. The functional significance of miR-1 and miR-133a in renal cell carcinoma. Eur. J. Cancer 2012, 48, 827–836. [Google Scholar] [CrossRef]
- Svitkina, T. The Actin Cytoskeleton and Actin-Based Motility. Cold Spring Harb. Perspect. Biol. 2018, 10, a018267. [Google Scholar] [CrossRef]
- Witke, W. The role of profilin complexes in cell motility and other cellular processes. Trends Cell Biol. 2004, 14, 461–469. [Google Scholar] [CrossRef]
- Cui, X.B.; Zhang, S.M.; Xu, Y.X.; Dang, H.W.; Liu, C.X.; Wang, L.H.; Yang, L.; Hu, J.M.; Liang, W.H.; Jiang, J.F.; et al. PFN2, a novel marker of unfavorable prognosis, is a potential therapeutic target involved in esophageal squamous cell carcinoma. J. Transl. Med. 2016, 14, 137. [Google Scholar] [CrossRef]
- Ling, Y.; Cao, Q.; Liu, Y.; Zhao, J.; Zhao, Y.; Li, K.; Chen, Z.; Du, X.; Huo, X.; Kang, H.; et al. Profilin 2 (PFN2) promotes the proliferation, migration, invasion and epithelial-to-mesenchymal transition of triple negative breast cancer cells. Breast Cancer 2021, 28, 368–378. [Google Scholar] [CrossRef]
- Tang, Y.N.; Ding, W.Q.; Guo, X.J.; Yuan, X.W.; Wang, D.M.; Song, J.G. Epigenetic regulation of Smad2 and Smad3 by profilin-2 promotes lung cancer growth and metastasis. Nat. Commun. 2015, 6, 8230. [Google Scholar] [CrossRef]
- Cao, Q.; Liu, Y.; Wu, Y.; Hu, C.; Sun, L.; Wang, J.; Li, C.; Guo, M.; Liu, X.; Lv, J.; et al. Profilin 2 promotes growth, metastasis, and angiogenesis of small cell lung cancer through cancer-derived exosomes. Aging 2020, 12, 25981–25999. [Google Scholar] [CrossRef]
- Katsuno, Y.; Lamouille, S.; Derynck, R. TGF-β signaling and epithelial-mesenchymal transition in cancer progression. Curr. Opin. Oncol. 2013, 25, 76–84. [Google Scholar] [CrossRef]
- Yan, J.; Ma, C.; Gao, Y. MicroRNA-30a-5p suppresses epithelial-mesenchymal transition by targeting profilin-2 in high invasive non-small cell lung cancer cell lines. Oncol. Rep. 2017, 37, 3146–3154. [Google Scholar] [CrossRef][Green Version]
- Jiang, M.; Qiu, N.; Xia, H.; Liang, H.; Li, H.; Ao, X. Long non-coding RNA FOXD2-AS1/miR-150-5p/PFN2 axis regulates breast cancer malignancy and tumorigenesis. Int. J. Oncol. 2019, 54, 1043–1052. [Google Scholar] [CrossRef]
- Zhao, Z.Y.; Zhao, Y.C.; Liu, W. Long non-coding RNA TUG1 regulates the progression and metastasis of osteosarcoma cells via miR-140-5p/PFN2 axis. Eur. Rev. Med. Pharmacol. Sci. 2019, 23, 9781–9792. [Google Scholar] [CrossRef]
- Ruan, P.; Tao, Z.; Tan, A. Low expression of miR-30a-5p induced the proliferation and invasion of oral cancer via promoting the expression of FAP. Biosci. Rep. 2018, 38, BSR20171027. [Google Scholar] [CrossRef]
- Kase-Kato, I.; Asai, S.; Minemura, C.; Tsuneizumi, K.; Oshima, S.; Koma, A.; Kasamatsu, A.; Hanazawa, T.; Uzawa, K.; Seki, N. Molecular Pathogenesis of the Coronin Family: CORO2A Facilitates Migration and Invasion Abilities in Oral Squamous Cell Carcinoma. Int. J. Mol. Sci. 2021, 22, 12684. [Google Scholar] [CrossRef]
- Koshizuka, K.; Hanazawa, T.; Kikkawa, N.; Katada, K.; Okato, A.; Arai, T.; Idichi, T.; Osako, Y.; Okamoto, Y.; Seki, N. Antitumor miR-150-5p and miR-150-3p inhibit cancer cell aggressiveness by targeting SPOCK1 in head and neck squamous cell carcinoma. Auris Nasus Larynx 2018, 45, 854–865. [Google Scholar] [CrossRef]


Publisher’s Note: MDPI stays neutral with regard to jurisdictional claims in published maps and institutional affiliations. |
© 2022 by the authors. Licensee MDPI, Basel, Switzerland. This article is an open access article distributed under the terms and conditions of the Creative Commons Attribution (CC BY) license (https://creativecommons.org/licenses/by/4.0/).