
Highly Sensitive and Quantitative Diagnosis of SARS-CoV-2 Using a Gold/Platinum Particle-Based Lateral Flow Assay and a Desktop Scanning Electron Microscope

 ,
, 
Abstract
:1. Introduction
2. Materials and Methods
2.1. Lateral Flow Strip Preparation
2.2. Preparation of Clinical Samples
2.3. Standard Solution of SARS-CoV-2 Nucleocapsid Protein Antigen
2.4. Method of Visual Detection for the Test Strip
2.5. Densitometry Detection Method for the Test Strip
2.6. Single-Step qRT-PCR for SARS-CoV-2
2.7. SEM Image Acquisition
2.8. Particle Counting
2.9. SEM Diagnosis and Statistics
3. Results
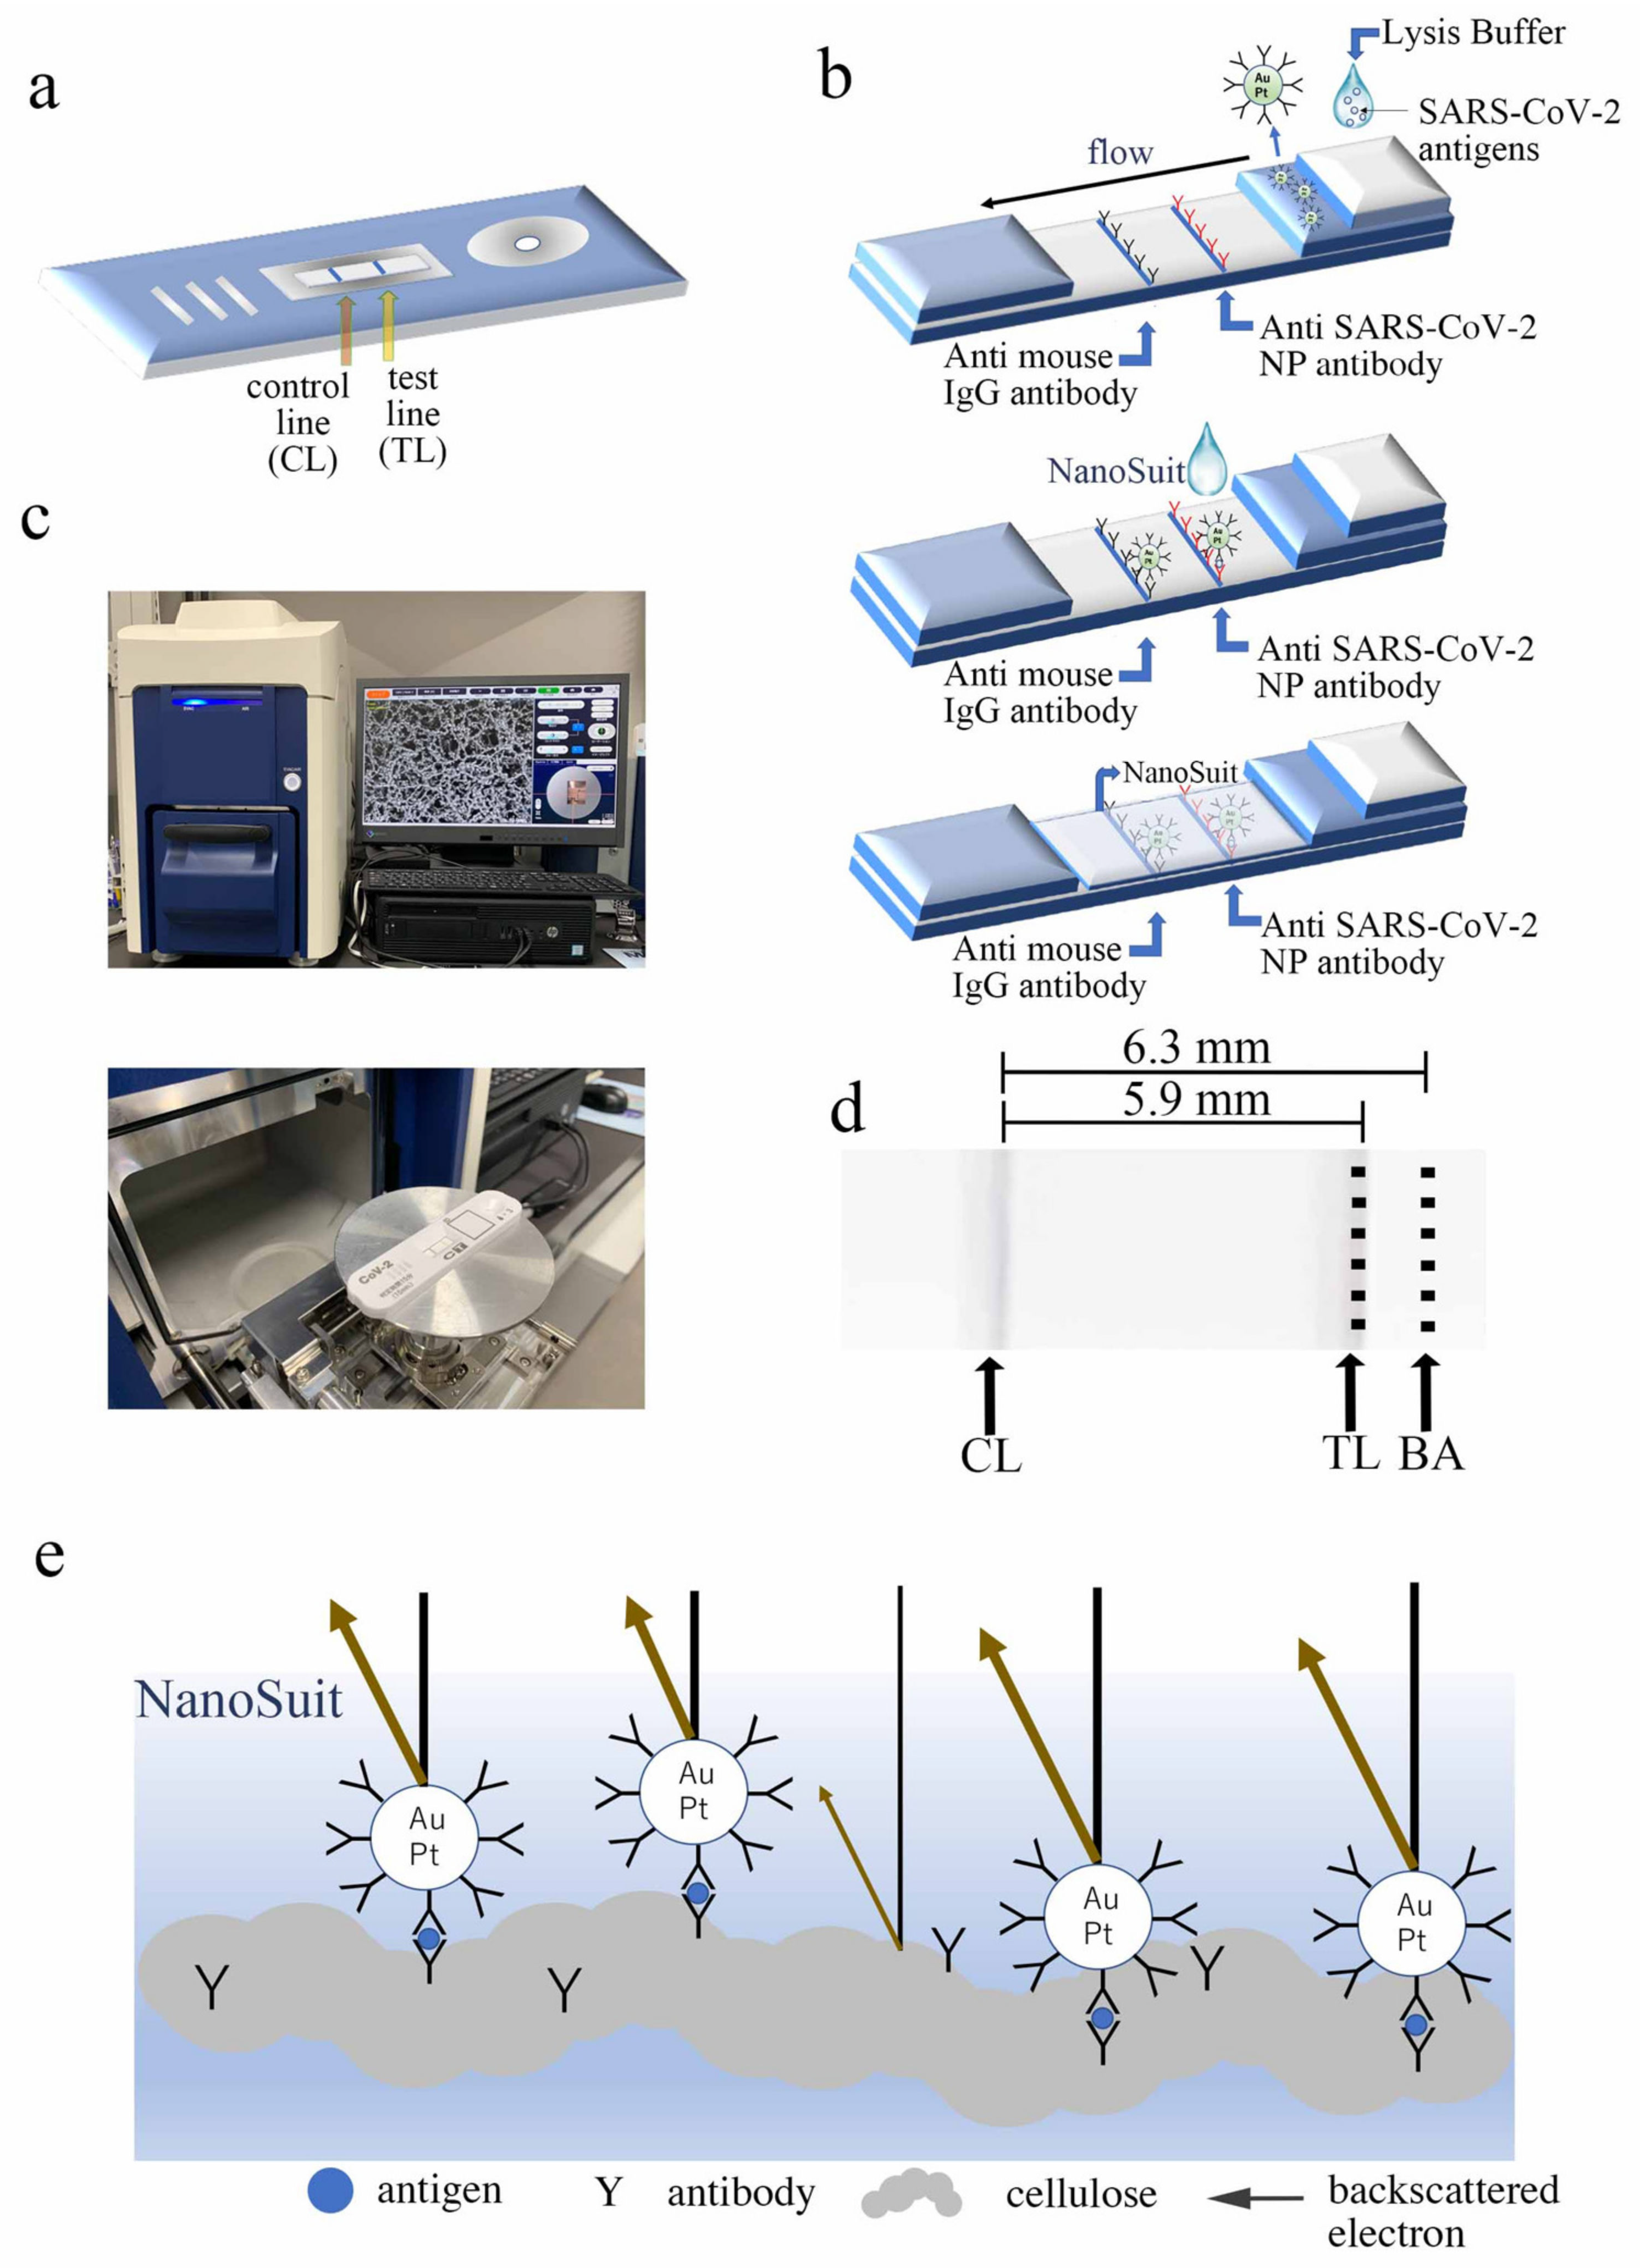
3.1. Lateral Flow Principle for Desktop SEM Detection
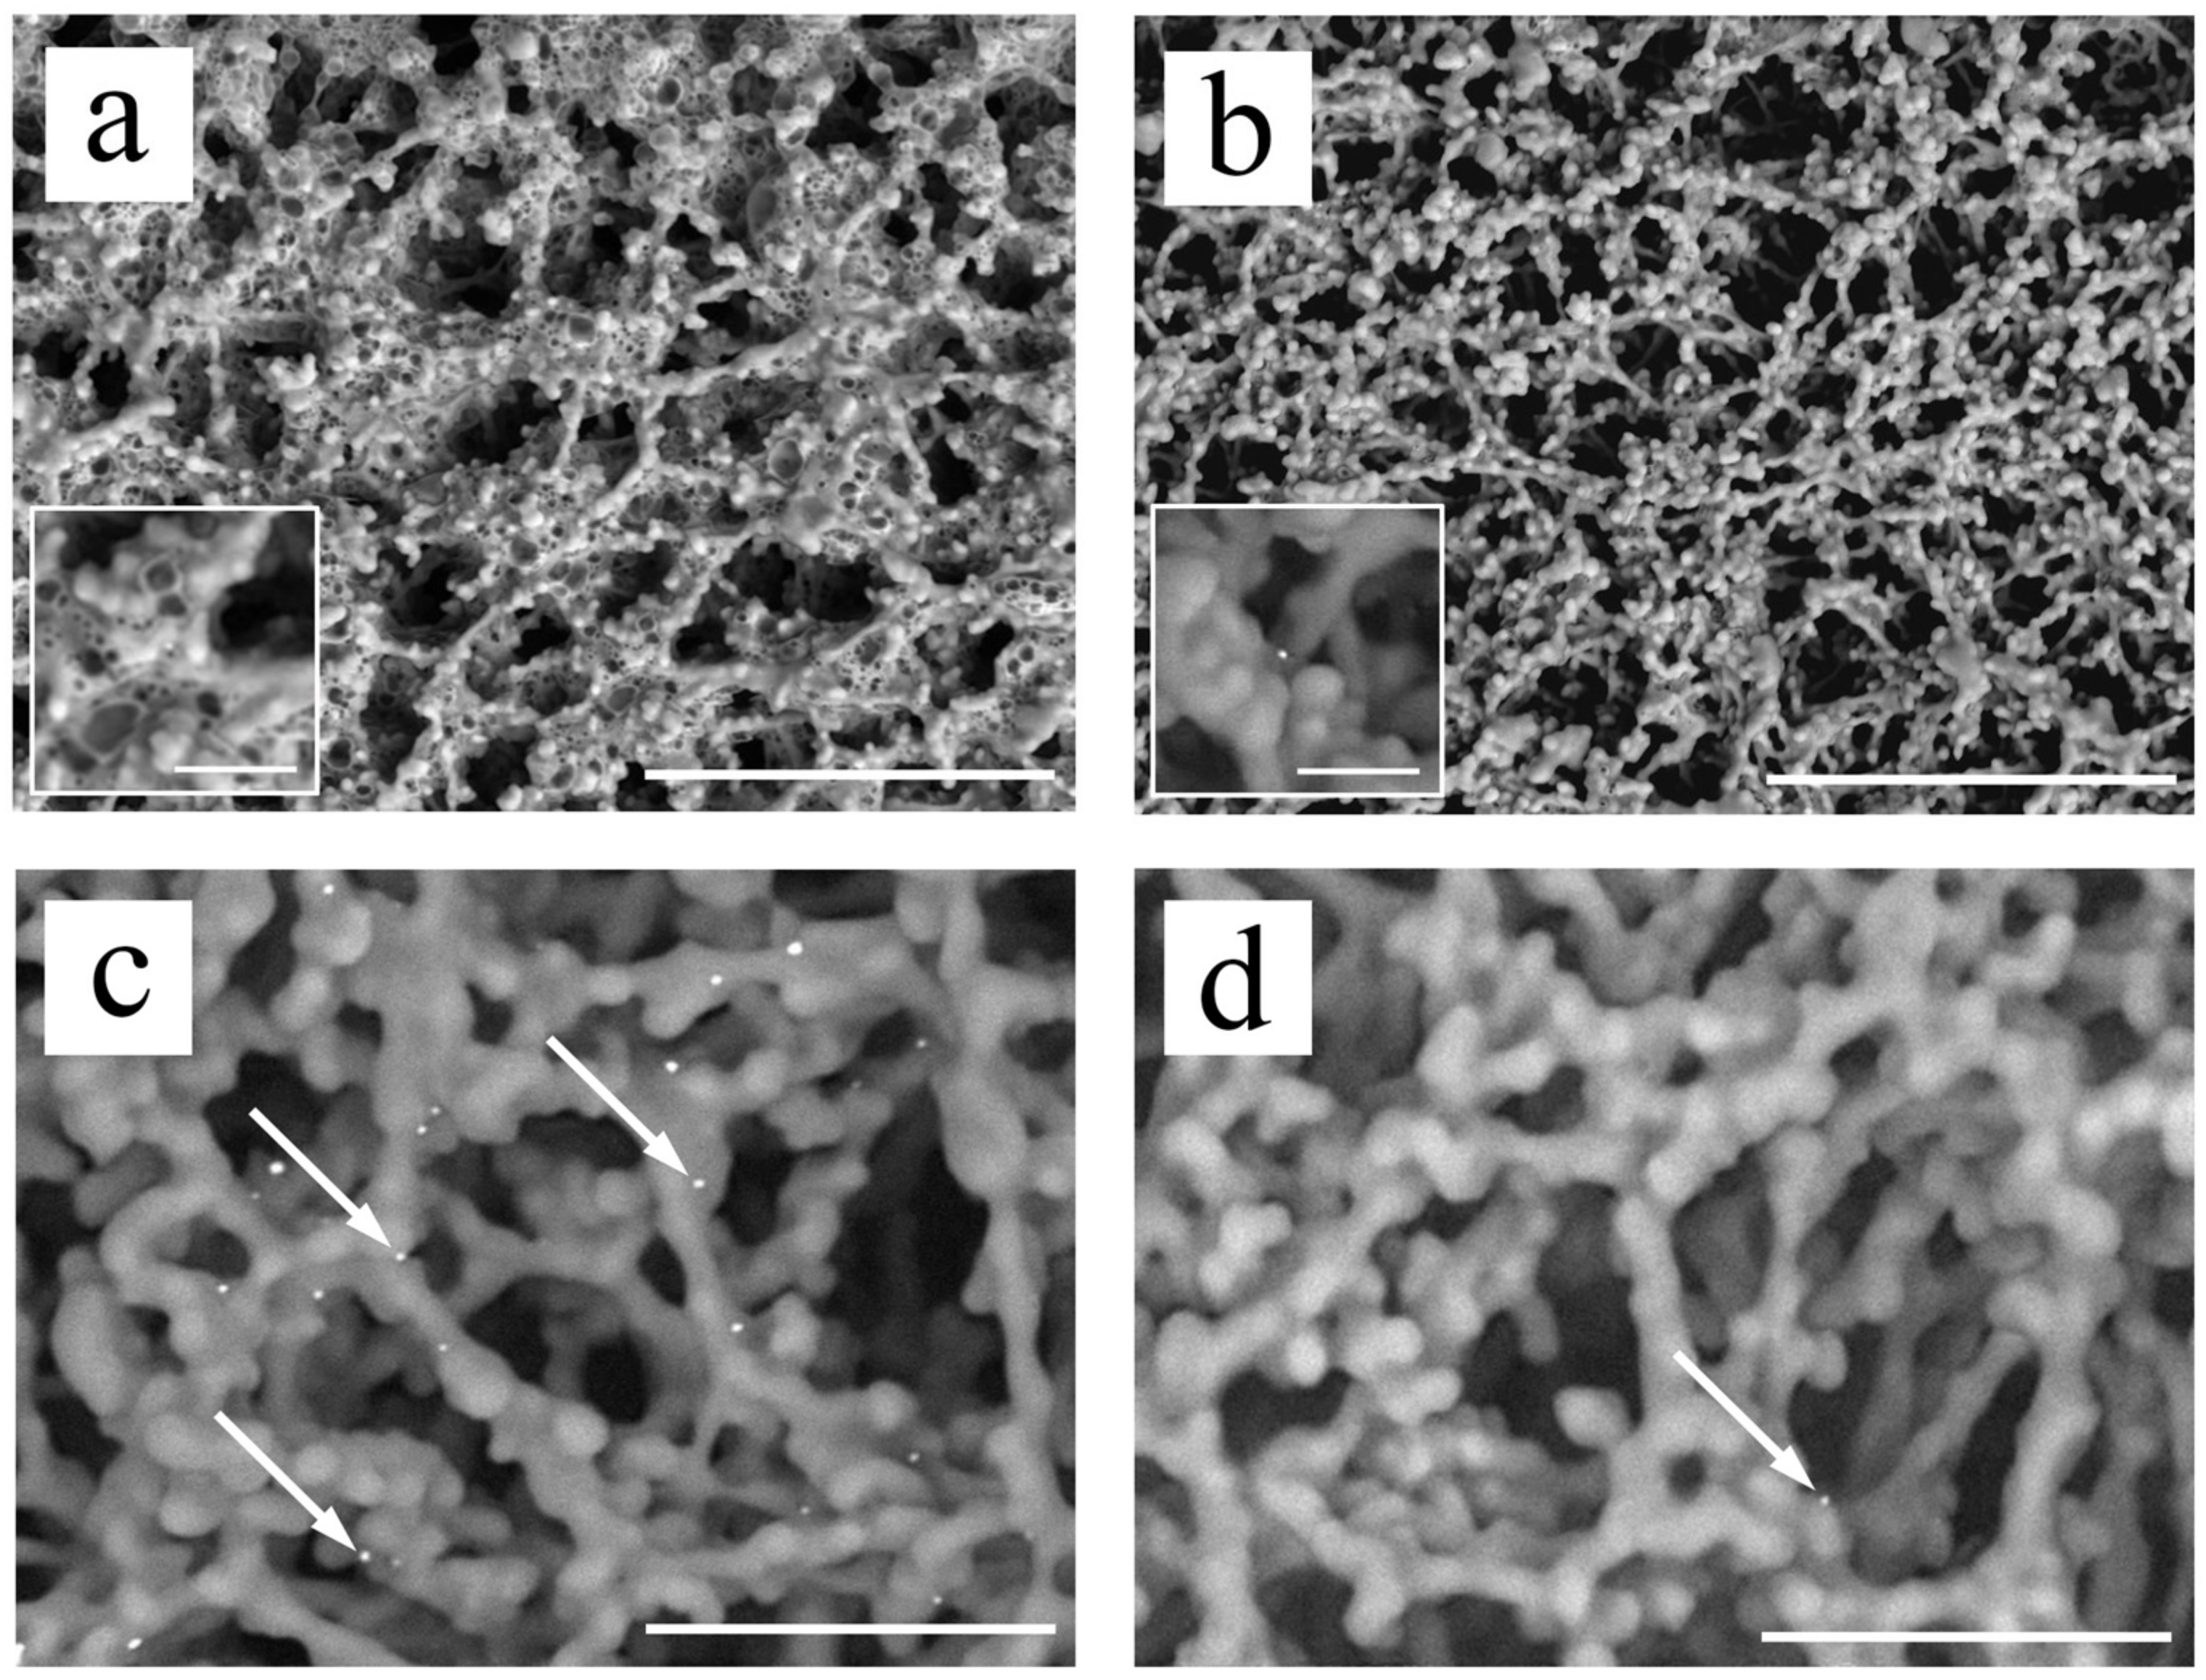
3.2. Observation of Au/Pt Particles following NanoSuit Treatment
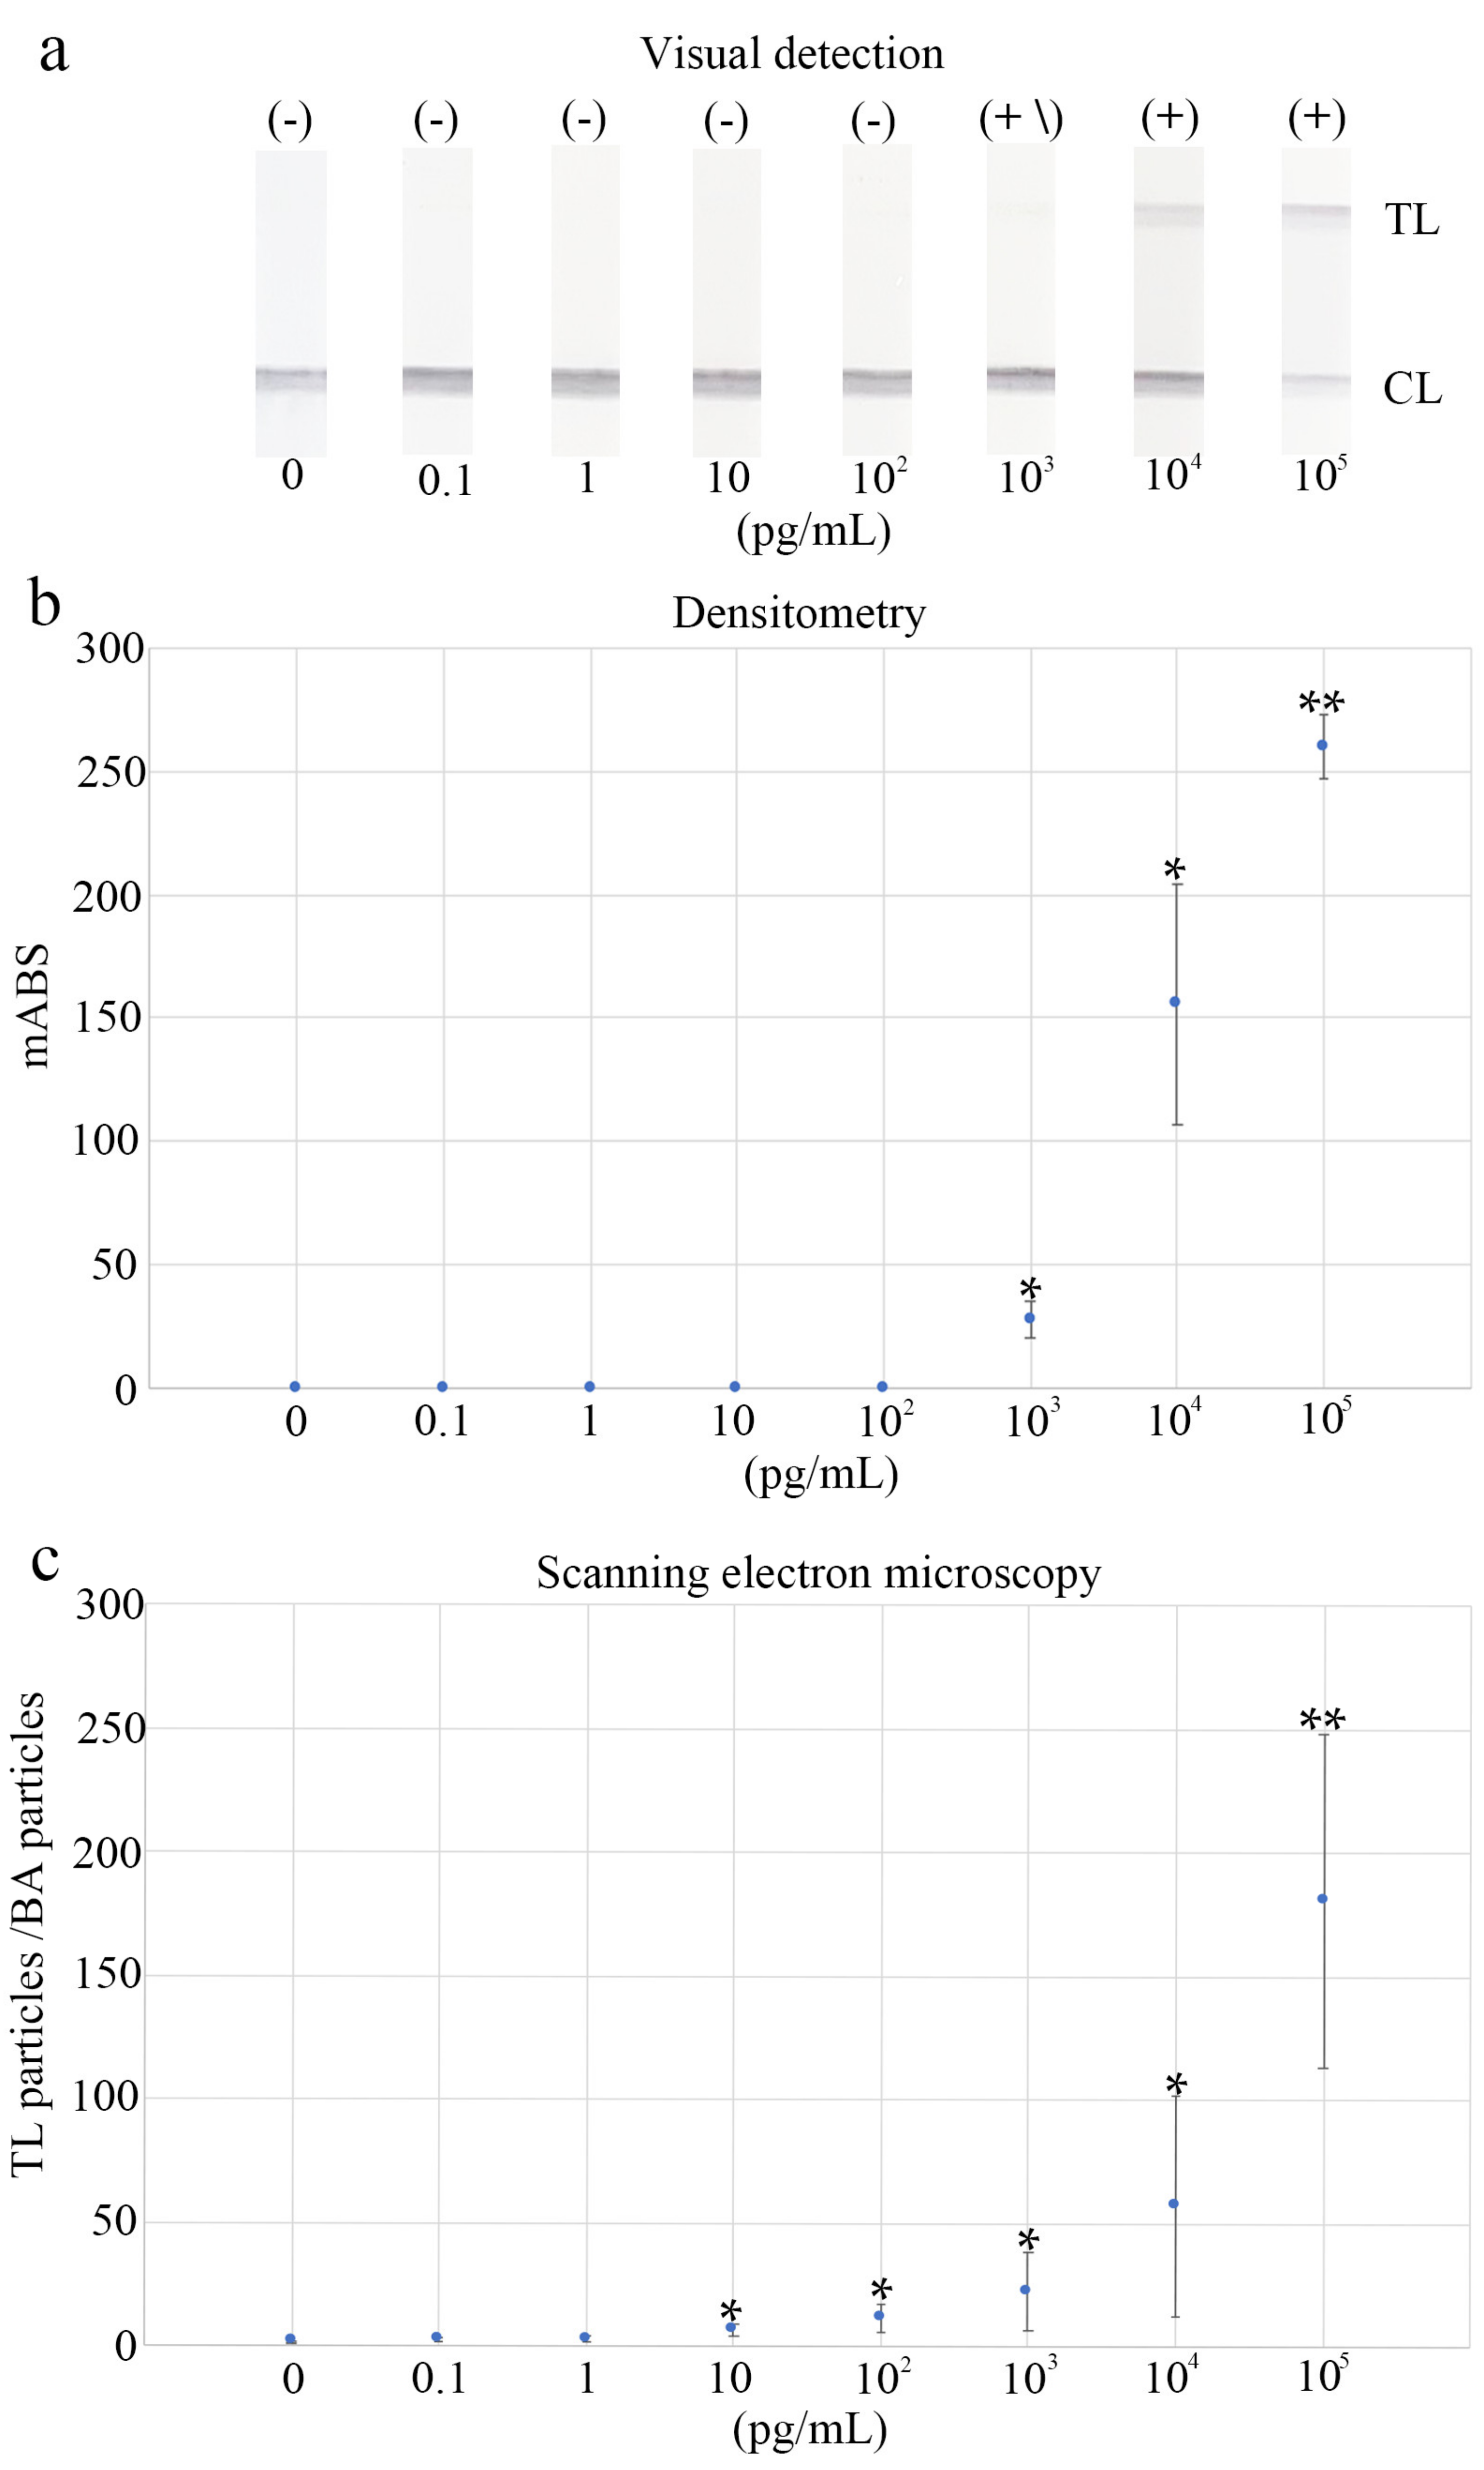
3.3. Determination of the Diagnostic Cut-Off Point
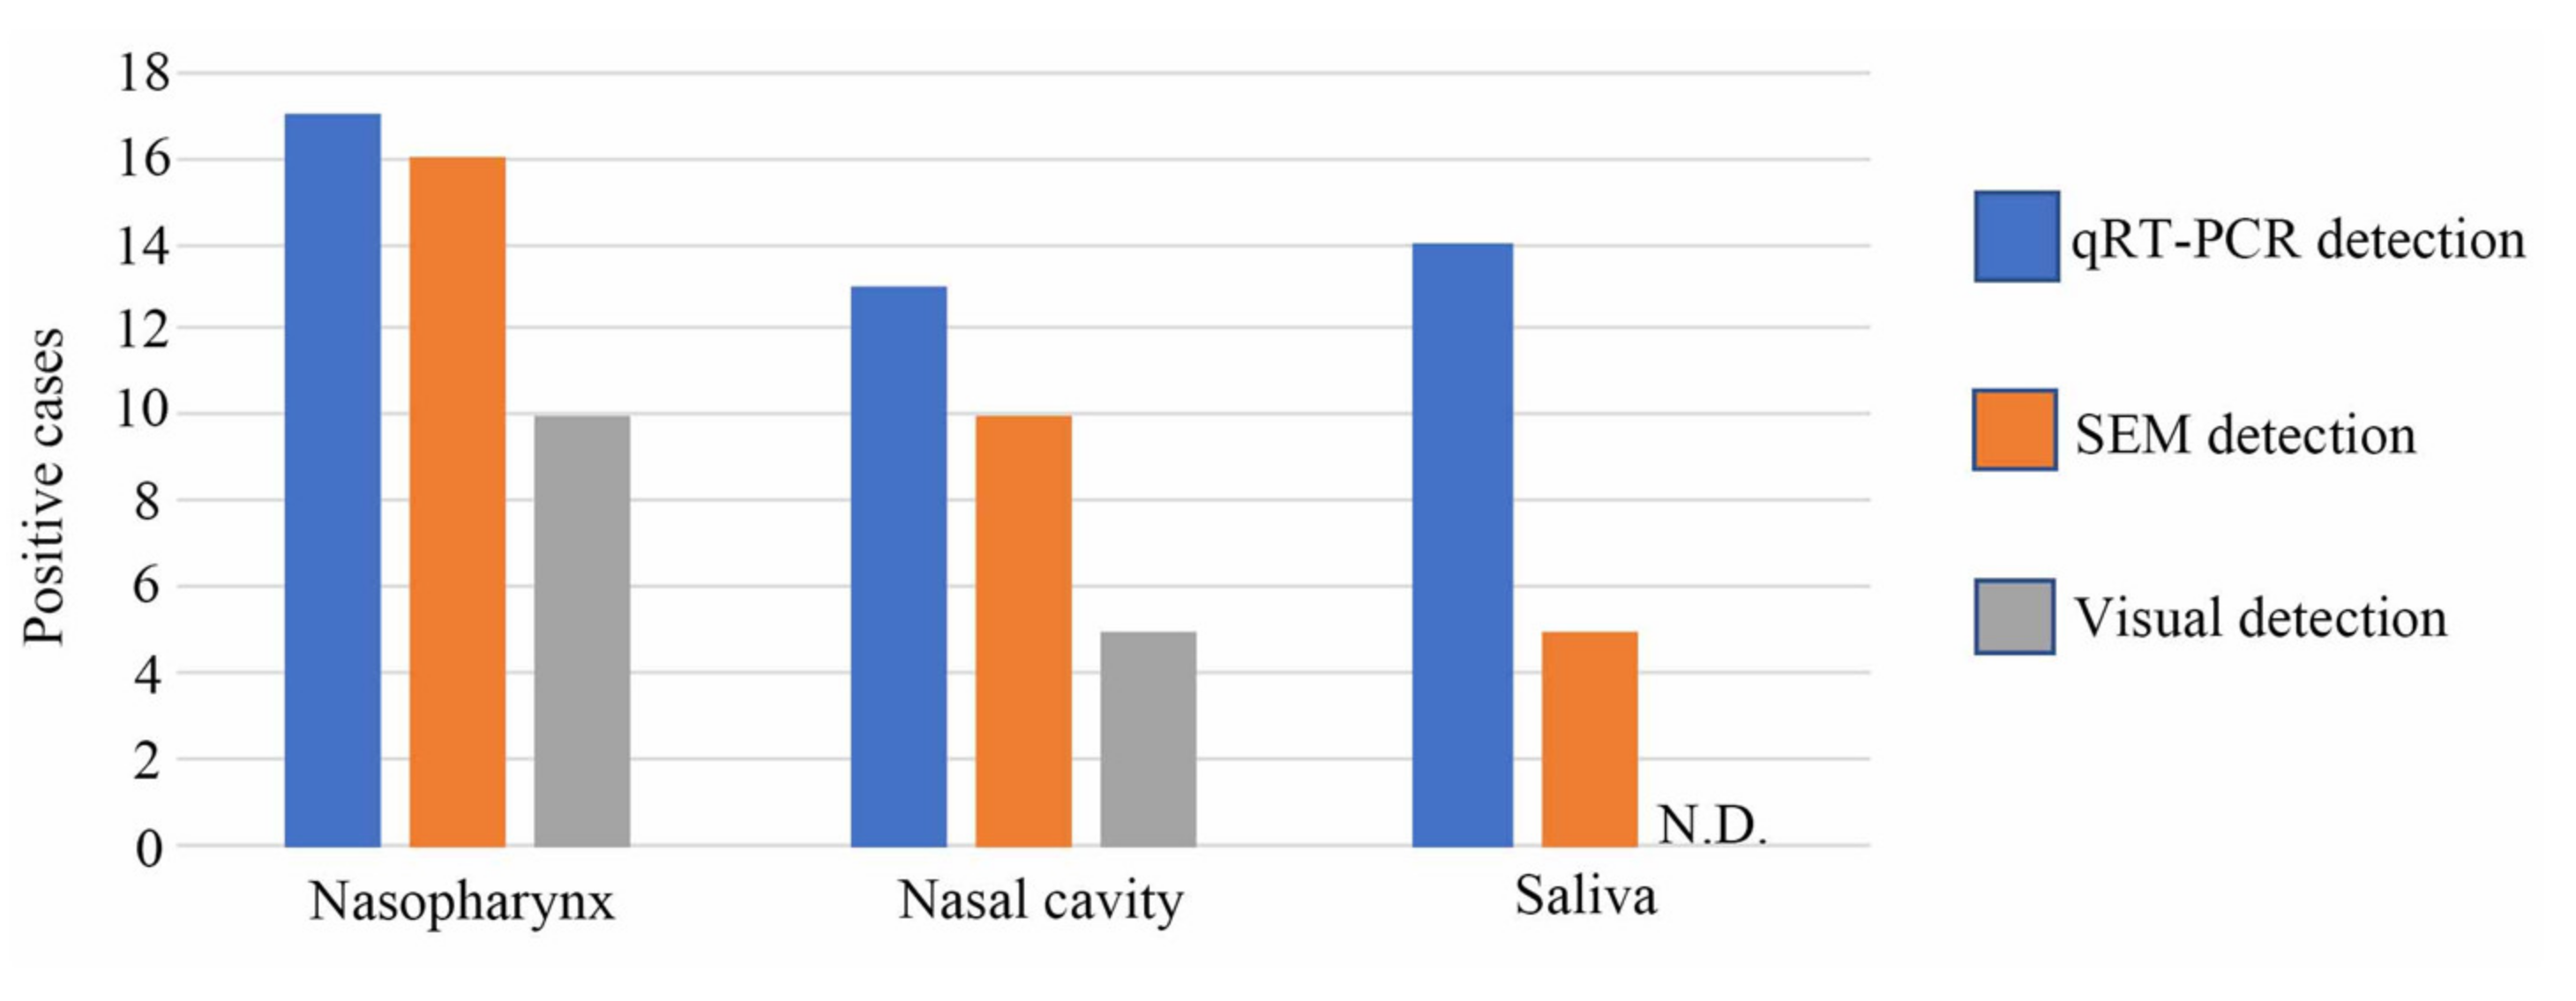
3.4. Visual, Scanning Electron Microscopy, and qRT-PCR Methods Compared in Terms of Clinical Diagnostic Sensitivity
4. Discussion
5. Conclusions
Supplementary Materials
Author Contributions
Funding
Institutional Review Board Statement
Informed Consent Statement
Data Availability Statement
Acknowledgments
Conflicts of Interest
References
- WHO. Director-General’s Opening Remarks at the Media Briefing on COVID19. March 2020. Available online: https://www.who.int/director-general/speeches/detail/who-director-general-s-opening-remarks-at-the-media-briefing-on-covid-19---11-march-2020 (accessed on 3 February 2022).
- World Health Organization (WHO). Coronavirus (COVID-19) Dashboard. Available online: https://covid19.who.int (accessed on 3 February 2022).
- Song, Q.; Sun, X.; Dai, Z.; Gao, Y.; Gong, X.; Zhou, B.; Wu, J.; Wen, W. Point-of-care testing detection methods for COVID-19. Lab. Chip 2021, 21, 1634–1660. [Google Scholar] [CrossRef] [PubMed]
- Merrick, B.; Noronha, M.; Batra, R.; Douthwaite, S.; Nebbia, G.; Snell, L.B.; Pickering, S.; Galao, R.P.; Whitfield, J.; Jahangeer, A.; et al. Real-world deployment of lateral flow SARS-CoV-2 antigen detection in the emergency department to provide rapid, accurate and safe diagnosis of COVID-19. Infect. Prev. Pract. 2021, 3, 100186. [Google Scholar] [CrossRef] [PubMed]
- Leber, W.; Lammel, O.; Siebenhofer, A.; Redlberger-Fritz, M.; Panovska-Griffiths, J.; Czypionka, T. Comparing the diagnostic accuracy of point-of-care lateral flow antigen testing for SARS-CoV-2 with RT-PCR in primary care (REAP-2). eClinicalMedicine 2021, 38, 101011. [Google Scholar] [CrossRef] [PubMed]
- Kawasaki, H.; Suzuki, H.; Maekawa, M.; Hariyama, T. Combination of the NanoSuit method and gold/platinum particle-based lateral flow assay for quantitative and highly sensitive diagnosis using a desktop scanning electron microscope. J. Pharm. Biomed. Anal. 2021, 196, 113924. [Google Scholar] [CrossRef] [PubMed]
- Kawasaki, H.; Itoh, T.; Takaku, Y.; Suzuki, H.; Kosugi, I.; Meguro, S.; Iwashita, T.; Hariyama, T. The NanoSuit Method: A novel histological approach for examining paraffin sections in a nondestructive manner by correlative light and electron microscopy. Lab. Investig. 2020, 100, 161–173. [Google Scholar] [CrossRef] [PubMed] [Green Version]
- Shinmura, K.; Kawasaki, H.; Baba, S.; Ohta, I.; Kato, H.; Yasuda, H.; Yamada, S.; Misawa, K.; Sugimoto, K.; Osawa, S.; et al. Utility of scanning electron microscopy elemental analysis using the “NanoSuit” correlative light and electron microscopy method in the diagnosis of lanthanum phosphate deposition in the esophagogastroduodenal mucosa. Diagnostics 2019, 10, 1. [Google Scholar] [CrossRef] [PubMed] [Green Version]
- Ooishi, M.; Yamada, S.; Itoh, T.; Meguro, S.; Yagi, H.; Kosugi, I.; Iwashita, T.; Shinmura, K.; Misawa, K.; Hariyama, T.; et al. Diagnosis of ion-exchange resin depositions in paraffin sections using corrective light and electron microscopy-NanoSuit method. Diagnostics 2021, 11, 193. [Google Scholar] [CrossRef] [PubMed]
- Nagashima, M.; Kumagai, R.; Yoshida, I.; Kawakami, M.; Nagano, M.; Asakura, H.; Kaku, E.; Kitamura, Y.; Hasegawa, M.; Hayashi, Y.; et al. Characteristics of SARS-CoV-2 isolated from asymptomatic carriers in Tokyo. Jpn. J. Infect. Dis. 2020, 73, 320–322. [Google Scholar] [CrossRef] [PubMed]
- O’Brien, J.; Hayder, H.; Peng, C. Automated quantification and analysis of cell counting procedures using ImageJ plugins. J. Vis. Exp. 2016, 117, 54719. [Google Scholar] [CrossRef] [PubMed]
- Little, T.A. Method validation essentials, limit of blank, limit of detection, and limit of quantitation. BioPharm Int. 2015, 28, 48–51. [Google Scholar]
- Sadeghi, P.; Sohrabi, H.; Hejazi, M.; Jahanban-Esfahlan, A.; Baradaran, B.; Tohidast, M.; Majidi, M.R.; Mokhtarzadeh, A.; Tavangar, S.M.; de la Guardia, M. Lateral flow assays (LFA) as an alternative medical diagnosis method for detection of virus species: The intertwine of nanotechnology with sensing strategies. Trends Analyt. Chem. 2021, 145, 116460. [Google Scholar] [CrossRef] [PubMed]
- La Scola, B.; Le Bideau, M.; Andreani, J.; Hoang, V.T.; Grimaldier, C.; Colson, P.; Gautret, P.; Raoult, D. Viral RNA load as determined by cell culture as a management tool for discharge of SARS-CoV-2 patients from infectious disease wards. Eur. J. Clin. Microbiol. Infect. Dis. 2020, 39, 1059–1061. [Google Scholar] [CrossRef] [PubMed]
- Bullard, J.; Dust, K.; Funk, D.; Strong, J.E.; Alexander, D.; Garnett, L.; Boodman, C.; Bello, A.; Hedley, A.; Schiffman, Z.; et al. Predicting infectious severe acute respiratory syndrome coronavirus 2 from diagnostic samples. Clin. Infect. Dis. 2020, 71, 2663–2666. [Google Scholar] [CrossRef] [PubMed]
- Singanayagam, A.; Patel, M.; Charlett, A.; Lopez Bernal, J.; Saliba, V.; Ellis, J.; Ladhani, S.; Zambon, M.; Gopal, R. Duration of infectiousness and correlation with RT-PCR cycle threshold values in cases of COVID-19, England, January to May 2020. Eurosurveillance 2020, 25, 2001483. [Google Scholar] [CrossRef] [PubMed]
- Gniazdowski, V.; Paul Morris, C.; Wohl, S.; Mehoke, T.; Ramakrishnan, S.; Thielen, P.; Powell, H.; Smith, B.; Armstrong, D.T.; Herrera, M.; et al. Repeated coronavirus disease 2019 molecular testing: Correlation of severe acute respiratory syndrome coronavirus 2 culture with molecular assays and cycle thresholds. Clin. Infect. Dis. 2021, 73, e860–e869. [Google Scholar] [CrossRef] [PubMed]
- Yamayoshi, S.; Sakai-Tagawa, Y.; Koga, M.; Akasaka, O.; Nakachi, I.; Koh, H.; Maeda, K.; Adachi, E.; Saito, M.; Nagai, H.; et al. Comparison of rapid antigen tests for COVID-19. Viruses 2020, 12, 1420. [Google Scholar] [CrossRef] [PubMed]
- Yang, Q.; Saldi, T.K.; Gonzales, P.K.; Lasda, E.; Decker, C.J.; Tat, K.L.; Fink, M.R.; Hager, C.R.; Davis, J.C.; Ozeroff, C.D.; et al. Just 2% of SARS-CoV-2-positive individuals carry 90% of the virus circulating in communities. Proc. Natl Acad. Sci. USA 2021, 118. [Google Scholar] [CrossRef] [PubMed]
- Mina, M.J.; Parker, R.; Larremore, D.B. Rethinking Covid-19 test sensitivity—A strategy for containment. N. Engl. J. Med. 2020, 383, e120. [Google Scholar] [CrossRef] [PubMed]
- Brümmer, L.E.; Katzenschlager, S.; Gaeddert, M.; Erdmann, C.; Schmitz, S.; Bota, M.; Grilli, M.; Larmann, J.; Weigand, M.A.; Pollock, N.R.; et al. Accuracy of novel antigen rapid diagnostics for SARS-CoV-2: A living systematic review and meta-analysis. PLOS Med. 2021, 18, e1003735. [Google Scholar] [CrossRef] [PubMed]


| Patient No. | Age | Sex (M/F) | Collection Day after Onset | Diagnosis | Symptom(s) | Alive/Dead |
|---|---|---|---|---|---|---|
| 1 | 46 | F | 8 | COVID-19 | fever, muscle pain, headache | alive |
| 2 | 58 | M | 37 | COVID-19 | fever, sore throat, cough | alive |
| 3 | 55 | F | 13 | COVID-19 | sore throat | alive |
| 4 | 38 | M | 11 | COVID-19 | fever | alive |
| 5 | 45 | F | - | Non-COVID-19 | fever | alive |
| 6 | 51 | M | 8 | COVID-19 | fever | alive |
| 7 | 40 | M | 7 | COVID-19 | sore throat | alive |
| 8 | 18 | F | 5 | COVID-19 | suffocation | alive |
| 9 | 65 | M | 24 | COVID-19 | no symptoms | alive |
| 10 | 51 | M | 13 | COVID-19 | cough, chills, nasal discharge, sputum, malaise, smell disorder, dysgeusia | alive |
| 11 | 48 | M | 11 | COVID-19 | fever | alive |
| 12 | 46 | M | 11 | COVID-19 | sore throat | alive |
| 13 | 47 | M | - | Non-COVID-19 | no symptoms | alive |
| 14 | 43 | F | - | Non-COVID-19 | sore throat, diarrhea | alive |
| 15 | 20 | M | 9 | COVID-19 | fever, nasal discharge, sputum, smell disorder, dysgeusia | alive |
| 16 | 37 | F | - | Non-COVID-19 | cough, sputum | alive |
| 17 | 65 | M | 5 | COVID-19 | fever | alive |
| 18 | 60 | F | - | Non-COVID-19 | no symptoms | alive |
| 19 | 57 | M | 7 | COVID-19 | fever, headache | alive |
| 20 | 25 | M | 8 | COVID-19 | fever, cough | alive |
| 21 | 61 | F | 9 | COVID-19 | sore throat, joint pain, headache | alive |
| 22 | 76 | M | 8 | COVID-19 | fever, sore throat | alive |
| 23 | 61 | M | - | Non-COVID-19 | fever | alive |
| 24 | 56 | M | - | Non-COVID-19 | fever | alive |
| 25 | 90 | F | 43 | COVID-19 | fever | alive |
| 26 | 75 | F | - | Non-COVID-19 | cough, fever | alive |
| 27 | 34 | M | - | Non-COVID-19 | fever | alive |
| 28 | 69 | M | - | Non-COVID-19 | fever | alive |
| 29 | 55 | M | - | Non-COVID-19 | vomiting, fever | alive |
| 30 | 52 | F | - | Non-COVID-19 | fever | alive |
| 31 | 75 | M | 1 | COVID-19 | dyspnea | dead |
| 32 | 74 | M | 10 | COVID-19 | fever | alive |
| 33 | 28 | M | 9 | COVID-19 | cough, fever, sore throat | alive |
| 34 | 45 | M | 7 | COVID-19 | headache, loose stool | alive |
| 35 | 77 | M | 2 | COVID-19 | fever | alive |
| 36 | 82 | F | 12 | COVID-19 | dyspnea | dead |
| 37 | 66 | M | 14 | COVID-19 | dyspnea | alive |
| 38 | 66 | M | 33 | COVID-19 | dyspnea | alive |
| 39 | 66 | M | 37 | COVID-19 | dyspnea | alive |
| 40 | 47 | M | - | Non-COVID-19 | malaise | alive |
| 41 | 56 | M | - | Non-COVID-19 | fever, dyspnea | alive |
| 42 | 43 | M | 19 | COVID-19 | fever | alive |
| 43 | 48 | M | - | Non-COVID-19 | fever | alive |
| 44 | 70 | M | 13 | COVID-19 | fever, diarrhea | alive |
| 45 | 72 | M | 20 | COVID-19 | Fever | alive |
| Clinical Diagnosis Performance of SEM Detection Method | |||||
|---|---|---|---|---|---|
| SARS-CoV-2 rRT-PCR | Ct | Visual Detection | SEM Detection | ||
| Sensitivity | Specificity | Sensitivity | Specificity | ||
| Positive (n = 30) | 10.0 < Ct ≤ 15.0 | 100% (1/1) | 100% (1/1) | ||
| 15.0 < Ct ≤ 20.0 | 100% (1/1) | 100% (1/1) | |||
| 20.0 < Ct ≤ 25.0 | 87.5% (7/8) | 100% (8/8) | |||
| 25.0 < Ct ≤ 30.0 | 80% (4/5) | 100% (5/5) | |||
| 30.0 < Ct ≤ 35.0 | 0% (0/8) | 87.5% (7/8) | |||
| 35.0 < Ct ≤ 40.0 | 0% (0/7) | 57.1% (4/7) | |||
| 10.0 < Ct ≤ 40.0 | 43.3% (13/30) | 86.7% (26/30) | |||
| Negative (n = 15) | Ct > 40 | 100% (15/15) | 93.3% (14/15) | ||
| Visual Detection a | SEM Detection a | ||||||
|---|---|---|---|---|---|---|---|
| Positive | Negative | Row Marginal | Positive | Negative | Row Marginal | ||
| SARS-CoV-2 qRT-PCR | Positive | 13 | 17 | 30 | 26 | 4 | 30 |
| Negative | 0 | 15 | 15 | 1 | 14 | 15 | |
| Column Marginal | 13 | 32 | 45 | 28 | 18 | 45 | |
| Agreement (kappa Coef. b) | 0.622 (13 + 15)/45 | 0.889 (26 + 14)/45 | |||||
Publisher’s Note: MDPI stays neutral with regard to jurisdictional claims in published maps and institutional affiliations. |
© 2022 by the authors. Licensee MDPI, Basel, Switzerland. This article is an open access article distributed under the terms and conditions of the Creative Commons Attribution (CC BY) license (https://creativecommons.org/licenses/by/4.0/).
Share and Cite
Kawasaki, H.; Suzuki, H.; Furuhashi, K.; Yamashita, K.; Ishikawa, J.; Nagura, O.; Maekawa, M.; Miwa, T.; Tandou, T.; Hariyama, T. Highly Sensitive and Quantitative Diagnosis of SARS-CoV-2 Using a Gold/Platinum Particle-Based Lateral Flow Assay and a Desktop Scanning Electron Microscope. Biomedicines 2022, 10, 447. https://doi.org/10.3390/biomedicines10020447
Kawasaki H, Suzuki H, Furuhashi K, Yamashita K, Ishikawa J, Nagura O, Maekawa M, Miwa T, Tandou T, Hariyama T. Highly Sensitive and Quantitative Diagnosis of SARS-CoV-2 Using a Gold/Platinum Particle-Based Lateral Flow Assay and a Desktop Scanning Electron Microscope. Biomedicines. 2022; 10(2):447. https://doi.org/10.3390/biomedicines10020447
Chicago/Turabian StyleKawasaki, Hideya, Hiromi Suzuki, Kazuki Furuhashi, Keita Yamashita, Jinko Ishikawa, Osanori Nagura, Masato Maekawa, Takafumi Miwa, Takumi Tandou, and Takahiko Hariyama. 2022. "Highly Sensitive and Quantitative Diagnosis of SARS-CoV-2 Using a Gold/Platinum Particle-Based Lateral Flow Assay and a Desktop Scanning Electron Microscope" Biomedicines 10, no. 2: 447. https://doi.org/10.3390/biomedicines10020447
APA StyleKawasaki, H., Suzuki, H., Furuhashi, K., Yamashita, K., Ishikawa, J., Nagura, O., Maekawa, M., Miwa, T., Tandou, T., & Hariyama, T. (2022). Highly Sensitive and Quantitative Diagnosis of SARS-CoV-2 Using a Gold/Platinum Particle-Based Lateral Flow Assay and a Desktop Scanning Electron Microscope. Biomedicines, 10(2), 447. https://doi.org/10.3390/biomedicines10020447